Article

An Adaptive Control Model for Thermal Environmental Factors to Supplement the Sustainability of a Small-Sized Factory

Major in Architectural Engineering, School of Architecture and Design Convergence, Hankyong National University, Anseong-si 17579, Republic of Korea
Sustainability 2023, 15(24), 16619; https://doi.org/10.3390/su152416619
Submission received: 12 October 2023 / Revised: 16 November 2023 / Accepted: 4 December 2023 / Published: 6 December 2023

Abstract

:
Effective indoor thermal controls can have quantifiable advantages of improving energy efficiency and indoor environmental quality, which can also lead to additional benefits such as better workability, productivity, and economy in buildings. However, in the case of factory buildings whose main usage is to produce and process goods, securing thermal comfort for their workers has been regarded as a secondary problem. This study aims to explore the method for cooling and heating air supply controls to improve the thermal comfort of factory buildings by use of a data-driven adaptive model. The genetic algorithm using the idea of occupancy rate helps the model to effectively analyze the indoor environment to determine the optimized conditions for energy use and thermal comfort. As a result, the proposed model successfully shows better performance, which confirms that there is a 2.81% saving in energy consumption and a 16–32% reduction in indoor thermal dissatisfaction. In particular, the significance of this study is that energy use and thermal dissatisfaction can be reduced simultaneously despite precise air-supply controls that are performed in response to the conditions of the building, weather, and occupancy rate.

1. Thermal Controls in Buildings

The indoor thermal control system in buildings has become quite advanced in response to the scientific trend of increasing the control precision and complexity for various conditions within buildings. Such as Proportional Integral Derivative (PID), Fuzzy System (FS), Artificial Neural Networks (ANN), Genetic Algorithm (GA), and machine learning methods, several algorithms have been used to increase the efficiency of system controls and statistical validation in experiments. In addition, the algorithms are continuously adjusted and optimized to suit the characteristics of buildings such as site, size, type of use, and various mechanical components [1,2,3]. The fuzzy system has provided an effective solution in ambiguous decision models that include difficult problems to solve in the conventional ways or rules. In particular, it presents a more effective solution in a model in which a particular situation, such as indoor thermal comfort, is difficult to define as a single value or definition (i.e., good, quite good, or very good) [4,5]. As large amounts of data are continuously accumulated, models that analyze existing data trends and predict results have been widely used in addition to models that execute decision making when specific values are input. The main goal of these models is to create precise regression models by learning huge amounts of existing data, and they are being used in various fields as the performance of computing and calculating hardware improves rapidly. In particular, they are effectively utilized in the field of providing real-time optimized values or parameters by analyzing the sensing results at very short intervals of indoor temperature or humidity [6,7,8].
These precise indoor environment control methods are not studied simply to reduce energy use or to save costs. In recent years, the improvement of indoor thermal comfort is one of the most frequently mentioned research topics in thermal controls. Both qualitative and quantitative methods have been used to evaluate indoor comfort levels. For improving the validation of the methods, the analysis of actual responses from users’ questionnaires is frequently used. However, this method is relatively subjective in various situations reflecting human factors and parameters, and it is difficult to collect enough data to obtain statistical validity [9,10,11]. Therefore, several studies have continued to express indoor thermal comfort in accurate figures by developing various thermal indicators. The Predicted Mean Vote (PMV) is regarded as the most widely used indicator due to the high precision of the internal structure and the analytic intuitiveness of the results. For a more simple comparison, the Predicted Percentage Dissatisfied (PPD) displaying the result value as a percentage is also frequently used. These two indicators are particularly used in simulation-based studies that need to test various indoor environment conditions and situations by several assumptions [12,13]. Using the interrelationships between the thermal factors, several control rules for building thermal systems are developed from regression models to find new optimized rules or structures that improve performance. Several studies have shown the possibility of a model that improves efficiency for both thermal comfort and energy use, despite such precise control, and there are many studies that test a model’s performance in actual buildings [14,15]. In addition, some studies dealing with various factors of occupant behavior by using simulation scenarios have been confirmed. The control strategies mainly dealt with maintaining thermal comfort above a certain level even in abnormal or non-predictive environmental situations. The studies mainly addressed sub-systems to help main thermal system to minimize inefficiency for such abnormal situations [16,17].
In 2013, Korea’s electricity use was 474.8 billion kWh, compared to 547.9 billion kWh in 2022, 10 years later, which is an increase of about 15% from 2013. On the other hand, in 2022, 54% of total electricity usage was for industrial use, 23% was for general use, and 15% was for residential use. This implies a fact that electricity is still widely used in industries taking the form of importing raw materials and processing industrial products [18,19]. In particular, this has often been observed in developing countries that have not yet reached the industrial structure of developed countries. Due to the needs of these industries, compared to housing and general commercial facilities, the unit price of electricity (118.66 KRW/kWh vs. 121.32 KRW/kWh) is low, which is one of the causes of more than three times the electricity sales in industrial buildings, which are 1/20th of the number of buildings for all residential purposes [18,19]. Therefore, efforts to increase the energy-use efficiency of various industrial buildings are being attempted in various areas, including the building operations and maintenance sectors. In addition, the Commercial Buildings Energy Consumption Survey (CBECS) report has been widely utilized to compare the Energy Use Intensity (EUI) of several types of buildings. Common commercial buildings are categorized by the report as office; retail; food service; food sales; education; health; lodging; public assembly; public order and safety; service; religious worship; storage; warehouse; other; and vacant [20,21]. This confirms that there is no clear energy-use standard for industrial buildings, especially factories, corresponding to manufacturing and production. Therefore, the energy-use patterns of existing or newly built factories depend heavily on production machinery, equipment, and capacity, and the energy consumed to maintain the indoor environment for workers in factories can be easily ignored. In addition, the labor industry in Korea is now aging more rapidly than before, and there is a trend to replace insufficient labor with low-wage foreigners [22]. Therefore, additional studies reflecting this trend should be conducted in the area of indoor thermal control. However, recent factory-related studies rarely dealt with building spaces to provide better places to work, but most of them focused on the efficiency of loading and moving materials and goods in manufacturing systems [23,24,25,26]. Many examples of production processes and operational data have also begun to be utilized in that type of study, so simulation studies utilizing the ideas of artificial neural networks and machine learning are being conducted to effectively deal with them. In particular, the workspace and environment of workers who are easy to overlook in automation systems should be studied at the same time [27,28].
Despite various studies to improve the performance of thermal systems, there are very few studies that consider both energy use and indoor thermal comfort in relation to the thermal systems of factory buildings. Therefore, it is imperative to develop an adaptive control algorithm to build an optimized indoor environment suitable for the specific use of a building. This study aims to develop heating and cooling air supply control models that enhance the quality of the spatial environment in a small-sized factory. However, in order to mitigate the increase in energy consumption that can be caused by such precise control processes, an adaptive model adopting a genetic algorithm was developed to effectively change the amount of air supply in response to the occupancy rate of workers. The Section 3 and Section 4 analyze the quantitative strengths and weaknesses of the proposed simulation model, and the Section 5 identifies the technical significance and limitations of the model for follow-up studies.

2. Simulation Framework

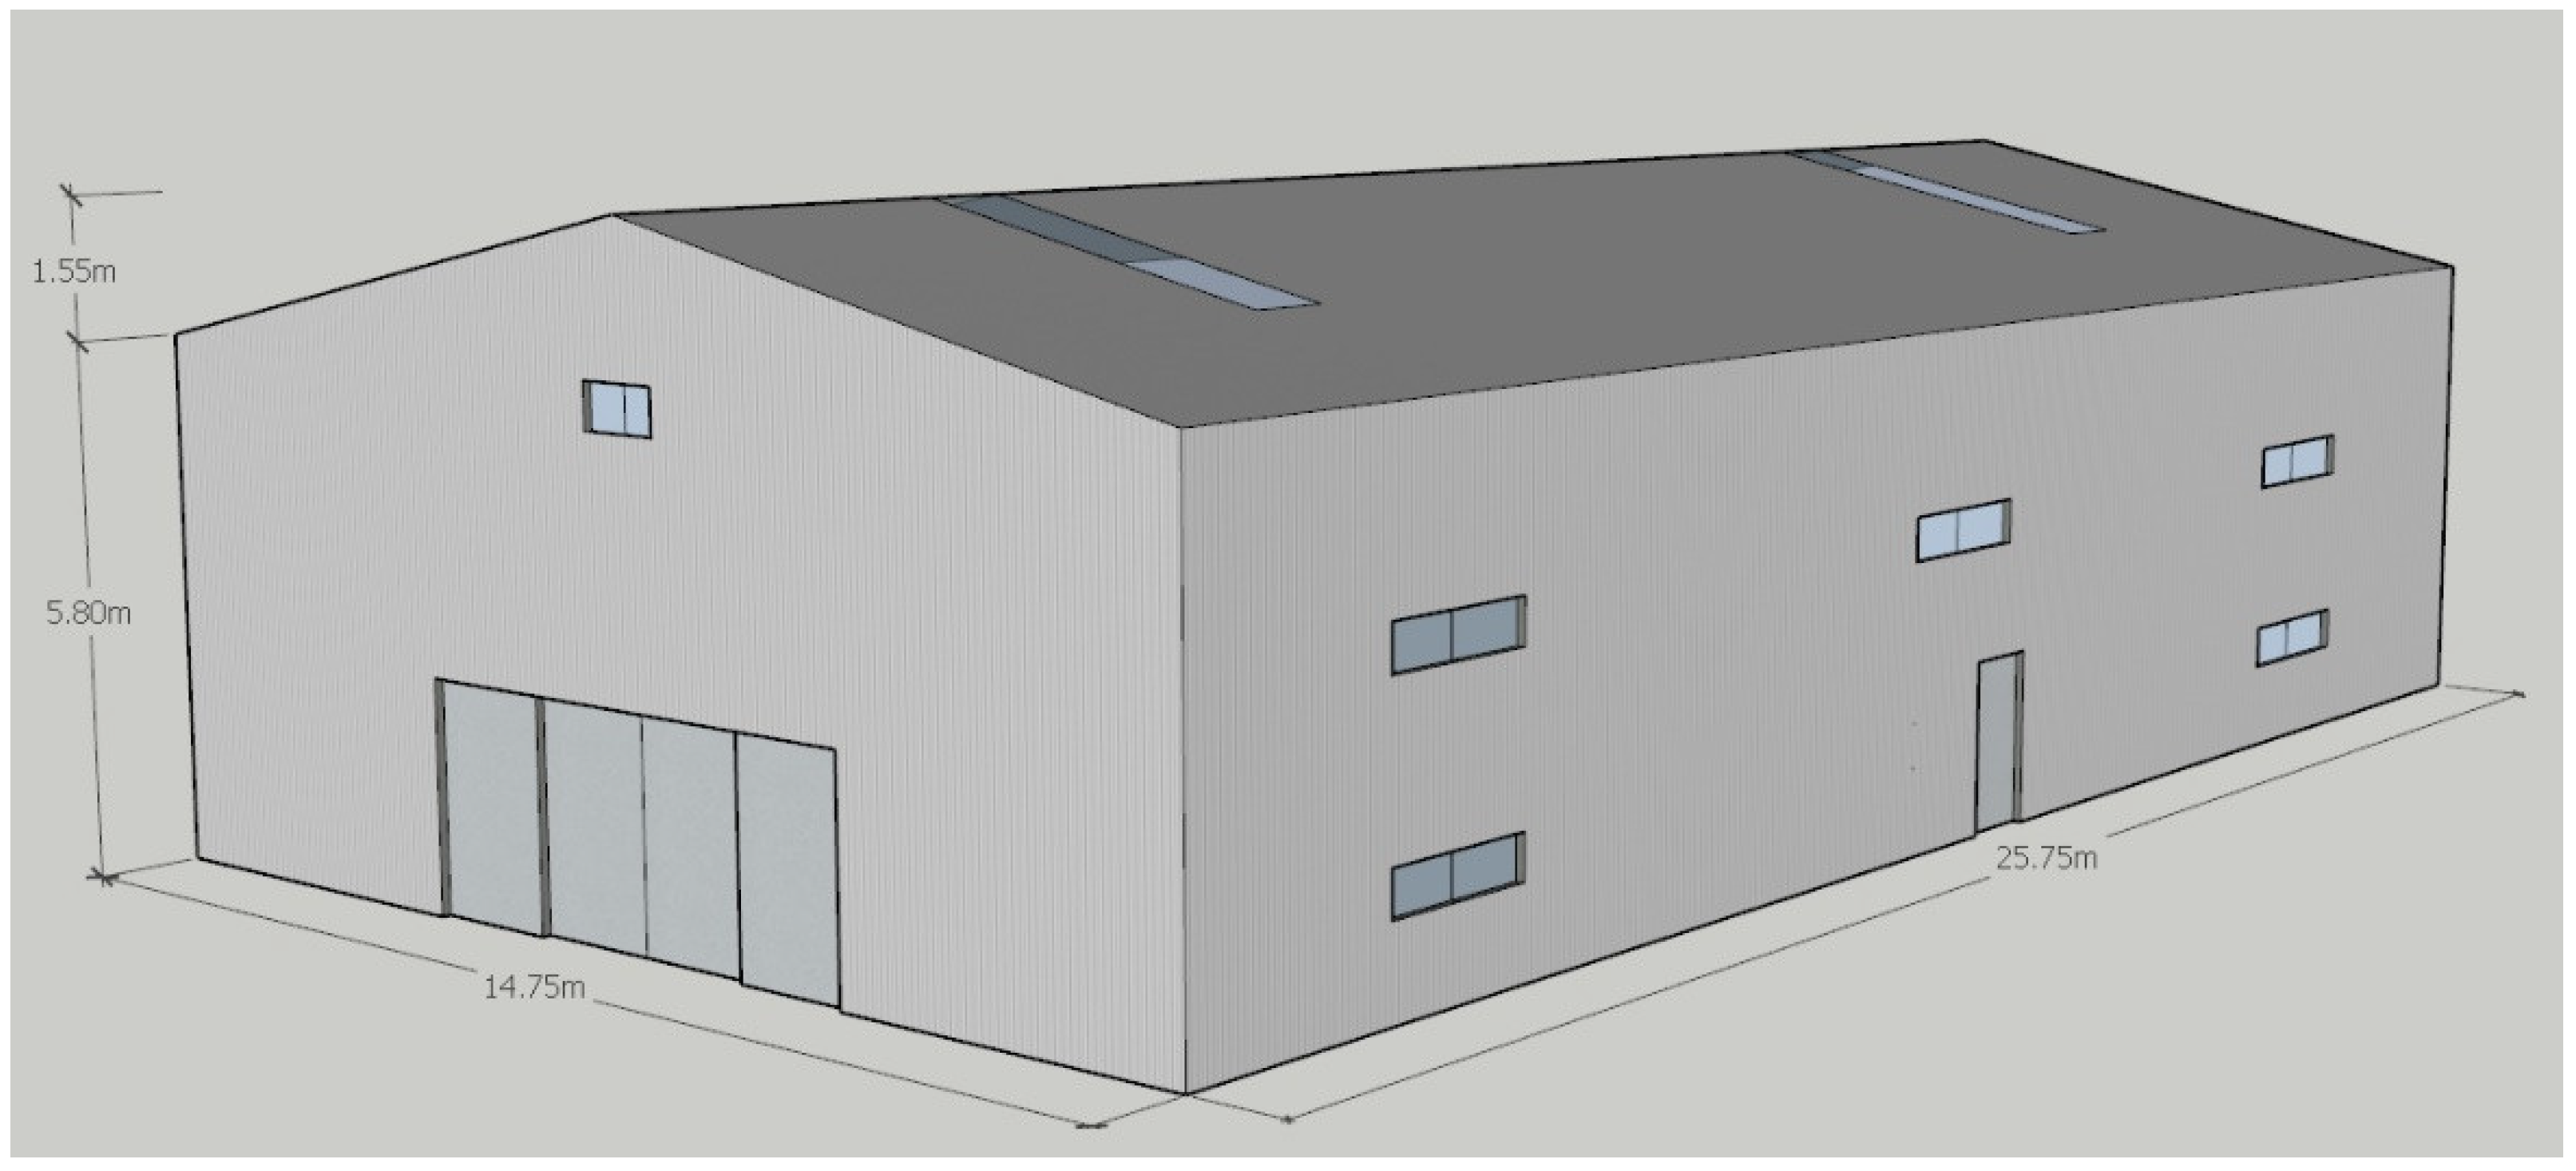
2.1. Geometries, Parameters, and Functions

In this quantitative study, a schematic simulation model of a small-sized factory was developed using computing applications based on the architectural information of four small-sized factory buildings in the Incheon area, a port city close to Seoul, Korea. In the factory building modeling, the construction manual for walls, floors, roofs, and openings published by ASHRAE was referenced. The heating- and/or cooling-air-supply model adopted a model that measures the amount of energy transfer per hour through heat exchange in the building envelope [29,30]. The factory building was planned in Incheon, and, for the simulation, the weather file for Incheon in South Korea from the EnergyPlus reference was used for the temperature and humidity input for the simulation. Figure 1 shows the temperature of the outside air in Incheon from 00:00 on 15 July to 24:00 on 14 August converted from the EnergyPlus and Climate Consultant applications. As can be seen in the graph, there was a period when the average temperature dropped suddenly around 20 July; the temperature continued to drop slowly after the 26th, and the average temperature rose again from August 4. In addition, it can be seen that the daily temperature difference changed from 3 to 5 °C to over 10 °C. These changes in average daily temperature and daily temperature difference can have negative effects on the indoor environmental conditions of factory buildings. Figure 2 shows the schematic design of the small-sized factory, and Table 1 indicates its major geometric information. The building inside consisted of four spaces: a main working space and an office on the second floor; a service room and a restroom on the first floor.

2.2. Thermal and Comfort Rules

Using the numerical information of a small-sized factory, the model performed its calculation process to obtain heating and cooling energy-transfer values. Since the heat gain and loss were obtained through heat exchange at the envelope of a factory building, the total internal energy change by time is given as follows [31]:
Q l o s s + Q g a i n = d U d t
where Q l o s s is the heat loss through building envelopes; Q g a i n is the heat gain from the system; t is the time; and U is the total internal energy.
Through the building envelopes, the heat conduction transfer, and the heat loss of the factory building, Q l o s s , is given by
Q l o s s = ( T r m T o u t ) / 1 ( h o u t A ) + D ( k A ) + 1 ( h i n A )
where T r m is the temperature of the room; T o u t is the temperature of the outside area; h o u t is the heat transfer coefficient outside; h i n is the heat transfer coefficient inside; k is the transmission coefficient; A is the surface area; a n d   D is the depth or thickness of materials.
Using the mass flow-rate, the enthalpy, and one assumption that this system does not work externally, the heat gain transfer, Q g a i n , is written as [31]
Q g a i n = h t c p ( T h t T r m )
where h t is the mass flow-rate from the thermal system and c p is the specific heat capacity at a constant pressure.
The rate of internal energy is written as
d U d t = m r m c v d T r m d t
where m r m   is the mass flow-rate into the room and c v is the specific heat capacity at a constant volume.
Next, the time derivative of Trm is given by
d T r m d t = 1 m r m c v T r m T o u t 1 / ( h o u t A ) + D / ( k A ) + 1 / ( h o u t A ) + h t c p T h t T r m
For the precise numbers, the PMV index was adopted to quantitatively calculate precise values for comfort level, and, at the same time, the PPD function is given by the PMV result [32]:
P M V = 3.155 0.303 e 0.114 M + 0.028 L
P P D = 100 95 e ( 0.03353 P M V 4 0.2179 P M V 2 )
where M is the metabolic rate and L is the thermal load.
L = q m e t ,   h e a t f c l h c T c l T a f c l h r T c l T r 156 W s k ,   r e q W a 0.42 q m e t ,   h e a t 18.43 0.00077 M 93.2 T a 2.78 M ( 0.0365 W a )
where q m e t , h e a t is the heat loss of the metabolic process; f c l is the ratio of clothed surface area to DuBois surface; h c is the convection heat transfer coefficient; T c l is the mean surface temperature of a clothed body; T a is the temperature of air; h r is the radiative heat transfer coefficient; T r is the mean radiant temperature; W a is the ratio of air humidity; W s k is the ratio of saturated humidity of the skin temperature; and M is the metabolic rate.
The PMV index includes some thermal factors to calculate M and L, such as the respiratory convective heat exchange; the clothing insulation; the ratio of clothed surface area; the mean surface temperature of the clothed body; the air speed; and the ratio of saturated humidity [32,33]. The performance of a proposed control system and a commercial thermostat system was graphically and numerically compared. Typically, the PMV level was set from −0.5 to 0.5, and this was converted to a PPD level under 10% as a comfort level. However, since factory buildings use a variety of machines as a heat source and their doors are often open, it may be difficult to apply them to general conditions of thermal comfort. In order to perform this simulation process, the numerical information of the factory building and the thermal system configuration were chosen from the template of the EnergyPlus applications. Using the modeling data and weather data, the MATLAB application performed its real-time simulation.

2.3. Adaptive Process

The thermostat system was used as a base-line model with a dead-band setting. For example, if the difference between Tset and Trm was bigger than 1 °C, the thermostat turned on for the cooling process or turned off for the heating process. By using seven different weather files as seven different climate zones, over 30 EnergyPlus simulation results were obtained, and by using these results, the initial ANN model was trained. For the internal structure, as a conventional rule, a large class of several structures consisted of one ANN system. Conditional selecting functions of non-linear mapping are required to define a specific network process [34,35,36]. The ANN algorithm function consisted of two layers for input values, a single layer for an output value, and, between the input and output layers, 10 hidden layers. Then, inputs x1, … xk for the neuron were multiplied by weights wki and summed up with the constant bias term θi, and the resulting ni was the input for the activation function g [37,38]. An algorithm of scaled conjugate gradient was utilized, and the simulations at 1 epoch was set to be performed up to 1000 times. By using a whole-year simulation for each climate zone, the average statistical validation was confirmed. R2 of the simulation for the air mass was 0.991019 and R2 for the air temperature was 0.982013, respectively. In addition, this study proposed an adaptive model by use of the genetic algorithm. The control rule built by the genetic algorithm app in the MATLAB reference was described in Figure 3 using a flow diagram. This process utilized a general approach to the genetic algorithm principle. The occupancy ratio of the actual users to the total number of users was calculated and standardized as a random number in the range of 0 to 1, and this value was repeatedly input into the fitness function so that MATLAB’s GA model calculated the optimized point of the final population. Then it determined whether this result exceeded a specific value (in this case, the value of the indoor occupancy rate was determined as not a normal working situation), and it maintained or changed the conditions for supplying heating or cooling air in the time step [39,40,41].

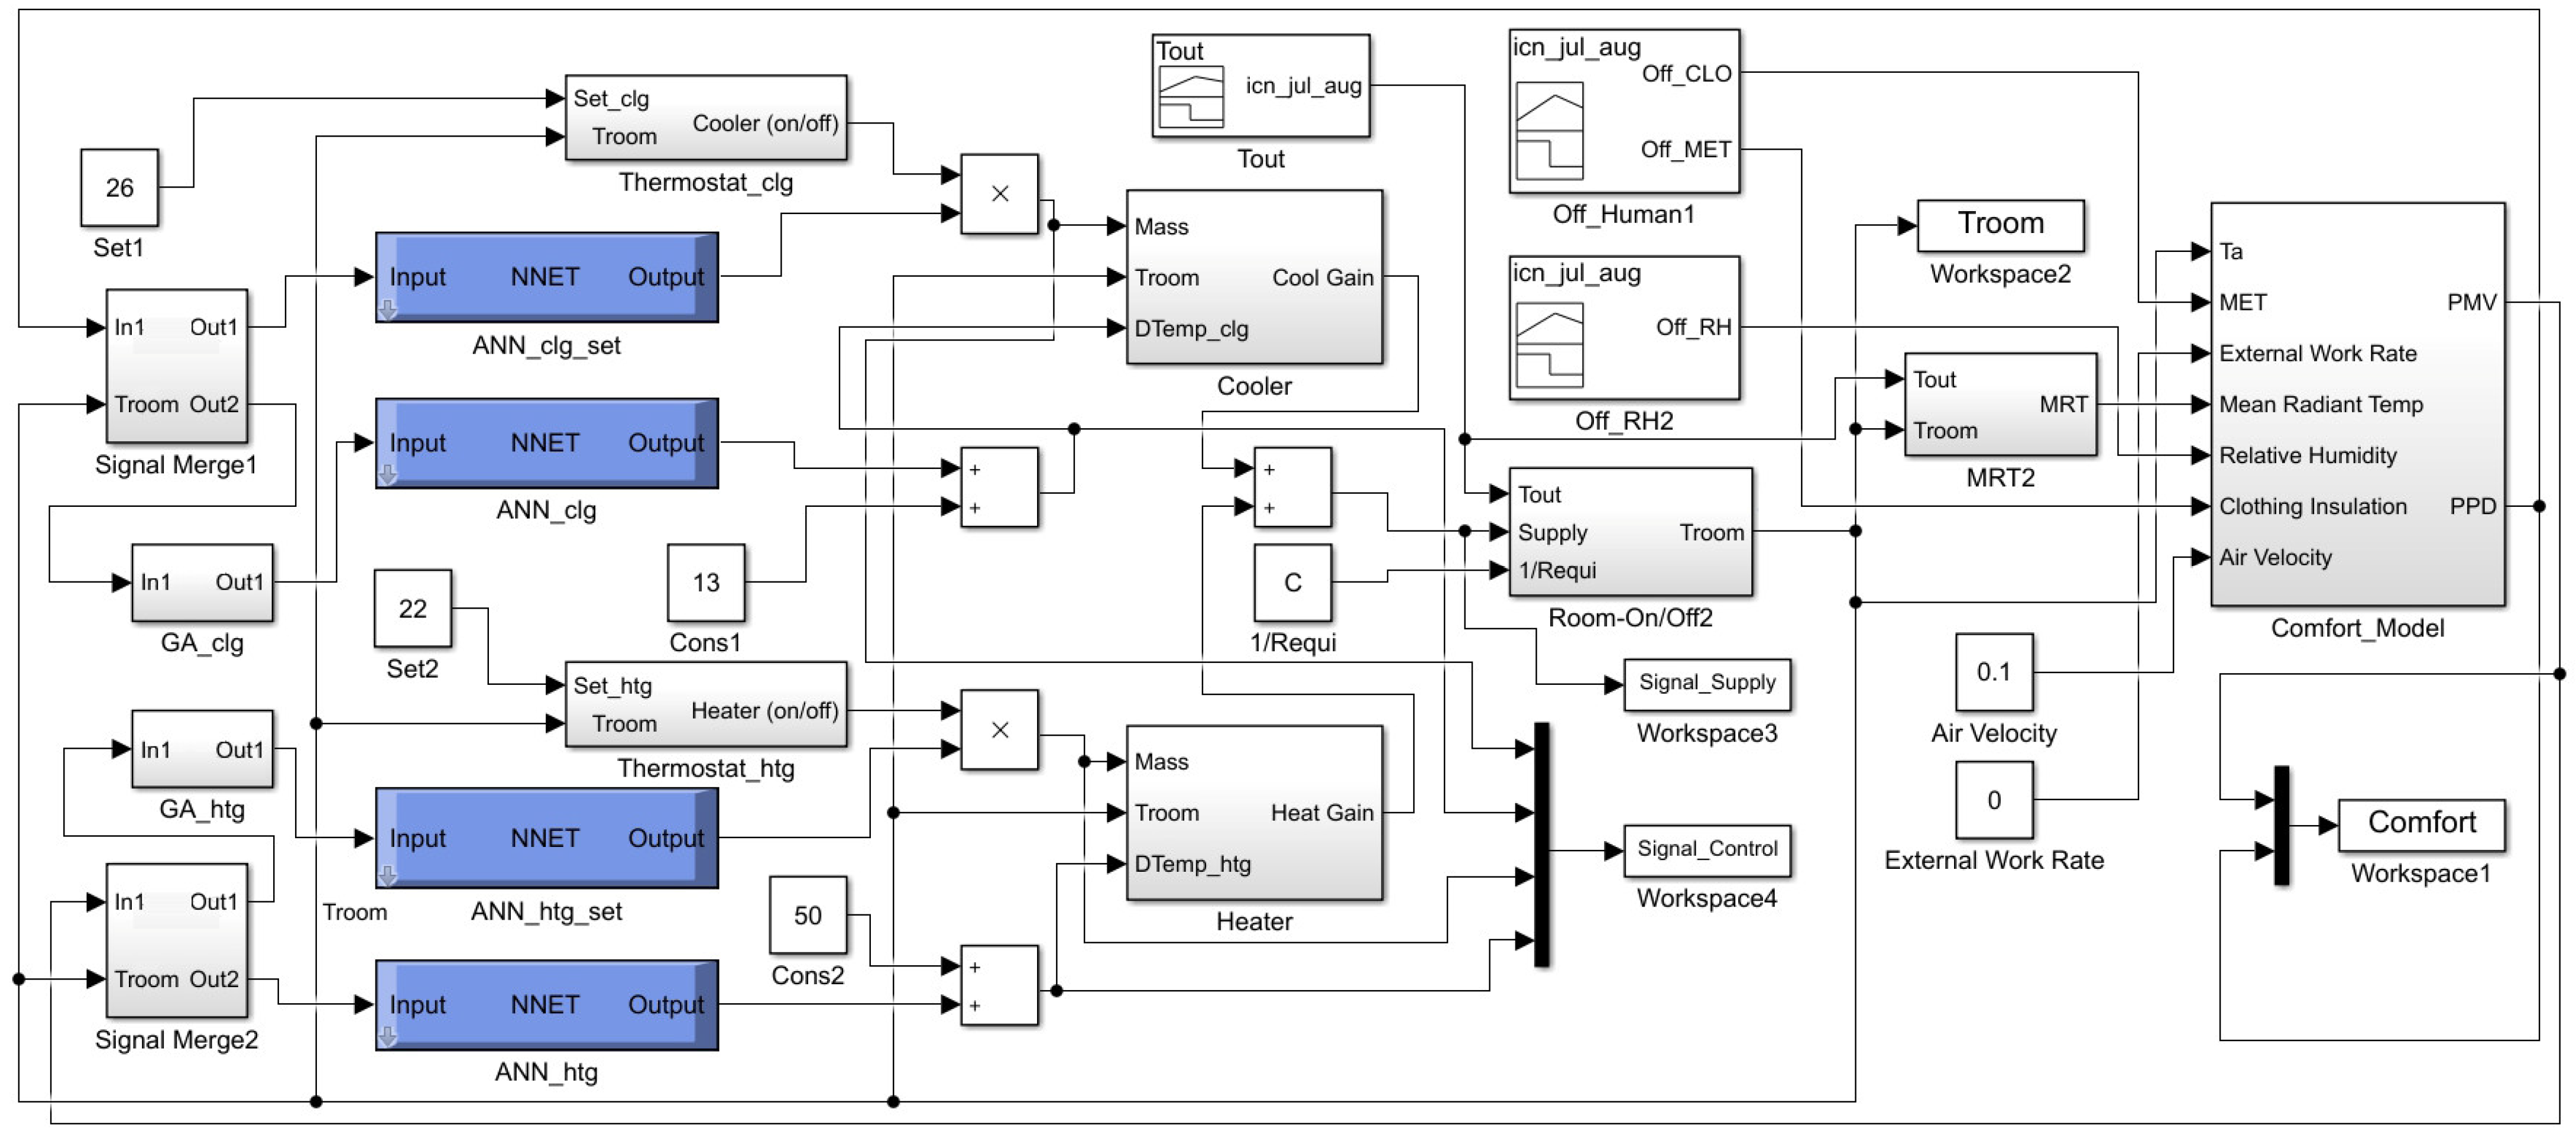
2.4. Simulation Block Model
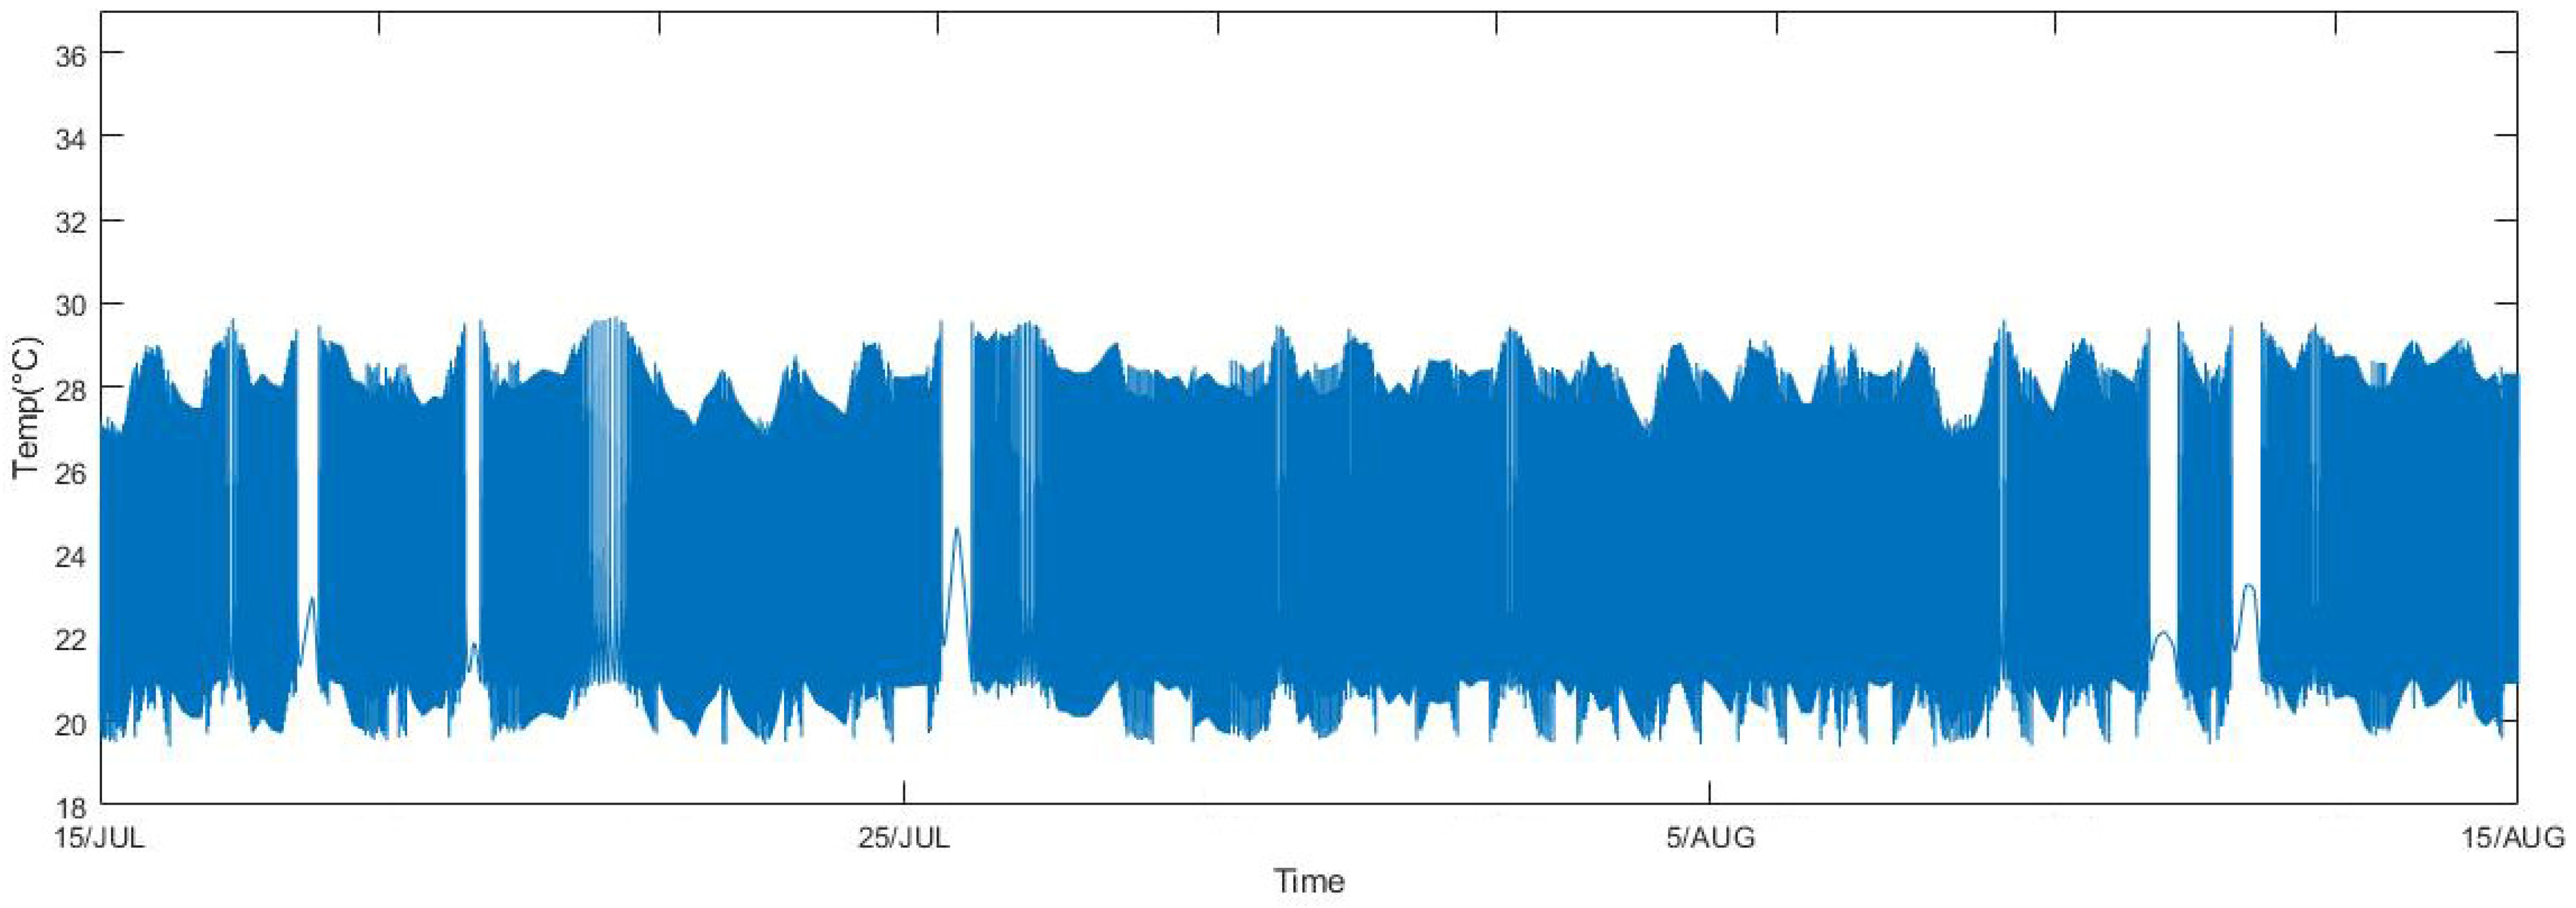
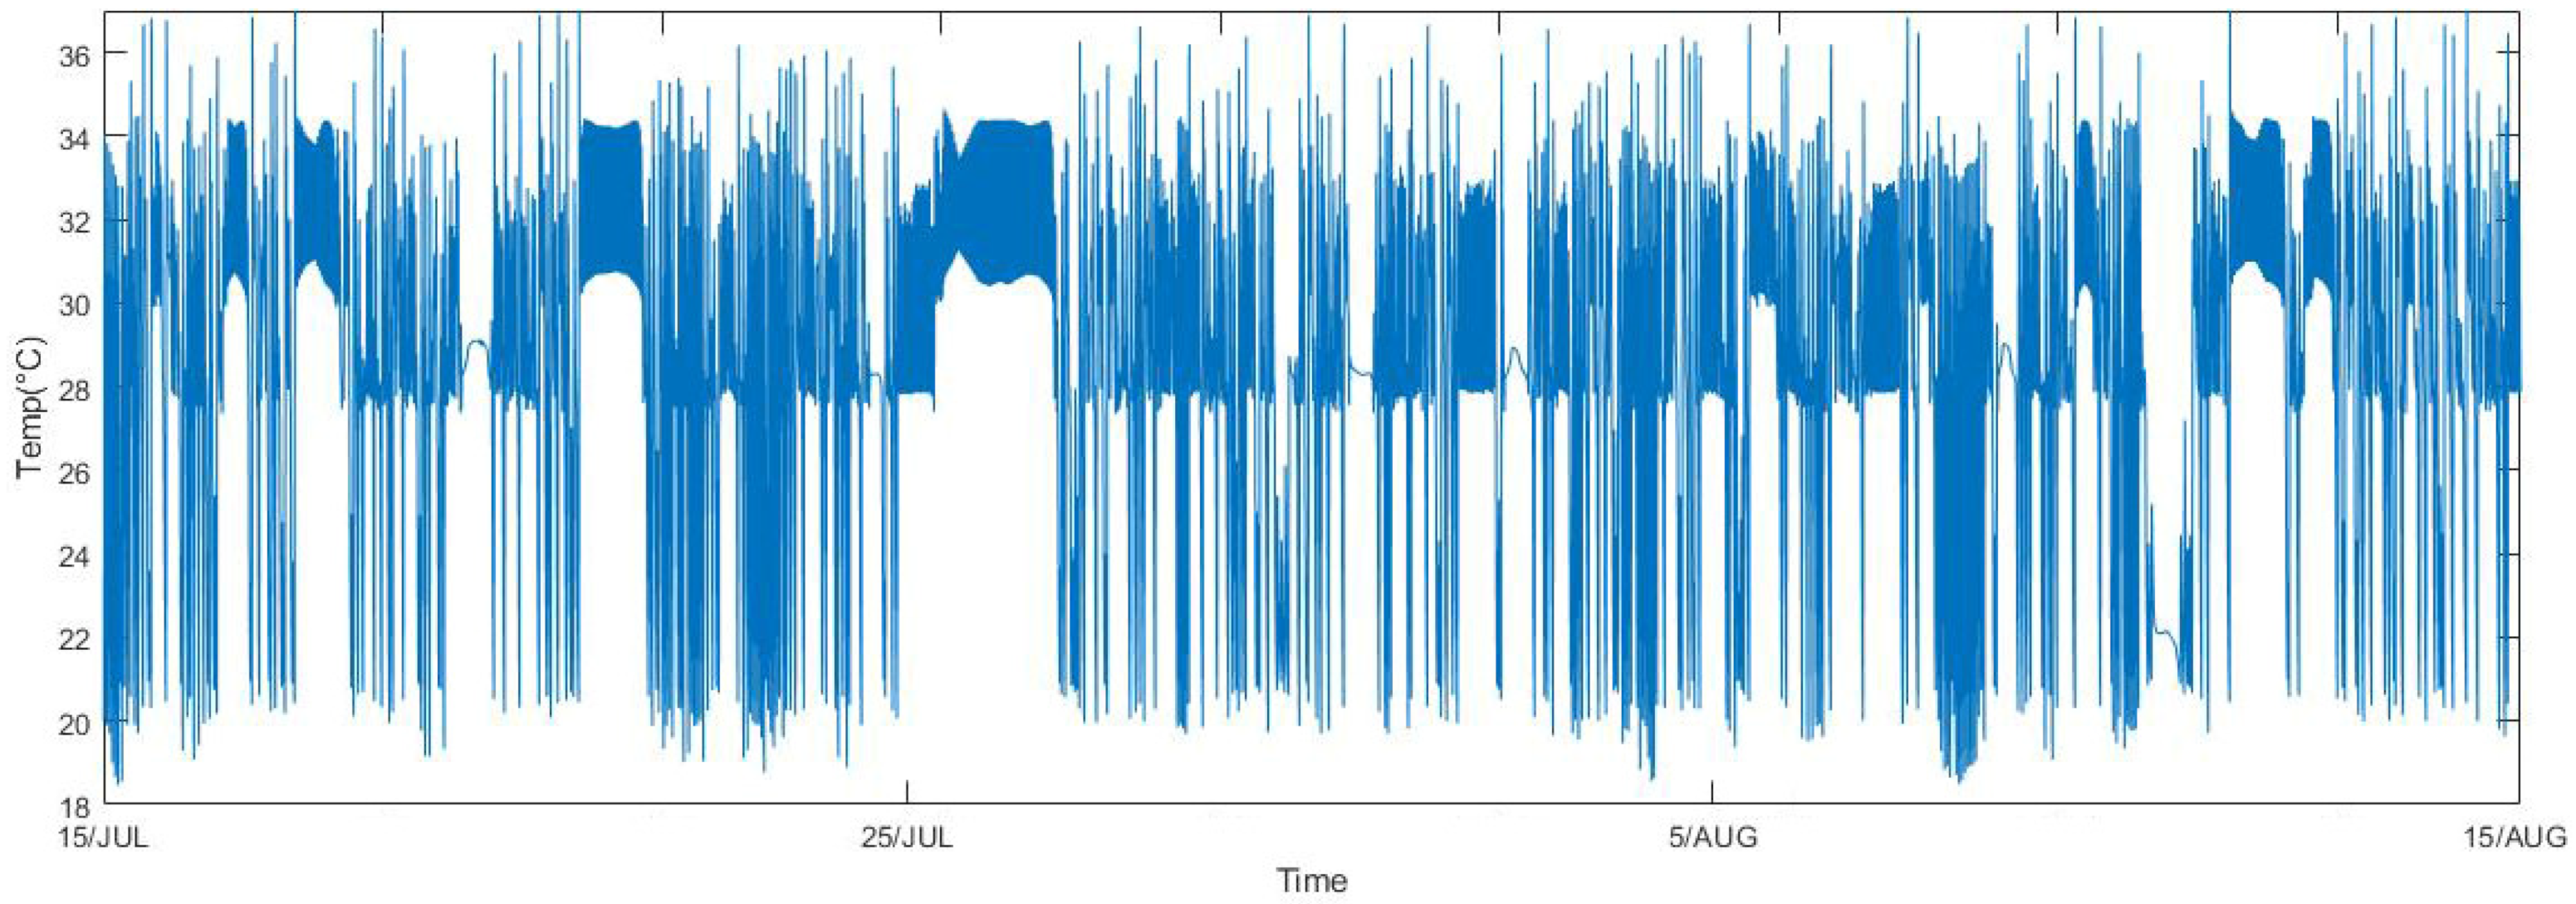
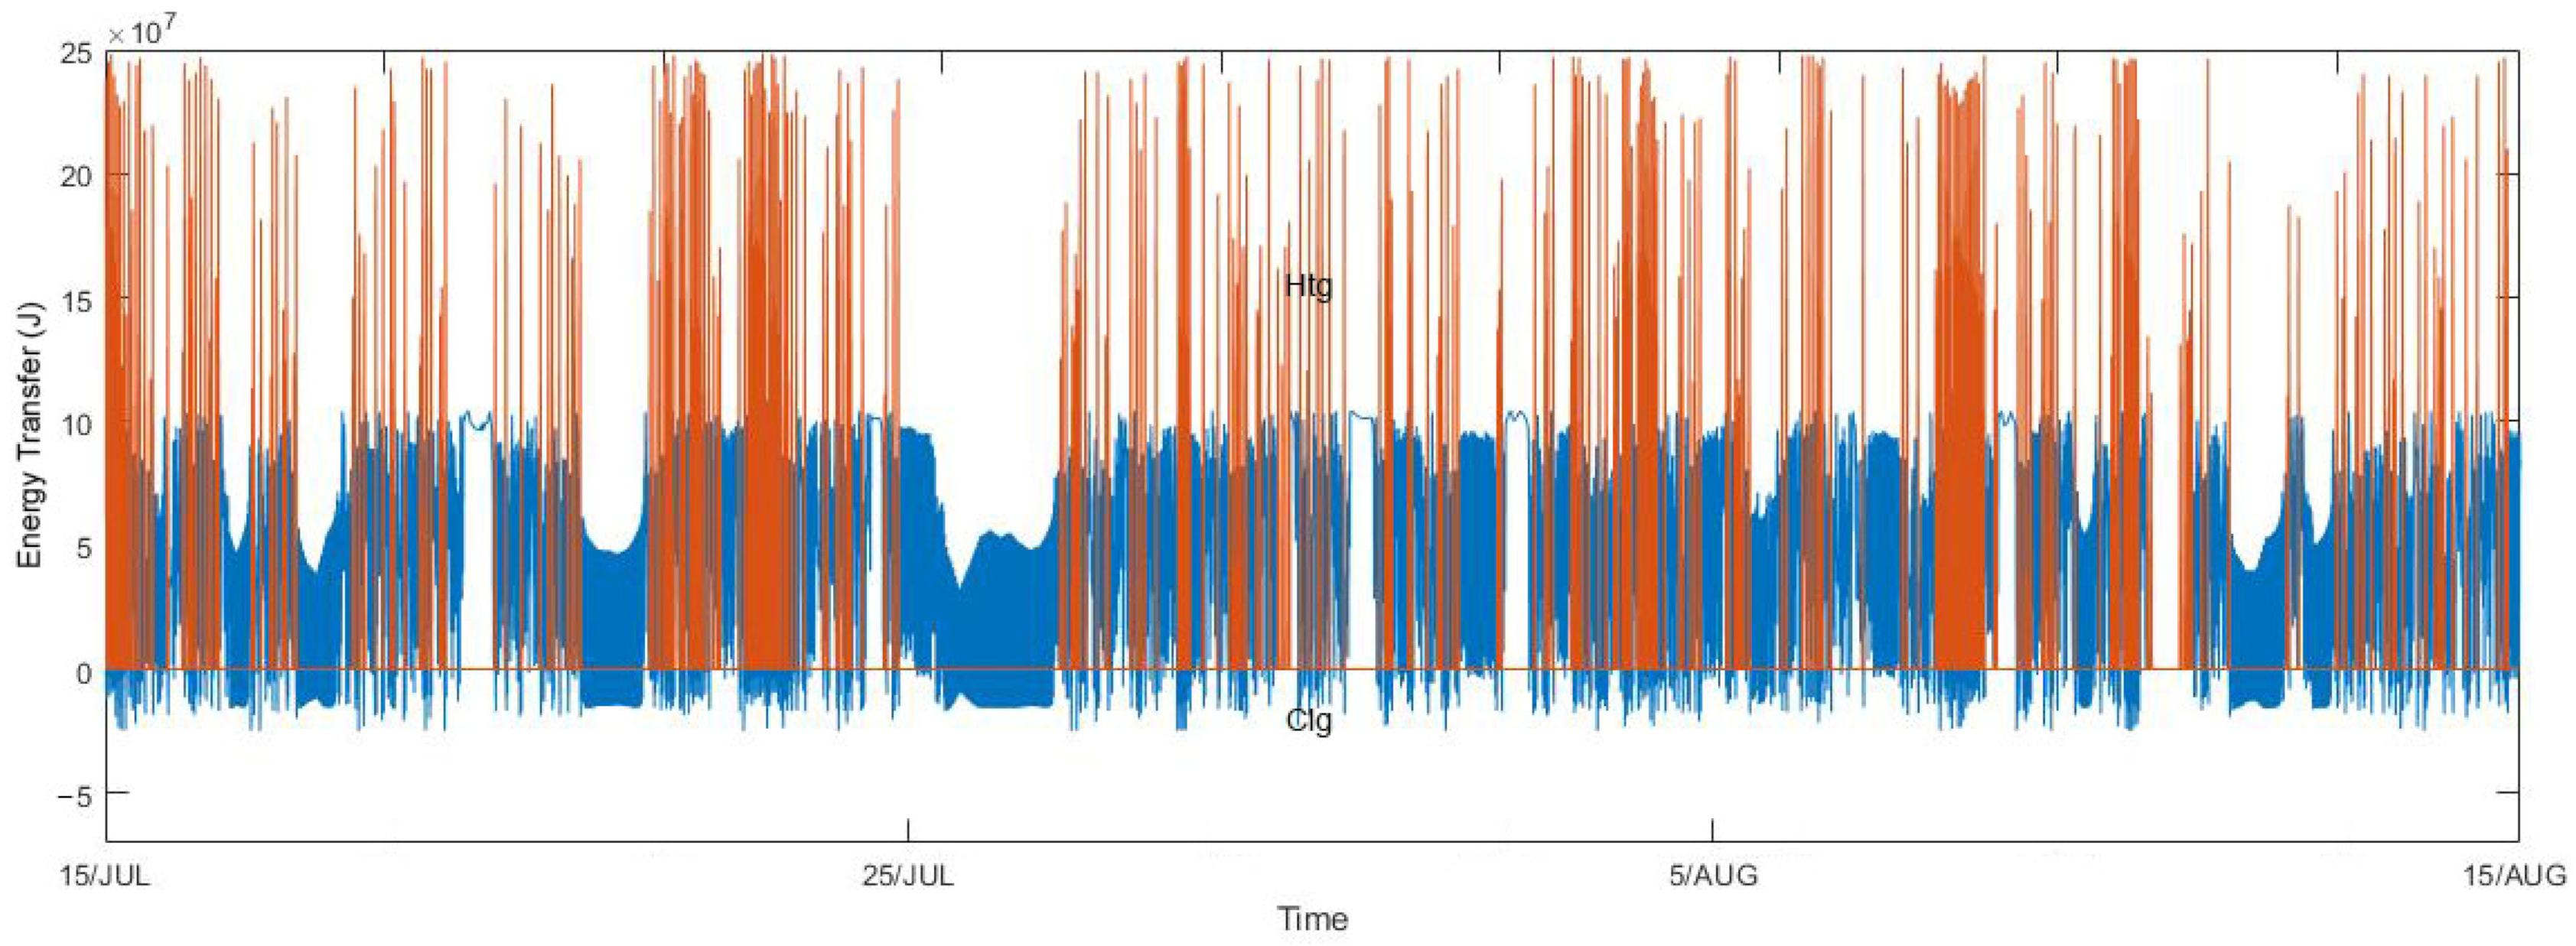
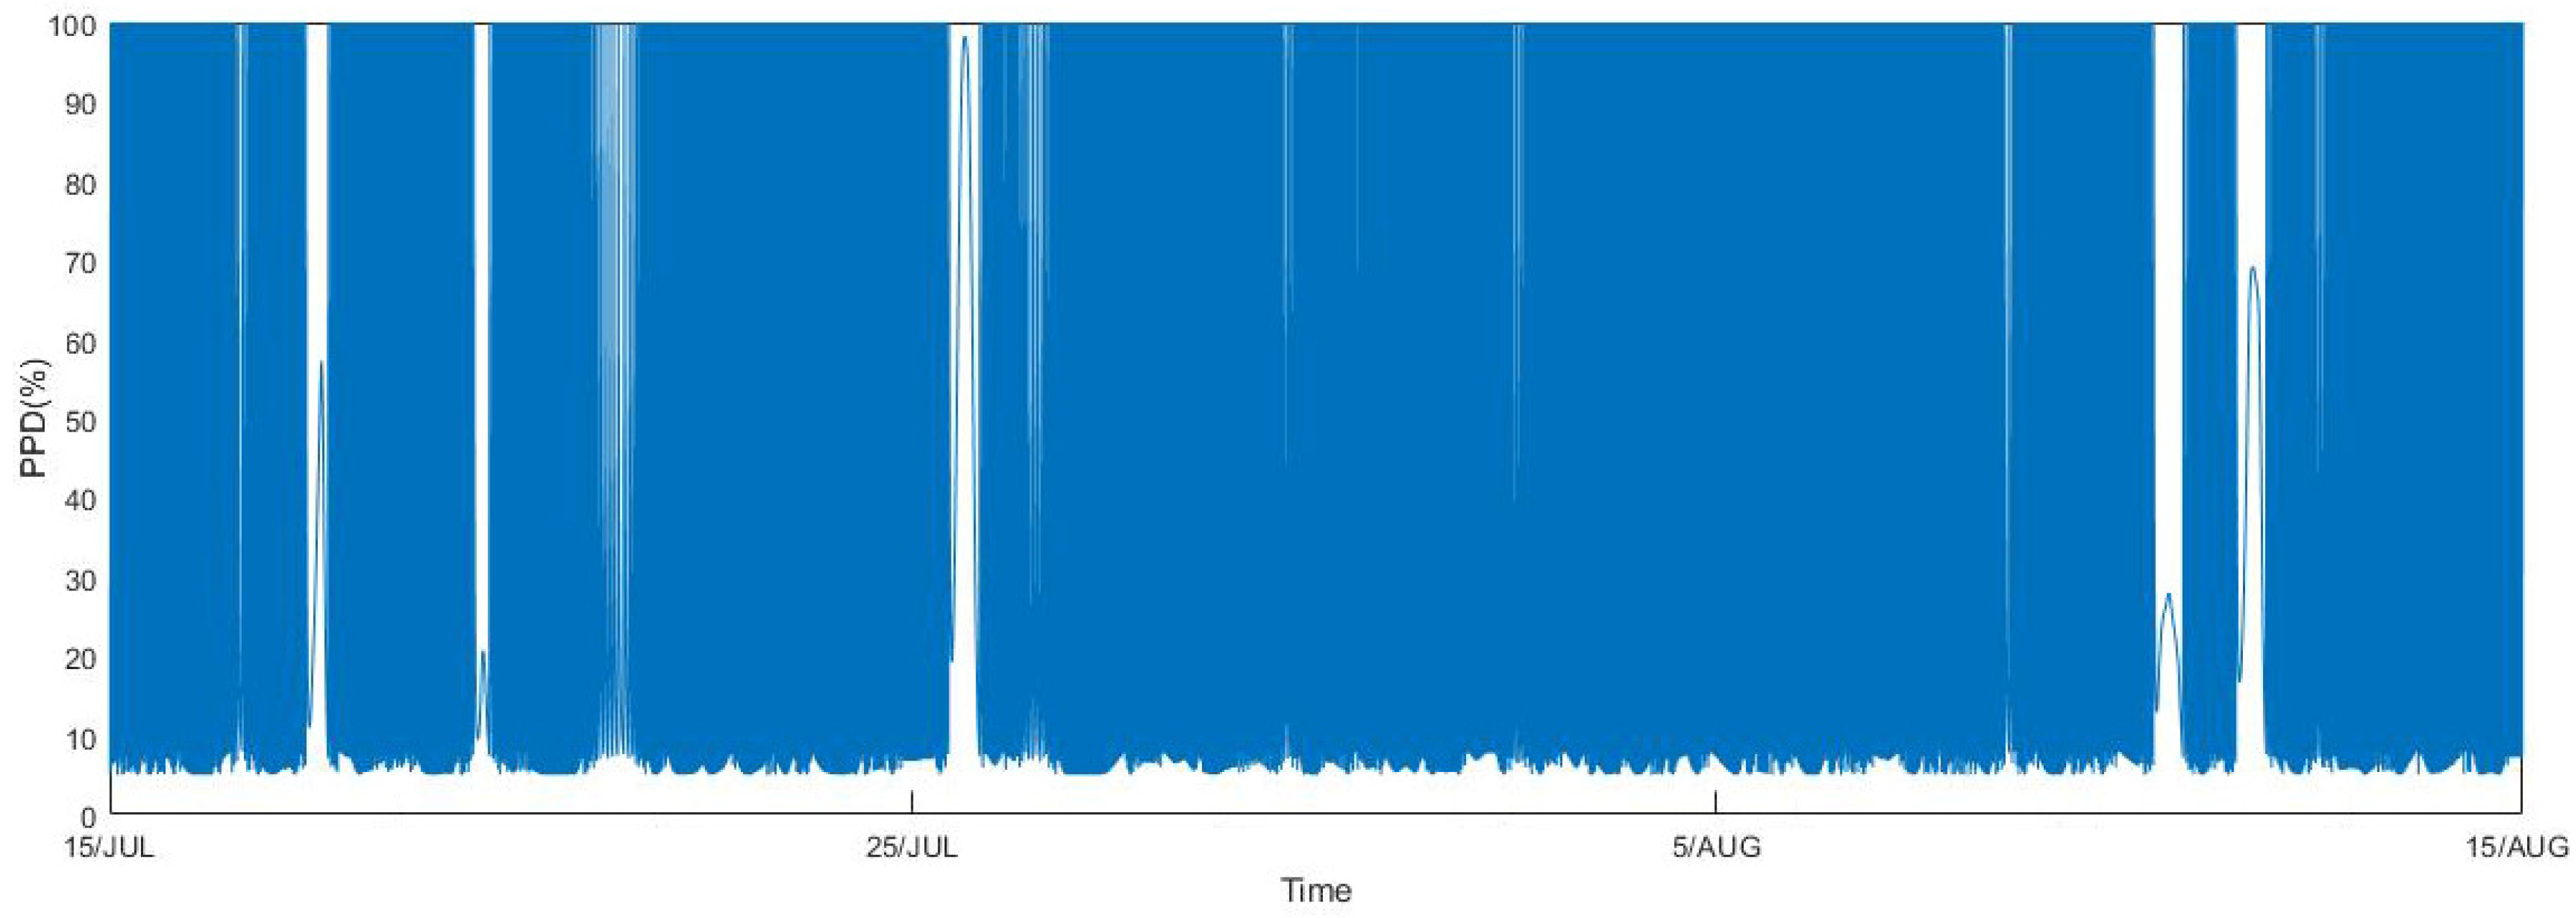
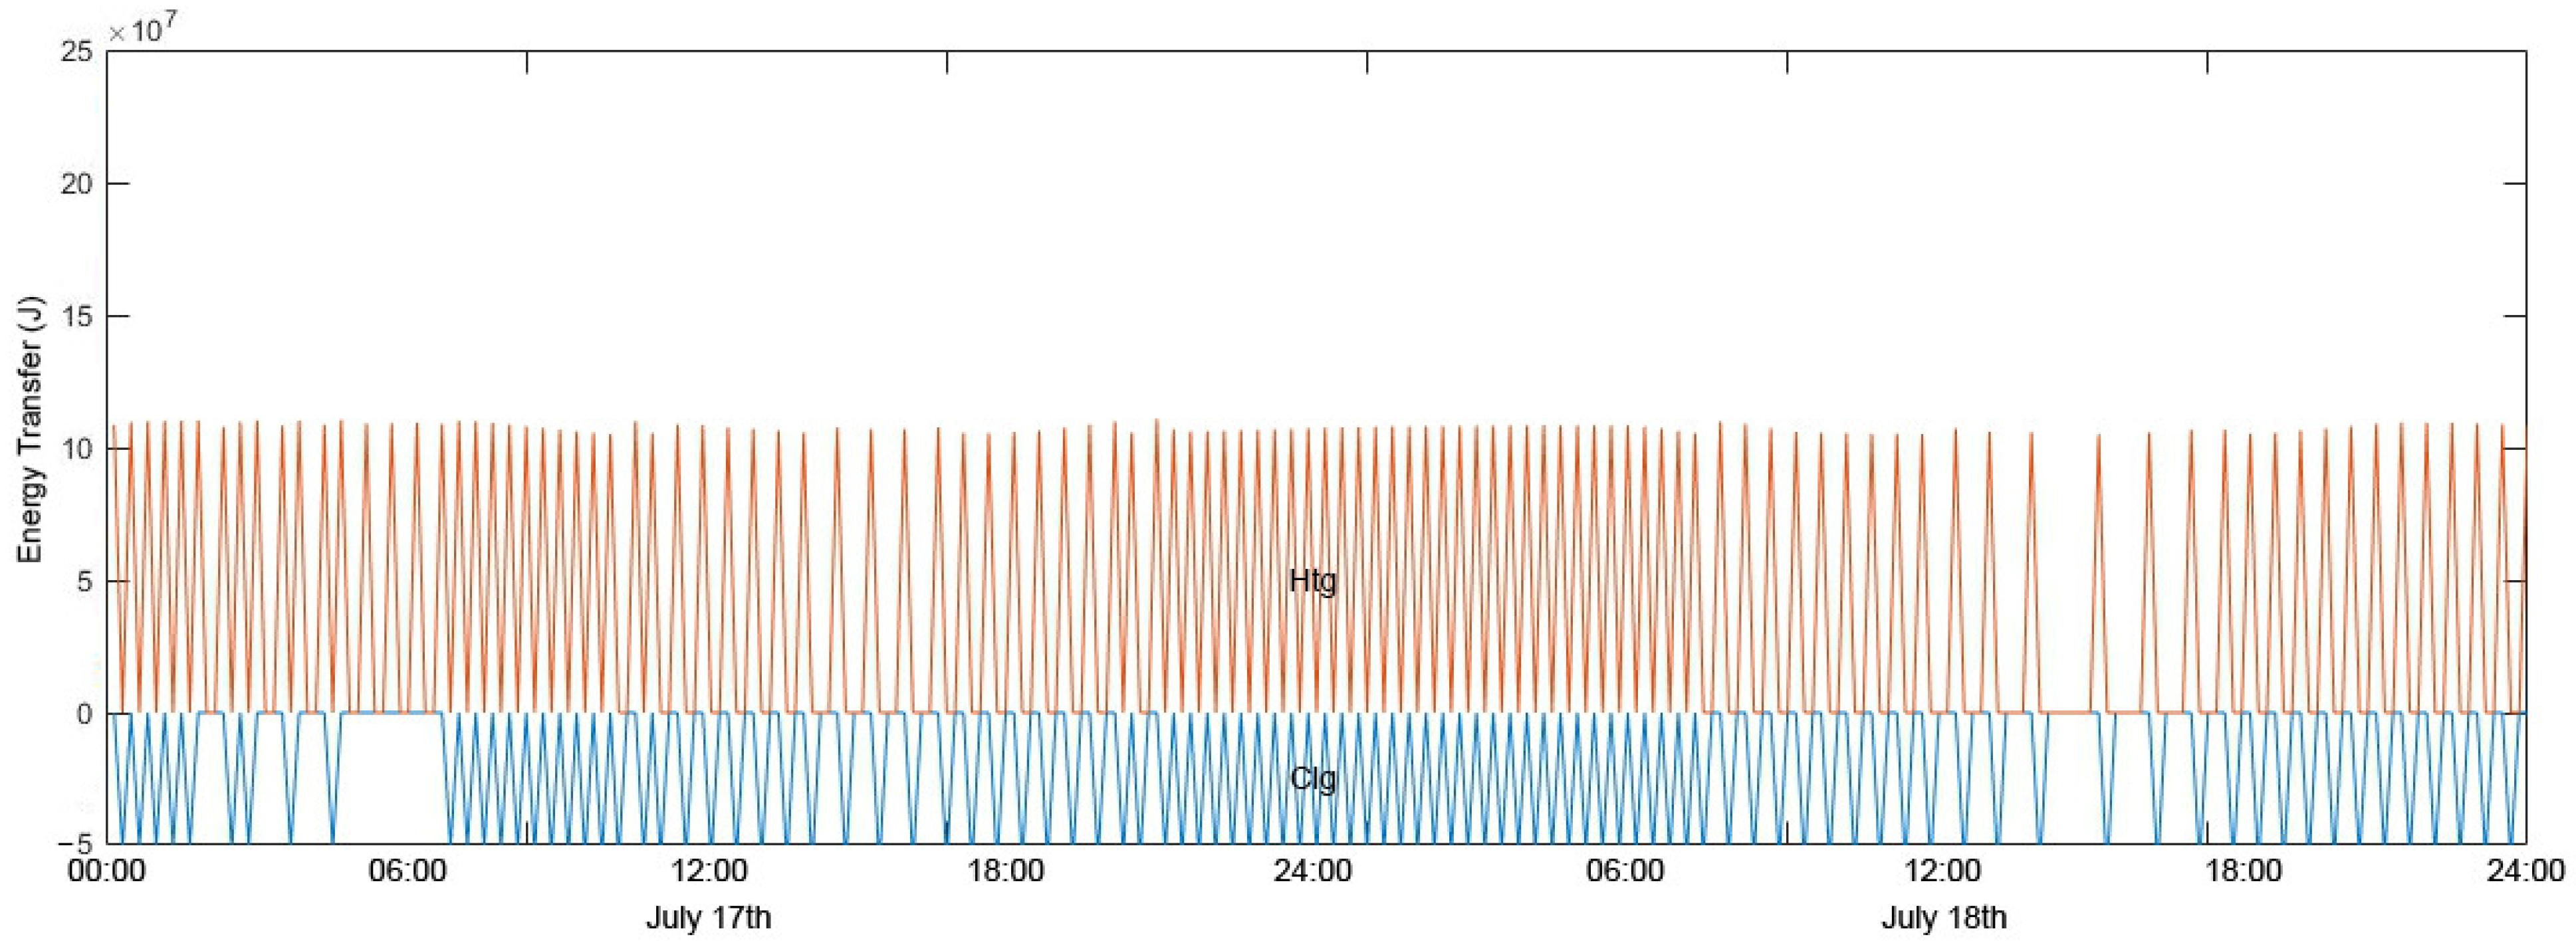
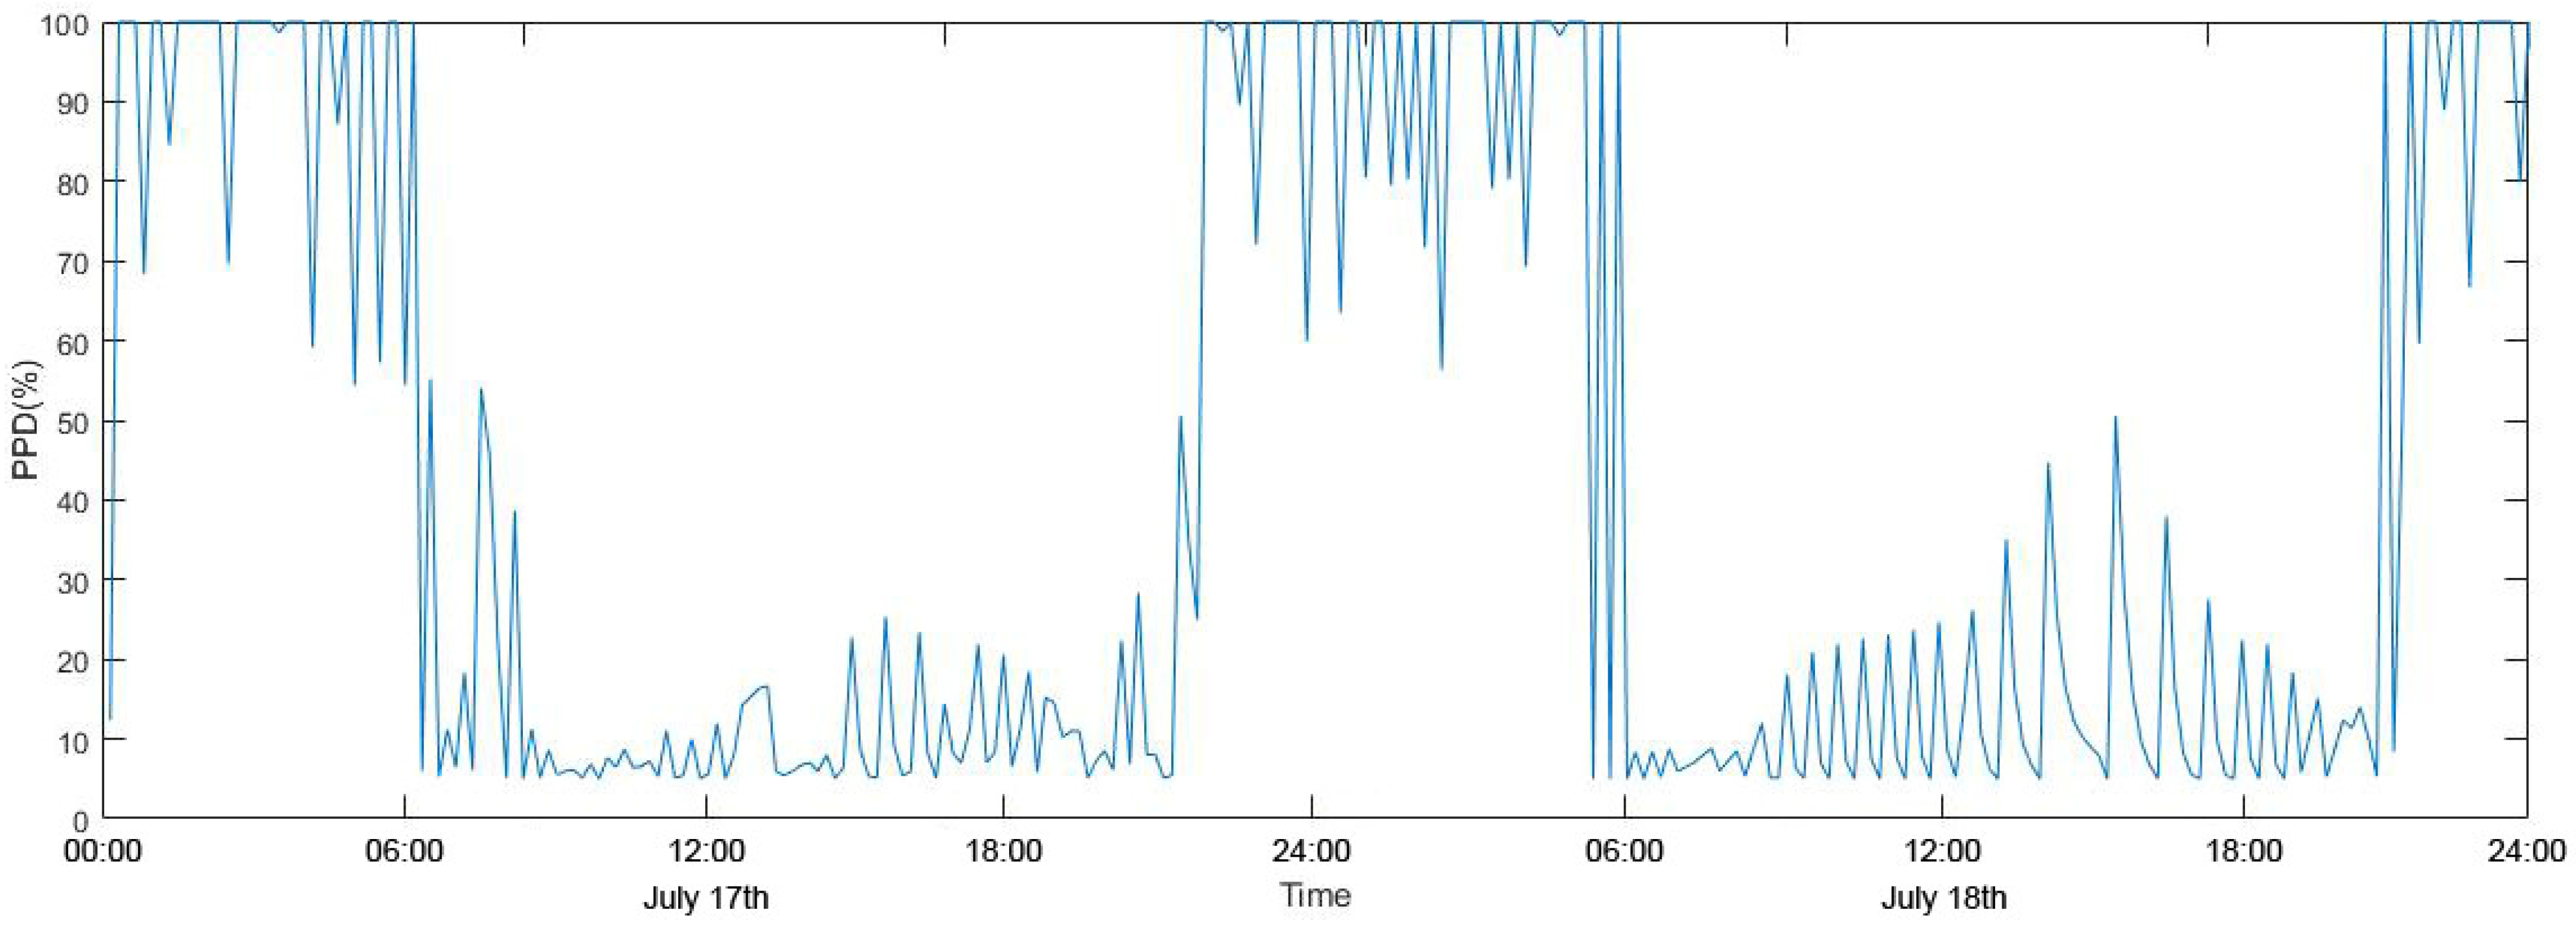
The above description for each model was composed of one simulation block model. As confirmed in Figure 4, the simulation model consisted of a total of seven modules: the signal-merging (adaptive) module; the ANN module; the thermostat module; the air heating and cooling module; the room (factory) module; the outdoor weather signal module; and the PMV/PPD calculation module. When a result was initially calculated, the values of indoor temperature, relative humidity were input into the PMV/PPD module and the thermal comfort level was calculated and sent to signal-merging blocks every minute and, simultaneously, the block adjusted thermostat values to maintain or stop the thermal system.

3. Results

Figure 5 and Figure 6 display the different control patterns of the proposed model using an adaptive process, which produced a wide range of changes in Trm as compared to the thermostat system. Moreover, this methodology also revealed that the adaptive module can maintain the heating and cooling model of the small-sized factory or temporarily stop depending on its occupancy rate, confirming that such characteristics were reflected in Trm. It is necessary to check how these control characteristics change indoor thermal comfort and the energy performance of building thermal systems.
Figure 7 describes the energy-transfer graph derived from the thermostat control, and Figure 8 shows quite a different graph derived from the adaptive process using a genetic algorithm. In all energy transfer graphs, positive values were shown in orange color by heating (Htg), and negative values were shown in blue color by cooling (Clg). As shown in the graph, thermostat control showed an almost constant control pattern over the period. In factory buildings, the occupancy rate is not higher than that of general commercial and office buildings, so the latent heat effect of occupants can be relatively small, and it can be seen that the amount of energy consumed to supplement it is not very large. However, in the case of adaptive models, it was confirmed that energy use also showed a significant change according to the change in occupancy rate. For some reason, if the occupancy rate during business hours is less than a certain standard, the building thermal system stops supplying controlled air, and if the occupancy rate is large outside of business hours, energy use is rapidly increased to improve the thermal comfort of occupants. The PPD graphs need to be analyzed to see if these patterns appropriately reflect its thermal comfort or energy use.
As indicated, Figure 9 and Figure 10 confirm the control characteristics of the two models identified in the energy use patterns. The thermostat model showed a pattern of almost constant PPD value change without any change in period. However, in the case of adaptive models, many sections showing very negative results of 100% PPD were identified. It is necessary to confirm how these patterns will differ numerically between actual energy use and thermal comfort.

4. Discussion

Figure 11, Figure 12, Figure 13 and Figure 14 show the energy transfer results and the PPD control results from the thermostat and the adaptive model at two-day intervals from 00:00 on 17 July to 24:00 on 18 July. In the case of the thermostat control, as the Tout rose, the PPD showed a pattern of rising. In particular, during the daytime on the 18th, it was confirmed that the PPD was increasing as the Tout was higher than on the 17th, and it was confirmed that this pattern was maintained during the lunch break (around from 12:00 to 13:00 on 17 July and from 18:00 to 19:00 on 18 July in two graphs). However, in the adaptive model, it can be seen that the control pattern varied between the two days depending on the setting of its occupant schedule. During the lunch break on the 17th, due to the low occupant schedule (under the negative value of standardization), the genetic algorithm analyzed that it was out of the fitness function, and it sent a signal to stop the cooling air supply, which caused a sharp increase in the PPD for a small number of occupants in the factory. On the 18th, as the number of workers staying indoors was analyzed by the fitness function, it was confirmed that almost the same amount of cooling air supply was sent as during working hours. This made for quite effective PPD-value control during the entire daytime. These two aspects affected not only the PPD results but also the energy use. It can be inferred that the energy use was reduced to some extent during the lunch break on the 17th compared to the thermostat model, and on the 18th, energy use increased to maintain low PPD results.
As previously mentioned, the precise control of thermal systems to maintain indoor thermal comfort is likely to increase energy use. By using genetic algorithms for the occupancy rate, it can be seen in Figure 12 and Figure 14 that this adaptive process stopped the thermal system for a certain period of time by determining the normal and abnormal conditions that were affected to maintain thermal comfort and reduce energy use. Firstly, energy use was found to improve by about 2.8%, but thermal dissatisfaction was found to decrease by about 16%, as indicated in Table 2 and Table 3. However, this numerical result clearly shows the proposed model’s advantages, except for during certain periods when the system temporarily stops due to the small occupancy rate. When this scenario about actual working hour used (when most workers focus on their work), the model’s higher performance can be confirmed at about 32%, as indicated in Table 4.
As expected in Figure 8, Figure 10, Figure 12 and Figure 14, the proposed model performed effective control that produced some PPD rise and fall at specific times according to the scenario for the occupancy rate, creating an overall improvement in thermal comfort. Therefore, it was confirmed that the model tested has the advantage of reducing a certain level of energy use even with the precise control process for alleviating the thermal dissatisfaction of workers in factory buildings.

5. Conclusions

This study explored a control model that can mitigate energy use while maintaining the quality of the indoor environment of a small-sized factory building. Among the various methods for the effective control of existing building thermal systems, this simulation study was conducted to test the performance of combining a genetic algorithm and an artificial neural network learning process with a scenario of occupancy rate.
As a result, the adaptive algorithm used was numerically confirmed to effectively control the indoor thermal comfort of workers, and it was also confirmed that its performance was higher except for times that were not related to actual work, such as lunch or a break. In addition, it was possible to confirm the performance in reducing energy consumption to some extent even though such precise control was performed. These characteristics can have the advantage of reducing energy use while optimizing thermal quality in the working spaces of factories, according to various situations. Depending on the cultural and religious characteristics of the occupant, if the occupancy rate at a specific time is significantly different from usual, it will be possible to design a thermal system or a control rule that can automatically determine system conditions and reduce energy use.
However, the factory model used in this study was too simplified to be representative, and some important heat sources other than indoor workers (e.g., equipment, machines, and lighting) were neglected. In addition, it is a disadvantage that not all of the necessary factors were considered when measuring indoor thermal comfort by PPD (e.g., mean radiant temperature, air velocity, etc.). Therefore, the direction of follow-up studies is clear. In order to utilize more diverse variables, the architecture modeling needs to be elaborately supplemented, and an indoor occupancy rate based on actual data can be utilized. In order to increase the statistical validation, measuring actual environmental conditions in real factory buildings and conducting more surveys of actual workers can be performed.

Funding

This work was supported by the National Research Foundation of Korea (NRF) grant funded by the Korean government (MSIT) (No. 2022R1F1A1073896).

Institutional Review Board Statement

Not applicable.

Informed Consent Statement

Not applicable.

Data Availability Statement

The data presented in this study are available on request from the corresponding author. The data are not publicly available due to the nature of this study.

Conflicts of Interest

The author declares no conflict of interest.

Nomenclature

Aarea (m2)
Cspecific heat capacity (J/kg·°C)
Ddepth or thickness (m)
hin, houtconvection heat transfer coefficient inside, outside (W/m2·°C)
kthermal conductivity (W/m·°C)
htmass flow-rate from the thermal system (kg/h)
inmass flow-rate into the room (kg/h)
outmass flow-rate from the room (kg/h)
mrmmass flow-rate inside the room (kg)
Qlossheat loss by convection and transmission (J)
Qgainheat gain by convection and transmission (J)
Rthermal resistance (°C/W)
ttime (h)
Thttemperature of air from the thermal system (°C)
Touttemperature of outdoor air (°C)
Trmtemperature of the room (°C)
Tsettemperature of the thermostat set-point (°C)
Uinternal energy (J)
Wwork (J)

References

  1. Mckoy, D.; Tesiero, R.; Acquaah, Y.; Gokaraju, B. Review of HVAC Systems History and Future Applications. Energies 2023, 16, 6109. [Google Scholar] [CrossRef]
  2. Michailidis, M.; Michailidis, I.; Vamvakas, D.; Kosmatopoulos, E. Model-Free HVAC Control in Buildings: A Review. Energies 2023, 16, 7124. [Google Scholar] [CrossRef]
  3. Moon, J.; Ahn, J. Improving sustainability of ever-changing building spaces affected by users’ fickle taste: A focus on human comfort and energy use. Energy Build. 2020, 208, 109662. [Google Scholar] [CrossRef]
  4. Abuhussain, M.; Alotaibi, B.; Aliero, M.; Asif, M.; Alshenaifi, M.; Dodo, Y. Adaptive HVAC System Based on Fuzzy Controller Approach. Appl. Sci. 2023, 13, 11354. [Google Scholar] [CrossRef]
  5. Barbadilla-Martun, E.; Ragel-Bonilla, J.; Aparicio-Ruiz, P.; Guadix, J. Analysing the indoor temperature ranges for an efficient control of HVAC systems. Energy Build. 2023, 301, 113681. [Google Scholar] [CrossRef]
  6. Boukhelkhal, I.; Bourbia, F. Experimental Study on the Thermal Behavior of Exterior Coating Textures of Building in Hot and Arid Climates. Sustainability 2021, 13, 4175. [Google Scholar] [CrossRef]
  7. Alnuaimi, A.; Natarajan, S. The Energy Cost of Cold Thermal Discomfort in the Global Southu. Buildings 2020, 10, 93. [Google Scholar] [CrossRef]
  8. Fazzolari, M.; Alcala, R.; Nojima, Y.; Ishibuchi, H.; Herrera, F. A Review of the Application of Multiobjective Evolutionary Fuzzy Systems: Current Status and Further Directions. Fuzzy Syst. 2013, 21, 45–65. [Google Scholar] [CrossRef]
  9. Barone, G.; Buonomano, A.; Forzano, C.; Giuzio, G.; Palombo, A.; Russo, G. A new thermal comfort model based on physiological parameters for the smart design and control of energy-efficient HVAC systems. Renew. Sustain. Energy Rev. 2023, 173, 113015. [Google Scholar] [CrossRef]
  10. Du, X.; Gao, G.; Gao, F.; Zhou, Z. A Study on Modifying Campus Buildings to Improve Habitat Comfort—A Case Study of Tianjin University Campus. Sustainability 2023, 15, 14200. [Google Scholar] [CrossRef]
  11. Levic, B.; Dukanovic, L.; Ignjatovic, D. Approaches for Complex and Integrated Refurbishment to Improve Energy Efficiency and Spatial Comfort of the Existing Post-War Mass Housing Stock in Serbia. Sustainability 2023, 15, 13884. [Google Scholar] [CrossRef]
  12. Kull, T.; Thalfeldt, M.; Kurnitski, J. PI Parameter Influence on Underfloor Heating Energy Consumption and Setpoint Tracking in nZEBs. Energies 2020, 13, 68. [Google Scholar] [CrossRef]
  13. Turhan, C.; Atalay, A.; Akkurt, G. An Integrated Decision-Making Framework for Mitigating the Impact of Urban Heat Islands on Energy Consumption and Thermal Comfort of Residential Buildings. Sustainability 2023, 15, 9674. [Google Scholar] [CrossRef]
  14. Dafalla, M.; Al-Mahbashi, A. Improvement of Subsurface Thermal Characteristics for Green Parks. Appl. Sci. 2023, 13, 12508. [Google Scholar] [CrossRef]
  15. Skala, A.; Grela, J.; Laton, D.; Banczykm, K.; Markiewicz, M.; Ozadowicz, A. Implementation of Building a Thermal Model to Improve Energy Efficiency of the Central Heating System—A Case Study. Energies 2023, 16, 6830. [Google Scholar] [CrossRef]
  16. Ahn, J.; Cho, S. Anti-logic or common sense that can hinder machine’s energy performance: Energy and comfort control models based on artificial intelligence responding to abnormal indoor environments. Appl. Energy 2017, 204, 117–130. [Google Scholar] [CrossRef]
  17. Youssef, A.; Caballero, N.; Aerts, J. Development and comparison of adaptive data-driven models for thermal comfort assessment and control. Total Environ. Res. Themes 2023, 8, 100083. [Google Scholar] [CrossRef]
  18. Korea Electric Power Corporation. Policy of Electricity Tariff: Current Status of Electricity Usage. Available online: https://home.kepco.co.kr/kepco/EB/A/htmlView/EBAAHP002.do?menuCd=FN430102 (accessed on 11 August 2023).
  19. Korea Electric Power Corporation Energy Market Place. Information of Electricity Consumers: Electricity Transaction Contract between the Third Parties. Available online: https://en-ter.co.kr/ft/ppa/thpty/buyer/list.do (accessed on 18 May 2023).
  20. USEIA. CBECS Table E2 Major Fuel Consumption Intensities by End Use for Non Mall. USEIA. Available online: http://www.eia.doe.gov/emeu/cbecs (accessed on 18 May 2023).
  21. Ahn, J. Development of Energy Performance Metrics for Airport Terminal Buildings Using Multivariate Regression Modeling; North Carolina State University: Raleigh, NC, Canada, 2016. [Google Scholar]
  22. Ministry of Employment and Labor Reserved. Statistics DB: As Topics. Available online: http://laborstat.moel.go.kr/hmp/tblInfo/TblInfoList.do?menuId=0010001100101102&leftMenuId=0010001100101&vwCdVal=MT_PTITLE&upListVal=118_2 (accessed on 2 July 2023).
  23. Jung, K.; Choi, S.; Kulvatunyou, B.; Cho, H.; Morris, K. A reference activity model for smart factory design and improvement. Prod. Plan. Control 2017, 28, 108–122. [Google Scholar] [CrossRef]
  24. Resman, M.; Turk, M.; Herakovic, N. Methodology for planning smart factory. Procedia 2021, 97, 401–406. [Google Scholar] [CrossRef]
  25. Sufian, A.; Abdullar, B.; Ateeq, M.; Wah, R.; Clements, D. A roadmap towards the smart factory. In Proceedings of the 2019 12th International Conference on Developments in eSystems Engineering (DeSE), Kazan, Russia, 7–10 October 2019. [Google Scholar] [CrossRef]
  26. Rub, J.; Bahemia, H. A review of the literature on smart factory implementation. In Proceedings of the 2019 IEEE International Conference on Engineering, Technology and Innovation (ICE/ITMC), Valbonne Sophia-Antipolis, France, 17–19 June 2019. [Google Scholar] [CrossRef]
  27. Bendowska, K.; Zawadzki, P. Development and Verification of a Simulation Model of an Automated Assembly Line. Appl. Sci. 2023, 13, 10142. [Google Scholar] [CrossRef]
  28. Li, R.; Wang, X.; Wang, Z.; Zhu, Z.; Liu, Z. Multistage Quality Prediction Using Neural Networks in Discrete Manufacturing Systems. Appl. Sci. 2023, 13, 8776. [Google Scholar] [CrossRef]
  29. ASHRAE Standard 55-2004; Thermal Environmental Conditions for Human Occupancy. ASHRAE: Atlanta, GA, USA, 2004.
  30. Heselden, J.; Gautham, P. Heuristics and Rescheduling in Prioritised Multi-Robot Path Planning: A Literature Review. Machines 2023, 11, 1033. [Google Scholar] [CrossRef]
  31. Incropera, F.P.; DeWitt, D.P.; Bergman, T.L.; Lavine, A.S. Fundamentals of Heat and Mass Transfer; Wiley: New York, NY, USA, 2018. [Google Scholar]
  32. Engineering Toolbox. Recommended Indoor Temperatures Summer and Winter. Engineering Toolbox. 2016. Available online: http://www.engineeringtoolbox.com (accessed on 27 March 2023).
  33. National Institute of Building Science. Space Types. Whole Building Design Guide. 2018. Available online: https://www.wbdg.org/space-types (accessed on 15 October 2022).
  34. Marquez, A.; Carmona, A.; Antomarioni, S. A Process to Implement an Artificial Neural Network and Association Rules Techniques to Improve Asset Performance and Energy Efficiency. Energies 2019, 12, 3454. [Google Scholar] [CrossRef]
  35. Palladio, D.; Nardi, I.; Burati, C. Artificial Neural Network for the Thermal Comfort Index Prediction: Development of a New Simplified Algorithm. Energies 2020, 13, 4500. [Google Scholar] [CrossRef]
  36. Kim, S.; Ahn, J. Building Space Thermal Control Model Responding to Sharp Changes in Outdoor Temperature. Teh. Vjesn. 2023, 30, 815–823. [Google Scholar] [CrossRef]
  37. Instituto Tecnologoco de Aeronautica (Technological Institute of Aeronautics). Chapter 2—Artificial Neural Networks: Basic Concepts. Instituto Tecnologoco de Aeronautica. 23 April 1998. Available online: www.ele.ita.cta.br (accessed on 18 July 2023).
  38. Politechnika Wroclawska. Chapter 2 Introduction to Neural network. Politechnika Wroclawska. Available online: www.ii.pwr.edu.pl (accessed on 27 March 2023).
  39. Marasco, G.; Rosso, M.M.; Aiello, S.; Aloisio, A.; Cirrincione, G.; Chiaia, B.; Marano, G.C. Ground penetrating radar fourier pre-processing for deep learning tunnel defects’ automated classification. In Proceedings of the International Conference on Engineering Applications of Neural Networks, Chersonisos, Crete, Greece, 17–20 June 2022. [Google Scholar] [CrossRef]
  40. Gen, M.; Lin, L. Genetic algorithms and their applications. In Springer Handbook of Engineering Statistics; Pham, H., Ed.; Springer Handbooks; Springer: London, UK, 2023. [Google Scholar] [CrossRef]
  41. Alhijawi, B.; Awajan, A. Genetic algorithms: Theory, genetic operators, solutions, and applications. Evol. Intell. 2023, 16, 1–12. [Google Scholar] [CrossRef]
Figure 1. Tout in Incheon, Korea.
Sustainability 15 16619 g001
Figure 2. Schematic of the small-sized factory model.
Sustainability 15 16619 g002
Figure 3. Conceptual process of the adaptive model.
Sustainability 15 16619 g003
Figure 4. Conceptual process in a block diagram.
Sustainability 15 16619 g004
Figure 5. Temperature of room air from the thermostat.
Sustainability 15 16619 g005
Figure 6. Temperature of room air from the adaptive process.
Sustainability 15 16619 g006
Figure 7. Energy transfer results from the thermostat.
Sustainability 15 16619 g007
Figure 8. Energy transfer results from the adaptive process.
Sustainability 15 16619 g008
Figure 9. PPD results from the thermostat.
Sustainability 15 16619 g009
Figure 10. PPD results from the adaptive process.
Sustainability 15 16619 g010
Figure 11. Details of energy transfer results from the thermostat.
Sustainability 15 16619 g011
Figure 12. Details of energy transfer results from the adaptive process.
Sustainability 15 16619 g012
Figure 13. Detail of PPD results from the thermostat.
Sustainability 15 16619 g013
Figure 14. Detail of PPD results from the adaptive process.
Sustainability 15 16619 g014
Table 1. Building information.
Name/PropertyValue
Type of BuildingSmall Factory
Size (Width × Depth × Height)14.75 m × 25.75 m × 7.35 m
RoofSize388.11 m2
Thermal Resistance1.156 × 10−2 °C/W
WallSize442.66 m2
Thermal Resistance5.758 × 10−3 °C/W
Doors and WindowsSize50.55 m2
Thermal Resistance2.139 × 10−3 °C/W
Table 2. Monthly energy use of the systems.
ControllerMonthly Energy Use (MWh)Difference (%)
Thermostat340.10-
Adaptive331.40−2.81
Table 3. PPD levels of the controllers.
ControllerMonthly Average of PPDDifference (%)
Thermostat40.20-
Adaptive33.62−16.37
Table 4. PPD levels, in actual working hours, of the controllers.
ControllerMonthly Average of PPD in Actual Working HoursDifference (%)
Thermostat12.53-
Adaptive8.46−32.44
Disclaimer/Publisher’s Note: The statements, opinions and data contained in all publications are solely those of the individual author(s) and contributor(s) and not of MDPI and/or the editor(s). MDPI and/or the editor(s) disclaim responsibility for any injury to people or property resulting from any ideas, methods, instructions or products referred to in the content.

