
Large-Scale Biochar Incorporation Does Not Necessarily Promote the Carbon Sink of Estuarine Wetland Soil
Abstract
:1. Introduction
2. Materials and Methods
2.1. Soil Collection and Biochar Preparation
2.2. Experimental Procedures
2.3. Soil and Plant Analyses
2.3.1. Plant TC and TN Content
2.3.2. Soil pH and SR
2.3.3. Soil Enzyme Activity
2.3.4. Soil DNA Extraction and Soil Microbial Structure Analysis
2.4. Data Processing and Statistical Analysis
3. Results
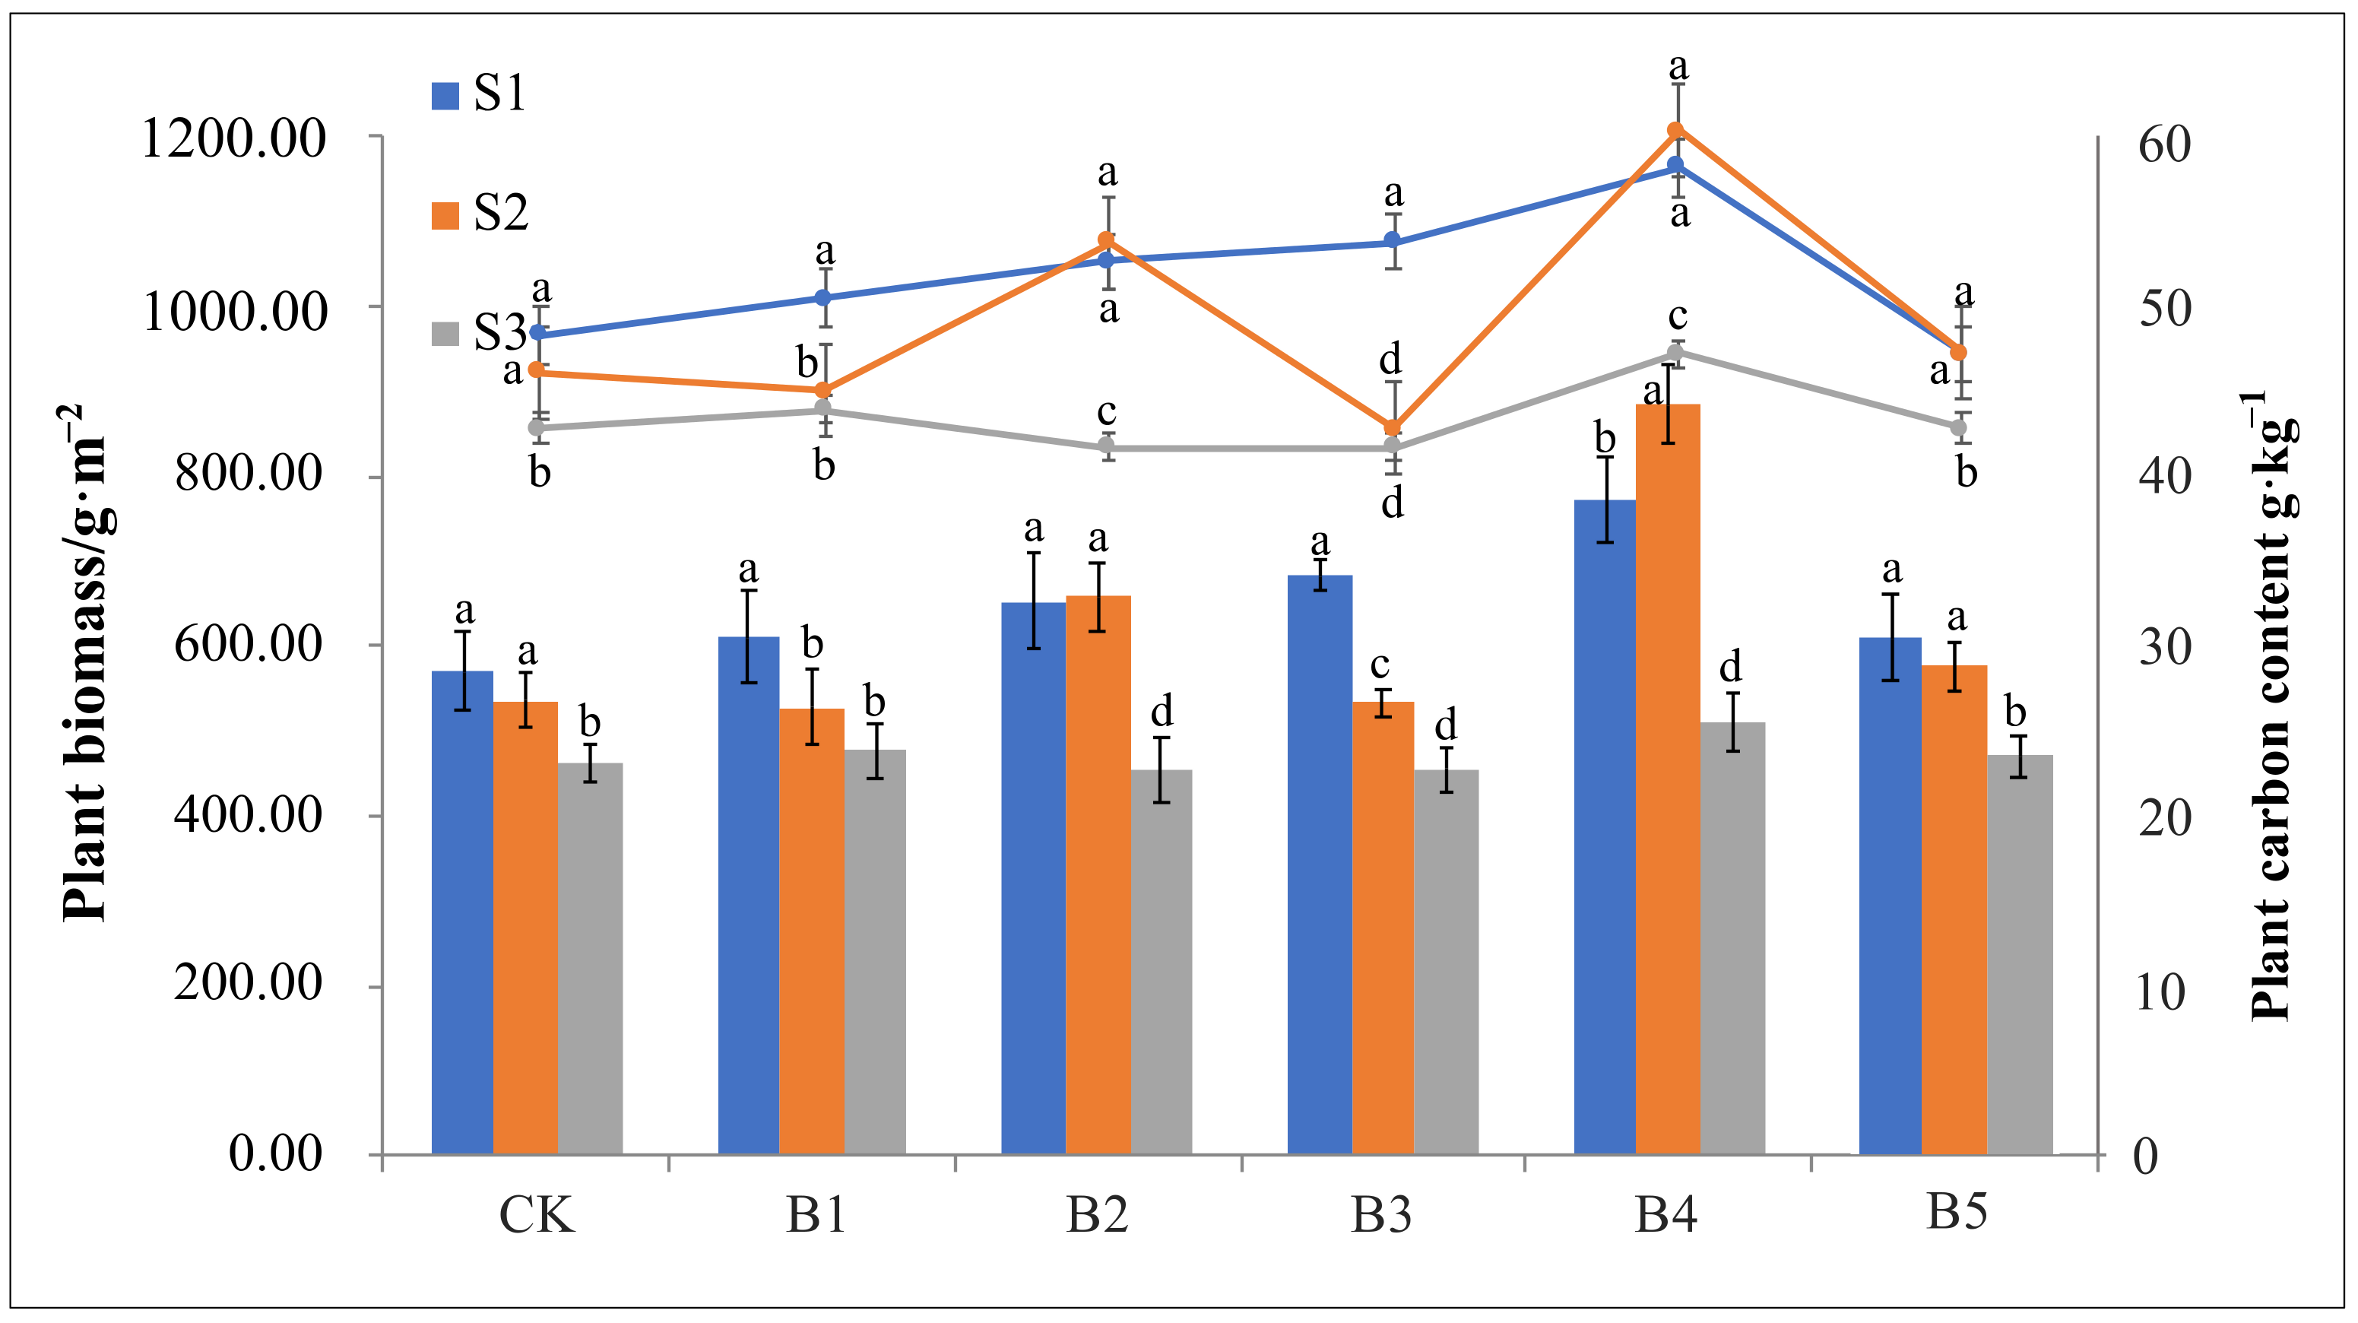
3.1. Plant Growth
3.2. Response of Soil Respiration
3.3. Response of Soil β-Glucosidase and Dehydrogenase Activities
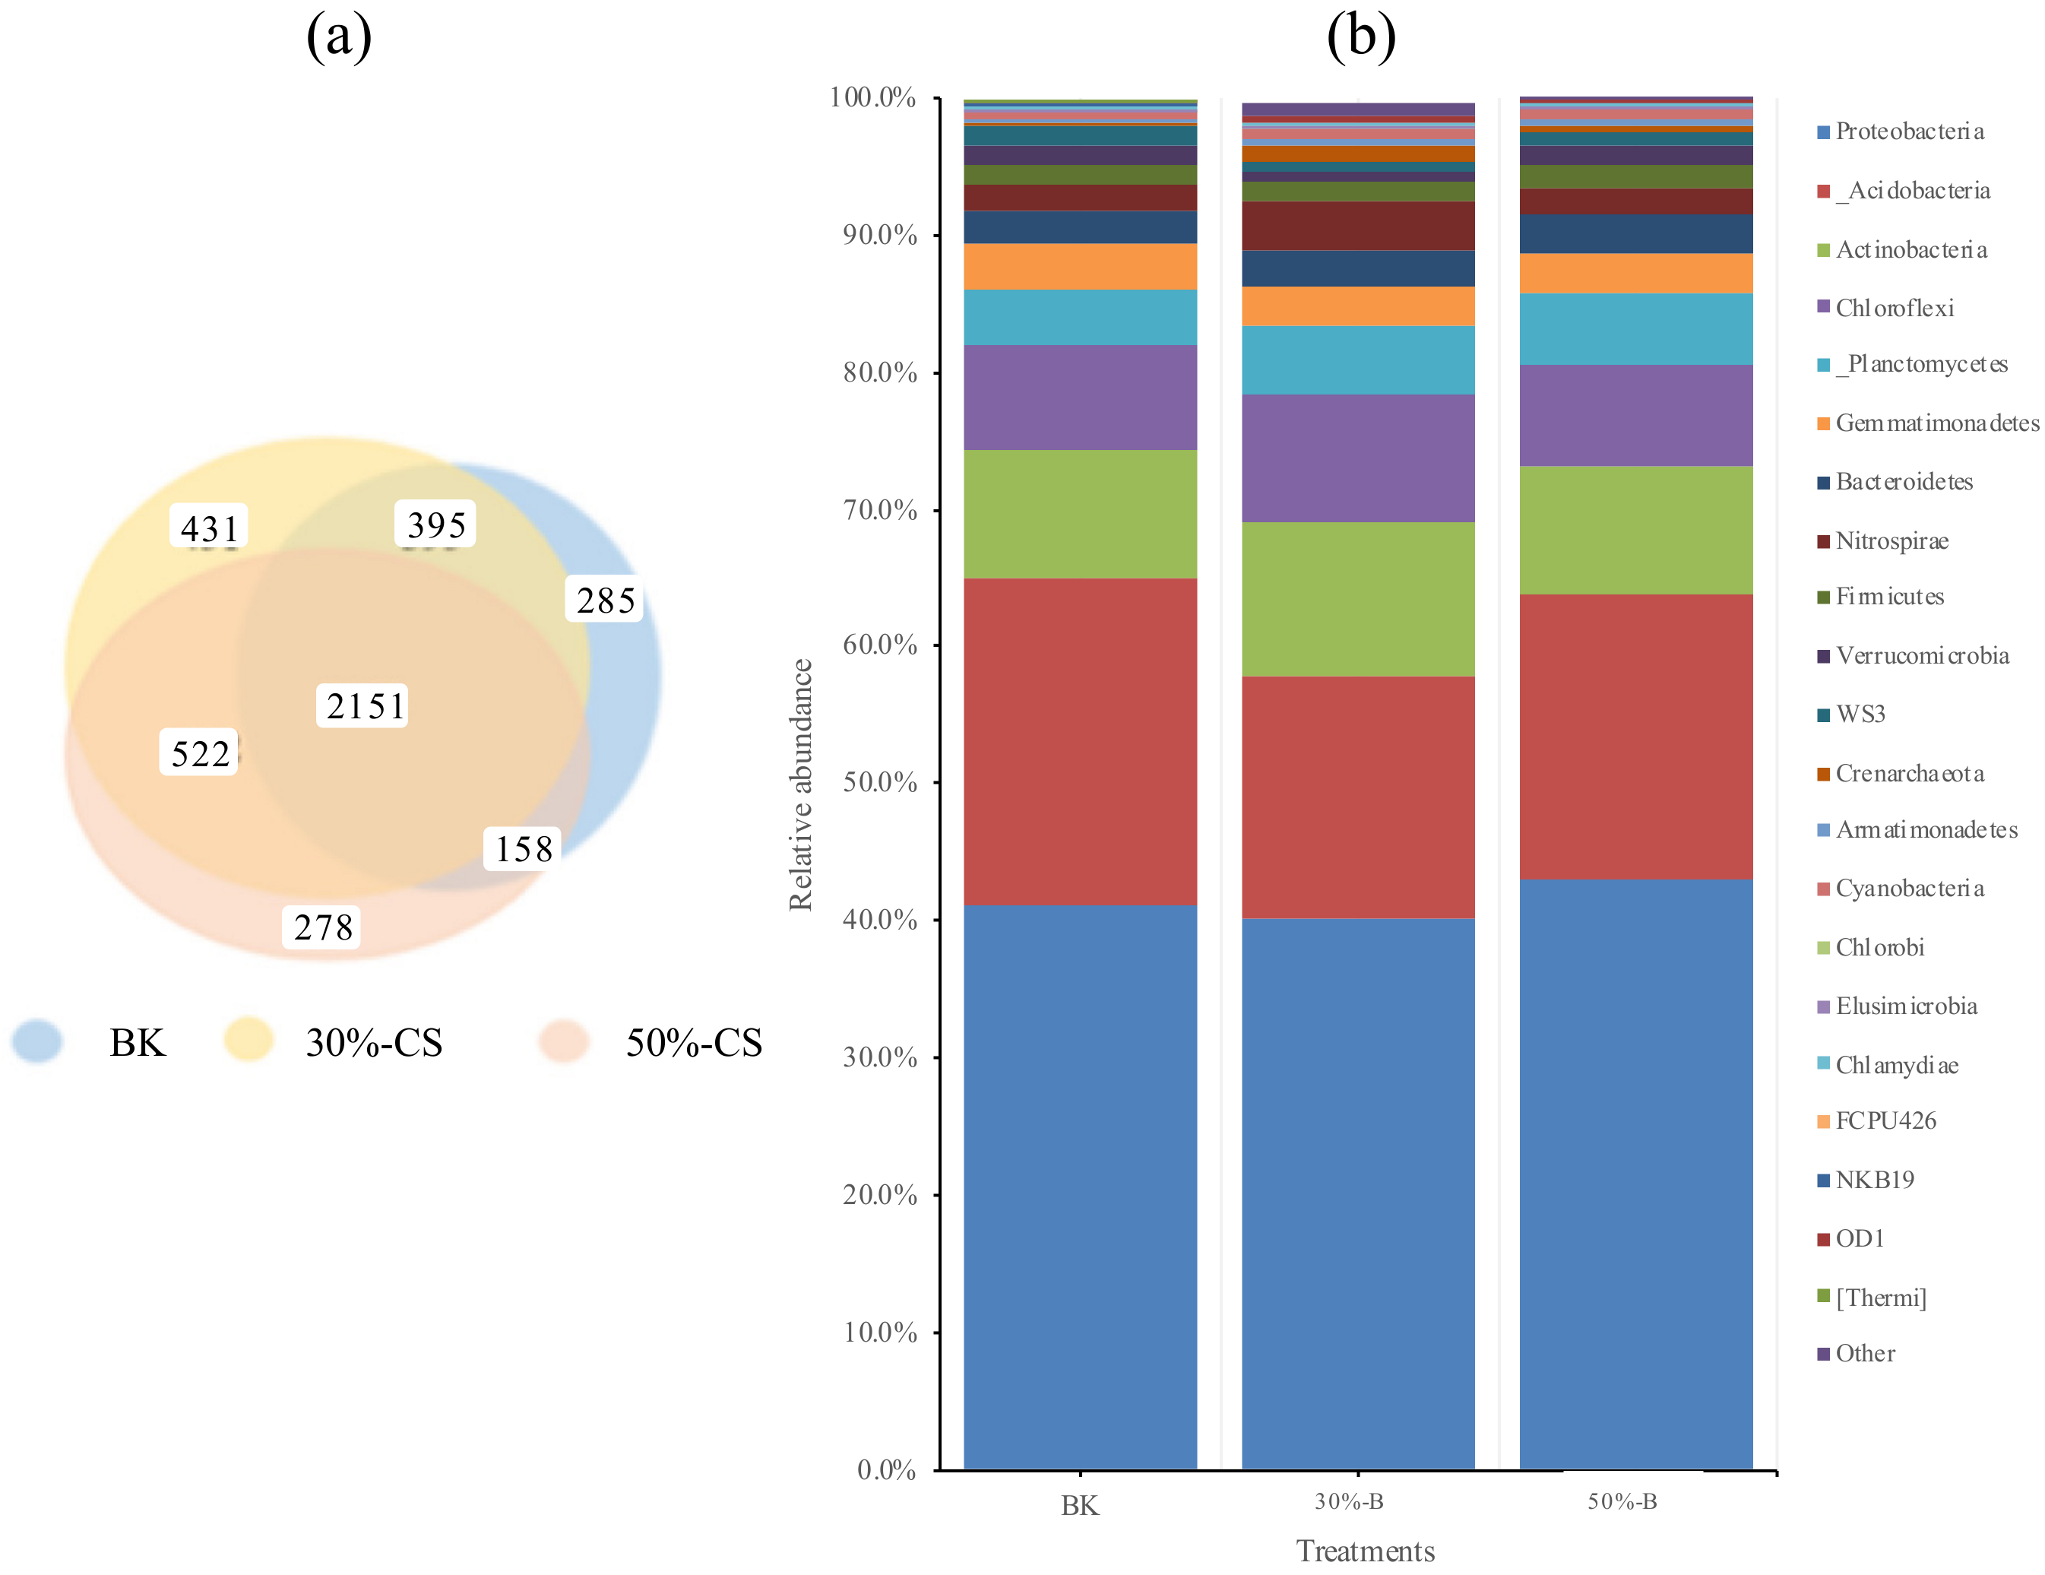
3.4. Response of Soil Microbial Biomass and Community Structure
4. Discussion
4.1. Large-Scale of Biochar Incorporation May Weaken Its Promotion of Plant Growth and CO2 Sequestration in Estuarine Wetland Soil
4.2. The Different Effect of Various Rate of Biochar Incorporation to Estuarine Wetland Soil Was Generated via Soil Microbes with Different Functions
5. Conclusions
Author Contributions
Funding
Institutional Review Board Statement
Informed Consent Statement
Data Availability Statement
Conflicts of Interest
Appendix A

| Treatments | CK | B1 | B2 | B3 | B4 | B5 | |
|---|---|---|---|---|---|---|---|
| TN, mg·kg−1 | May | 2.85 ± 0.03a | 2.56 ± 0.11b | 2.99 ± 0.13b | 3.14 ± 0.09b | 3.57 ± 0.15c | 2.90 ± 0.05b |
| June | 3.01 ± 0.22a | 3.06 ± 0.14a | 3.24 ± 0.22a | 3.17 ± 0.08b | 3.78 ± 0.21c | 3.44 ± 0.13a | |
| July | 3.09 ± 0.12a a | 3.15 ± 0.22a | 3.46 ± 0.23a | 3.47 ± 0.19a | 4.78 ± 0.31a | 3.55 ± 0.17a | |
| Treatments | CK | B1 | B2 | B3 | B4 | B5 | |
|---|---|---|---|---|---|---|---|
| pH | May | 7.21 ± 0.02b | 7.18 ± 0.02b | 7.16 ± 0.01b | 7.05 ± 0.01c | 7.08 ± 002c | 7.25 ± 0.03c |
| June | 7.32 ± 0.04a | 7.19 ± 0.02b | 7.19 ± 0.02b | 7.15 ± 0.01b | 7.28 ± 0.03b | 7.72 ± 0.04a | |
| July | 7.23 ± 0.02 b a | 7.31 ± 0.05 a | 7.35 ± 0.04a | 7.34 ± 0.04 a | 7.42 ± 0.05a | 7.29 ± 0.09c | |
| Items | Soil | B4 | B5 |
|---|---|---|---|
| TC (%) | 2.07 ± 0.098 a | 65.07 ± 9.89 | 41.03 ± 2.71 |
| EOC (%) | 0.74 ± 0.019 | 7.23 ± 1.80 | 36.60 ± 2.15 |
| EOC/TC (%) | 35.56 | 11.12 | 89.21 |

References
- Li, P.; Chen, W.; Han, Y.; Wang, D.; Zhang, Y.; Wu, C. Effects of straw and its biochar applications on the abundance and community structure of CO2-fixing bacteria in a sandy agricultural soil. J. Soils Sediments 2020, 20, 2225–2235. [Google Scholar] [CrossRef]
- Cen, R.; Feng, W.Y.; Yang, F.; Wu, W.Y.; Liao, H.Q.; Qu, Z.Y. Effect mechanism of biochar application on soil structure and organic matter in semi-arid area. J. Environ. Manag. 2021, 286, 112198. [Google Scholar] [CrossRef] [PubMed]
- Barna, G.; Makó, A.; Takács, T.; Skic, K.; Horel, G. Biochar alters soil physical characteristics, arbuscular mycorrhizal fungi colonization, and glomalin production. Agronomy 2020, 10, 1933. [Google Scholar] [CrossRef]
- Li, X.; Wang, T.; Chang, S.X.; Jiang, X.; Song, Y. Biochar increases soil microbial biomass but has variable effects on microbial diversity: A meta-analysis. Sci. Total Environ. 2020, 749, 141593. [Google Scholar] [CrossRef]
- Tian, X.; Wang, L.; Hou, Y.; Wang, H.; Fai, T.Y.; Wu, J.H. Responses of soil microbial community structure and activity to incorporation of straws and straw biochars and their effects on soil respiration and soil organic carbon turnover. Pedosphere 2019, 29, 492–503. [Google Scholar] [CrossRef]
- You, X.; Yin, S.; Suo, F.; Xu, Z.; Liu, L. Biochar and fertilizer improved the growth and quality of the ice plant (Mesembryanthemum crystallinum L.) shoots in a coastal soil of yellow river delta, china. Sci. Total Environ. 2021, 775, 144893. [Google Scholar] [CrossRef] [PubMed]
- Tang, Y.; Gao, W.; Cai, K.; Chen, Y.; Cheng, J. Effects of biochar amendment on soil carbon dioxide emission and carbon budget in the karst region of southwest china. Geoderma 2021, 385, 114895. [Google Scholar] [CrossRef]
- Li, Q.; Liu, S.; Gao, S.; Zhou, X.; Liu, R.; Guan, S. Specified dosages of biochar application not impact native organic carbon but promote a positive effect on native humic acid in humicryepts soil. Sustainability 2021, 13, 6392. [Google Scholar] [CrossRef]
- Xu, X.; Cheng, K.; Hua, W.; Sun, J.; Qian, Y.; Pan, G. Greenhouse gas mitigation potential in crop production with biochar soil amendment-a carbon footprint assessment for cross-site field experiments from china. GCB Bioenergy 2018, 11, 592–605. [Google Scholar] [CrossRef]
- Knoblauch, C.; Hewage, R.S.; Haefele, S.M.; Schrder, N.; Pfeiffer, E.M. Impact of biochar on nutrient supply, crop yield and microbial respiration on sandy soils of northern Germany. Eur. J. Soil Sci. 2021, 16, 1–17. [Google Scholar] [CrossRef]
- Farrell, M.; Macdonald, L.M.; Baldock, J.A. Biochar differentially affects the cycling and partitioning of low molecular weight carbon in contrasting soils. Soil Biol. Biochem. 2015, 80, 79–88. [Google Scholar] [CrossRef]
- Zhang, X.; Dou, S.; Ndzelu, B.S.; Guan, X.W.; Zhang, B.Y.; Bai, Y. Effects of different corn straw amendments on humus composition and structural characteristics of humic acid in black soil. Commun. Soil Sci. Plant Anal. 2020, 51, 107–117. [Google Scholar] [CrossRef]
- Bernal, B.; Mitsch, W.J. Comparing carbon sequestration in temperate freshwater wetland communities. Glob. Chang. Biol. 2012, 18, 1636–1647. [Google Scholar] [CrossRef]
- Christopher, L.O.; Jacob, C.R.; Hans, W.P.; Alexandria, G.H.; Bryce, R.V.D. Lingering Carbon Cycle Effects of Hurricane Matthew in North Carolina’s Coastal Waters. Geophys. Res. Lett. 2019, 46, 2654–2661. [Google Scholar]
- Theocharopoulos, S.P.; Wagner, G.; Sprengart, J.; Mohr, M.E.; Quevauviller, P. Comparative soil sampling in the dornach site (switzerland) for soil three-dimensional pollution description. Sci. Total Environ. 2001, 264, 63–72. [Google Scholar] [CrossRef]
- Yin, Q.X. Study on Enhancement Model of Carbon Sink Function of Chongming Dongtan Reclamation Wetland Based on straw Returning. Ph.D. Thesis, Tongji University, Shanghai, China, 2020. [Google Scholar]
- Han, G.; Luo, Y.; Li, D.; Xia, J.; Xing, Q.; Yu, J. Ecosystem photosynthesis regulates soil respiration on a diurnal scale with a short-term time lag in a coastal wetland. Soil Biol. Biochem. 2014, 68, 85–94. [Google Scholar] [CrossRef]
- Tabatabai, M. Soil enzymes. In Methods of Soil Analysis: Part 2—Microbiological and Biochemical Properties; John Wiley: Hoboken, NJ, USA, 1994; pp. 775–833. [Google Scholar]
- Nakatsu, T.; Ichiyama, S.; Hiratake, J.; Saldanha, A.; Kobashi, N.; Sakata, K.; Kato, H. Structural basis for the spectral difference in luciferase bioluminescence. Nature 2006, 440, 372–376. [Google Scholar] [CrossRef]
- Blair, G.J.; Lefroy, R.D.; Lisle, L. Soil carbon fractions based on their degree of oxidation, and the development of a carbon management index for agricultural systems. Crop Pasture Sci. 1995, 46, 1459–1466. [Google Scholar] [CrossRef]
- Yang, C.; Yang, L.; Ouyang, Z. Organic carbon and its fractions in paddy soil as affected by different nutrient and water regimes. Geoderma 2005, 124, 133–142. [Google Scholar] [CrossRef]
- Hu, Y.; Wang, L.; Fu, X.; Yan, J.; Wu, J.; Tsang, Y.; Le, Y.; Sun, Y. Salinity and nutrient contents of tidal water affects soil respiration and carbon sequestration of high and low tidal flats of Jiuduansha wetlands in different ways. Sci. Total Environ. 2016, 565, 637–648. [Google Scholar] [CrossRef]
- Li, Y.S.; Ding, S.S.; Yin, Q.Y.; Li, J.Y.; Zhou, D.; Liu, G.S. Effect of long-term biochar application on soil respiration in flue-cured tobacco planting fields in Henan province. Environ. Sci. 2019, 40, 916–923. [Google Scholar]
- Laird, D.A.; Fleming, P.; Davis, D.D.; Robert, H.; Wang, B.Q.; Douglas, L.; Karlen, A. Impact of biochar amendments on the quality of a typical Midwestern agricultural soil. Geoderma 2010, 158, 443–449. [Google Scholar] [CrossRef]
- Sun, C.X.; Chen, X.; Cao, M.M.; Li, M.Q.; Zhang, Y.L. Growth and metabolic responses of maize roots to straw biochar application at different rates. Plant Soil 2017, 416, 487–502. [Google Scholar] [CrossRef]
- Grafmueller, J.; Boehm, A.; Zhuang, Y.; Spahr, S.; Mueller, P.; Otto, T.N.; Bucheli, T.D.; Leifeld, J.; Giger, R.; Tobler, M. Wood ash as an additive in biomass pyrolysis: Effects on biochar yield, properties, and agricultural performance. ACS Sustain. Chem. Eng. 2022, 10, 2720–2729. [Google Scholar] [CrossRef]
- Cui, Q.; Xia, J.; Yang, H.; Liu, J.; Shao, P. Biochar and effective microorganisms promote sesbania cannabina growth and soil quality in the coastal saline-alkali soil of the yellow river delta, China. Sci. Total Environ. 2021, 756, 143801. [Google Scholar] [CrossRef] [PubMed]
- Zhao, M.; Lu, X.; Zhao, H.; Yang, Y.; Wan, F. Ageratina adenophora invasions are associated with microbially mediated differences in biogeochemical cycles. Sci. Total Environ. 2019, 677, 47–56. [Google Scholar] [CrossRef]
- Peng, J.; Han, X.; Li, N.; Chen, K.; Yang, J.F.; Zhan, X.M.; Luo, P.Y.; Liu, N. Combined application of biochar with fertilizer promotes nitrogen uptake in maize by increasing nitrogen retention in soil. Biochar 2021, 3, 367–379. [Google Scholar] [CrossRef]
- Borchard, N.; Siemens, J.; Ladd, B.; Möller, A.; Amelung, W. Application of biochars to sandy and silty soil failed to increase maize yield under common agricultural practice. Soil Tillage Res. 2014, 144, 184–194. [Google Scholar] [CrossRef]
- Jin, L.; Wei, D.; Yin, D.W.; Zhou, B.K.; Ding, J.L.; Wang, W.; Zhang, J.M.; Qiu, S.J.; Zhang, C.; Li, Y.; et al. Investigations of the effect of the amount of biochar on soil porosity and aggregation and crop yields on fertilized black soil in northern China. PLoS ONE 2020, 15, e0238883. [Google Scholar] [CrossRef]
- Clough, T.; Condron, L.; Kammann, C.; Müller, C. A review of biochar and soil nitrogen dynamics. Agronomy 2013, 3, 275–293. [Google Scholar] [CrossRef]
- Hagner, M.; Halman, S.; Jauhiainen, L.; Kemppainen, R.; Sari, R.; Tiilikkala, K.; Setaelae, H. Birch (betula spp.) wood biochar is a potential soil amendment to reduce glyphosate leaching in agricultural soils. J. Environ. Manag. 2015, 164, 46–52. [Google Scholar] [CrossRef]
- Zhang, W.; Liang, C.; Kao-Kniffin, J.; He, H.; Xie, H.; Zhang, H.; Zhang, X. Differentiating the mineralization dynamics of the originally present and newly synthesized amino acids in soil amended with available carbon and nitrogen substrates. Soil Biol. Biochem. 2015, 85, 162–169. [Google Scholar] [CrossRef]
- Hu, L.N.; Li, S.L.; Li, K.; Huang, H.Y.; Wan, W.X.; Huang, Q.H.; Li, Q.Y.; Li, Y.; Deng, H.; He, T.; et al. Effects of Two Types of Straw Biochar on the Mineralization of Soil Organic Carbon in Farmland. Sustainability 2020, 12, 10586. [Google Scholar] [CrossRef]
- Xie, G.X.; Zhang, M.K. Influence of biochar application on mineralization and fractions of organic carbon in red soils with different land use. Chin. J. Soil Sci. 2014, 2, 163–169. [Google Scholar]
- Davidson, E.A.; Samanta, S.; Caramori, S.S.; Savage, K. The Dual Arrhenius and Michaelis-Menten kinetics model for decomposition of soil organic matter athourly to seasonal time scales. Glob. Chang. Biol. 2021, 18, 371–384. [Google Scholar] [CrossRef]
- Panico, S.C.; Esposito, F.; Memoli, V.; Vitale, L.; Polimeno, F.; Magliulo, V.; Maisto, G.; DeMarco, A. Variations of agricultural soil quality during the growthstages of sorghum and sunflower. Appl. Soil Ecol. 2020, 152, 103569. [Google Scholar] [CrossRef]
- Li, Y.; Zhang, L.; Fang, S.; Tian, Y.; Guo, J. Variation of soil enzyme activity and microbial biomass in poplar plantations of different genotypes and stem spacings. J. For. Res. 2018, 29, 963–972. [Google Scholar] [CrossRef]
- Tomar, U.; Baishya, R. Seasonality and moisture regime control soil respiration, enzyme activities, and soil microbial biomass carbon in a semi-arid forest of delhi, india. Ecol. Process. 2020, 9, 50–63. [Google Scholar] [CrossRef]
- Yang, K.; Zhu, J.; Zhang, M.; Yan, Q.; Sun, O.J. Soil microbial biomass carbon and nitrogen in forest ecosystems of Northeast China: A comparison between natural secondary forest and larch plantation. J. Plant Ecol. 2008, 3, 175–182. [Google Scholar] [CrossRef]
- Ding, Y.; Liu, Y.; Liu, S.; Huang, X.; Zhongwu, L.I.; Tan, X.; Zeng, G.; Zhou, L. Potential benefits of biochar in agricultural soils: A review. Pedosphere 2017, 27, 645–661. [Google Scholar] [CrossRef]
- Sagrilo, E.; Jeffery, S.; Hoffland, E.; Kuyper, T.W. Emission of CO2 from biochar amended soils and implications for soil organic carbon. GCB Bioenergy 2014, 7, 1294–1304. [Google Scholar] [CrossRef]
- Siedt, M.; Schaffer, A.; Smith, K.E.C.; Nabel, M.; Nickoll, M.R.; Dongen, J.T.V. Comparing straw, compost, and biochar regarding their suitability as agricultural soil amendments to affect soil structure, nutrient leaching, microbial communities, and the fate of pesticides. Sci. Total Environ. 2020, 751, 141607. [Google Scholar] [CrossRef] [PubMed]
- Alami, M.; Xue, J.Q.; Ma, Y.T.; Zhu, D.Y.; Gong, Z.D.; Shu, S.H.; Wang, X.K. Diversity structure, diversity, and composition of bacterial communities in rhizospheric soil of coptis chinensis franch under continuously cropped fields. Diversity 2020, 12, 57. [Google Scholar] [CrossRef]
- Stroobants, A.; Degrune, F.; Olivier, C.; Muys, C.; Roisin, C.; Colinet, G.; Bodson, B.; Portetelle, D.; Vandenbol, M. Diversity of bacterial communities in a profile of a winter wheat field: Known and unknown members. Microb. Ecol. 2014, 68, 822–833. [Google Scholar] [CrossRef] [PubMed]
- Kausar, H.; Sariah, M.; Saud, H.M.; Alam, M.Z.; Ismail, M.R. Isolation and screening of potential actinobacteria for rapid composting of rice straw. Biodegradation 2011, 22, 367–375. [Google Scholar] [CrossRef] [PubMed]
- Fierer, N. Embracing the unknown: Disentangling the complexities of the soil microbiome. Nat. Rev. Microbiol. 2017, 15, 570–590. [Google Scholar] [CrossRef] [PubMed]
- Lipczynska-Kochany, E. Humic substances, their microbial interactions and effects on biological transformations of organic pollutants in water and soil: A review. Chemosphere 2018, 202, 420–437. [Google Scholar] [CrossRef]
- Joo, S.J.; Zhang, S.; Choi, K.J.; Lee, S.M.; Hwang, S.J. Effects of sodium bicarbonate as an inorganic carbon source on the growth of Scenedesmus dimorphus. J. Hist. Med. Allied Sci. 2014, 28, 555–560. [Google Scholar]
- Li, X.; Meng, D.; Li, J.; Yin, H.; Liu, H.; Liu, X.; Cheng, C.; Xiao, Y.; Liu, Z.; Yan, M. Response of soil microbial communities and microbial interactions to long-term heavy metal contamination. Environ. Pollut. 2017, 231, 908–917. [Google Scholar] [CrossRef]
- Adaikpoh, B.I.; Akbar, S.; Albataineh, H.; Misra, S.K.; Stevens, D.C. Myxobacterial response to methyljasmonate exposure indicates contribution to plant recruitment of micropredators. Front. Microbiol. 2020, 11, 34. [Google Scholar] [CrossRef]
- Li, X.X.; Yu, Y.; Choi, L.; Song, Y.L.; Wu, M.H.; Wang, G.J.; Li, M.S. Phenylobacterium soli sp. nov., isolated from arsenic and cadmium contaminated farmland soil. Int. J. Syst. Evol. Microbiol. 2019, 69, 1398–1403. [Google Scholar] [CrossRef] [PubMed]
- Zhao, L.L.; Zhang, C.F.; Sun, C.H.; Liu, S.W.; Jing, Y.Q. Herbihabitans rhizosphaerae gen. nov. sp nov., a member of the family Pseudonocardiaceae isolated from rhizosphere soil of the herb Limonium sinense (girard). Int. J. Syst. Evol. Microbiol. 2016, 66, 4156–4161. [Google Scholar]
- Zhang, W.W.; Wang, C.; Xue, R.; Wang, L.J. Effects of salinity on the soil microbial community and soil fertility. J. Integr. Agric. 2019, 18, 1360–1368. [Google Scholar] [CrossRef]


| Treatments | Sequences | OTUs d | Chao | ACE | Shannon |
|---|---|---|---|---|---|
| CK a | 50,923 | 2989 | 3808.92 | 3901.23 | 9.85 |
| B4 b | 67,765 | 3499 | 3972.07 | 3933.15 | 9.94 |
| B5 c | 70,645 | 3109 | 4067.59 | 4099.58 | 10.08 |
Disclaimer/Publisher’s Note: The statements, opinions and data contained in all publications are solely those of the individual author(s) and contributor(s) and not of MDPI and/or the editor(s). MDPI and/or the editor(s) disclaim responsibility for any injury to people or property resulting from any ideas, methods, instructions or products referred to in the content. |
© 2023 by the authors. Licensee MDPI, Basel, Switzerland. This article is an open access article distributed under the terms and conditions of the Creative Commons Attribution (CC BY) license (https://creativecommons.org/licenses/by/4.0/).
Share and Cite
Xie, M.; Lu, X.; Wang, H.; Fu, X.; Wang, L. Large-Scale Biochar Incorporation Does Not Necessarily Promote the Carbon Sink of Estuarine Wetland Soil. Sustainability 2023, 15, 16709. https://doi.org/10.3390/su152416709
Xie M, Lu X, Wang H, Fu X, Wang L. Large-Scale Biochar Incorporation Does Not Necessarily Promote the Carbon Sink of Estuarine Wetland Soil. Sustainability. 2023; 15(24):16709. https://doi.org/10.3390/su152416709
Chicago/Turabian StyleXie, Mengdi, Xiaojuan Lu, Han Wang, Xiaohua Fu, and Lei Wang. 2023. "Large-Scale Biochar Incorporation Does Not Necessarily Promote the Carbon Sink of Estuarine Wetland Soil" Sustainability 15, no. 24: 16709. https://doi.org/10.3390/su152416709