Article

Can Docked Bike-Sharing Systems Reach Their Dual Sustainability in Terms of Environmental Benefits and Financial Operations? A Comparative Study from Nanjing, 2017 and 2023

1
School of Mathematical Sciences, Nanjing Normal University, Nanjing 210023, China
2
Jiangsu Province Engineering Research Center of Spatial Big Data, School of Mathematical Sciences, Nanjing Normal University, Nanjing 210023, China
3
Institute of Carbon Neutrality Development, Jiangsu University, Zhenjiang 212013, China
*
Author to whom correspondence should be addressed.
Sustainability 2023, 15(24), 16738; https://doi.org/10.3390/su152416738
Submission received: 17 November 2023 / Revised: 5 December 2023 / Accepted: 7 December 2023 / Published: 11 December 2023

Abstract

:
In this paper, we investigate the sustainability of docked bike-sharing in Nanjing in terms of environmental benefits and financial operations by comparing the data of March 2017 and March 2023 in Nanjing. We modify a community detection method, give and prove dynamic boundary conditions for the objective function of the heuristic algorithm, and realize the estimation of the rebalancing coefficients for this mega-system, thus obtaining more accurate emission factors. We find that there are significant differences in the results obtained from environmental benefit assessments over time. Further, there are also significant differences at the national level. This may signify that the assessment data of one country’s system cannot give a direct reference for another country’s system. Second, we considered the economic basis required for the environmental benefits of docked bike-sharing systems. We have calculated the sustainability of the system’s financial operations by considering its revenues over the next nine years, including the cost of facility inputs, facility upgrades, dispatching costs, labor costs, maintenance costs, and the time value of money. The results show a 4.6-fold difference in emission factors between 2017 and 2023; comparing 2017 to 2023 (when demand loss has been severe), the investment in 2017 will be recouped 2 years later than in 2023. Switching distribution vehicles from fuel vehicles to electric trikes would severely deteriorate the operator’s key financial metrics while only reducing the emission factor value by 8.64 gCO 2 eq/km, leading to an unsustainable system. This signals the potential for the financial unsustainability, or even bankruptcy, of operators if the requirements for sustained emissions reductions from the bike-sharing system are divorced from the form of the economy on which it is sustainably operated. Finally, we consider the geographical patterns between environmental benefits and financial operations. We find that financial sustainability varies across geographic locations. Under financial sustainability, we gave emission factors under the mix distribution vehicle scenario.

1. Introduction

Bike-sharing systems have grown rapidly in recent years and are considered important in reducing CO 2 emissions [1]. Bike-sharing is considered to play a role in encouraging people to participate in energy saving and emission reduction [2]. It promotes green transportation and contributes significantly to carbon neutrality [3]. One study showed that Shanghai reduced 25,240 tons of CO 2 emissions due to the use of bike-sharing in 2016 alone [4].
Docked bike-sharing systems are station-based, and they place bicycles in a network of stations and docks built throughout the city for users to pick up and use [5]. Nanjing’s docked bike-sharing system was established in 2015 [6], and those using the docked bike-sharing system must rent bicycles from designated stations and then return them to docks at other bicycle stations [7]. In China, docked bike-sharing systems are built and operated by the government, so in most cities, docked bicycles can be used for free for 30 to 45 min [8]. The variables used in this paper and their corresponding interpretations can be viewed in the Abbreviations section.

1.1. Research Background

Currently, there are more studies on environmental benefit assessments based on bike-sharing systems. The very first study was based on the USA docked and dockless bike-sharing systems [9,10,11,12]. In contrast, the study by Chen et al. on a dockless bike-sharing system in Beijing demonstrated completely different emission ratios than the above studies, especially regarding the rebalancing component [2]. This suggests that bike-sharing systems vary from country to country, which can affect the potential environmental benefits, and thus case studies in different contexts are necessary for reliable estimation [13]. In addition, there may be significant differences for different periods for the same bike-sharing system. For example, Wang et al. obtained significantly different emission factors by modeling seven different development stages of dockless bike-sharing in Beijing [14].
The entire life cycle of a shared bicycle includes multiple stages [13]. At present, there is no standardized methodology for assessing the overall impact of the bike-sharing system [15]. However, it mainly includes the production, use, management, and end-of-life of the infrastructure of the bike-sharing system [13], as well as the rebalancing operation and maintenance of the bike-sharing system [12]. Similarly, fewer studies include non-subjective estimates of rebalancing operations in the assessment of the entire life cycle of a shared bicycle [12]. In addition, the study that included real rebalancing operations focused on a bike-sharing system located in New York City, USA [12] The results cannot be used directly because the rebalancing method, user habits, and distance distribution of stations are quite different from those of bike-sharing in China. As a result, there are fewer results for evaluating large-scale bike-sharing systems in China that include real rebalancing operations. In this paper, the rebalancing coefficients we obtain are quite different from those given in other studies [2,11]. Moreover, there are also large differences between the rebalancing coefficients in different periods. Further, few studies comparatively assess the environmental benefits of the operation of shared bicycles in different periods. Moreover, most of the existing studies focus on the environmental benefits of bike-sharing systems and give policy recommendations based on the assessment results, and very few studies consider the economic basis required for their environmental benefits. If the sustainable emission reduction requirements of the bike-sharing system are detached from the economic form on which its orderly operation is based, leading to the financial unsustainability of the operator, the ultimate result may be the disappearance of the whole system; thus, retracting the emission reduction effect it has already achieved. Therefore, we assess the environmental benefits along with the financial and operational benefits for comparison.

1.2. Research Questions

This paper focuses on the following issues. First of all, this paper wants to construct an environmental benefit assessment of a large-scale bike-sharing system containing real rebalancing operations suitable for Nanjing. Second, this paper seeks to investigate whether docked bike-sharing systems can achieve financial operational sustainability while pursuing their environmental benefits, i.e., to consider the economic basis for the environmental benefits of docked bike-sharing systems. Finally, we want to find out if studies on the emission factors of bike-sharing systems differed at the national or city level.

1.3. Research Gaps Filled

In the research of this paper, we found that the results obtained from the environmental benefit assessment in different periods are significantly different, which is ignored by previous studies. Further, prior studies have focused only on the environmental benefits of the bike-sharing system, and few studies have considered the economic basis for the environmental benefits. The requirements for sustained emissions reductions from a bike-sharing system that are divorced from the form of the economy on which it is sustainably operated may lead to financial unsustainability or even bankruptcy for the operator. The research in this paper examines the environmental benefits of docked bike-sharing systems against the economic basis on which they are required to operate, giving more comprehensive advice. Based on this, we wanted to understand if there is a geographical pattern to the cut-off between environmental benefits and financial operations. Thus, we discussed it again in different communities. The results show that in different geographical locations, the system has different profit or loss results. More emission reductions can be achieved with financial sustainability by using a mixed distribution vehicle program. Finally, we concluded by comparing existing studies and found significant differences at the national level. This may indicate that the evaluation data of one country’s system cannot be directly referenced for another country’s system. Based on the above study, we give recommendations for the operation of the docked bike-sharing system in Nanjing.

1.4. Contributions of This Paper

The main contributions of this paper are as follows. First, we demonstrate dynamic boundary conditions for the objective function of the heuristic algorithm to estimate the rebalancing coefficients of the mega-system. Second, we calculated the sustainability of the system’s financial operations by considering its revenues over the next nine years, including facility input costs, facility renewal costs, dispatch costs, labor costs, maintenance costs, and the time value of money. Third, we considered the impact of switching to a distribution vehicle that is considered more environmentally friendly on its environmental performance as well as its financial position to analyze the feasibility of further emission reductions. We have also explored geographic patterns between environmental benefits and financial operations, proposing mixed distribute vehicle programs that can balance the financial sustainability of the operator with further emission reductions. Finally, we give recommendations based on the differences in the comparisons with other studies as well as the conclusions of this paper.

1.5. Literature Review

Bike-sharing programs have positive externalities [16]. If 75% of the distance traveled by shared bicycles in 2015 had been caused by the substitution of cars, the CO 2 emissions from road traffic in Beijing would have been reduced by nearly 616,040 tons [16]. In an assessment of shared bicycle use in Shanghai, it was obtained that 25,240 tons of CO 2 emissions was reduced in 2016 alone due to shared bicycle use [4]. An assessment of bike-sharing use in New York City also showed that between 2014 and 2017, the bike-sharing system reduced emissions by a total of 30,070 tons of carbon dioxide [17].
There are two types of bike-sharing systems: dockless bike-sharing systems and docked bike-sharing systems. They both have their user groups, with more than 40% of users only using one or the other [18]. As a member of public transportation, studies have pointed out that they can compete with subway travel in certain areas and periods [19]. Cycling distance, the number of commercial points of interest, metro ridership, and the distance to downtown are important variables in its integration with public transportation such as the metro [20]. And people use bike-sharing services regularly during COVID-19 outbreaks [21].
For a docked bike-sharing system, infrastructure such as stations need to be established to provide services. Station density is an important positive factor for docked bike-sharing users to choose their destinations [22]. Chen et al. gave a three-phase framework to determine the location of new bike stations [23]. There are also studies using smartphone GPS data for station location design [24,25]. Kuo et al. stated that for docked bike-sharing systems, it should not simply be a matter of installing more stations, but the focus should be on the overall improvement of service quality [26]. Docked bike-sharing users are more likely to ride farther than dockless bike-sharing users [27]. The distance traveled in a docked bike-sharing system follows a strong power law distribution [28]. There is a cyclical pattern in their travel demand [29]. Among the user groups, the proportion of elderly people is positively correlated with the use of docked bike-sharing [7].
Rebalancing is a very important activity for a bike-sharing system. Typically, the rebalancing process of a bike-sharing system can be described using a mixed integer linear programming model [30]. Rebalancing is more of a response to morning and afternoon usage demand exceeding station capacity [31], and that demand can be stochastic [32] and needs to be described using, for example, a Markov process [33,34]. Typically, rebalancing algorithms are designed to operate on stations with high demand by splitting the station [35,36]. Most of the rebalancing models use heuristic algorithms for their solution process [37]. For example, algorithms such as large neighborhood search algorithms, tabu search algorithms, and simulated annealing methods are used [38,39,40]. The solution time of these algorithms is positively correlated with their search capability [41]. At the same time, to impose some additional constraints on the rebalancing process, it may be necessary to design multi-objective optimization algorithms to encapsulate the impact of these constraints [34,42]. In recent years, with the continuous development of machine learning technology, data-driven machine learning methods have been gradually applied to the optimization and solution process of rebalancing models [43,44]. However, the rebalancing process has many problems and challenges waiting to be solved [45].
Environmental life cycle assessment (LCA) has developed rapidly over the past three decades [46]. It is used in a variety of disciplines, such as construction [47,48,49], food supply [50], chemicals [51], waste [52], and bioenergy [53]. LCA also has a wide range of applications in the transportation sector. It is used to assess emissions from vehicles such as buses [54,55], subways [56], and electric vehicles [57]. It has even been used in emission studies for the passenger transport sector [58] or the entire urban transportation system [59]. For shared transportation, it is used in bike-sharing [60,61,62], car-sharing [63,64], scooter-sharing [65,66] and e-bike-sharing [67,68].
Zheng et al. noted that bike-sharing is currently an environmentally friendly practice as it achieves environmental benefits on all metrics except metal consumption [61]. The promotion of bike-sharing can significantly reduce life cycle greenhouse gas emissions in the transportation sector [60]. And the dockless bike-sharing system in Nanjing has been shown to obtain an emission reduction of 63.726 gCO 2 /eq/pkm [62]. For the calculation of the emission factor of the bike-sharing system, a life cycle assessment was given by Bonilla et al. through the simulation data of the docked bike-sharing system and the dockless bike-sharing system [10]. Luo et al. considered the impacts caused by rebalancing in their life cycle assessment of docked bike-sharing systems and dockless bike-sharing systems in the United States [11]. Their rebalancing data for the dockless bike-sharing system was estimated based on the docked bike-sharing system, and they found that the main contribution of carbon emissions from bike-sharing was in the rebalancing phase. Kou et al. found that the bike-sharing system in the United States could only reduce less than 0.1% of the greenhouse gas (GHG) emissions from the transportation sector through their assessment [69]. Chen et al. analyzed the full life cycle emissions of the dockless bike-sharing system of China’s ofo dockless bike-sharing company and found that the main contribution of carbon emissions from shared bicycles is in the production stage [2]. Mao et al. similarly assessed the full life cycle of shared bicycles in China and found that the production stage brings the greatest environmental impact, and its average contribution to the environmental impact is as high as 81.18% [13]. Specifically, in Beijing, Wang et al. found in their assessment of the environmental benefits of dockless shared bicycles that they can obtain the desired environmental benefits with effective management [14]. Finally, Chen et al. give the environmental benefits of shared bicycles in New York City based on realistically calculated rebalancing data [12]. Table 1 gives a comparison between these studies.

1.6. Article Structure

The remainder of the paper is structured as follows. Section 2 covers materials and methods. Section 3 is the results. Section 4 is the discussion. Section 5 is the conclusion of the paper.

2. Materials and Methods

2.1. Data Description

In recent years, bike-sharing systems have become increasingly popular in cities around the world, where they play an important role in reducing air pollution and increasing sustainable transportation options in cities [60,70]. In cities with large populations, long average commute times, and frequent use of public transportation, bike-sharing can have a greater impact on reducing air pollution than in cities with smaller populations [71]. It significantly reduces commuting time and increases accessibility to work on a personal and spatial level [72]. In an area with a well-developed bicycle infrastructure, bicycles may be faster than other modes of transportation [73]. The freedom of bicycle parking makes it easy for residents and factory workers to use bicycles, leading to a high demand for the use of bike-sharing in residential and industrial areas [3]. Bike-sharing is considered a convenient way to solve the “last mile” problem and connect users to the public transportation network [74]. Further, during the COVID-19 pandemic, bike-sharing was considered to be a mode of transportation with a lower risk of infection [75].
Nanjing is located in China’s Jiangsu Province, on the lower reaches of the Yangtze River, and is an important central city in eastern China, a nationally important research and education base, and a comprehensive transportation hub, with a current resident population of nearly 9.5 million. Nanjing began offering docked bike-sharing services in 2016. The data used in this paper are records of docked bike-sharing usage in Nanjing in 2017 as well as in 2023. The data contain information such as the time of borrowing and returning the bicycles, the station, and the serial numbers of the bicycles. In this section, data from March 2017 as well as March 2023 are used as examples to show the basic condition of the docked bike-sharing system in Nanjing.
Figure 1 gives a comparison of the use of docked shared bicycles in Nanjing over time. Figure 1a shows that the total daily mileage of Nanjing’s docked bike-sharing system can reach two to five times as high in March 2017 as it did in March 2023. There were 5178 more docked shared bicycles in Nanjing in March 2017 than in March 2023, but both were located in the range of 30,000 to 40,000 bicycles. In addition, the number of stations in the docked bike-sharing system in Nanjing has increased by 386 in 6 years. Figure 1b gives the same conclusion as Figure 1a. The increase in the number of stations has not resulted in more frequent user use of the Nanjing docked bike-sharing system; on the contrary, there is two to five times less user demand for Nanjing docked bike-sharing in March 2023, seven years after the system was in operation, than in March 2017, the initial year of the system’s operation. There is also a slight difference in the average cycling distance given in Figure 1c. Interestingly, the average distance per ride for users of docked bike-sharing in Nanjing is about 200 m shorter in March 2023, six years later, than in March 2017, six years ago. However, this may be due to COVID-19 epidemics or weather, for example. The average daily turnover per bicycle (the average number of times each bicycle is used per day) has changed from the original 3 to 4 times in March 2017 to about 1 time in March 2023, as shown in Figure 1d. Figure 1e shows that users also spent about 2 min less on average per ride in March 2023 than they did in March 2017. All of the above facts indicate a serious loss of user demand for the docked bike-sharing system in Nanjing. Its user demand has had a cliff-like decline compared to the early stage of the system construction, even though the number of station placements has been growing during these six years.
Figure 2 gives the distribution of the average daily mileage traveled and the number of rides along with the cycling distance for the docked bike-sharing system in Nanjing. From Figure 2a, we can find that the peak of the number of rides occurs at trips ranging from 500 m to 2000 m, regardless of the period.
Moreover, the total distance cycled in different intervals in March 2023 has a similar shape to the March 2017 distribution. However, there is a difference in the comparison of the number of rides in different cycling distance intervals given in Figure 2b. In March 2017, the peak of the number of rides was concentrated in the interval between 500 m and 1000 m, followed by a rapid decrease. In contrast, in intervals greater than 5000 m, the number of rides was approximately the same as in the 3500 to 4000-m interval. However, in Figure 2a, this interval contributes about 770 million kilometers of total cycling distance per month, which is the same as the 2000 to 2500-m interval. Conversely, come March 2023, there is a large change in the shape of the peak and distribution of the ridership. As can be seen in Figure 2b, the peak in cycling trips is in the interval of less than 500 m of cycling distance. Subsequently, the number of rides declined rapidly. This indicates that people’s cycling habits have changed during these 6 years. In March 2023, not only the demand loss of Nanjing’s docked bike-sharing system is severe, but people’s cycling distance is also shorter and shorter, which corroborates with Figure 1c. Over the past six years, the share of shared bicycles in the “last mile” of less than one kilometer rides in Nanjing has increased by 9% compared to the total range. Given this dramatic change, perceptions of Nanjing’s docked bike-sharing system, such as its sustainability in terms of CO 2 emissions and system profitability, may need urgent change.

2.2. Life Cycle Emission Factors for Docked Bike-Sharing System

Docked bike-sharing systems are considered to have positive benefits in terms of reducing carbon dioxide produced by the transportation sector [76]. Life Cycle Assessment (LCA) provides a means to ensure the avoidance of shifting the burden of greenhouse gas (GHG) emissions by evaluating the use of natural resources by the docked bike-sharing system and their environmental, economic, and social impacts throughout their life cycle [77]. The life cycle carbon emissions of each docked shared bicycle include the total carbon emissions resulting from its four phases: manufacturing, operation, maintenance, and end-of-life [14]
E b i k e l i f e c y c l e = E b i k e M a n u f a c t u r i n g + E b i k e M a i n t e n a n c e + E b i k e O p e r a t i o n + E b i k e S c r a p + E s t a t i o n .
In this case, each station has both station and dock instruments, i.e.,
E s t a t i o n = E ^ s t a t i o n + E d o c k .
E b i k e O p e r a t i o n , on the other hand, is closely related to the rebalancing of the docked bike-sharing system in Nanjing and is given by the following equation:
E b i k e O p e r a t i o n = 1 f r e b a l a n c i n g × d r i d e × E v e h i c l e ,
where d r i d e is the total docked shared bicycle cycling distance corresponding to the life cycle assessment period and E v e h i c l e corresponds to the emission factor of the distribution vehicle. And f r e b a l a n c i n g is the rebalancing coefficient, whose approximation is given as follows:
f r e b a l a n c i n g d r i d e t d r e b a l a n c i n g t ,
where d r e b a l a n c i n g t is the exact total rebalancing distance in period t and d r i d e t is the total cycling distance of docked shared bicycles in period t. Equation (4) approximates the rebalancing coefficient using the average rebalancing distance corresponding to each unit of cycling distance during period t to approximate the rebalancing mileage during the life cycle assessment.
Specifically, the life cycle emission factor for the docked bike-sharing system is
E l i f e c y c l e b i k e = d r i d e f r e b a l a n c i n g E v e h i c l e + n b i k e E b i k e M a n u f a c t u r i n g + E b i k e S c r a p B l + E b i k e M a i n t e n a n c e + n d o c k E d o c k + n s t a t i o n E ^ s t a t i o n L F s t a t i o n d r i d e ,
where n b i k e , n d o c k , and n s t a t i o n represent the number of bicycles, docks, and stations, respectively, and B l represents the life expectancy of bicycles.

2.3. Rebalancing Coefficient

It has been shown that user demand for the docked bike-sharing system is uneven [78,79]; thus, rebalancing is necessary. For large-scale systems such as the docked bike-sharing in Nanjing, most of the existing studies have divided them into zones and then dispatched them [79].

2.3.1. Zoning for Rebalancing

Community detection algorithms are widely used for zoning in bike-sharing systems [79,80,81]. Community detection is a large research area in complex networks, and many methods have been proposed in recent years. The well-known modularity methods are often used. However, even the directed modularity method has its weaknesses, i.e., it cannot detect the direction of the edges correctly. Moreover, it cannot detect patterns in the network [82]. In addition, we need to find an algorithm that can specify the number of communities in advance since the bike-sharing company may have pre-determined the number of dispatch zones. Therefore, an EM-based community detection algorithm seems to fit the bill [83]. However, the algorithm is only suitable for use in some unweighted directed networks, whereas if the usage data of Nanjing’s docked bike-sharing system is constructed as a complex network, it is a directed weighted network. In this section, we will modify this community detection method to make it applicable to our goal of zoning and rebalancing.
Let ω i j denote the weighted adjacency matrix of the graph G with n nodes and a i j denote the unweighted adjacency matrix of the graph G with n nodes. We change a i j to ω i j in the iterative formula in the original model to obtain the following iterative formula:
π r = 1 n i q i r ,
θ r j = i ω i j q i r i k i q i r ,
q i r = π r j θ r j ω i j s π s j θ s j ω i j ,
where c denotes the number of communities. θ r j is the probability that a node in community r has a link pointing to node i, and π r is the probability that a node is in community r when it is randomly selected in the network. q i r denotes the probability that a node i belongs to community r, and k i is the out-degree of node i. To obtain the final result of community detection, we need to iterate Equations (6)–(8).
To apply this method to the complex network of Nanjing’s docked bike-sharing system, we define ω i j as the weighted adjacency matrix of the network, where the weights of the edges denote the number of borrowed bicycles. Specifically, the weight of an edge from node i to node j plus 1 indicates that a person borrowed a bicycle from station i and returned it at station j. There is a possibility that a person borrowed a bicycle from station i and returned it at station i.
However, there are two problems with the above-proposed method. Let us assume that in a given network G, there is a node j that has only out-degree but no in-degree. This is a common situation that exists in many networks, in which case θ r j will yield 0, which means that none of the communities will have connected edges pointing to node j from their nodes. Then in the next iteration step, q i r will yield 0 and the iteration process will collapse. This is because some nodes give connected edges with probability 0, which contradicts the assumptions of the method. The method assumes that the probability of each node belonging to each community is independent of other nodes. However, if the probability is 0, this means that it is no longer independent. Essentially, this method uses the most basic idea in probability theory, which is to express probability in terms of frequency. However, it is a fact that a frequency equal to 0 does not mean that the probability is equal to 0. Therefore, we rewrite Equation (7) as
θ r j = i ω i j q i r i k i q i r , i f i ω i j 0 ε , o t h e r w i s e ,
where ε is a very small positive random number close to 0.
The second issue concerns weights. Although the method proposed above does not have theoretical problems, it may have computational problems. In a complex network constructed from the usage data of docked bike-sharing systems, a few nodes will have very large weights while others will have much lower weights, as shown in Figure 3, due to the uncertainty of their user requirements. This will make j θ r j ω i j very small; sometimes, the software may treat it as 0. Moreover, large weights dilute the importance of small weights because there is an order of magnitude difference between the weights, which can be found in the double logarithmic coordinate system in Figure 3. However, there are more nodes with small weights that also play an important role in the network. Therefore, we consider adjusting the weight of each node to make it more balanced. f x denotes the down-weighting function. f x must have the good property of being able to reduce the weight of each node to a finite interval a , b . Let i be the node with the largest weight and j be the node with the smallest weight (except 0). a, b must satisfy
f ω i = b , f ω j = a .
Also, b a must not be very large and all the weights must be evenly distributed in it. Apart from this, the definition of f x needs to be given according to the properties of the network and the problem faced. For example, if the weight gap between each node is large and almost all the nodes play an important role in the network and hence cannot be ignored, f x needs to be defined to narrow the gap. On the contrary, if the weight gap between each node is very small, or the weights are all close to 1, then f x needs to be defined to widen the gap and thus differentiate it from the unweighted network. Note that defining f x as a normalization process is inappropriate here. This is because it will not solve the computational problems described above. Moreover, large weights would make small weights less important since the order of magnitude difference remains large after the normalization process. For our bicycle network, we define
f x = ln x ln a + 1 ,
where
α = max i j ω i j , i = 1 n , j = 1 n .
This function converts the weights to 1 , 2 . Ultimately, the improved method is given below
π r = 1 n i q i r ,
θ r j = i f ω i j q i r i k i q i r , i f i ω i j 0 ε , o t h e r w i s e ,
q i r = π r j θ r j f ω i j s π s j θ s j f ω i j .
To iterate Equations (13)–(15), we define
Δ q = max i r q i r t q i r t 1 , 1 i n , 1 r c
to denote the difference between two neighboring iterations. Here, t denotes the iteration step. If Δ q < 10 4 , we will stop the iteration.

2.3.2. Rebalancing Model for the Docked Bike-Sharing System

The Bike-sharing Rebalancing Problem (BRP) refers to the use of a series of distribution vehicles with maximum capacity constraints to pick up bicycles from stations with too high an occupancy level and deliver them to stations with too low an occupancy level and determine the vehicle routes to minimize the total cost of the entire dispatch process [30]. Considering the shared bicycle is a special single type of good, the delivery demand at the bicycle redundant stations is considered zero and the pickup demand at the bicycle scarce stations is considered zero, so the shared bicycle rebalancing problem can be handled with the help of the PDVRP (Pickup-and-Delivery Vehicle Routing Problem) model. Here, we give a formulation of the BRP problem, which is built under the three-indicator formulation of the M-TSP (Multiple Traveling Salesman Problem) problem. K represents the set of distribution vehicles with index k; V is the set of warehouses and stations; and V 0 denotes the set of stations, N = V 0 ; A = i , j | i V , j V , i j . l i j represents the distance from station i to station j; x i j k is a 0 1 variable, with x i j k = 0 meaning that the kth vehicle does not pass through station i to station j, and x i j k = 1 vice versa; f i j k denotes the flow rate of the kth vehicle from station i to station j; u j denotes the imbalance degree of station j; Q represents the capacity of the vehicle; and v i is a dummy variable introduced to eliminate sub-loops. The specific formula is as follows:
min l i j x i j k s . t . (17) k K i V , i j x i j k 1 , j V , (18) k K i V , i j x i j k K , j V , (19) i V , i h x i h k j V , j h x h j k = 0 , h V , (20) j V 0 x 0 j k = 1 , k K , (21) v i v j + N k K x i j k N 1 , i , j V 0 , i j , (22) f i j k Q x i j k , i , j A , k K , (23) k K i V , i j f j i k k K i V , i j f i j k = u j , j V 0 , (24) x i j k 0 , 1 , i , j A , (25) f i j k 0 , i , j A , k K , (26) u j 0 , j V .
The formulation requires the minimization of the total distance traveled by distribution vehicles, where constraints (17) and (18) ensure that at least one distribution vehicle passes through and at most K distribution vehicles pass through each station; constraint (19) ensures that distribution vehicles entering a station will necessarily exit from that station; constraint (20) defines that all vehicles used depart from the warehouse; constraint (21) eliminates the sub-cyclic constraints; constraints (22) defines that the flow on each arc used does not exceed the vehicle capacity; constraint (23) strictly satisfies the delivery or pickup demand at each station; and constraint (24), constraint (25), and constraint (26) define the variable ranges.

2.3.3. Design Model Solution Algorithm and Solution Results

First, we try to use the solver for the exact solution. In this paper, we set the capacity Q of the distribution vehicles in the solution to be 50. At the very beginning, since we need to know the number of distribution vehicles and the number of selected vehicles is unknown until the optimal solution is solved, we determine the number of distribution vehicles (number of paths) according to the following equation:
K = 1.5 i = 1 N u i Q ,
where N = V 0 . The imbalance of each station represents the difference between the bicycles parked at the end of the day’s time at that station and the bicycles parked before the start of the day, with a positive value indicating u i more bicycles and a negative value indicating u i fewer bicycles. Figure 4 gives a visualization of the imbalance degree for each station on 1 March 2017, for the docked bike-sharing system in Nanjing.
In addition to the above method, we give the number of vehicles K obtained by the heuristic algorithm based on the results of the heuristic algorithm presented below and reuse the solver for the rebalancing of that community. In addition, we define the warehouse of each community as one of the stations, which is calculated by the following equation:
i = arg min i j l i j , i , j V .
Due to the large size, the solver may not be able to obtain a satisfactory solution. Thus, we also design heuristic algorithms to solve satisfactory local optimal solutions for the shortest rebalancing path. First, we need to redesign the objective function to make it suitable for the solution of the heuristic algorithm. As shown in Figure 4, when setting the capacity of the distribution vehicle Q = 50 , there are a considerable number of stations whose imbalance is larger than the capacity of the distribution vehicle. Thus, we split each station [35,36]. For each station i except warehouse station u 0 , there are
j = u i Q ,
thus having
u i k = Q , k = 1 , 2 , , j 1 u i j 1 Q , k = j .
At this point, each station is split into j logical stations with the same location, and they are re-notated as
μ = u i k | i = 1 , 2 , , N 1 , k = 1 , 2 , , j .
Here, there is always μ N 1 that holds.
In the optimization process used in this paper, the distribution vehicle is allowed to carry a certain number of bicycles when it initially leaves the warehouse station. The number of bicycles to be initially carried needs to be derived from a calculation based on each distribution path. Under the condition of initially carrying bicycles, the sum of the cumulative imbalances calculated from each distribution path needs to satisfy the dynamic boundary conditions in Theorem 1.
Theorem 1.
The dynamic boundary conditions under which a distribution vehicle can reach station i are given by the following inequality for the cumulative imbalance degree:
max j S j Q S i min j S j + Q , 0 j < i ,
where S i = n = 1 i μ i represents the inventory of the distribution vehicle after rebalancing logical station i (which can take a negative value, excluding the number of bicycles carried when leaving the warehouse station), and let C s t a r t represent the number of bicycles carried by the distribution vehicle when it initially leaves the warehouse station. If S i does not satisfy Equation (32), the distribution vehicle needs to end that dispatch when it reaches station i 1 and then return to warehouse station u 0 .
Proof of Theorem 1.
It is easy to see that in every dispatching process, the following inequality always holds
0 S i + C s t a r t Q , i 0 ,
thus, there are
n = 1 i μ n Q C s t a r t , i 1 ,
n = 1 i μ n Q , i 1 .
From the above two equations, it is easy to know
max i S i Q C s t a r t , i 1 ,
min i S i C s t a r t , i 1 .
By deforming the above two equations, we obtain
min j S j + Q Q C s t a r t max i S i , 1 j < i ,
max j S j Q C s t a r t min i S i , 1 j < i ,
as a result
max j S j Q S i min j S j + Q , 0 j < i .
In the proof, it follows from Equation (37) that
C s t a r t min i S i .
It also holds that C s t a r t 0 is always true, and so the number of bicycles carried by the distribution vehicle on its initial departure from the warehouse station can be given by equation
C s t a r t = min 0 , min i S i | i 1 .
Consequently, we set the objective function as a set of sequences
M j = μ k 1 μ k 2 μ k i μ k N 2 μ k N 1 , 1 k i N 1
of logical stations μ i . Determine the interruption point θ i in each sequence M j by using the dynamic boundary conditions in Theorem 1. Let μ k 1 be the first interruption point θ 1 . When the first μ k i that does not satisfy the dynamic boundary conditions occurs in this sequence from the previous interruption point θ k 1 , it is noted as the next interruption point θ k , and M θ k is used to represent the segment of the sequence. Thus, the following can be obtained:
K = θ i ,
dispatch distance
L = i = 1 K D u 0 M θ i u 0 ,
which
D M j = i = 1 M j d μ k i , μ k i + 1 ,
and d μ k i , μ k i + 1 represents the distance between logical stations μ k i and μ k i + 1 .
In this paper, we decided to use the Simulated Annealing (SA) method to calculate the shortest rebalancing path. The limiting behavior of the simulated annealing method has been well studied through Markov chains [84,85]. In our present algorithm, the probability of acceptance of a non-optimal solution in the loop is the Boltzmann distribution
min 1 , e L n e w L * T .
The initial annealing temperature is taken as T 1 = 100 . The coefficient of cooling for the annealing temperature is as follows:
T t + 1 = 0.995 T t , T t 60 T t 1 + lg 1 + t 102 , T t < 60 .
This cooling coefficient function will allow the algorithm to fully operate at high temperatures and slowly decline at low temperatures. In addition, after our attempts, the operation at temperatures greater than 60 is very important for the improvement of the quality of the final solution. The operators in the algorithm for generating new candidate solutions consist of the following three. The first is the swap operator, which randomly exchanges two logical stations in the sequence M j ; the second is the reverse operator; and the third is the transpose operator, which randomly divides the sequence M j into four segments of arbitrary length, i.e., M j = M j 1 M j 2 M j 3 M j 4 , and exchanges the positions of the two middle subsequences to obtain M j n e w = M j 1 M j 3 M j 2 M j 4 . One operator is randomly selected for the computation each time. The annealing is stopped when the optimal solution no longer changes after 150 consecutive annealing.

2.4. Modeling the Business of Docked Bike-Sharing Systems

Considering a project planning period of N l years, we discuss what the profit and loss of the business will look like over the next N l years if the docked bike-sharing system continues to operate at its current size for N l years. It is assumed that all infrastructure (stations) will be in service for S l years and that the bicycles will have a life expectancy of B l years. Based on the average size of the system, we examined the profit and loss scenarios of the firms over the next N l years. The basic information on the infrastructure size (total number of stations S, total number of bicycles B) is derived from the raw data on historical bicycle trips.

2.4.1. System Costs

The cost of a docked bike-sharing system is mainly composed of two aspects: the system construction cost and the operation and management cost. It is worth noting that this paper does not consider the cost of company administration and management, etc., but only the cost of hardware and dispatching.
The cost of system construction consists of two main aspects: the construction cost of the station and the procurement cost of the bicycles. The system construction stage is the main stage of consuming financial and material resources, characterized by large capital investment and short time. We assume that the construction cost of the station is S C and the procurement cost of bicycles is B C , so that the total construction cost of the system at the initial stage is
C t o t a l = S × S C + B × B C .
The annual Operation and Management (O&M) Cost O t o t a l of a docked bike-sharing system is mainly the cost incurred by various tasks involved in the O&M process of the system, which mainly consists of rebalancing cost R C , maintenance cost M C , etc. Namely,
O t o t a l = R C + M C .
Because rebalancing is often done by rebalancing employees and distribution vehicles, we divide the cost of rebalancing into two components: the cost of using distribution vehicles, R c v , and the cost of labor, R c m , which is
R C = R c v + R c m .
First, consider the cost of using a distribution vehicle, which in this case can be trucks or e-trikes. It is assumed that in 2017, rebalancing operations were performed by trucks. For the year 2023, the distribution vehicle could be either trucks or e-trikes. Therefore, the cost of using distribution vehicles (trucks, e-trikes) can be obtained by the following equations, respectively
R C t r u c k = 12 × R P × d y × f p × f c + t p l t ,
R C e - t r i k e = 12 × R P × d y × e p × e d + e c e l .
where R P = 1 f r e b a l a n c i n g is the rebalancing coefficient, d y is the total monthly mileage traveled in year y, f p is the unit fuel price, f c is the fuel consumption per unit distance of the truck, t p is the truck procurement cost, and l t is the mileage of the truck at the end of its life. e p is the unit price of electricity, e d is the power consumption per unit distance, e c is the procurement cost of the e-trike, and e l is the end-of-life mileage of the e-trike. The power consumption per unit distance e d can be calculated based on the energy parameters of the e-trike used in the system. Assuming that the nominal battery voltage is e v , the battery capacity is e a , the motor power is e m , and the charging efficiency is η , first, we can calculate the range of the e-trike in a fully charged state
e b = e v × e a e m × v e .
In turn, we can obtain the power consumption per unit distance
e d = e v × e a 1000 × e b × η .
In addition, for the labor cost, we can obtain it by the following equation:
R c m = 12 × R P × d y × H c × 1 v × H ,
where H c is the labor cost factor, v is the speed of the distribution vehicle ( v t is the speed of the truck and v e is the speed of the e-trike), and H is the actual travel time of the distribution vehicle (the total rebalancing time minus the time of loading and unloading bicycles).
Next, we consider the maintenance cost of the docked bike-sharing system, M C . The maintenance cost consists of two main components, the cost of maintenance equipment, M c v , and the labor cost of maintenance personnel, M c m , i.e.,
M C = M c v + M c m .

2.4.2. Present Value Modeling of System Operational Benefits

Docked bike-sharing systems derive their revenues primarily from fees generated from riding. Next, we look at the profit and loss of the business for a certain period in the future, focusing mainly on when the business will be profitable. When analyzing the operational benefits of a docked bike-sharing system, we need to discount the operational benefits of the docked bike-sharing system in different years by taking into account the change in the time factor because of the long life cycle of the project and the varying monetary values at different stages. In this paper, we use four times the one-year L P R , Loan Prime Rate, as the interest rate r (the highest private lending rate allowed by Chinese law). The cumulative net benefit R n of the system in year y can be expressed as
R y = C t o t a l × 1 + r P O t o t a l , y = 1 ,
R y = R y 1 × 1 + r P O t o t a l , y > 1 ,
R y = R y 1 × 1 + r + B × B C P O t o t a l , y > 1 .
It is worth noting that in Equation (60), we also include the cost of bicycles, which is because bicycles are scrapped at the end of their useful life and the system needs to reintroduce bicycles in that year.

3. Results

In this section, we compare the emissions of Nanjing’s 2017 docked bike-sharing system with those of the 2023 docked bike-sharing system to reveal whether the environmental benefits of Nanjing’s docked bike-sharing system are sustainable over time.

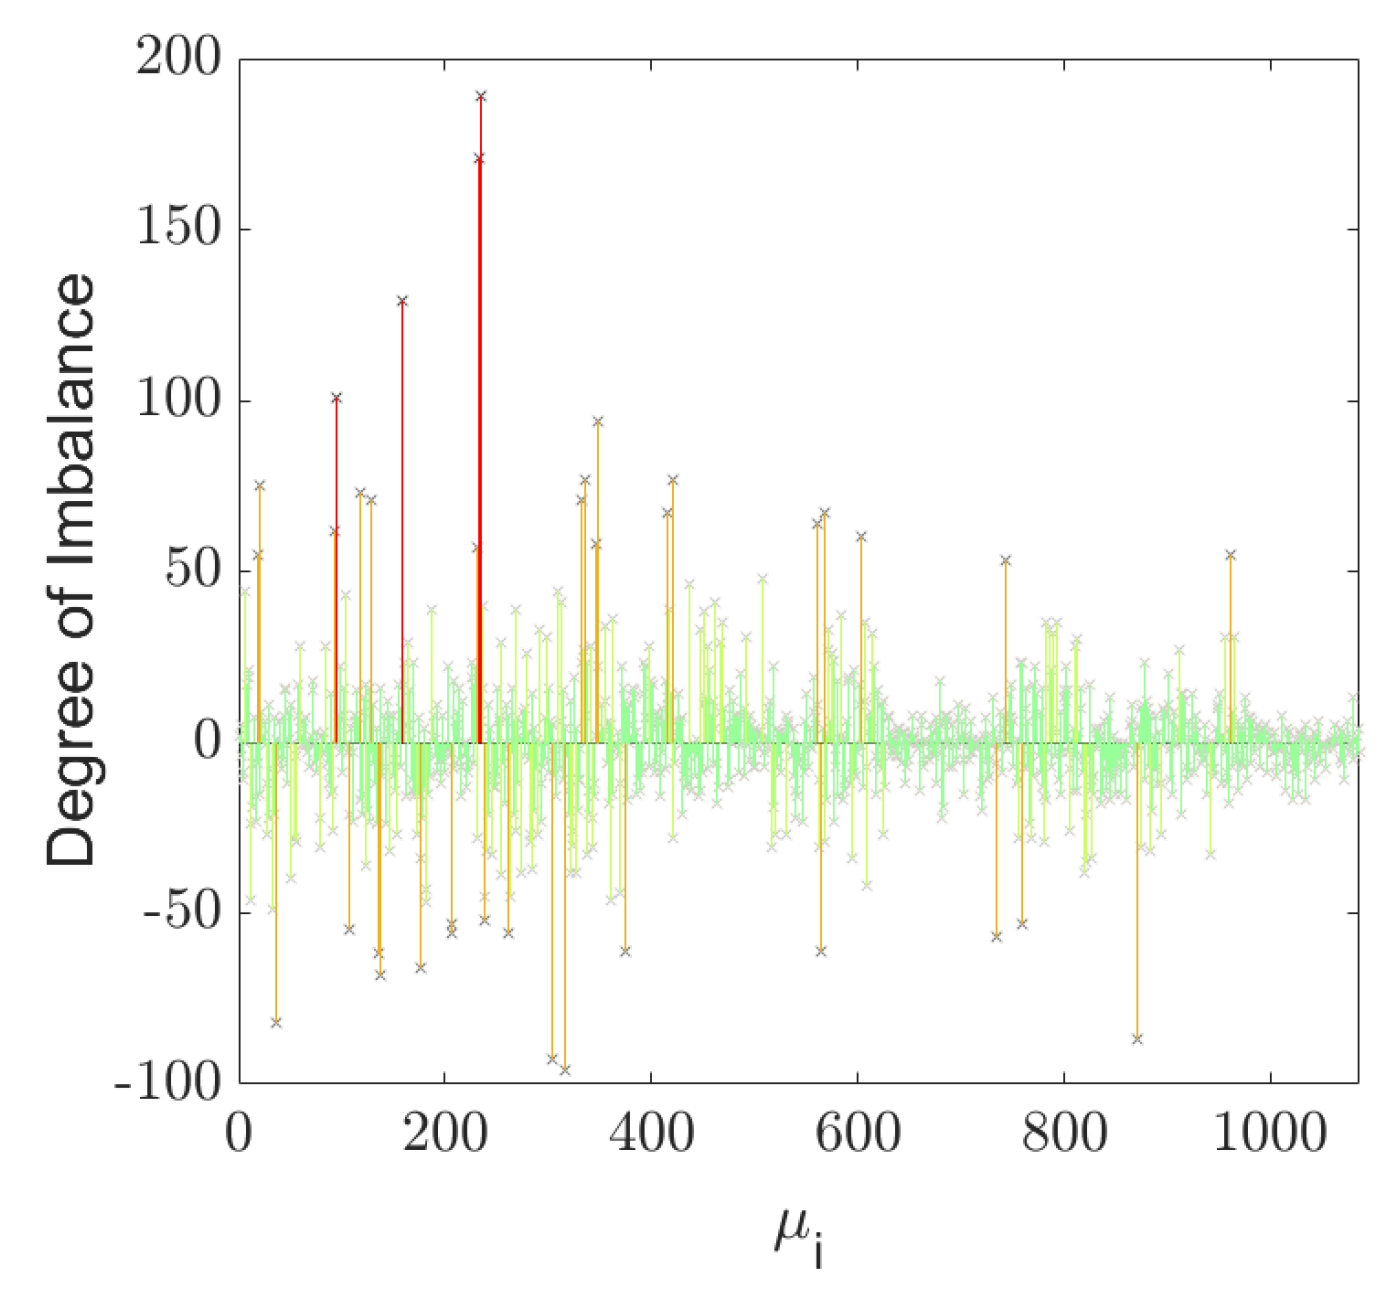
3.1. Rebalancing Coefficient

For the docked bike-sharing system in Nanjing, there were 1086 stations built in 2017 and as many as 1476 stations in 2023. We begin with zoning for the 2017 and 2023 Nanjing docked bike-sharing systems.
Figure 5 gives the results of community detection based on the above-modified community detection algorithm. Figure 5a gives the results of the community detection of the docked bike-sharing network in Nanjing in March 2017. We chose to divide the 1086 stations into 10 communities. As can be seen in Figure 5a, there is a partial overlap in the edge location of each community. Therefore, as shown in Figure 5b, we manually adjusted the stations at the edge positions of each community so that they no longer overlap. Figure 5c gives the results of the community detection of the docked bike-sharing network in Nanjing in March 2023. We chose to divide the 1476 stations into 12 communities. However, the detection of communities resulted in 13 communities after geo-labeling. One of the communities contains nodes that are geographically distant from each other and are split by another community. Therefore, we define that community as two different communities. In addition, as in Figure 5b, we also manually adjusted the stations at the edge locations of each community so that they no longer overlap, and its final result is shown in Figure 5d. Our rebalancing operation will be based on the results of this community detection and will be performed separately within each community.
Next, we solve the rebalancing coefficients based on the rebalancing model. Table 2 gives the results of the exact solution using real data from 1 March 2017, for the docked bike-sharing stations in Nanjing. We perform rebalancing operations within each community. Gurobi 10.0.1 successfully solves the shortest rebalancing path for only one community. For all the other 9 communities, we encountered incidents where the Python 3.9.7 kernel died and restarted the kernel on its own after the program had been running for some time. One possible reason given by Gurobi is that the RAM size of the workstation is not large enough to solve the objective function. Meanwhile, none of the other 9 communities were even able to find a set of feasible solutions by Gurobi 10.0.1 before the Python kernel died. The results of SA’s performance with this data are given in Table 3. It can be found that SA can give more satisfactory local suboptimal solutions, where the total absolute imbalance u t o t a l is calculated by the following equation:
u t o t a l = i u i , i V 0 ,
which represents the sum of the absolute values of the imbalances within each community.
To obtain more precise results, we solved the rebalancing coefficients for 2017 and 2023 using 8 weeks of data, respectively, and eventually averaged them. The rebalancing coefficients for 2017 and 2023 at Q = 50 are
f r e b a l a n c i n g Q = 50 , 2017 358.45 ,
f r e b a l a n c i n g Q = 50 , 2023 94.78 .
And when Q = 50 , the distribution vehicles are fuel trucks. Due to the requirement of CO 2 emission reduction, we also calculated the rebalancing coefficients for dispatching by e-trikes in March 2023. At this time, Q = 10 and
f r e b a l a n c i n g Q = 10 , 2023 63.18 .

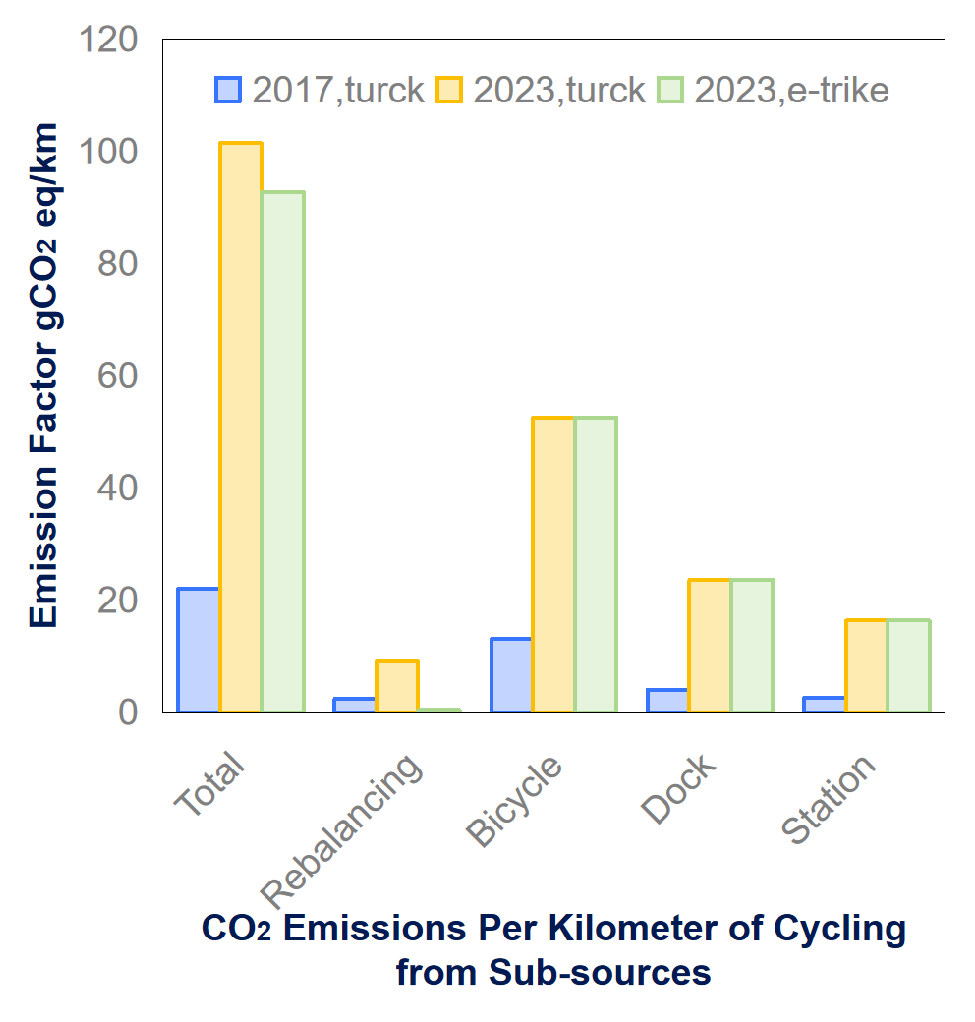
3.2. Calculation of Life Cycle Emission Factors

For the docked bike-sharing system in Nanjing, where [2]
E b i k e M a n u f a c t u r i n g = 31.3711 kgCO 2 eq / bike ,
E b i k e M a i n t e n a n c e = 1.3553 kgCO 2 eq / month ,
E b i k e S c r a p = 3.7339 kgCO 2 eq / bike .
Bicycles have a lifespan of 3 years [13]. For the carbon emissions from the stations, we distribute them equally to each bicycle according to the lifetime of the station, which is taken to be 10 years [11]. While [12]
E ^ s t a t i o n = 2008.1 kgCO 2 eq / station ,
E d o c k = 81.82 kgCO 2 eq / dock .
For the Nanjing docked bike-sharing system, there are 41,526 docks, 1086 stations, and 39,302 bicycles in 2017; and 52,377 docks, 1476 stations, and 34,124 bicycles in 2023. For distribution vehicles [11,12]
E v e h i c l e t r u c k = 0.852 kgCO 2 eq / km ,
E v e h i c l e e - t r i k e = 0.023 kgCO 2 eq / km .
Thereby, there are
E b i k e , 2017 , t r u c k l i f e c y c l e = 22.02 gCO 2 eq / km ,
E b i k e , 2023 , t r u c k l i f e c y c l e = 101.42 gCO 2 eq / km ,
E b i k e , 2023 , e - t r i k e l i f e c y c l e = 92.79 gCO 2 eq / km .
From the above calculations, it can be found that the emission factor for the docked bike-sharing system in Nanjing in 2023 is 4.6 times higher than that in 2017. This is caused by the fact that the utilization of the docked bike-sharing system in Nanjing was significantly higher in 2017 than in 2023. As a snapshot, the average daily turnover rate per bicycle in 2017 was 4.04 times, while that value dropped to 1.17 times in 2023.

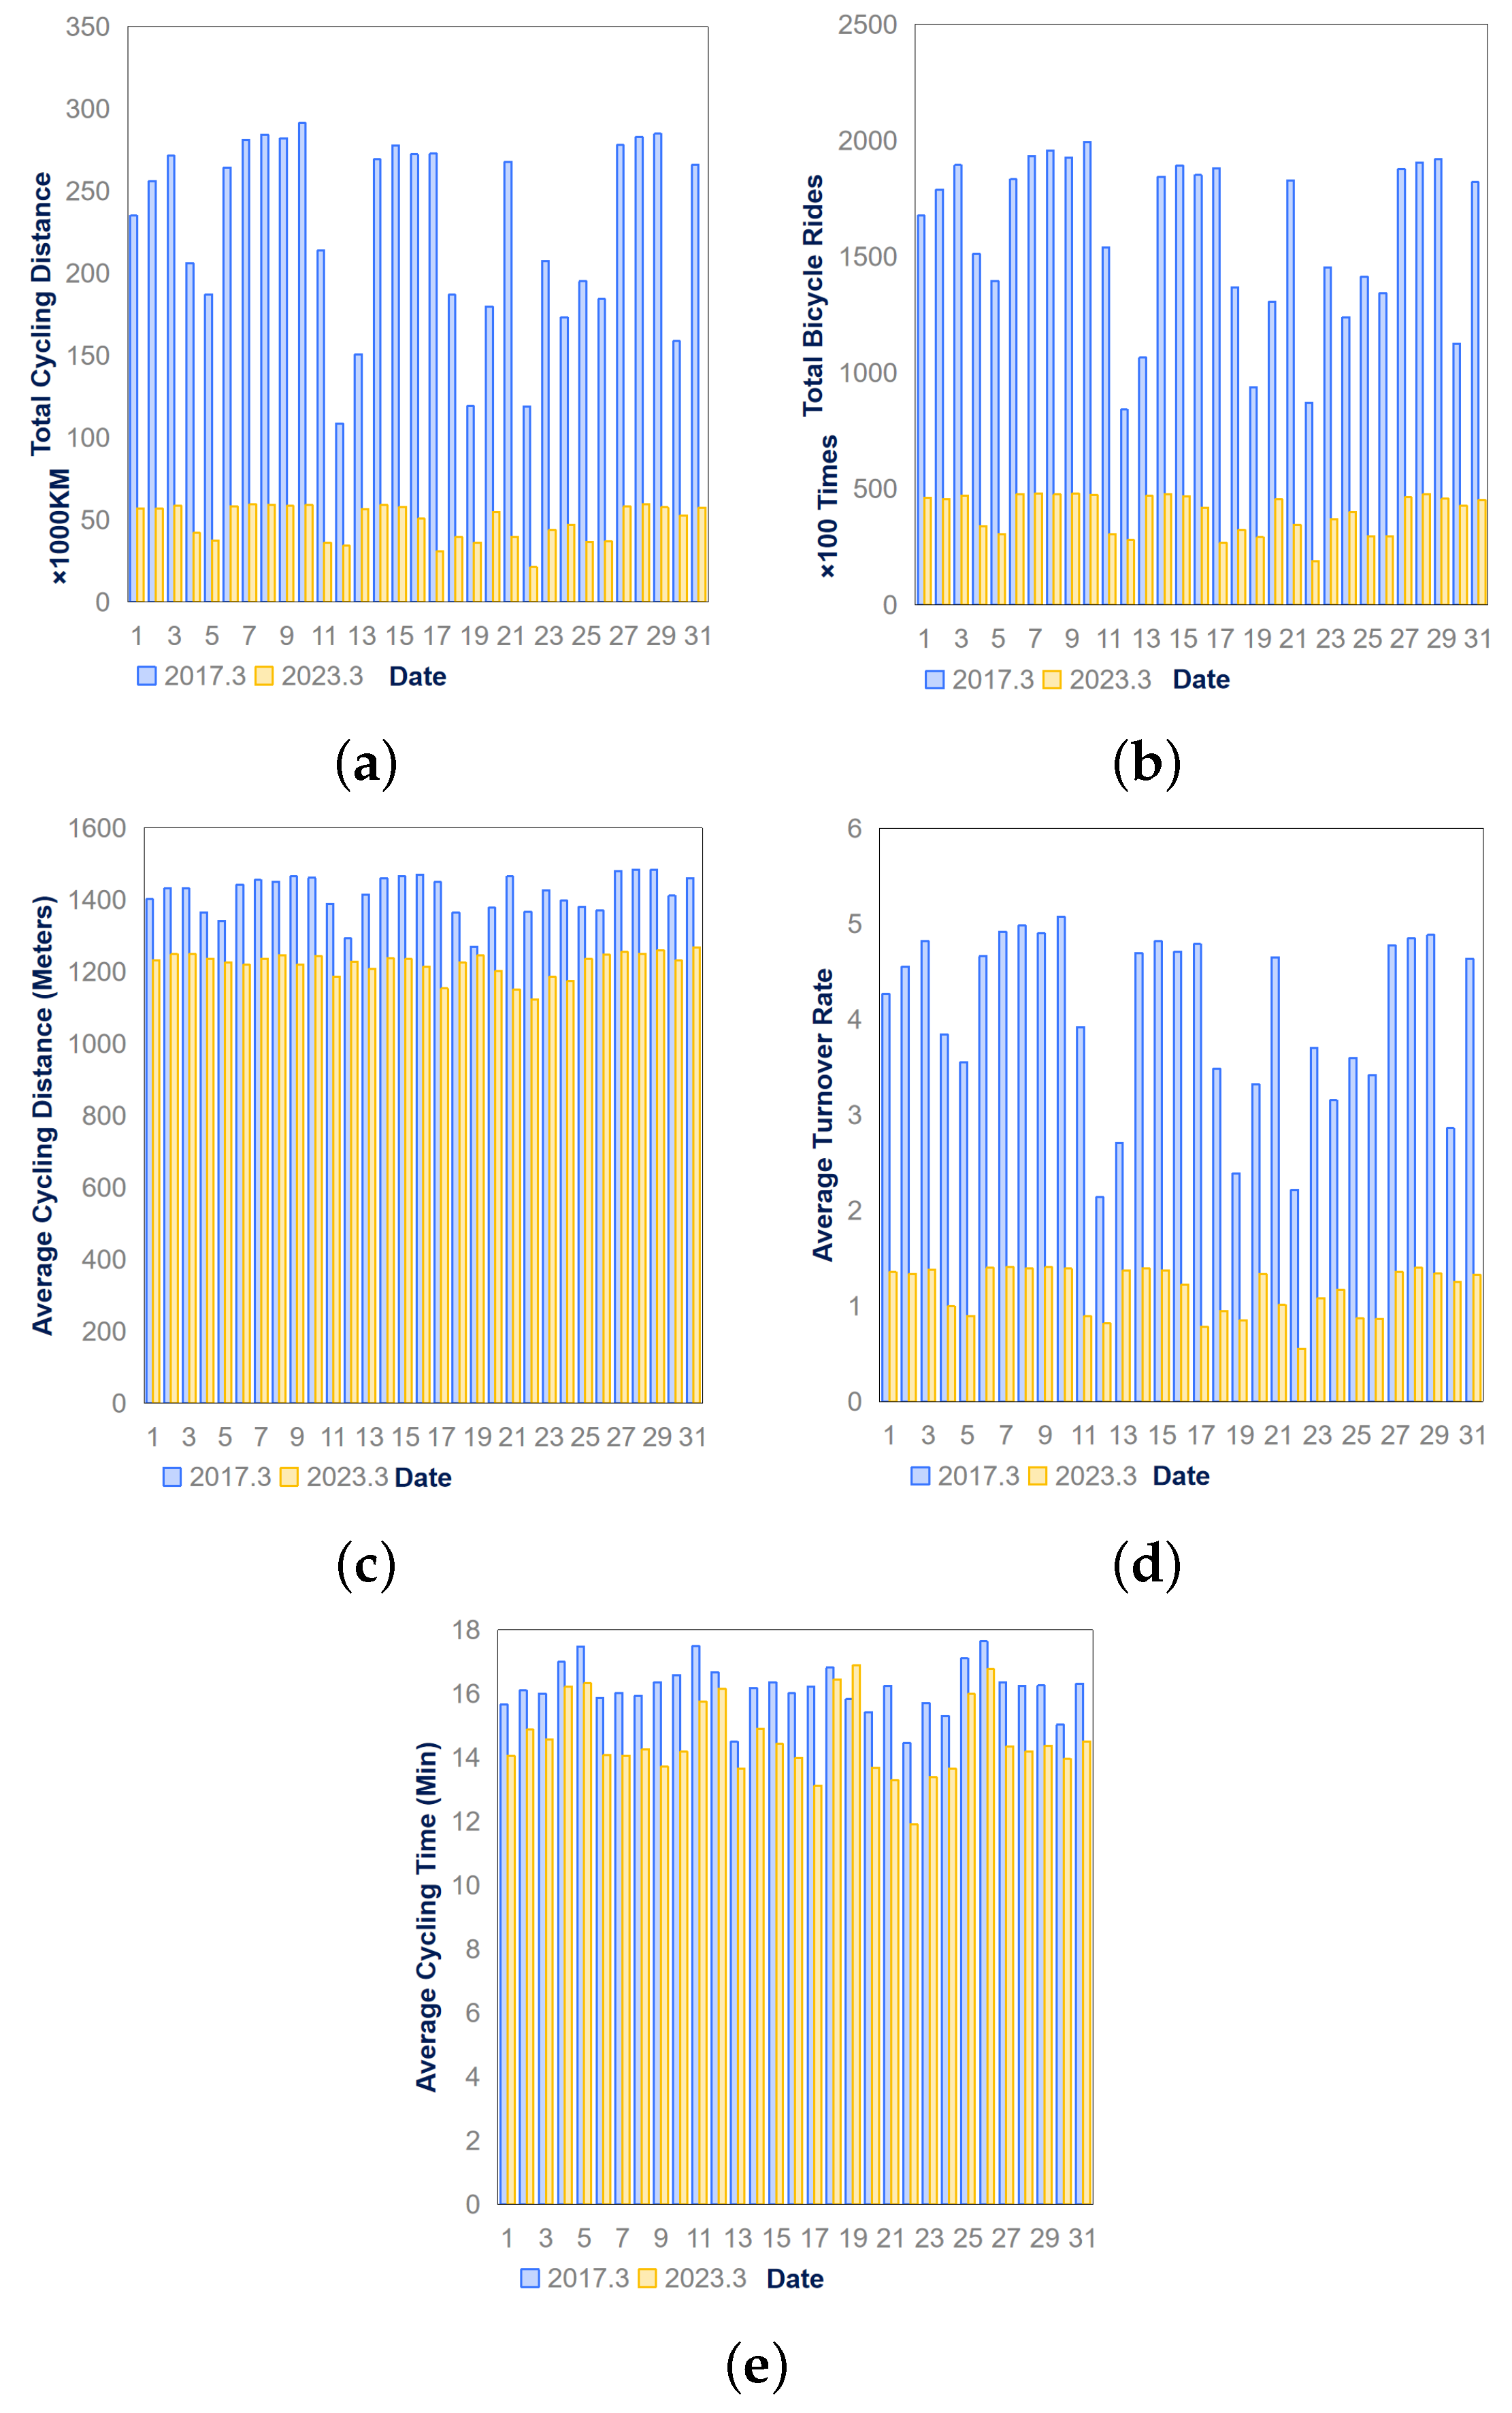
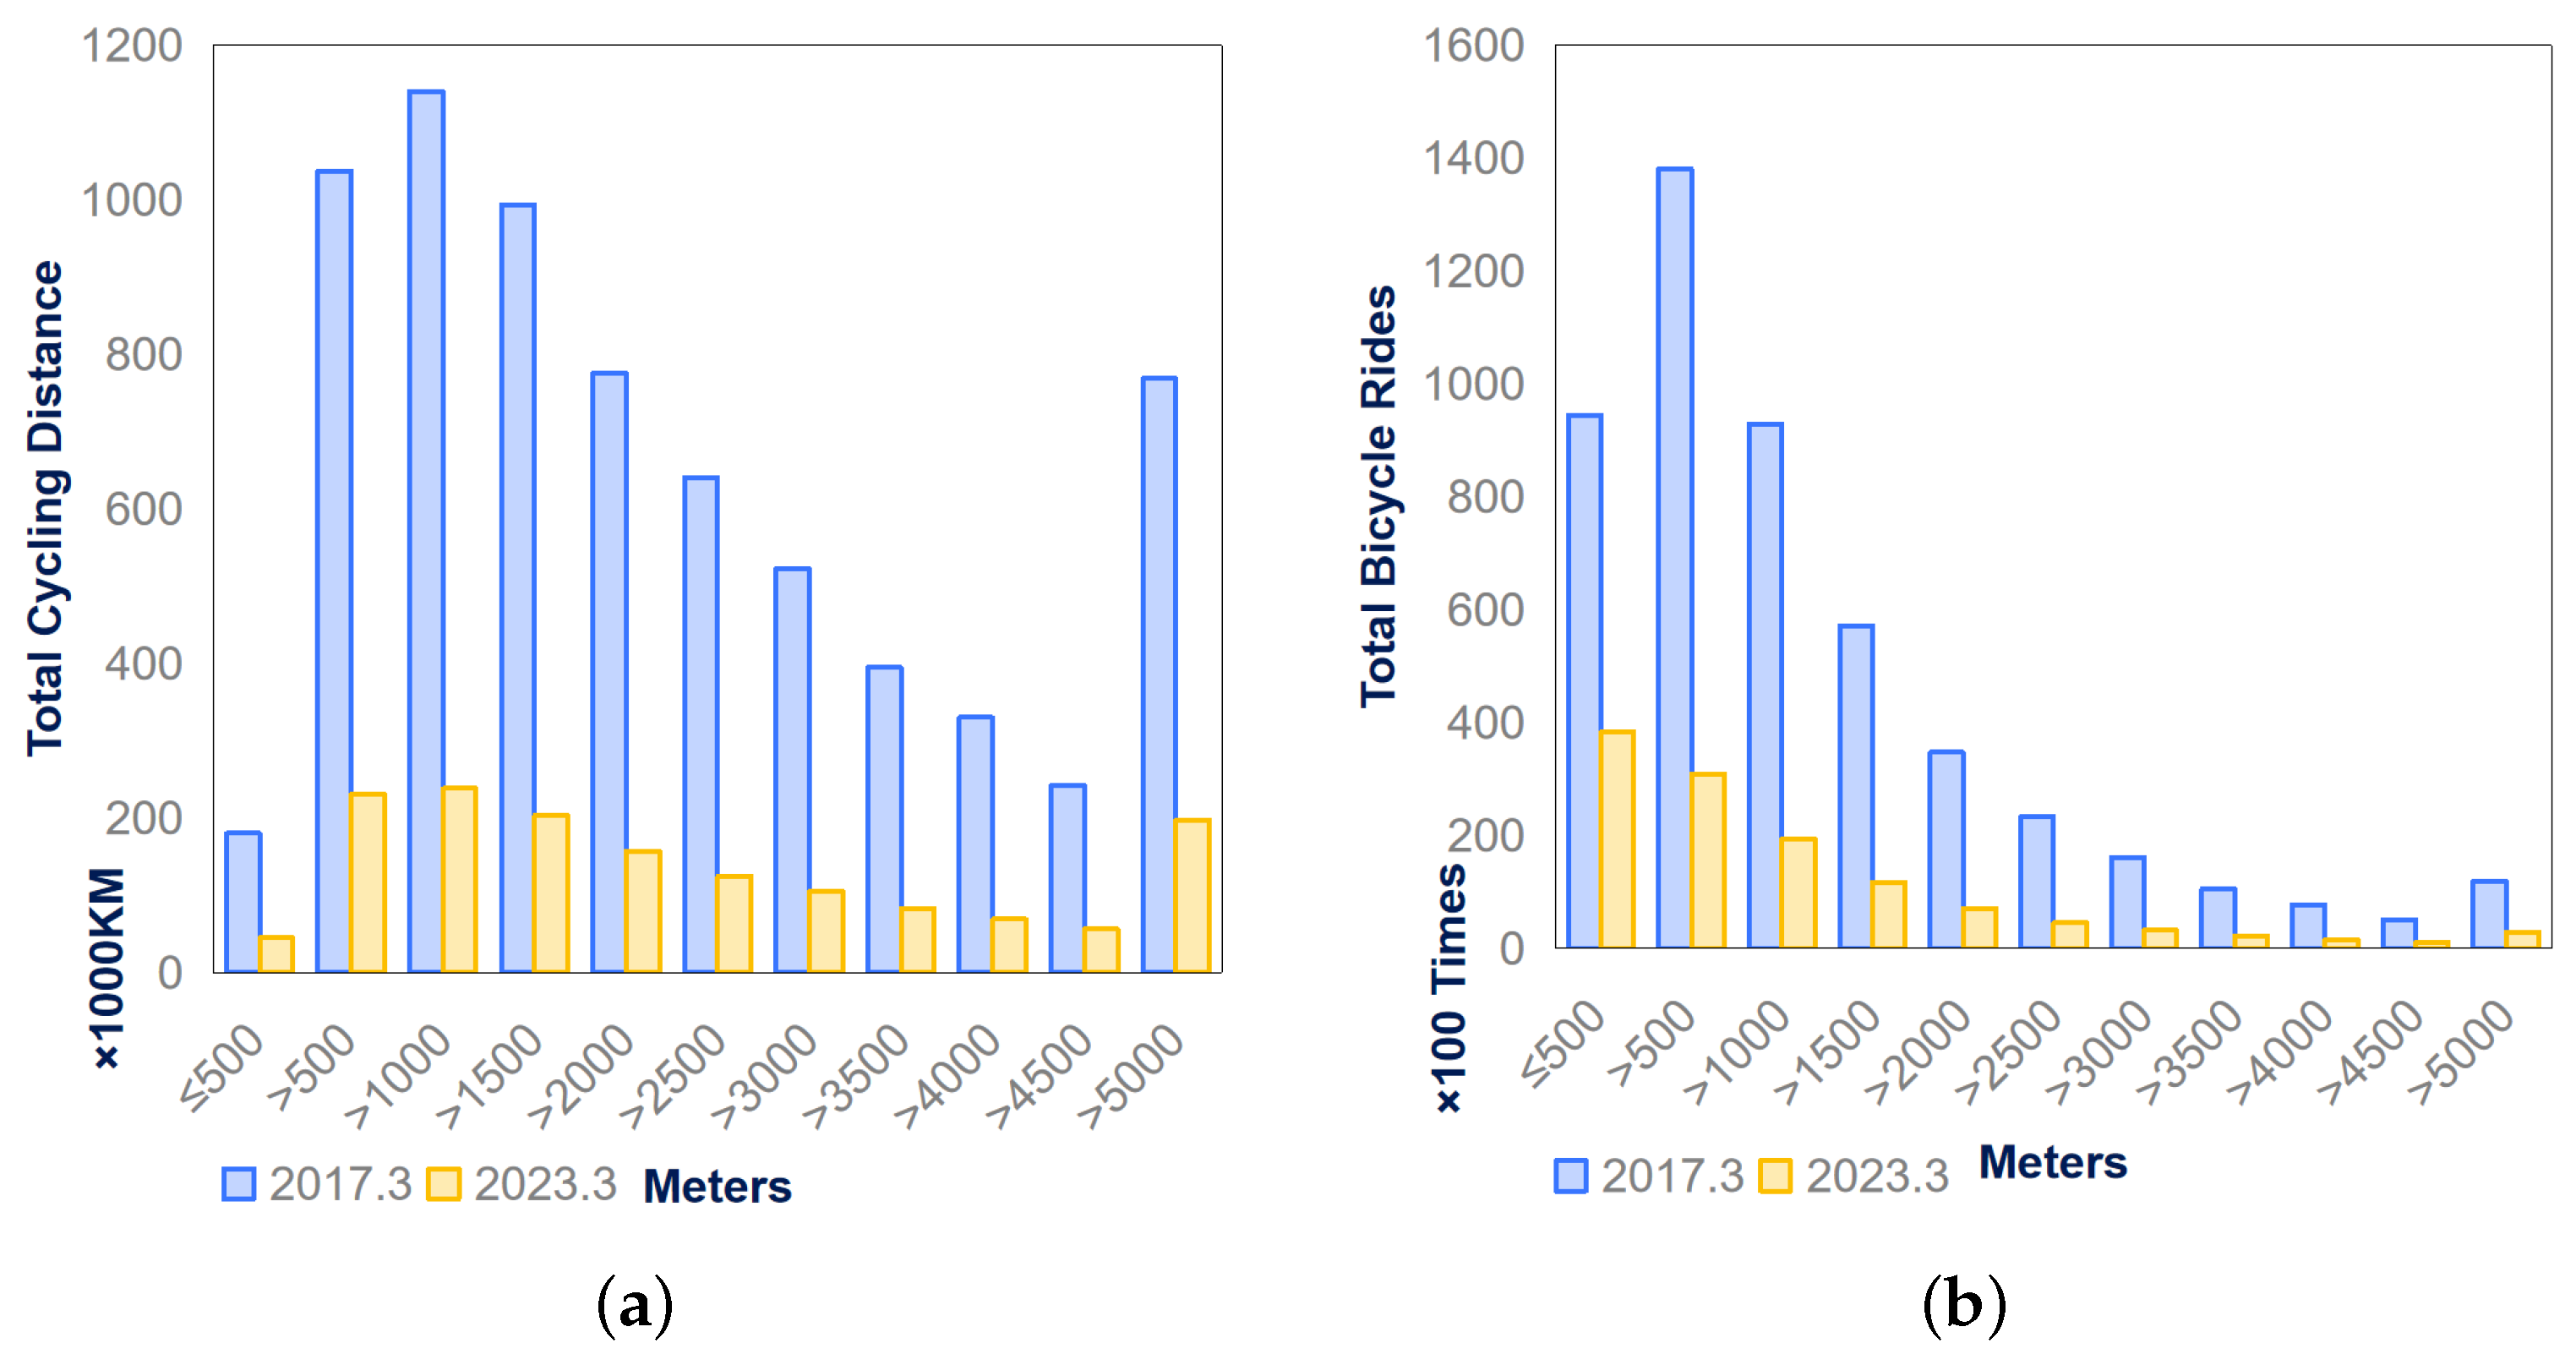
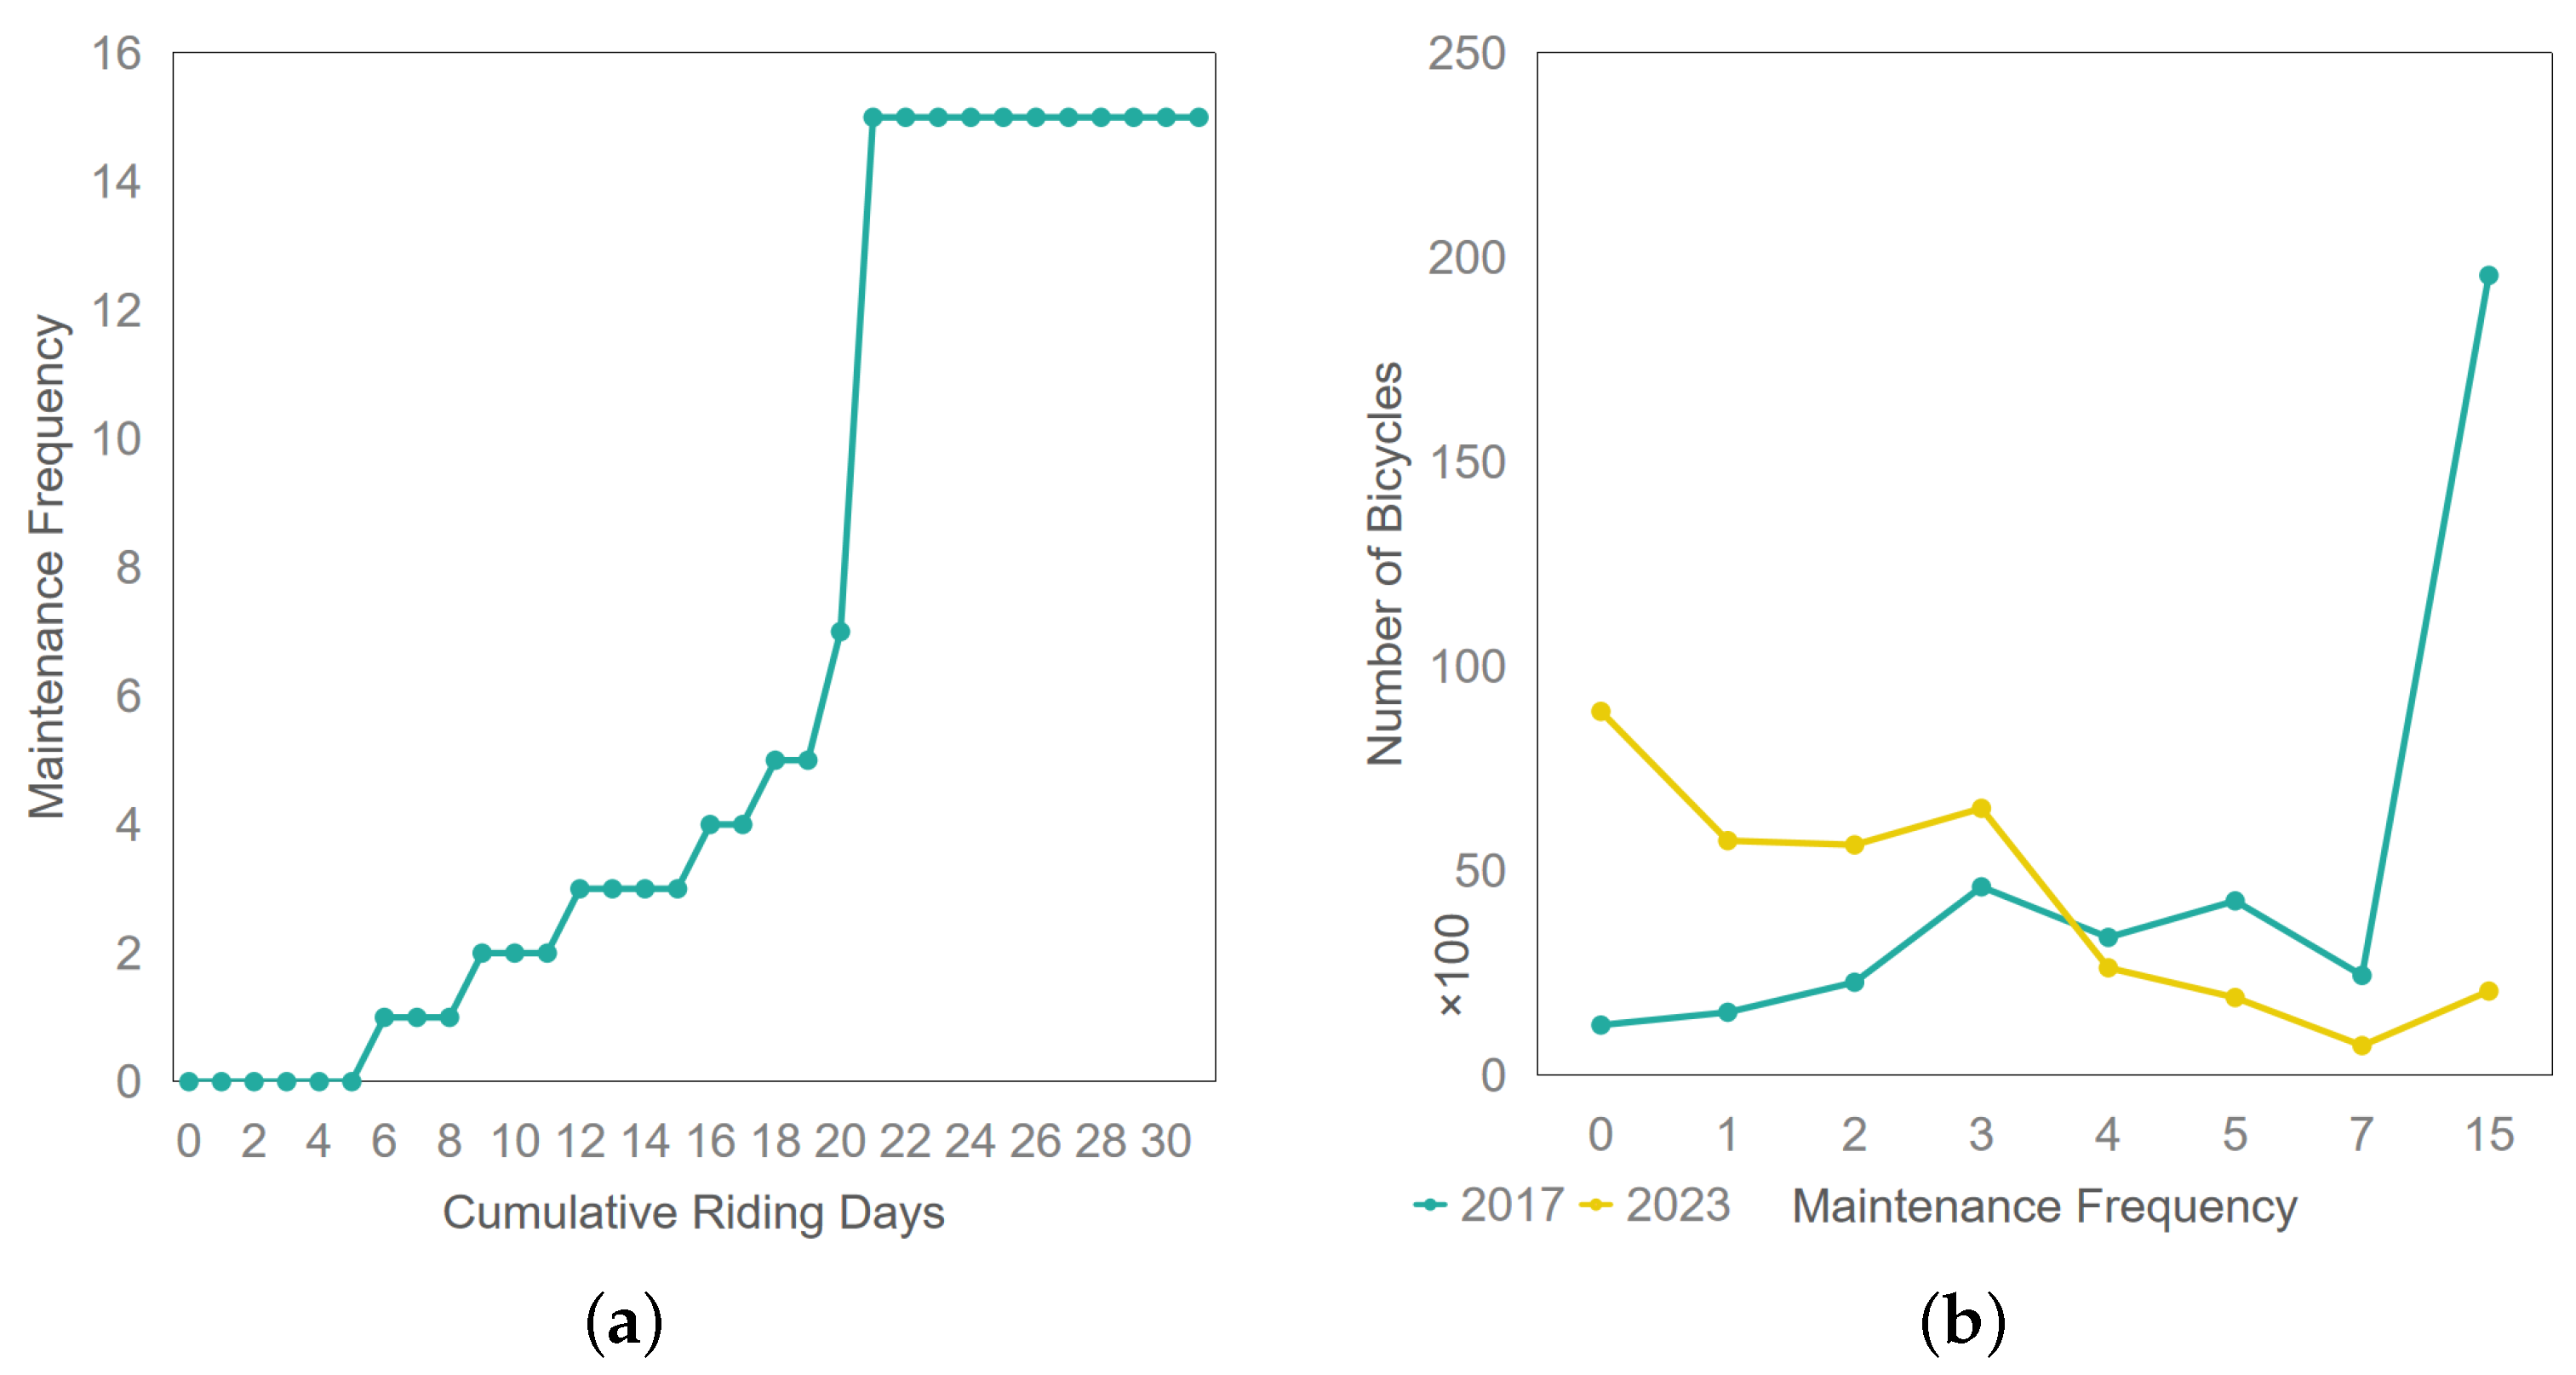
3.3. Comparison of Operations of Docked Bike-Sharing Systems in Nanjing, 2017 vs. 2023

Table 4 gives the specific values of the parameters of the system size. Table 5 gives the specific values of the parameters of the system cost. According to the formula given in Section 2.4.1 and the values of the parameters in Table 5, we can calculate the use cost R c v and labor cost R c m of the distribution vehicles of the docked bike-sharing system in Nanjing in 2017 and 2023, as shown in Table 6.
According to the statistics of bicycle maintenance in each month, the average maintenance cost of a bicycle is 5.8969 yuan, where the data of the number and category of maintenance equipment are from Chen et al. [2] and the price data are from 1688.com. The number of bicycles that are used 1–31 times in a month of Nanjing’s docked bike-sharing system in 2017 and 2023 is shown in Figure 6a. Based on the correspondence between the number of days riding shared bicycles and the number of repairs given by Chen et al. [2], we obtain the relationship between the number of repairs and the number of bicycles in one month of the docked bike-sharing system in Nanjing in 2017 and 2023 (as shown in Figure 6b). Thus, in year y, the number of annual maintenance bicycles of Nanjing’s bike-sharing system, m y , can be calculated, and further, the cost of maintenance equipment of Nanjing’s bike-sharing system in year y, M c v , can be calculated. Assuming that one person can only repair 20 bicycles a day and that the labor cost factor is the same as the labor cost factor in the rebalancing operation, the labor cost of the repairer can be calculated as M c m . The specific calculations are given in Table 7.
At this point, we can calculate the initial construction cost and the average annual operating cost of the system based on the 2017 and 2023 sizes, as shown in Table 8.
According to the reality, in 2017: trips under 30 min are free, and for trips over 30 min, each trip is priced according to the cycling time, and the price increases by RMB 1 for every additional 15 min of cycling time. In 2023: all trips under 30 min are RMB 1, and for trips over 30 min, the price increases by RMB 1 for every additional 15 min. From this, we can calculate the annual revenue P of the system in 2017 and 2023, respectively, as shown in Table 9.
It is worth noting that in Equation (60) for = 4 , 7 , we also include the cost of bicycles, which is because bicycles are scrapped after 3 years of use and the system needs to reintroduce bicycles; and in Equation (59) for y = 2 , 3 , 5 , 6 , 8 , 9 . Taking L P R = 3.45 % [90], we can calculate the profit and loss of the system for the next 10 years based on the system size and usage in 2017 and 2023, respectively, as shown in Table 10, where we consider two scenarios of truck rebalancing and e-trike rebalancing, respectively, in 2023.
The results in Table 10 show that based on the size and use of the docked bike-sharing system in Nanjing in 2017, the business can be profitable in the ninth year. Based on the size and usage of the docked bike-sharing system in Nanjing in 2023, in the case of trucks, the enterprise has been losing money in the first five years until the beginning of the sixth year. As for the case of e-trikes, the enterprise has been losing money.

4. Discussion

4.1. Comparison of Emission Factors

This paper shows that in 2023, compared with 2017, the demand for the use of the docked bike-sharing system in Nanjing is lost severely, and people’s cycling distance is getting shorter and shorter. Seven years after the completion of Nanjing’s docked bike-sharing system, people seem to have faded their enthusiasm for shared bicycles. With roughly the same number of bicycles placed, the turnover rate per bicycle has dropped within these six years to one-fourth of what it was originally.
As a result, the sustainability of Nanjing’s docked bike-sharing system changed significantly. The emission factor did not continue the lower value of 22.02 gCO 2 eq/km from 2016. In 2023, the emission factor for Nanjing’s docked bike-sharing system increased by a factor of 4.6 to 101.42 gCO 2 eq/km.
In contrast, if e-trikes are used for the rebalancing operation, the emission factor decreases to 92.79 gCO 2 eq/km. The roles of the different components in the emission factor of the docked bike-sharing system in Nanjing are given in Figure 7. In Figure 7, it can be found that rebalancing only accounts for a very small part of its emission factor. In 2017, it only accounted for 10.79%. This compares to 8.86% in 2023. After changing the distribution vehicles from fuel trucks to e-trikes, the percentage decreases to 0.39% in 2023. However, in terms of emission factor, the action only reduces 8.62 gCO 2 eq/km, which is a small result. It can be seen that in China, the main emissions of the docked bike-sharing system are concentrated in the facilities of the system. Among them, the production, maintenance, and scrapping of bicycles contribute the most to the emissions, followed by the contribution of the docks and, finally, the stations. They make up the bulk of the amortized CO 2 from cycling. The specific proportionality between them is given in Table 11.

4.2. Environmental Benefits and Operational Sustainability

Second, we discussed the operational sustainability of the docked bike-sharing system in Nanjing. The results show that without considering the costs of company administration and management, and only considering the costs of hardware and dispatching, the payback cycle of Nanjing’s docked bike-sharing system is very long. Users were very motivated to ride in 2017, and the first half hour of each ride was free for users. Perhaps this is one of the key reasons why user motivation was significantly greater in 2017 than in 2023. If user motivation were to be significantly sustained, it would take 9 years to recoup the cost of the investment and make a profit under the 2017 program without expanding the system. User motivation for the Nanjing docked bike-sharing system was clearly not sustained, and there was a significant loss of user demand for the system in 2023. In addition, the charging policy was changed and the free-cycling hours were removed, but the system was still being expanded all the time. Surprisingly, however, the number of years to recoup investment costs was reduced to six years in that unfavorable scenario. This may have been due to the coverage of costs by the price increase and the fact that dispatch costs have dropped significantly with the loss of user demand. The loss of user demand, while causing a significant increase in the emission factor, receives some cost-effective compensation.
However, is it the loss of user demand that led to the elimination of free cycling hours to cover the increased costs, or is it the elimination of free cycling hours to cover the costs that led to the loss of user demand? Construction of Nanjing’s docked bike-sharing system began on 31 March 2015, and representatives of China’s first dockless bike-sharing companies, ofo, and Mobike, entered Nanjing on 9 January, 2017 and 13 January, 2017, respectively [91]. In the early stage of their entry into the market, there were numerous activities such as “free cycling for a week” and “recharge 100 RMB and get 210 RMB extra”, etc. [91] A 9 March, 2017 news release showed that the top five dockless bike-sharing companies in terms of deployment had placed a total of 104,000 volumes of dockless shared bicycles in Nanjing [91]. This paper uses data from the docked bike-sharing system in Nanjing in March 2017, with 39,302 bicycles placed in that month. The initial period of the most intense competition among bike-sharing companies also became the period of the highest usage of shared bicycles. Subsequently, in 2018, the number of shared bicycles in Nanjing rose to 449,000 [92]; that year, Nanjing limited the total number of shared bicycles to 300,000–380,000 [92]; at the same time, due to the disorderly expansion of bike-sharing systems and excessive placement, a large number of “shared bicycle graveyards” appeared [93]; also at the end of the same year, ofo was on the verge of bankruptcy, with a large amount of money owed to its users and suppliers that remains outstanding (including the authors of this article) [94]. Subsequently, in 2019, bike-sharing operators generally began to increase prices [95]. In 2021, only three major players remained in the dockless bike-sharing market, namely Hello Bike, Meituan Bike, and Qingju Bike [96]. In 2022, the bike-sharing system ushered in the second wave of price increases [97]. In addition, as shown in Figure 8, although the number of demands in 2023 is going to drop significantly compared to 2017, the difference in the distribution of cycling time across periods is not as big. Even after the removal of the first half-hour free time, the percentage of first half-hour rides in March 2023 is comparable to March 2017, as shown in Figure 8b. To sum up, the bike-sharing system has gone through the early stage of subsidizing at a loss as well as capturing the market and is now entering the stage of seeking profitability, and non-sticky users may be lost in large numbers due to the price hike. Therefore, we believe that firstly the recession of the “bike-sharing fever” led to a decline in demand, and then the bike-sharing operators generally began to increase prices, falling into a spiral of falling demand and rising prices.
Further, after replacing the distribution vehicles with e-trikes, the Nanjing docked bike-sharing system is not operationally sustainable in any way. Not only has the system failed to recover its costs within nine years, but the losses have continued to mount each year. This is likely due to a one-fifth drop in the capacity of dispatched e-trikes, resulting in a significant increase in the number of distribution vehicles, distances, and dispatch workers needed. However, the operation only reduces the emission factor by 8.62 gCO 2 eq/km, which is only 8.50% of dispatching with fuel trucks. It severely worsens the operator’s key financial metrics without reducing CO 2 emissions by much.

4.3. Impact of COVID-19 on the Docked Bike-Sharing System

The COVID-19 epidemic affected all market sectors. The decline in demand in 2023 compared to 2017 may be partly attributed to the COVID-19 epidemic. During the COVID-19 epidemic, many studies observed a decline in demand for bike-sharing systems [98,99]. Therefore, in addition to the decline in demand due to the recession of the “bike-sharing fever”, a portion of the demand may have been lost due to the COVID-19 epidemic. The loss of users due to the popularity of COVID-19 will reduce the revenue of the system and at the same time reduce the total number of bicycle miles cycled, thus affecting the rebalancing of the system. The relationship is complex, but we can see from the results that lower demand for use in 2023 than in 2017 is rewarded with shorter payback years. In other words, the loss of demand accelerates the recovery of investment costs.
Specifically, COVID-19 primarily impacts the annual O&M costs O t o t a l of public bicycles. As shown in Equation (50), O t o t a l includes the rebalancing cost R C and maintenance cost M C . For the rebalancing cost R C , the outbreak of COVID-19 will have an impact on both the distribution vehicle usage cost R c v and the labor cost R c m , as shown in Equation (51). The distribution vehicle usage cost R c v is mainly determined by the rebalancing mileage, which is related to the overall usage of the docked bike-sharing system. The outbreak of COVID-19 has had a significant impact on the users’ use of docked bike-sharing systems, which is mainly manifested in the changes in users’ demand, average cycling distance, and cycling time [98,99,100,101]. Similarly, the labor cost R c m is related to the overall usage of the docked bike-sharing system. The rebalancing workload of the docked bike-sharing system is directly linked to labor costs, as shown in Equation (56). In addition, COVID-19 also has a direct impact on the labor cost factor H c . Therefore, if the effect of COVID-19 on the quantification of the model is considered, the coefficients α C O V I D - 19 r e b a l a n c i n g and α C O V I D - 19 H c need to be added to adjust the rebalancing cost and labor cost. Specifically, Equations (52), (53), and (56) need to be rewritten as
R C t r u c k = 12 × R P × d y × α C O V I D - 19 r e b a l a n c i n g × f p × f c + t p l t ,
R C e - t r i k e = 12 × R P × d y × α C O V I D - 19 r e b a l a n c i n g × e p × e d + e c e l ,
R c m = 12 × R P × d y × α C O V I D - 19 r e b a l a n c i n g × H c × α C O V I D - 19 H c × 1 v × H .
However, in addition to COVID-19’s impact on the demand for docked bike-sharing systems, government policies and initiatives, as well as operators’ pricing strategies, all have an impact on demand, which interacts with each other and may need to be differentiated by further quantitative research to be quantified separately. Labor costs, on the other hand, are more complex. It is related to the labor contracts offered by the operators. For example, in Nanjing, where the docked bike-sharing system is government-led, the labor contracts with workers may be of the infinite duration type, meaning that H c may not be affected by the COVID-19 epidemic, whereas, if labor dispatch type of employment is used (which is more common in privately operated bike-sharing companies), H c could be significantly affected by the COVID-19 epidemic. In addition, there may also be correlations with inflation, unemployment, etc., which interact with COVID-19 outbreaks, and H c may need to be differentiated by further quantitative studies.

4.4. Comparison of Rebalancing Solutions

In Section 3.1, we found that the exact algorithm is not up to the task of solving the rebalancing calculation, while SA can solve the rebalancing model. In this section, we will compare different rebalancing algorithms. The rebalancing algorithms in this section will all be compared on the same dataset, using the same criteria. The dataset is the data from the Nanjing docked bike-sharing system on 1 March 2017, and all the solutions are programmed using Python 3.9.7 and implemented using Anaconda on a Win10 system with an Intel(R) Core(TM) i9-10900K CPU (Intel Corporation, Santa Clara, CA, USA) and 64 GB RAM. This includes the results of solving with the solver in Table 2 (Python 3.9.7 programming call to Gurobi 10.0.1) and the results of the SA algorithm in Table 3. The stopping criterion is the same as the SA algorithm except for the exact algorithm. In this section, we additionally implement the following four rebalancing algorithms for computing the shortest rebalancing path.
The first one is the Genetic Algorithm (GA). The number of chromosomes per generation P is an important metric for genetic algorithms. The suggested value of P is C P 2 C [102], where C is the chromosome length. In this study, we take
P = min 300 , 2 C .
For the mutation rate, although some studies suggest taking [103]
P m = 1 C .
However, in our attempts we found that for this study, the best results were obtained when P m = 1 . At this point, we sort the parent and child at the same time, select the new offspring, and terminate when the iteration is 500 generations. The crossover operator and fitness evaluation function here are the same as Goldberg et al. [104]. The mutation operator is the reverse operator, also known as “2-Opt”, which operates by deleting the dispatch paths between two random bicycle stations and reconnecting them so that they cross [105]. The results are shown in Table 12. Δ represents the difference between the current solution and the optimal result among all methods (including the exact algorithm, if any). The Δ values for the SA algorithm are given in Table 13.
The second is the Immune Algorithm (IA), which has an antibody-to-antibody affinity threshold T ρ = 0.7 and a diversity evaluation index α = 0.95 . The rest of the settings are identical to the GA algorithm. The results of the IA algorithm are given in Table 14.
The third is the Tabu Search algorithm (TS). The tabu search algorithm is a meta-heuristic stochastic search algorithm, which starts from an initial feasible solution, selects a series of specific search directions (moves) as a trial, and chooses the move that achieves the most changes in the value of a specific objective function. To avoid falling into local optima, a flexible “memorization” technique is used in TS search by creating a tabu table. The tabu table records and selects the optimization process that has been performed and guides the direction of the next search step. The results of the TS algorithm are given in Table 15.
The fourth type is the large neighborhood search algorithm (LNS). The large neighborhood search algorithm improves the quality of the solution step by step by alternating between the destroy operator and the repair operator after giving the initial solution. where the destroy operator randomly selects an α d e s t o r y proportion of damage points, whereas the repair operator uses a greedy algorithm to repair to the position that minimizes the cost. In this study, α d e s t o r y = 20 % . The results of the LNS algorithm are given in Table 16.
Summarizing the above results, it can be found that although the exact algorithm solves better than the heuristic algorithm, the exact algorithm is unable to solve all of the rebalancing problems within the acceptable time and the acceptable equipment cost. A comparison of the rebalancing algorithms that appear in this paper is shown in Summary Table 17. And among all the five rebalancing algorithms, LNS has a very fast convergence rate but the quality of the solution is poorer. The SA algorithm obtains the best quality of the solution, but its convergence rate is the only algorithm that is more than one hour. GA and IA have a convergence rate comparable to TS, but the quality of the solution may be slightly inferior to the TS algorithm. Therefore, the SA algorithm can be chosen if a higher-quality solution is desired. For an acceptable and feasible solution in a shorter time, one can try the TS algorithm, which takes half the time of the SA algorithm. In this paper, we choose to use the SA algorithm to solve for the rebalancing coefficients.

4.5. Comparison with Existing Studies

Most of the emission factors for bike-sharing systems given by existing studies are from the USA as well as Beijing, China, and their results show great regional differences. Luo et al. [11] give emission factors for docked bike-sharing systems in the USA ranging from 26 gCO 2 eq/km to 147 gCO 2 eq/km, with a median value of 65 gCO 2 eq/km, and the emission factors for dockless bike-sharing systems ranging from 78 gCO 2 eq/km to 160 gCO 2 eq/km, with a median value of 118 gCO 2 eq/km. The emission factor for a docked bike-sharing system in New York, USA in 2020 given by Chen et al. [12] is 98.17 gCO 2 eq/km. The data-integrating multiple docked bike-sharing systems in the USA for 2016 given by Kou et al. [69] show an emission factor of 128 gCO 2 eq/km, whereas Wang et al. [14] give an emission factor of 65.16 gCO 2 eq/km for the docked bike-sharing system in Beijing, China, and for the dockless bike-sharing system, the emission factor is 315.06 gCO 2 eq/km. This implies that the emission factors of the bike-sharing systems vary greatly geographically. In this paper, the emission factor of the docked bike-sharing system in Nanjing in 2017 is given as 22.02 gCO 2 eq/km, and for 2023, the emission factor is 92.84 gCO 2 eq/km or 102.70 gCO 2 eq/km.
In addition, the proportions of the components in the emission factors of the docked bike-sharing systems in China and the USA also differ significantly. In the emission factors for the 2016 docked bike-sharing system in New York, USA, given by Luo et al. [11], the contribution of the bike manufacturing phase is only 5%, while the contribution of the rebalancing phase is 32.6%; for the average value in the USA, the contribution of the bike manufacturing phase is only 5.5%, the contribution of the bicycle manufacturing phase is only 5.5%, and the contribution of the rebalancing phase is 35.9%; for the USA dockless bike sharing system, the contribution of the bicycle manufacturing phase is 17.3% and the contribution of the rebalancing phase is 72.6%. In another study, Chen et al. [12] give an emission factor for the docked bike-sharing system in New York, USA, with a contribution of 11.3% for the bike manufacturing stage and only 11.8% for the rebalancing stage. On the contrary, for China, in the emission factor given by Chen et al. [2] for Beijing’s 2017 dockless bike-sharing system, the contribution of the bicycle manufacturing stage was 83.8% and the contribution of the rebalancing stage was 4%. Wang et al. [14] gave a contribution of 83% from the bicycle manufacturing stage and 5% from the rebalancing stage in the emission factor for the dockless bike-sharing system in Beijing, while the contributions of the bicycle manufacturing stage and the rebalancing stage in the emission factor for the docked bike-sharing system located in Beijing were 40.9% and 17.8%, respectively. In our study, the contribution of the bicycle manufacturing stage of Nanjing’s docked bike-sharing system in 2017 was 59.18%, the contribution of the rebalancing stage was 10.78%, the contribution of the bicycle manufacturing stage of Nanjing’s docked bike-sharing system in 2023 was 51.78%, and the contribution of the rebalancing stage was 8.88%. It can be seen that the compositional share of the emission factors of bicycle sharing in China and the United States is very different. However, in terms of individual countries, different studies for China and the United States have yielded similar emission factor shares, respectively.
As for the emission factor share of the docked bike-sharing station facilities, the 2016 data share of the New York docked bike-sharing system in the United States given by Luo et al. [11] is 52.9%, and the average share across the United States is 51.1%. The data share of the New York docked bike-sharing system in the United States given by Chen et al. [12] is 66.2%. The data percentage of Beijing’s docked bike-sharing system given by Wang et al. [14] is 35%. In this paper, the percentage of this data for Nanjing, China’s docked bike-sharing system is 30.3% in 2017; the percentage of this data is 39.33% in 2023. Again, the existing studies produce a huge gap between China and the United States; and for China or the United States only, the data between different studies are similar and can be corroborated with each other.

4.6. Geographic Patterns between Environmental Benefits and Financial Operations

In the above section, we divided all stations in 2017 into 10 communities; similarly, all stations in 2023 were divided into 13 communities. In this section, we explore the operational revenues and costs within each community to analyze the geographic patterns of financial operations. Specifically, we calculate the revenues and costs within each community separately, including system construction costs and O&M costs. The benefits of each cross-community trip are divided equally between the two communities connecting the trip; similarly, each cross-community trip is divided equally between each community. Based on this, the total system construction and maintenance costs can be allocated to each community based on the ratio of the total number of trips supported by each community to the total number of trips.
Table 18 gives the operational benefits of the system by community according to the 2017 benchmark. We portray the geographic distribution of docked bike-sharing systems in Nanjing by community. It can be found that there is a huge difference in the geographical distribution of system operation. Among them, communities 1, 2, 3, 7, 8, and 10 all have negative benefits in the 9-year operation period. In particular, the losses of communities 1, 3, 7, and 10 increase year by year. Communities 4, 5, and 6 have positive returns in the third year. In contrast, community 9 has a longer payback time. From Figure 5b, it can be found that those communities that can realize a profit during the operation period are all located in the most prosperous main city of Nanjing.
Table 19 gives the sub-community operational benefits of using trucks for rebalancing based on the 2023 baseline. Communities 3, 4, 5, 7, 10, and 13 are unable to achieve a positive return within the nine-year operating period, and their losses all widen each year. Communities 1, 6, 9, and 12 can achieve positive returns in the third year; communities 2 and 8 take five years to recover their investment costs; and community 11 takes six years to become profitable. From Figure 5d, it can also be found that those communities that can realize a profit during the operation period are all located in and around the most prosperous main city of Nanjing. Compared to 2017, however, the area covered by non-loss-making communities in 2023 has expanded.
Table 20 gives the sub-community operational benefits of rebalancing using e-trikes based on the 2023 baseline. Although the results in Table 10 have shown that the operational program is not sustainable, communities 1, 8, 9, and 12 can make a profit over the 9-year operational period, while the rest of the communities continue to lose money. This suggests that customizing the rebalancing scheme by sub-communities may allow for better environmental benefits. In other words, using e-trikes for rebalancing in communities 1, 8, 9, and 12 and trucks for rebalancing in the rest of the communities to further reduce the carbon emissions of the system are viable options. Under this scenario, the emission factors of the Nanjing docked bike-sharing system are
E b i k e , 2023 , m i x l i f e c y c l e = 99.55 gCO 2 eq / km .
The operational benefits of the system under this scenario are given in Table 21. In comparison with Equations (73) and (74), this emission factor is smaller than the emission factor for rebalancing with all trucks and larger than the emission factor for rebalancing with all e-trikes. However, with this emission factor, the operator can achieve financial sustainability.

4.7. Policy Proposals

Through the above research, we can find that the reduction in demand makes the emission factor larger. Thus, in terms of environmental protection and carbon dioxide emission reduction, the encouragement of green travel behaviors using docked bike-sharing systems can protect the environment and reduce carbon dioxide emissions. Consequently, the government should increase its initiatives for green travel behaviors such as bike-sharing.
However, the results in Table 10 point to the fact that greater demand for docked bike-sharing systems may result in longer payback periods for operators. Consequently, increasing the use of docked bike-sharing systems on top of the existing ones, such as through government initiatives, would hurt the operators. Therefore, the government should provide certain incentives or compensation to the operators in the context of promoting low-carbon mobility.
In addition, the benefits of some emission-reduction actions, such as mandating operators to use more environmentally friendly e-trikes for rebalancing operations, cannot be matched with the costs incurred by the operators (Figure 9). As a result, the government may not need to give more guidance on rebalancing. However, the operational benefits of the system may have a geographical pattern. Therefore, if trucks and e-trikes are scheduled for dispatch according to geographic distribution (e.g., community detection in this paper), it may be possible to achieve both environmental benefits and financial operational sustainability. In Section 4.5, we point out that rebalancing operations account for a small percentage of the emission factor of bike-sharing in China. Instead, the government should impose certain restrictions on bike manufacturing and station setup manufacturing, such as the use of more environmentally friendly materials, to further reduce emissions from docked bike-sharing systems.
Finally, in the discussion in Section 4.5 we found that research on the environmental benefits of bike-sharing systems varies greatly at the national level. This means that for different countries, the results of existing studies cannot directly guide decision-making in other countries. In contrast, for different cities within a country, the results are similar. Therefore, cross-references and policy recommendations between cities within countries are possible. In the case of this study, it is instructive for docked bike-sharing systems in other cities in China. However, this study does not apply to cities outside of China, such as those in the United States. Cities in the USA need to refer to their country-specific studies when developing policies for docked bike-sharing systems.

5. Conclusions

In this paper, the sustainability of Nanjing’s docked bike-sharing system is investigated by comparing the data from March 2017 and March 2023 for its system. The sustainability of the system is divided into two parts: one is its environmental sustainability, which is mainly measured using CO 2 emissions, and the other is its financial sustainability, which is calculated by modeling its revenue.
In calculating the emission factor of the docked bike-sharing system in Nanjing, we simulated the whole rebalancing process. Since the system is very large, we first modified a community detection method to realize the region zoning. Second, since the solver could not work properly under such a large-scale system, we used three heuristic algorithms for comparative calculations. To be able to apply these heuristics successfully, we rewrite the objective function into the form of a suitable heuristic algorithm and give and prove dynamic boundary conditions for the new objective function. Ultimately, the simulated annealing method is chosen by comparison for the subsequent rebalancing coefficient calculation. We define the rebalancing coefficients and approximate the rebalancing coefficients by solving the one-week dispatch journey for estimating the approximate daily rebalancing journeys. Eventually, the emission coefficients of the docked bike-sharing system in Nanjing in 2017 and 2023 are obtained, and there is a 4.6-fold difference between them. In addition, whether one uses e-trikes or fuel truck dispatching has less impact on the emission factor of the docked bike-sharing system in Nanjing.
In estimating the financial sustainability of Nanjing’s docked bike-sharing system, we considered the system’s revenues over the next nine years, including facility input costs, facility replacement costs, dispatch costs, labor costs, maintenance costs, and the time value of money. The results show that in 2017, when user demand for use of Nanjing’s docked bike-sharing system is high, it will take eight years for the investment to be recouped; conversely, in 2023, when there is a significant loss of demand, the investment will be recouped in only six years. Additionally, switching distribution vehicles from fuel vehicles to e-trikes would result in an unsustainable system. After the conversion, it would severely deteriorate the operator’s key financial indicators with only a reduction in the emission factor value of 8.62 gCO 2 eq/km, and not only would the investment cost be unrecoverable, but the losses would widen year after year. We also explore the geographic patterns between environmental benefits and financial operations and find that arranging a mixed form of dispatch based on the detection of communities can balance environmental benefits and financial operations to reach dual sustainability. In addition, this paper compares the performance of some rebalancing algorithms and selects the best-performing one for rebalancing. Further, we find that the study on the emission factor of bike-sharing can obtain similar results within countries, while it varies greatly between countries.
This paper has the following shortcomings. First, the model constructed in this paper can only qualitatively describe the impact of COVID-19 on docked bike-sharing systems. Since the impact of COVID-19 on the docked bike-sharing system is at the overall level, quantifying that impact involves multiple aspects of research and requires more sensitive data that are harder to obtain (specific labor contract information, operators’ pricing strategies, etc.), and thus we are currently unable to quantitatively calculate that impact. Second, due to limitations in time, computing power, and data access, this paper only uses nearly two months (8 weeks) of data per year. The number of data in this paper may not be large enough. More data may be able to obtain more accurate results and exclude more hidden random factors.

Author Contributions

Y.L.: project administration, conceptualization, methodology, funding acquisition, data curation, software, supervision, visualization, formal analysis, writing—original draft, and writing—review and editing. W.L.: software, methodology, visualization, writing—original draft, writing—review and editing. R.Z.: software, writing—original draft, writing—review and editing. L.T.: project administration, methodology, funding acquisition, resources, writing—original draft, and writing—review and editing. All authors have read and agreed to the published version of the manuscript.

Funding

This work was supported by the National Key R&D Program of China (Grant No. 2020YFA0608601), the National Natural Science Foundation of China (Grant No. 72174091), Major programs of the National Social Science Foundation of China (Grant Nos. 22 and ZD136), and the Postgraduate Research and Practice Innovation Program of Jiangsu Province (Grant No. KYCX23_1754).

Institutional Review Board Statement

Not applicable.

Informed Consent Statement

Not applicable.

Data Availability Statement

Restrictions apply to the availability of these data. Data were obtained from Nanjing Public Bicycle Co. and are available from the authors with the permission of Nanjing Public Bicycle Co.

Conflicts of Interest

The authors declare no conflict of interest.

Abbreviations

Variables and abbreviations used in this paper and their corresponding explanations:
Variables or AbbreviationsMeanings
E b i k e l i f e c y c l e Life cycle emission factor for the docked bike-sharing
system
E b i k e M a n u f a c t u r i n g Life cycle emission factors for the manufacturing stage
of docked shared bicycles
E b i k e M a i n t e n a n c e Life cycle emission factors for the operational phase of
the docked bike-sharing system
E b i k e O p e r a t i o n Life cycle emission factors for the maintenance phase
of the docked bike-sharing system
E b i k e S c r a p Life cycle emission factors for the scrapping stage of
docked shared bicycles
E s t a t i o n Life cycle emission factors for docked bike-sharing
stations
E ^ s t a t i o n Life cycle emission factors for the docked bike-sharing
system’s station apparatus
E d o c k Life cycle emission factors for docked bike-sharing
station docks
d r i d e Distance cycled by docked shared bicycles during
the life cycle assessment period
E v e h i c l e Emission factors for distribution vehicles
f r e b a l a n c i n g Rebalancing coefficient
d r e b a l a n c i n g t Specific rebalancing distance traveled in period t
d r i d e t Distance cycled by docked shared bicycle in period t
n b i k e Number of bicycles
n d o c k Number of docks
n s t a t i o n Number of stations
ω i j Weighted adjacency matrix of a graph G with n nodes
cNumber of communities
θ r i Probability that a node in community r has a link to
node i
π r When a node is randomly selected in the network, the
probability that it is in the community r
q i r Probability that a node i belongs to community r
k i The out-degree of node i
ε A very small positive random number close to 0
f x Down-weighting function
KSet of distribution vehicles
VSet of warehouses and stations
V 0 A set of stations
l i j Distance from station i to station j
x i j k 0 1 variable, representing whether or not the kth
vehicle passes through the connecting edge from
station i to station j
f i j k Flow of kth vehicle from station i to station j
u j Imbalance at station j
v i Dummy variables introduced to eliminate sub-loops
QCapacity of distribution vehicles
μ A set of logical stations
μ i Imbalance of logical stations
S i Inventory of distribution vehicles after rebalancing
logical station i
C s t a r t Number of bicycles carried by distribution vehicles
when departing the warehouse station
M j A set of sequences for logical station μ i
θ i Interruption point
LTotal rebalancing distance
T t Annealing temperature
u t o t a l The sum of the absolute values of the
imbalances within each community
PNumber of chromosomes per generation
CChromosome length
P m Mutation rate
T ρ Threshold of affinity between antibody and antibody
α Diversity evaluation index
α d e s t r o y Proportion of damage points randomly selected by
the destroy operator
min f The value of the objective function solved by the
rebalancing algorithm
α C O V I D - 19 r e b a l a n c i n g COVID-19 impact coefficient on rebalancing costs for
the docked bike-sharing system
α C O V I D - 19 H c COVID-19 impact coefficient on labor costs for the
docked bike-sharing system
NProject planning period
S l Life expectancy of bicycle stations
B l Life expectancy of bicycles
STotal number of stations
BTotal number of bicycles
S c Construction costs of stations
B c Purchase cost of bicycles
C t o t a l Total construction cost
O t o t a l Annual operation and management costs
PAnnual revenues
R C Annual rebalancing costs
M C Annual maintenance costs
R P The inverse of the rebalancing coefficient
d y Total mileage traveled in month of year y
f p Unit fuel price
f c Fuel consumption per unit distance of truck
t p Truck procurement costs
l t Truck mileage at end of life
e p Unit cost of electricity
e d Power consumption per unit distance
e c E-trike procurement costs
e l Mileage life of e-trike
e b Range of e-trike in fully charged condition
e v Nominal voltage of e-trike batteries
e a Capacity of e-trike batteries
e m Power of e-trike motor
η Charging efficiency of batteries for e-trike
H c Labor cost factor
v t Truck speed
v e Speed of e-trike
H Travel time of distribution vehicle
rInterest rate
LPRLoan Prime Rate
R n Cumulative net benefits in year n of the system
LCALife Cycle Assessment
BRPBike-sharing Rebalancing Problem
PDVRP                                Pickup-and-Delivery Vehicle Routing Problem
M-TSPMultiple Traveling Salesman Problem
SASimulated Annealing
O&MOperation and Management
e-trikeThree-wheeled riding vehicles, electrically
powered, see Figure 9
GAGenetic Algorithm
IAImmune Algorithm
TSTabu Search
LNSLarge Neighborhood Search
kmKilometer
hHour
km/hKilometers per hour
VVoltage
min f The value of the objective function solved by the
rebalancing algorithm
WWatt
AhAmpere-hour
kW·hKilowatt-hour
CHY/kW·hChinese yuan per kilowatt-hour
CHYChinese Yuan
yYear
LLiter

References

  1. Shaheen, S.A.; Guzman, S.; Zhang, H. Bikesharing in Europe, the Americas, and Asia: Past, Present, and Future. Transp. Res. Rec. 2010, 2143, 159–167. [Google Scholar] [CrossRef]
  2. Chen, J.; Zhou, D.; Zhao, Y.; Wu, B.; Wu, T. Life cycle carbon dioxide emissions of bike sharing in China: Production, operation, and recycling. Resour. Conserv. Recycl. 2020, 162, 105011. [Google Scholar] [CrossRef]
  3. Guo, Y.; Yang, L.; Chen, Y. Bike Share Usage and the Built Environment: A Review. Front. Public Health 2022, 10, 848169. [Google Scholar] [CrossRef] [PubMed]
  4. Zhang, Y.; Mi, Z. Environmental benefits of bike sharing: A big data-based analysis. Appl. Energy 2018, 220, 296–301. [Google Scholar] [CrossRef]
  5. Shaheen, S.A.; Cohen, A.P.; Martin, E.W. Public Bikesharing in North America: Early Operator Understanding and Emerging Trends. Transp. Res. Rec. 2013, 2387, 83–92. [Google Scholar] [CrossRef]
  6. Nanjing Public Bicycle Co. Nanjing Public Bicycle, Co. 2023. Available online: https://www.qcc.com/firm/9438972e3d5b274a37d1f77d13e9063b.html (accessed on 17 November 2023).
  7. Ma, X.; Ji, Y.; Yuan, Y.; Van Oort, N.; Jin, Y.; Hoogendoorn, S. A comparison in travel patterns and determinants of user demand between docked and dockless bike-sharing systems using multi-sourced data. Transp. Res. Part A Policy Pract. 2020, 139, 148–173. [Google Scholar] [CrossRef]
  8. Cheng, L.; Yang, J.; Chen, X.; Cao, M.; Zhou, H.; Sun, Y. How could the station-based bike sharing system and the free-floating bike sharing system be coordinated? J. Transp. Geogr. 2020, 89, 102896. [Google Scholar] [CrossRef]
  9. Fishman, E.; Washington, S.; Haworth, N. Bike share’s impact on car use: Evidence from the United States, Great Britain, and Australia. Transp. Res. Part D Transp. Environ. 2014, 31, 13–20. [Google Scholar] [CrossRef]
  10. Bonilla-Alicea, R.J.; Watson, B.C.; Shen, Z.; Tamayo, L.; Telenko, C. Life cycle assessment to quantify the impact of technology improvements in bike-sharing systems. J. Ind. Ecol. 2020, 24, 138–148. [Google Scholar] [CrossRef]
  11. Luo, H.; Kou, Z.; Zhao, F.; Cai, H. Comparative life cycle assessment of station-based and dock-less bike sharing systems. Resour. Conserv. Recycl. 2019, 146, 180–189. [Google Scholar] [CrossRef]
  12. Chen, M.; Cai, Y.; Zhou, Y.; Chen, L.; Wan, H.; Li, Z. Life-cycle greenhouse gas emission assessment for bike-sharing systems based on a rebalancing emission estimation model. Resour. Conserv. Recycl. 2023, 191, 106892. [Google Scholar] [CrossRef]
  13. Mao, G.; Hou, T.; Liu, X.; Zuo, J.; Kiyawa, A.H.I.; Shi, P.; Sandhu, S. How can bicycle-sharing have a sustainable future? A research based on life cycle assessment. J. Clean. Prod. 2021, 282, 125081. [Google Scholar] [CrossRef]
  14. Wang, Y.; Sun, S. Does large scale free-floating bike sharing really improve the sustainability of urban transportation? Empirical evidence from Beijing. Sustain. Cities Soc. 2022, 76, 103533. [Google Scholar] [CrossRef]
  15. Si, H.; Shi, J.; Wu, G.; Chen, J.; Zhao, X. Mapping the bike sharing research published from 2010 to 2018: A scientometric review. J. Clean. Prod. 2019, 213, 415–427. [Google Scholar] [CrossRef]
  16. Qiu, L.Y.; He, L.Y. Bike Sharing and the Economy, the Environment, and Health-Related Externalities. Sustainability 2018, 10, 1145. [Google Scholar] [CrossRef]
  17. Chen, Y.; Zhang, Y.; Coffman, D.; Mi, Z. An environmental benefit analysis of bike sharing in New York City. Cities 2022, 121, 103475. [Google Scholar] [CrossRef]
  18. Ma, X.; Zhang, S.; Wu, T.; Yang, Y.; Yu, J. Can dockless and docked bike-sharing substitute each other? Evidence from Nanjing, China. Renew. Sustain. Energy Rev. 2023, 188, 113780. [Google Scholar] [CrossRef]
  19. Lv, H.; Li, H.; Chen, Y.; Feng, T. An origin-destination level analysis on the competitiveness of bike-sharing to underground using explainable machine learning. J. Transp. Geogr. 2023, 113, 103716. [Google Scholar] [CrossRef]
  20. Fu, C.; Huang, Z.; Scheuer, B.; Lin, J.; Zhang, Y. Integration of dockless bike-sharing and metro: Prediction and explanation at origin-destination level. Sustain. Cities Soc. 2023, 99, 104906. [Google Scholar] [CrossRef]
  21. Shi, X.; Zhao, J.; He, J.; Xu, H. Exploring year-to-year spatiotemporal changes in cycling patterns for bike-sharing system in the pre-, during and post-pandemic periods. Sustain. Cities Soc. 2023, 98, 104814. [Google Scholar] [CrossRef]
  22. Lazarus, J.; Pourquier, J.C.; Feng, F.; Hammel, H.; Shaheen, S. Micromobility evolution and expansion: Understanding how docked and dockless bikesharing models complement and compete—A case study of San Francisco. J. Transp. Geogr. 2020, 84, 102620. [Google Scholar] [CrossRef]
  23. Chen, W.; Chen, X.; Cheng, L.; Chen, J.; Tao, S. Locating new docked bike sharing stations considering demand suitability and spatial accessibility. Travel Behav. Soc. 2024, 34, 100675. [Google Scholar] [CrossRef]
  24. Zhang, H.; Song, X.; Long, Y.; Xia, T.; Fang, K.; Zheng, J.; Huang, D.; Shibasaki, R.; Liang, Y. Mobile phone GPS data in urban bicycle-sharing: Layout optimization and emissions reduction analysis. Appl. Energy 2019, 242, 138–147. [Google Scholar] [CrossRef]
  25. Fontes, T.; Arantes, M.; Figueiredo, P.V.; Novais, P. A Cluster-Based Approach Using Smartphone Data for Bike-Sharing Docking Stations Identification: Lisbon Case Study. Smart Cities 2022, 5, 251–275. [Google Scholar] [CrossRef]
  26. Kuo, Y.W.; Hsieh, C.H.; Hung, Y.C. Non-linear characteristics in switching intention to use a docked bike-sharing system. Transportation 2021, 48, 1459–1479. [Google Scholar] [CrossRef]
  27. Ji, Y.; Ma, X.; He, M.; Jin, Y.; Yuan, Y. Comparison of usage regularity and its determinants between docked and dockless bike-sharing systems: A case study in Nanjing, China. J. Clean. Prod. 2020, 255, 120110. [Google Scholar] [CrossRef]
  28. Wei, X.; Luo, S.; Nie, Y.M. Diffusion behavior in a docked bike-sharing system. Transp. Res. Part C Emerg. Technol. 2019, 107, 510–524. [Google Scholar] [CrossRef]
  29. Zhang, L.; Song, J. The periodicity and initial evolution of micro-mobility systems: A case study of the docked bike-sharing system in New York City, USA. Eur. Transp. Res. Rev. 2022, 14, 27. [Google Scholar] [CrossRef]
  30. Dell’Amico, M.; Hadjicostantinou, E.; Iori, M.; Novellani, S. The bike sharing rebalancing problem: Mathematical formulations and benchmark instances. Omega 2014, 45, 7–19. [Google Scholar] [CrossRef]
  31. Médard de Chardon, C.; Caruso, G.; Thomas, I. Bike-share rebalancing strategies, patterns, and purpose. J. Transp. Geogr. 2016, 55, 22–39. [Google Scholar] [CrossRef]
  32. Dell’Amico, M.; Iori, M.; Novellani, S.; Subramanian, A. The Bike sharing Rebalancing Problem with Stochastic Demands. Transp. Res. Part B Methodol. 2018, 118, 362–380. [Google Scholar] [CrossRef]
  33. Schuijbroek, J.; Hampshire, R.; van Hoeve, W.J. Inventory rebalancing and vehicle routing in bike sharing systems. Eur. J. Oper. Res. 2017, 257, 992–1004. [Google Scholar] [CrossRef]
  34. Zhou, Y.; Lin, Z.; Guan, R.; Sheu, J.B. Dynamic battery swapping and rebalancing strategies for e-bike sharing systems. Transp. Res. Part B Methodol. 2023, 177, 102820. [Google Scholar] [CrossRef]
  35. Chemla, D.; Meunier, F.; Wolfler Calvo, R. Bike sharing systems: Solving the static rebalancing problem. Discret. Optim. 2013, 10, 120–146. [Google Scholar] [CrossRef]
  36. Pal, A.; Zhang, Y. Free-floating bike sharing: Solving real-life large-scale static rebalancing problems. Transp. Res. Part C Emerg. Technol. 2017, 80, 92–116. [Google Scholar] [CrossRef]
  37. Cruz, F.; Subramanian, A.; Bruck, B.P.; Iori, M. A heuristic algorithm for a single vehicle static bike sharing rebalancing problem. Comput. Oper. Res. 2017, 79, 19–33. [Google Scholar] [CrossRef]
  38. Nunes, P.; Moura, A.; Santos, J.P.; Completo, A. A Simulated Annealing Algorithm to Solve the Multi-objective Bike Routing Problem. In Proceedings of the 2021 International Symposium on Computer Science and Intelligent Controls (ISCSIC), Rome, Italy, 12–14 November 2021; pp. 39–45. [Google Scholar] [CrossRef]
  39. Pan, L.; Liu, X.; Xia, Y.; Xing, L.N. Tabu Search Algorithm for the Bike Sharing Rebalancing Problem. IEEE Access 2020, 8, 144543–144556. [Google Scholar] [CrossRef]
  40. Ho, S.C.; Szeto, W. A hybrid large neighborhood search for the static multi-vehicle bike-repositioning problem. Transp. Res. Part B Methodol. 2017, 95, 340–363. [Google Scholar] [CrossRef]
  41. Qiao, J.; He, M.; Sun, N.; Sun, P.; Fan, Y. Factors affecting the final solution of the bike-sharing rebalancing problem under heuristic algorithms. Comput. Oper. Res. 2023, 159, 106368. [Google Scholar] [CrossRef]
  42. Su, S.; Yu, H.; Xiong, D.; Dong, X. A multiobjective dynamic rebalancing evolutionary algorithm for free-floating bike sharing. Appl. Soft Comput. 2023, 147, 110696. [Google Scholar] [CrossRef]
  43. Maleki, A.; Nejati, E.; Aghsami, A.; Jolai, F. Developing a supervised learning-based simulation method as a decision support tool for rebalancing problems in bike-sharing systems. Expert Syst. Appl. 2023, 233, 120983. [Google Scholar] [CrossRef]
  44. Zhang, Z.; Krishnakumari, P.; Schulte, F.; van Oort, N. Improving the service of E-bike sharing by demand pattern analysis: A data-driven approach. Res. Transp. Econ. 2023, 101, 101340. [Google Scholar] [CrossRef]
  45. Vallez, C.M.; Castro, M.; Contreras, D. Challenges and Opportunities in Dock-Based Bike-Sharing Rebalancing: A Systematic Review. Sustainability 2021, 13, 1829. [Google Scholar] [CrossRef]
  46. Guinée, J.B.; Heijungs, R.; Huppes, G.; Zamagni, A.; Masoni, P.; Buonamici, R.; Ekvall, T.; Rydberg, T. Life Cycle Assessment: Past, Present, and Future. Environ. Sci. Technol. 2011, 45, 90–96. [Google Scholar] [CrossRef] [PubMed]
  47. Hao, J.L.; Cheng, B.; Lu, W.; Xu, J.; Wang, J.; Bu, W.; Guo, Z. Carbon emission reduction in prefabrication construction during materialization stage: A BIM-based life-cycle assessment approach. Sci. Total Environ. 2020, 723, 137870. [Google Scholar] [CrossRef] [PubMed]
  48. Cheng, B.; Li, J.; Tam, V.W.Y.; Yang, M.; Chen, D. A BIM-LCA Approach for Estimating the Greenhouse Gas Emissions of Large-Scale Public Buildings: A Case Study. Sustainability 2020, 12, 685. [Google Scholar] [CrossRef]
  49. Cheng, B.; Huang, J.; Lu, K.; Li, J.; Gao, G.; Wang, T.; Chen, H. BIM-enabled life cycle assessment of concrete formwork waste reduction through prefabrication. Sustain. Energy Technol. Assess. 2022, 53, 102449. [Google Scholar] [CrossRef]
  50. Vidergar, P.; Perc, M.; Lukman, R.K. A survey of the life cycle assessment of food supply chains. J. Clean. Prod. 2021, 286, 125506. [Google Scholar] [CrossRef]
  51. Hou, P.; Jolliet, O.; Zhu, J.; Xu, M. Estimate ecotoxicity characterization factors for chemicals in life cycle assessment using machine learning models. Environ. Int. 2020, 135, 105393. [Google Scholar] [CrossRef]
  52. Yao, L.; Liu, T.; Chen, X.; Mahdi, M.; Ni, J. An integrated method of life-cycle assessment and system dynamics for waste mobile phone management and recycling in China. J. Clean. Prod. 2018, 187, 852–862. [Google Scholar] [CrossRef]
  53. Hiloidhari, M.; Baruah, D.; Singh, A.; Kataki, S.; Medhi, K.; Kumari, S.; Ramachandra, T.; Jenkins, B.; Thakur, I.S. Emerging role of Geographical Information System (GIS), Life Cycle Assessment (LCA) and spatial LCA (GIS-LCA) in sustainable bioenergy planning. Bioresour. Technol. 2017, 242, 218–226. [Google Scholar] [CrossRef]
  54. Pourahmadiyan, A.; Ahmadi, P.; Kjeang, E. Dynamic simulation and life cycle greenhouse gas impact assessment of CNG, LNG, and diesel-powered transit buses in British Columbia, Canada. Transp. Res. Part D Transp. Environ. 2021, 92, 102724. [Google Scholar] [CrossRef]
  55. Chang, C.C.; Liao, Y.T.; Chang, Y.W. Life Cycle Assessment of Carbon Footprint in Public Transportation—A Case Study of Bus Route NO. 2 in Tainan City, Taiwan. Procedia Manuf. 2019, 30, 388–395. [Google Scholar] [CrossRef]
  56. Liu, M.; Jia, S.; He, X. A quota-based GHG emissions quantification model for the construction of subway stations in China. J. Clean. Prod. 2018, 198, 847–858. [Google Scholar] [CrossRef]
  57. De Souza, L.L.P.; Lora, E.E.S.; Palacio, J.C.E.; Rocha, M.H.; Renó, M.L.G.; Venturini, O.J. Comparative environmental life cycle assessment of conventional vehicles with different fuel options, plug-in hybrid and electric vehicles for a sustainable transportation system in Brazil. J. Clean. Prod. 2018, 203, 444–468. [Google Scholar] [CrossRef]
  58. Al-Thawadi, F.E.; Weldu, Y.W.; Al-Ghamdi, S.G. Sustainable Urban Transportation Approaches: Life-Cycle Assessment Perspective of Passenger Transport Modes in Qatar. Transp. Res. Procedia 2020, 48, 2056–2062. [Google Scholar] [CrossRef]
  59. Meng, F.; Liu, G.; Yang, Z.; Hao, Y.; Ulgiati, S. Assessment of Urban Transportation Metabolism from Life Cycle Perspective: A Multi-method Study. Energy Procedia 2016, 88, 243–249. [Google Scholar] [CrossRef]
  60. Cheng, B.; Li, J.; Su, H.; Lu, K.; Chen, H.; Huang, J. Life cycle assessment of greenhouse gas emission reduction through bike-sharing for sustainable cities. Sustain. Energy Technol. Assess. 2022, 53, 102789. [Google Scholar] [CrossRef]
  61. Zheng, F.; Gu, F.; Zhang, W.; Guo, J. Is Bicycle Sharing an Environmental Practice? Evidence from a Life Cycle Assessment Based on Behavioral Surveys. Sustainability 2019, 11, 1550. [Google Scholar] [CrossRef]
  62. Lai, R.; Ma, X.; Zhang, F.; Ji, Y. Life Cycle Assessment of Free-Floating Bike Sharing on Greenhouse Gas Emissions: A Case Study in Nanjing, China. Appl. Sci. 2021, 11, 11307. [Google Scholar] [CrossRef]
  63. Ding, N.; Pan, J.; Zhang, Z.; Yang, J. Life cycle assessment of car sharing models and the effect on GWP of urban transportation: A case study of Beijing. Sci. Total Environ. 2019, 688, 1137–1144. [Google Scholar] [CrossRef] [PubMed]
  64. Vilaça, M.; Santos, G.; Oliveira, M.S.; Coelho, M.C.; Correia, G.H. Life cycle assessment of shared and private use of automated and electric vehicles on interurban mobility. Appl. Energy 2022, 310, 118589. [Google Scholar] [CrossRef]
  65. Schelte, N.; Severengiz, S.; Schünemann, J.; Finke, S.; Bauer, O.; Metzen, M. Life Cycle Assessment on Electric Moped Scooter Sharing. Sustainability 2021, 13, 8297. [Google Scholar] [CrossRef]
  66. Severengiz, S.; Finke, S.; Schelte, N.; Wendt, N. Life Cycle Assessment on the Mobility Service E-Scooter Sharing. In Proceedings of the 2020 IEEE European Technology and Engineering Management Summit (E-TEMS), Dortmund, Germany, 5–7 March 2020; pp. 1–6. [Google Scholar] [CrossRef]
  67. Zhu, Z.; Lu, C. Life cycle assessment of shared electric bicycle on greenhouse gas emissions in China. Sci. Total Environ. 2023, 860, 160546. [Google Scholar] [CrossRef]
  68. Sun, S.; Wang, Z.; Wang, W. Can free-floating electric bike sharing promote more sustainable urban mobility? Evidence from a life cycle environmental impact assessment. J. Clean. Prod. 2023, 415, 137862. [Google Scholar] [CrossRef]
  69. Kou, Z.; Wang, X.; Chiu, S.F.A.; Cai, H. Quantifying greenhouse gas emissions reduction from bike share systems: A model considering real-world trips and transportation mode choice patterns. Resour. Conserv. Recycl. 2020, 153, 104534. [Google Scholar] [CrossRef]
  70. O’Brien, O.; Cheshire, J.; Batty, M. Mining bicycle sharing data for generating insights into sustainable transport systems. J. Transp. Geogr. 2014, 34, 262–273. [Google Scholar] [CrossRef]
  71. Huang, G.; Zhang, W.; Xu, D. How do technology-enabled bike-sharing services improve urban air pollution? Empirical evidence from China. J. Clean. Prod. 2022, 379, 134771. [Google Scholar] [CrossRef]
  72. Wang, J.; Kwan, M.P.; Cao, W.; Gong, Y.; Guo, L.; Liu, Y. Assessing changes in job accessibility and commuting time under bike-sharing scenarios. Transp. A Transp. Sci. 2022, 1–17. [Google Scholar] [CrossRef]
  73. Faghih-Imani, A.; Anowar, S.; Miller, E.J.; Eluru, N. Hail a cab or ride a bike? A travel time comparison of taxi and bicycle-sharing systems in New York City. Transp. Res. Part A Policy Pract. 2017, 101, 11–21. [Google Scholar] [CrossRef]
  74. Liu, Z.; Jia, X.; Cheng, W. Solving the Last Mile Problem: Ensure the Success of Public Bicycle System in Beijing. Procedia Soc. Behav. Sci. 2012, 43, 73–78. [Google Scholar] [CrossRef]
  75. Teixeira, J.F.; Silva, C.; Moura e Sá, F. The strengths and weaknesses of bike sharing as an alternative mode during disruptive public health crisis: A qualitative analysis on the users’ motivations during COVID-19. Transp. Policy 2022, 129, 24–37. [Google Scholar] [CrossRef] [PubMed]
  76. Liu, Y.; Tian, Z.; Pan, B.; Zhang, W.; Liu, Y.; Tian, L. A hybrid big-data-based and tolerance-based method to estimate environmental benefits of electric bike sharing. Appl. Energy 2022, 315, 118974. [Google Scholar] [CrossRef]
  77. Sonnemann, G.; Gemechu, E.D.; Remmen, A.; Frydendal, J.; Jensen, A.A. Life Cycle Management: Implementing Sustainability in Business Practice. In Life Cycle Management; Sonnemann, G., Margni, M., Eds.; Springer: Dordrecht, The Netherlands, 2015; pp. 7–21. [Google Scholar] [CrossRef]
  78. Tian, Z.; Zhou, J.; Wang, M. Dynamic evolution of demand fluctuation in bike-sharing systems for green travel. J. Clean. Prod. 2019, 231, 1364–1374. [Google Scholar] [CrossRef]
  79. Tian, Z.; Zhou, J.; Szeto, W.; Tian, L.; Zhang, W. The rebalancing of bike-sharing system under flow-type task window. Transp. Res. Part C Emerg. Technol. 2020, 112, 1–27. [Google Scholar] [CrossRef]
  80. Zhang, X.; Shen, Y.; Zhao, J. The mobility pattern of dockless bike sharing: A four-month study in Singapore. Transp. Res. Part D Transp. Environ. 2021, 98, 102961. [Google Scholar] [CrossRef]
  81. Liu, Y.; Tian, L. A graded cluster system to mine virtual stations in free-floating bike-sharing system on multi-scale geographic view. J. Clean. Prod. 2021, 281, 124692. [Google Scholar] [CrossRef]
  82. Kim, Y.; Son, S.W.; Jeong, H. Finding communities in directed networks. Phys. Rev. E 2010, 81, 016103. [Google Scholar] [CrossRef]
  83. Newman, M.E.J.; Leicht, E.A. Mixture models and exploratory analysis in networks. Proc. Natl. Acad. Sci. USA 2007, 104, 9564–9569. [Google Scholar] [CrossRef]
  84. Van Laarhoven, P.J.; Aarts, E.H.; van Laarhoven, P.J.; Aarts, E.H. Simulated Annealing; Springer: Berlin/Heidelberg, Germany, 1987. [Google Scholar]
  85. Brémaud, P. Markov Chains: Gibbs Fields, Monte Carlo Simulation, and Queues; Springer Science & Business Media: Berlin/Heidelberg, Germany, 2001; Volume 31. [Google Scholar]
  86. Chao, X. Study on the Cost-Effectiveness of Urban Public Bicycle Service System. Master’s Thesis, Chang’an University, Xi’an, China, 2016. [Google Scholar]
  87. General Office of the Standing Committee of the National People’s Congress (NPCSC). Road Traffic Safety Law of the People’s Republic of China. 2021. Available online: https://flk.npc.gov.cn/detail2.html?ZmY4MDgxODE3YWIyMzFlYjAxN2FiZDYxN2VmNzA1MTk (accessed on 17 November 2023).
  88. Ministry of Commerce of the People’s Republic of China. Regulations on Mandatory Scrapping Standards for Motor Vehicles. 2013. Available online: http://www.mofcom.gov.cn/article/swfg/swfgbh/201303/20130300062947.shtml (accessed on 17 November 2023).
  89. General Office of the Standing Committee of the National People’s Congress (NPCSC). Regulations of the People’s Republic of China on the Implementation of the Road Traffic Safety Law. 2017. Available online: https://flk.npc.gov.cn/detail2.html?ZmY4MDgwODE2ZjNjYmIzYzAxNmY0MGY1NjZjMTBlMjM (accessed on 17 November 2023).
  90. The People’s Bank of China. Announcement of the National Interbank Offered Rate Center Authorized to Publish Loan Prime Rate (LPR) on September 20, 2023. 2023. Available online: http://www.pbc.gov.cn/zhengcehuobisi/125207/125213/125440/3876551/5073637/index.html (accessed on 17 November 2023).
  91. Jiangsu News. Little Yellow, Little Blue, Little Orange… the Popularity of the Shared Bicycle, In Fact, Can “Ride” How Far? 2017. Available online: https://mp.weixin.qq.com/s?__biz=MTk5NjQ0NTAwMQ==&mid=2649814478&idx=3&sn=022a54f0d3ea4d92acfa08a7b06e5528&chksm=46c4f7e871b37efe62c0fd2226622e7e635ec8eb0867e99da0b54a2310fbda2a6910f5c13fa6&scene=27 (accessed on 17 November 2023).
  92. Leju. 300,000–380,000 Units Nanjing Announces Optimal Size for Shared Bicycles. 2018. Available online: https://baijiahao.baidu.com/s?id=1594234891657424821&wfr=spider&for=pc (accessed on 17 November 2023).
  93. Tiger Olfactory. Shocking Shared Bicycle Graveyards! 20 Documented Shared Bicycle Graveyard. 2018. Available online: https://baijiahao.baidu.com/s?id=1607159590209092211&wfr=spider&for=pc (accessed on 17 November 2023).
  94. Sina. Ofo was Exposed to the Refund Deposit Cycle Being Extended Again! Netizens Shouted, “Hurry to Pay Back the Money”. 2018. Available online: https://tech.sina.com.cn/i/2018-10-27/doc-ihnaivxp4804234.shtml (accessed on 17 November 2023).
  95. LOHAS Nanjing. History of Bike-Sharing in Nanjing. 2019. Available online: https://baijiahao.baidu.com/s?id=1635916758305218128&wfr=spider&for=pc (accessed on 17 November 2023).
  96. Blue Whale Finance. 2021 Year-End Inventory: Shared Bicycles in Three Companies, into the Fence Settlement to Solve the Persistent Problems, Fingerprint Unlocking to be Tested. 2022. Available online: https://baijiahao.baidu.com/s?id=1722433565440983927&wfr=spider&for=pc (accessed on 17 November 2023).
  97. Economic Observer. Shared Bicycle “Price Hike” Sound. 2023. Available online: https://baijiahao.baidu.com/s?id=1755149270908117654&wfr=spider&for=pc (accessed on 17 November 2023).
  98. Shang, W.L.; Chen, J.; Bi, H.; Sui, Y.; Chen, Y.; Yu, H. Impacts of COVID-19 pandemic on user behaviors and environmental benefits of bike sharing: A big-data analysis. Appl. Energy 2021, 285, 116429. [Google Scholar] [CrossRef]
  99. Lei, Y.; Ozbay, K. A robust analysis of the impacts of the stay-at-home policy on taxi and Citi Bike usage: A case study of Manhattan. Transp. Policy 2021, 110, 487–498. [Google Scholar] [CrossRef]
  100. Hu, S.; Xiong, C.; Liu, Z.; Zhang, L. Examining spatiotemporal changing patterns of bike-sharing usage during COVID-19 pandemic. J. Transp. Geogr. 2021, 91, 102997. [Google Scholar] [CrossRef] [PubMed]
  101. Li, H.; Zhang, Y.; Zhu, M.; Ren, G. Impacts of COVID-19 on the usage of public bicycle share in London. Transp. Res. Part A Policy Pract. 2021, 150, 140–155. [Google Scholar] [CrossRef] [PubMed]
  102. Alander, J. On optimal population size of genetic algorithms. In Proceedings of the CompEuro 1992 Proceedings Computer Systems and Software Engineering, Hague, The Netherlands, 4–8 May 1992; pp. 65–70. [Google Scholar] [CrossRef]
  103. Michalewicz, Z.; Fogel, D.B. How to Solve It: Modern Heuristics; Springer Science & Business Media: Berlin/Heidelberg, Germany, 2013. [Google Scholar]
  104. Goldberg, D.E.; Lingle, R. Alleles, loci, and the traveling salesman problem. In Proceedings of the 1st International Conference on Genetic Algorithms, Pittsburgh, PA, USA, 24–26 July 1985; L. Erlbaum Associates Inc.: Hillsdale, NJ, USA, 1985; pp. 154–159. [Google Scholar]
  105. Bhatia, K. Genetic Algorithms and the Traveling Salesman Problem. In Computer Science and Engineering CSE292: New Age Algorithms; University of California: San Diego, CA, USA, 1994. [Google Scholar]
Figure 1. (a) The total number of miles traveled daily by docked shared bicycles in Nanjing. (b) The total number of times docked shared bicycles are used daily in Nanjing. (c) The average number of miles traveled per trip daily by docked shared bicycles in Nanjing. (d) The daily turnover rate of docked shared bicycles in Nanjing. (e) Average time per trip daily for docked shared bicycles in Nanjing.
Sustainability 15 16738 g001
Figure 2. (a) Distribution of the average daily mileage traveled by docked shared bicycles with cycling distance in Nanjing. (b) Distribution of the total number of daily uses of docked shared bicycles with cycling distance in Nanjing.
Sustainability 15 16738 g002
Figure 3. Visualization of the weights of each connected edge in a network constructed using March 2017 data on the docked bike-sharing system in Nanjing.
Sustainability 15 16738 g003
Figure 4. Imbalance at each station of the docked bike-sharing system on 1 March 2017, in Nanjing.
Sustainability 15 16738 g004
Figure 5. (a) Community detection results for the March 2017 complex network. (b) Community detection results for the complex network in March 2017 after manual adjustment. (c) Community detection results for the March 2023 complex network. (d) Community detection results for complex networks in March 2023 after manual adjustment.
Sustainability 15 16738 g005
Figure 6. (a) Relationship between the cumulative number of bicycle cycling days and the number of repairs. (b) Relationship between the number of repairs in a month and the number of bicycles in the docked bike-sharing system in Nanjing in 2017 and 2023.
Sustainability 15 16738 g006
Figure 7. CO 2 emissions per kilometer of cycling from sub-sources.
Sustainability 15 16738 g007
Figure 8. (a) Distribution of the number of docked shared bicycle rides with cycling time in Nanjing. (b) Percentage distribution of the number of docked shared bicycle rides in Nanjing with cycling time.
Sustainability 15 16738 g008
Figure 9. Use e-trike to rebalance shared bicycles. (a) Use e-trike to rebalance shared bicycles at night; (b) Use e-trike to rebalance shared bicycles during the day.
Sustainability 15 16738 g009
Table 1. Comparison of emission factor studies of bike-sharing systems.
LiteratureCountryData SetsSystemEmission Factor
gCO 2 /eq/pkm
Calculation of Rebalancing
Luo et al. [11]USABike-sharing system data
for New York City and Seattle
Docked65 (26–147)Rough estimates using empirical data or rough
estimates using data from others’ studies
Dockless118 (78–160)
Chen et al. [12]USACiti Bike program in New York CityDocked98.17Select 20 days of data and solve using the
Gurobi 9.1.2 solver
Kou et al. [69]USASeattle (Pronto Cycle Share),
Los Angeles (Metro Bike Share),
the Bay Area (Ford Gobike),
Philadelphia (Indego Bike Share),
Boston (Hubway, now renamed Blue Bikes),
Washington, D.C. (Capital Bike Share),
Chicago (Divvy),
and New York City (Citi Bike Share)
for eight bike-sharing systems
Docked128Rough estimates using empirical data or rough
estimates using data from others’ studies
Wang et al. [14]ChinaBeijing’s bike-sharing systemDocked65.16Rough estimates using empirical data or rough
estimates using data from others’ studies
Dockless315.06
Table 2. Results of exact solution using Gurobi 10.0.1. min f units are in meters in the table.
min f TimeGapNumber of Paths u total
Community1- 21:05:51 1-2 3813
-1:05:28 1-1 4
2-1:14:13 1-81379
-2:36:02 1-6
330,898.9400:04.00.01%2243
30,898.9400:03.20.01%1
4-1:26:15 1-51722
5
5-Model is infeasible-11223
-3:40:07 1-2
6-3:57:52 1-21683
2
7-2:48:48 1-81336
-10:06:10 1-7
8-6:38:16 1-61527
6
9-1:57:37 1-92266
-12:32:52 1-8
10-2:44:31 1-31510
-2:50:34 1-4
1 The time returned by Gurobi and printed by Python when the Python kernel died. 2 “-” means that no feasible solution has been found. 3 The number of paths given by Equation (27); the following is the same as this. 4 The number of paths given by the result of the SA algorithm; the following is the same as this.
Table 3. Results of the solution using SA. min f units are in meters in the table.
Min fTime
Community181,505.7727:15.1
248,469.3414:00.4
331,438.4102:33.9
481,670.2613:27.0
540,429.4513:06.8
681,684.9823:06.9
7128,618.0648:23.1
867,812.6418:31.8
974,517.991:07:41.4
1078,295.3215:48.7
Total time (parallel) 1 1:07:41.4
1 The SA algorithm uses parallel computing techniques. For Gurobi, we did not solve the 10 communities in parallel since parallel computing techniques would have been utilized in the solution process within a single solution problem.
Table 4. Values of system scaling-related parameters in 2017 and 2023.
Year N l S l B l BS
2017910 [11]3 [13]39,3021086
2023910334,1241476
Table 5. The values of the relevant parameters.
S c d 2017 (km) e p (CHY/kWh) f p (CHY) e v (V)
12,0007,027,566.301.0257.7572
B c d 2023 (km) e d (kWh) f c (L) e a (Ah)
600 [86]1,513,898.240.0370.1245
e c (CHY) t p (CHY) v t (km/h) l t (km) e m (W)
5000150,00060 [87]600,000 [88]1000
e l (km) H c (CHY) v e (km/h)h η
100,000 [88]500030 [89]60.9
Table 6. Initial construction costs and average annual operating costs in 2017 and 2023.
Year R c v R c m
2017287,690.063,386,182.45
2023 (truck)237,187.212,791,751.56
2023 (e-trike)26,514.498,376,612.88
Table 7. Number of maintenance bicycles and cost of maintenance equipment in 2017 and 2023.
Year m y M c v M c m
2017365,2922,154,085.523,002,400.00
202392,620546,169.64761,260.27
Table 8. Initial construction costs and average annual operating costs for 2017 and 2023.
Year C total O total
201736,613,2008,830,358.04
2023 (truck)38,186,4004,336,368.69
2023 (e-trike)38,186,4009,710,557.29
Table 9. System annual revenues for 2017 and 2023.
Revenue20172023
CHY21,420,62418,129,744
Table 10. System operational benefits.
20172023 (Truck)2023 (e-Trike)
y = 1 −29,075,555.64−29,662,747.89−35,036,936.49
y = 2 −20,497,716.35−19,962,831.79−31,452,847.02
y = 3 −10,736,135.24−8,924,327.267−27,374,153.2
y = 4 −23,208,655.94−16,836,909.12−43,206,999.64
y = 5 −13,821,184.49−5,367,027.269−40,750,378.88
y = 6 −3,138,241.997,685,698.277−37,954,744.46
y = 7 −14,562,253.422,065,299.949−55,247,712.49
y = 8 −3,981,578.4216,143,686.65−54,452,710.11
y = 9 8,059,229.7232,164,890.72−53,547,997.39
Table 11. Contributions of rebalancing, bicycles, docks, and stations to the emission factors of a docked bike-sharing system in Nanjing.
RebalancingBicycleDockStation
2017, truck10.79%59.17%18.29%11.74%
2023, truck8.86%51.79%23.26%16.09%
2023, e-trike0.39%56.61%25.42%17.58%
Table 12. Results of the solution using GA. min f units are in meters in the table.
min f Time Δ
Community1195,720.5726:35.7114,214.80
267,100.2610:59.818,630.92
333,037.3403:28.72138.39
4179,306.3223:03.197,636.06
582,709.3920:26.842,279.95
6180,713.4934:16.699,028.51
7299,185.4340:21.8170,567.37
8126,126.4521:22.658,313.81
9147,584.2833:49.873,066.29
10165,892.4926:52.287,597.17
Total time (parallel) 40:21.8
Table 13. Results of the solution using SA. min f units are in meters in the table.
min f Time Δ
Community181,505.7727:15.10
248,469.3414:00.40
331,438.4102:33.9539.47
481,670.2613:27.00
540,429.4513:06.80
681,684.9823:06.90
7128,618.0648:23.10
867,812.6418:31.80
974,517.991:07:41.40
1078,295.3215:48.70
Total time (parallel) 1:07:41.4
Table 14. Results of the solution using IA. min f units are in meters in the table.
min f Time Δ
Community1266,585.0126:48.1185,079.24
266,990.6409:44.818,521.30
343,453.1803:30.212,554.24
4194,982.9523:46.2113,312.69
596,496.4122:35.956,066.96
6220,357.0835:26.6138,672.09
7320,822.7631:41.1192,204.71
8158,142.7522:13.090,330.11
9162,785.4133:34.388,267.42
10191,886.7226:24.8113,591.40
Total time (parallel) 35:26.6
Table 15. Results of the solution using TS. min f units are in meters in the table.
min f Time Δ
Community1160,642.9116:19.879,137.14
258,550.2603:46.210,080.92
341,592.1101:45.010,693.17
4128,520.6411:30.046,850.38
565,297.4007:02.724,867.95
6134,206.4612:56.652,521.48
7197,419.5136:32.668,801.45
8109,762.7207:07.441,950.08
9117,057.4817:45.142,539.49
10125,649.0813:16.347,353.76
Total time (parallel) 36:32.6
Table 16. Results of the solution using LNS. min f units are in meters in the table.
min f Time Δ
Community1320,511.1712:44.6239,005.40
2106,080.3003:12.457,610.96
363,987.0103:29.933,088.07
4203,294.4607:22.5121,624.20
590,544.6410:01.650,115.19
6261,355.4607:44.5179,670.48
7271,852.1806:33.0143,234.12
8166,640.1007:16.898,827.46
9166,950.9707:50.392,432.98
10164,954.1010:02.186,658.78
Total time (parallel) 12:44.6
Table 17. Summary of the rebalancing algorithms that appear in this paper.
MethodTime min f (Meters) max Δ (Meters)
Gurobi 10.0.1 (solver)12:32:52Only solve out the
minimum value of one
objective function
0
SA1:07:41.4714,442.22539.47
GA40:21.81,477,376.02170,567.37
IA35:26.61,722,502.90192,204.71
TS36:32.61,138,698.5779,137.14
LNS12:44.61,816,170.39239,005.40
Table 18. Operational benefits of sub-communities in 2017.
2017Year
123456789
Community1−2,711,108.00−3,057,152.32−3,450,950.76−4,698,120.26−5,318,372.26−6,024,219.05−7,626,499.57−8,650,867.93−9,816,599.12
2−2,465,242.77−2,005,231.21−1,481,738.05−3,035,473.70−2,654,154.00−2,220,212.19−3,875,857.26−3,610,510.50−3,308,545.88
3−997,276.61−1,087,664.80−1,190,526.55−1,517,432.61−1,679,602.33−1,864,151.46−2,284,017.76−2,551,976.22−2,856,912.95
4−2,948,095.58−1,175,211.13842,331.38180,304.222,384,907.854,893,746.774,790,814.947,631,669.0410,864,561.00
5−2,675,006.15−880,892.631,160,808.55420,708.692,642,030.855,169,895.474,983,049.607,833,974.8111,078,327.70
6−3,002,682.36−324,588.362,723,082.632,335,315.915,750,053.689,636,025.2710,202,244.6414,702,618.5719,824,044.11
7−3,060,836.18−2,950,966.58−2,825,934.97−4,161,031.41−4,202,988.75−4,250,736.21−5,782,455.21−6,048,169.04−6,350,551.37
8−3,605,623.05−3,170,961.40−2,676,316.45−4,876,985.78−4,617,772.19−4,322,787.12−6,750,669.40−6,750,024.15−6,749,289.86
9−4,764,152.79−3,055,578.01−1,111,219.92−3,628,077.00−1,762,723.77360,048.21−1,953,773.87142,633.202,528,344.44
10−2,845,532.14−2,789,469.91−2,725,671.10−4,227,864.01−4,362,563.57−4,515,851.68−6,265,089.51−6,680,926.20−7,154,148.35
Table 19. Operational benefits of sub-communities using trucks for rebalancing in 2023.
2023 TruckYear
123456789
Community1−2,016,572.17−670,345.59861,660.25545,534.832,245,332.174,179,701.554,321,465.836,542,341.649,069,698.32
2−2,623,324.48−1,559,801.52−349,512.40−910,082.29389,868.091,869,211.611,614,825.633,263,213.305,139,078.47
3−1,649,274.51−1,735,837.69−1,834,346.59−2,391,658.16−2,580,670.28−2,795,766.07−3,485,753.54−3,825,750.82−4,212,667.73
4−3,022,890.25−3,286,757.79−3,587,039.05−4,643,779.83−5,131,330.13−5,686,162.38−7,032,582.17−7,849,787.20−8,779,766.52
5−897,505.23−982,362.34−1,078,929.73−1,351,761.78−1,499,306.29−1,667,211.95−2,021,226.93−2,261,157.64−2,534,198.78
6−1,964,406.12−792,831.06540,421.3783,752.931,537,973.953,192,877.463,102,247.974,973,021.307,101,961.35
7−2,656,934.33−2,711,733.12−2,774,094.15−3,797,841.73−4,010,085.74−4,251,619.43−5,479,265.50−5,923,545.99−6,429,137.19
8−2,478,701.68−1,292,200.2758,038.34−582,711.68865,436.352,513,428.812,211,522.684,045,275.056,132,085.24
9−3,158,895.65−838,525.431,802,055.891,097,152.124,004,856.947,313,825.027,369,545.3911,142,840.4815,436,850.29
10−1,621,016.97−1,542,507.17−1,453,163.02−1,877,495.62−1,834,379.88−1,785,314.16−2,255,483.62−2,264,530.22−2,274,825.25
11−4,373,583.72−2,727,447.53−854,144.55−2,010,426.34−38,174.422,206,248.251,472,300.673,925,168.906,716,532.96
12−2,372,270.45−1,016,351.01526,685.3086,896.831,782,181.353,711,415.133,711,119.375,906,546.608,404,942.79
13−827,372.34−806,131.27−781,958.94−1,084,488.42−1,098,729.37−1,114,935.57−1,463,415.83−1,529,948.77−1,605,663.24
Table 20. Operational benefits of sub-communities using e-trikes for rebalancing in 2023.
2023 e-TrikeYear
123456789
Community1−2,370,500.64−1,427,044.67−353,391.77−1,191,122.84−84,912.731,173,954.37546,997.071,893,067.733,424,896.13
2−3,187,990.55−2,767,057.59−2,288,035.88−3,680,788.09−3,327,861.19−2,926,230.38−4,407,053.43−4,154,351.14−3,866,775.94
3−1,875,703.01−2,219,941.83−2,611,685.60−3,502,698.46−4,071,462.65−4,718,716.29−5,900,499.39−6,800,160.10−7,823,974.00
4−3,483,537.50−4,271,621.62−5,168,461.35−6,904,085.66−8,164,205.42−9,598,221.71−11,945,152.95−13,900,940.00−16,126,625.67
5−1,020,363.69−1,245,033.73−1,500,708.24−1,954,604.17−2,308,199.40−2,710,590.76−3,331,450.49−3,875,050.51−4,493,667.33
6−2,423,801.30−1,775,017.95−1,036,702.49−2,170,409.20−1,486,657.73−708,548.57−1,796,970.03−1,061,683.96−224,928.42
7−3,656,532.42−4,848,873.84−6,205,758.38−8,702,673.72−10,591,382.64−12,740,733.40−16,139,475.29−19,054,462.83−22,371,718.65
8−2,777,044.17−1,930,056.51−966,184.56−2,046,619.83−1,098,833.62−20,252.90−970,149.60126,189.501,373,823.40
9−3,697,013.46−1,989,021.30−45,326.23−1,543,286.54461,919.932,743,844.891,630,790.204,074,019.266,854,413.93
10−1,952,494.58−2,251,206.31−2,591,140.25−3,503,991.33−4,016,809.61−4,600,396.81−5,790,525.28−6,618,885.25−7,561,558.89
11−4,844,470.61−3,734,203.69−2,470,719.94−4,320,976.01−3,138,466.84−1,792,771.41−3,549,470.59−2,260,493.66−793,637.93
12−2,793,882.07−1,917,756.67−920,725.96−1,981,868.82−993,685.58130,866.93−785,156.10368,173.491,680,662.56
13−953,602.48−1,076,011.31−1,215,312.55−1,703,874.97−1,929,821.40−2,186,948.44−2,809,596.61−3,188,132.63−3,618,906.61
Table 21. Operational benefits of the system under the scenario of mixed use of trucks and e-trikes for rebalancing.
Year123456789
Mixed vehicles−31,274,748.29−23,409,288.65−14,458,395.57−24,746,679.25−15,980,346.08−6,004,258.93−15,125,871.75−5,031,867.1476,455,110.095
Disclaimer/Publisher’s Note: The statements, opinions and data contained in all publications are solely those of the individual author(s) and contributor(s) and not of MDPI and/or the editor(s). MDPI and/or the editor(s) disclaim responsibility for any injury to people or property resulting from any ideas, methods, instructions or products referred to in the content.

