Article

A Study on the Spatial Change of Production–Living–Ecology in China in the Past Two Decades Based on Intensity Analysis in the Context of Arable Land Protection and Sustainable Development

1
School of Marxism, China University of Mining and Technology (Beijing), Beijing 100083, China
2
College of Geoscience and Surveying Engineering, China University of Mining and Technology (Beijing), Beijing 100083, China
3
Institute of Geographic Sciences and Natural Resources Research, University of Chinese Academy of Sciences, Beijing 100101, China
4
College of Resources and Environment, University of Chinese Academy of Sciences, Beijing 100049, China
*
Author to whom correspondence should be addressed.
Sustainability 2023, 15(24), 16837; https://doi.org/10.3390/su152416837
Submission received: 6 November 2023 / Revised: 28 November 2023 / Accepted: 12 December 2023 / Published: 14 December 2023

Abstract

:
During the period of rapid social and economic development spanning four decades of reform and opening up, China has witnessed significant transformations in its patterns of production, living, and ecology. Notably, there has been a noticeable escalation in the conflict between the spatial requirements for agricultural production and those for residential and ecological purposes. In order to address this issue, the government has enacted a set of measures aimed at safeguarding arable land. This study utilizes land use data from 2000, 2010, and 2020 to establish a spatial dataset representing China’s production–living–ecological space (PLES). The intensity analysis approach is employed to examine the features of changes in China’s PLES over the previous two decades. The findings of this study indicate that agricultural production space is mostly concentrated in the northeastern region and the plains of the Yangtze and Yellow River Basins. This distribution pattern has undergone a notable transformation characterized by a period of decline followed by subsequent growth. Simultaneously, the ecological space is primarily dispersed in the northwestern region and the Tibetan Plateau. South of the Hu Huanyong Line, there is a greater proportion of rural living area, urban living space, and industrial production space. Between the years 2000 and 2020, there was an observed increase in the intensity of PLES. This rising trend was primarily characterized by quantitative changes and exchange changes within each type of space. In contrast, between 2010 and 2020, there was a notable increase in the frequency and intensity of spatial transitions, particularly in relation to agricultural production space. Nevertheless, the transition to agricultural production space mostly entails ecological implications, characterized by a decline in cultivation quality but an improvement in environmental advantages. The policy of protecting arable land has a significant influence on the dynamics of the production, living, and ecological domains. To achieve the objective of maintaining the “trinity” of arable land quantity, quality, and ecology, it is imperative for the government to establish a comprehensive system for spatial category conversion. This will ensure the coordinated development of PLES. This study elucidates the constituents of intensity analysis and its analytical concepts, which can be employed to identify alterations in spatial patterns in different areas. It offers scholarly references for the subsequent execution of policies aimed at safeguarding arable land and the development of sustainable land management strategies. Consequently, this study holds substantial importance for advancing economic and social development and fostering sustainable growth.

1. Introduction

Preserving territorial space is essential to ensure the ongoing survival of the human species and to support the sustainable advancement of the human economy and society. [1,2]. In terms of function and connotation, the concept of national land space encompasses three distinct components: production space, living space, and ecological space. These components collectively form what is referred to as the production–living–ecological space (PLES). The increasing pace of global industrialization and urbanization has led to a heightened influence of human activities on land surface patterns. Consequently, this has brought about substantial alterations in the structure of land use. Consequently, the rational arrangement and evolution of PLES patterns are encountering unparalleled impacts and influences. This is evidenced by the expansion of non-agricultural production and living spaces, the encroachment upon agricultural and ecological spaces, the prevalence of severe environmental pollution, the degradation of ecosystems, and the exacerbation of conflicts between agricultural production spaces and living spaces. These circumstances pose significant challenges to both food security and the sustainable development of national land utilization. The issues pertaining to space sustainable development pose significant hurdles to the achievement of sustainable development goals [3,4]. According to projected estimates, urbanization will result in the loss of approximately 3.7% of global arable land by the year 2030. Furthermore, it is anticipated that a significant proportion of this loss, approximately one-quarter, will occur within the borders of China [5,6]. China’s food security is contingent upon the availability of ample arable land, given its substantial population. Nevertheless, the diminishment of arable land area will undeniably pose a significant risk to the stability and availability of food resources. Territorial spatial development and governance represent a prominent focus and key priority for the Chinese government, given their direct and significant impact on national objectives and outcomes. The identification of the spatial structure of the PLES and its components serves the purpose of uncovering the characteristics of land transformation. Additionally, it establishes a fundamental requirement for investigating the factors that influence changes in the spatial structure of PLES, as well as the optimization pattern [7,8]. Hence, it is crucial to comprehend the spatial arrangement of the PLES, investigate the spatial patterns of its development, and quantify and comprehend the dynamic changes in this space. It is imperative to undertake such efforts in order to elucidate the mechanisms governing the interaction between human activities and the natural environment [9,10]. The Chinese government has consistently prioritized the preservation of food security and the safeguarding of arable land as fundamental aspects of national governance. Over time, there has been a shift in the approach towards arable land management, transitioning from a focus on “quantitative balance” in the past to the current adoption of the “trinity” strategy. This strategy aims to effectively safeguard the “red line” of arable land, ensuring its protection and preservation. A set of policies aimed at safeguarding arable land, which is tightly intertwined with the issue of food security, has been established. Currently, some scholars have conducted research on three-dimensional space identification, scale benefit evaluation, and conflict identification and optimization [11,12,13]. Nevertheless, in the context of China’s growing urbanization, there is a dearth of comprehensive investigations about the geographical distribution, composition, and level of development of the PLES, specifically in relation to the crucial aspects of food security and the preservation of arable land. Most of these analyses concentrate on investigating temporal variations in the spatial configuration of the production–living–ecological environment, without delving into the potential impacts of policies. It is important to acknowledge that variations exist within the present spatial categorization framework of the PLES, with scientists employing diverse categorization systems [14,15,16]. Furthermore, the quantitative study of the PLES is impacted by the considerable variation in border delineation across different research areas, attributable to the utilization of diverse data sources and resolutions. Hence, in order to elucidate the precise definition and implications of the PLES, it is imperative to establish a rigorous taxonomy for this space and to discern the subspaces encompassed within the PLES domain. This research holds considerable importance.
The transfer matrix, often referred to as cross-tabulation, has been extensively employed as a method for examining variations in transition sizes across different categories of PLES across specified time intervals [17,18,19]. Additionally, it is utilized to study transfers between categories at two specific time points [20,21]. Nevertheless, conventional studies commonly prioritize the magnitude of the transfer, as researchers often provide extensive information on larger transfers while disregarding smaller ones. While a large shift may seem obvious, it does not adequately represent changes in the proportion of category area to total category area. Therefore, accurately assessing the level of change intensity within the categories of the PLES has become a complex task. Aldwaik and Pontius Jr. introduced change component analysis and intensity analysis as methods to identify land types that exhibit more pronounced dynamics and transformations, and presented the definition and derivation of the corresponding calculation equations [22,23]. The intensity analysis approach is a hierarchical framework utilized to identify and assess the extent, intensity, and temporal stability of land change across various time intervals, categories, and transition levels. In contrast to conventional analysis, this methodology addresses certain shortcomings [24,25] and has been extensively utilized on a global scale [26,27,28,29,30]. Furthermore, this methodology has been employed in the examination of alterations in dry regions [31] as well as the investigation of urban local climate [32,33], thereby demonstrating its efficacy across many domains. Applying this advanced analytical technique can also be utilized to evaluate the accuracy of land use classification, thus addressing the limitations associated with the conventional Kappa coefficient [23].The utilization of intensity analysis of land change is of utmost importance when examining the spatial change patterns and processes of China’s PLES. By conducting an analysis of the temporal, geographical, and transformational dimensions, we may gain a comprehensive understanding of the patterns exhibited by various spatial categories and the impacts resulting from the execution of relevant policies. Furthermore, the analysis of intensity serves to construct a novel framework for the synchronized advancement of food security, ecological equilibrium, and economic progress, thereby fostering the sustainable development of the entire region. Hence, it holds immense practical importance in fostering the equitable advancement and enduring use of the PLES.

2. Materials and Methods

2.1. Study Area

China is located in the eastern part of Asia and along the western coast of the Pacific Ocean. The region exhibits a varied topography, encompassing elevated mountains, undulating hills, lower mountain ranges, expansive plains, enclosed basins, and coastal regions, all intricately interconnected to form a distinctive geographical composition. Land use encompasses a diverse range of categories, such as farming, urban areas, industrial land, forest land, grassland, and bodies of water, among others. The conversion and adjustment of land use types exhibit a persistent pattern across many geographies and time periods, hence displaying features of diversification and frequent modifications [34]. China, as the largest developing nation globally, has made significant strides in the realms of industrialization and urbanization through the implementation of reform policies and the adoption of an open-door approach throughout the course of recent decades. There has been an improvement in the living standards of the population [35]. Nevertheless, in recent times, a multitude of developmental issues have surfaced, including the diminishing expanse of arable land, ineffective exploitation of land resources, escalating environmental contamination, deterioration of ecosystems, and other predicaments that run counter to the principles of sustainable development [36]. To address these challenges and align with the objectives of sustainable development, the Chinese government has implemented a series of laws that emphasize the principle of “ecological land use in conjunction with residential and industrial land use”. The 18th National Congress report also highlighted the necessity of building a production–living–ecological space (PLES) characterized by “intensive and efficient production space, livable and moderate living space, and clear and beautiful ecological space” [37]. Ensuring the effective implementation of land use plans necessitates the establishment of a comprehensive land use classification system that prioritizes production, living, and ecological functions. Additionally, it is crucial to accurately and comprehensively measure changes in land in order to successfully address the requirements of management choices and research endeavors.

2.2. Data Source and Processing

This research aims to analyze and classify the spatial functions of China’s PLES, construct a Chinese PLES dataset, and analyze it using the intensity analysis method. The specific research process is shown in Figure 1. Specifically, this study employs GlobeLand30 land cover data, accessible at http://www.globallandcover.com/, accessed on 15 March 2022, and population density data obtained from the Colombian Center for Socio-Economic Data and Applications, available at https://sedac.ciesin.columbia.edu/, accessed on 17 March 2022. Additionally, the urbanization classification criteria published by the European Commission—Global Human Settlement Layer (GHSL) are employed to identify the spatial functions. The establishment of the existing spatial functional classification system of China’s PLES (as shown in Table 1) was complemented by incorporating the findings of previous research. Within the dataset of this classification system, the categorization pertains to the surfaces that are created as a result of human construction endeavors. This includes a range of residential areas such as towns and cities, as well as industrial and mining sites, and transportation infrastructure. It is important to note that contiguous green spaces and bodies of water within these constructed areas are not considered part of the industrial production space. It is important to highlight that at this particular stage, the industrial production area was initially partitioned using the GlobeLand30 land cover data. Given that settlements, which include living spaces, are also part of this area, it becomes imperative to subsequently determine the extent of living space and its integration within the industrial production space in the final data product. The dataset’s accuracy has been duly confirmed and the findings have been disseminated through publication in pertinent academic journals [38].

2.3. Methods

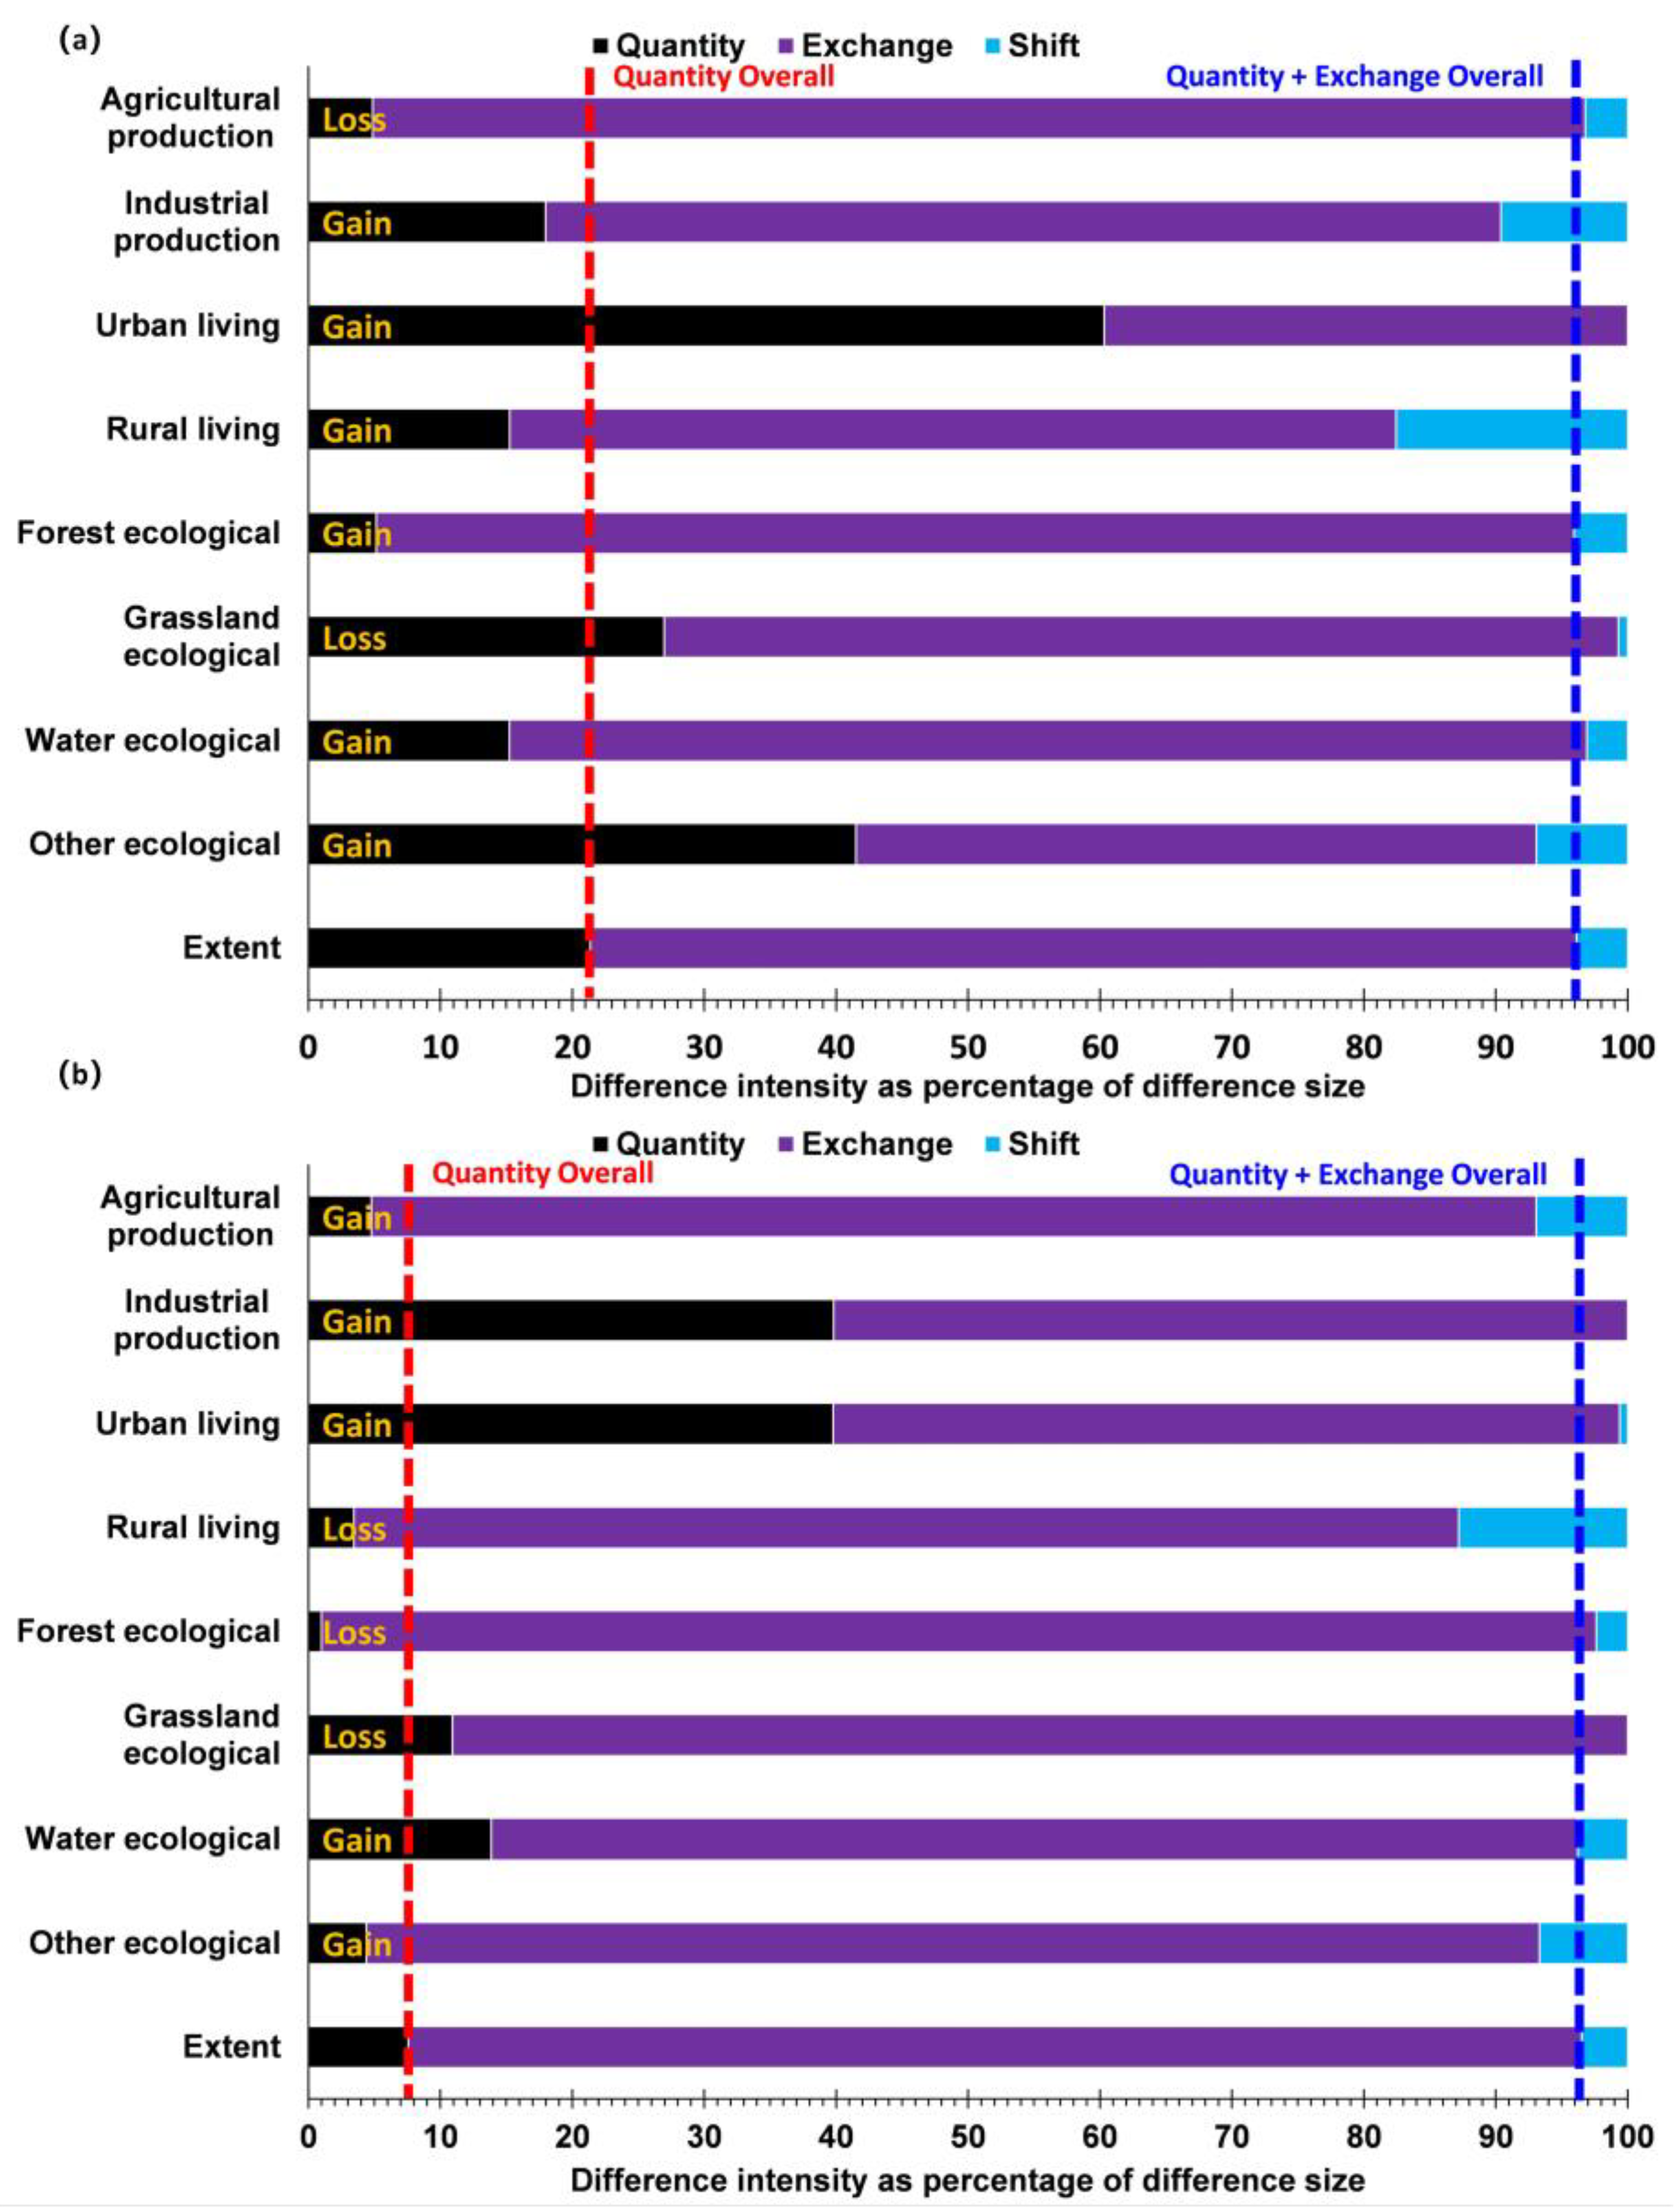
2.3.1. Change Component Analysis

Components of change analyses were conducted to reveal how and in what ways change occurs within categories, with differences in each period consisting primarily of total change, quantity, exchange, and transfer changes [39]. Quantitative differences refer to changes in the composition of the PLES caused by spatial categories in different periods, and are affected by the quantity of each space type. The period from Y t to Y t + 1 is denoted as t. The increase in space category j, represented by the number of elements transferred from space category i to space category j, is denoted as C t i j . Similarly, the decrease in space category j, or the number of elements transferred from space category j to space category i, is also denoted as C t i j . The quantity difference of a specific space category j in the period t is designated as q t j in Equation (1). The overall quantity difference in period t is denoted as Q t in Equation (2).
q t j = i = 1 J   C t j C t i j × 100 % i = 1 J   j = 1 J   C t i j
Q t = j = 1 J   q t j 2
Exchange differences refer to changes in the space use composition caused by the uneven spatial distribution of space categories over time. In Equation (3), multiplication by two is used due to exchanges occurring in pairs, and each team in the exchange process is multiplied by the smaller value of C t i i and C t i j in the constraints, necessitating the use of the minimum function. The exchange component for category i is given in Equation (3), representing the sum of all exchanges involving category j, with C t i j subtracted from it as the sum of the numerators contains C t i j . The difference in the allocation of a particular space category j over the period is denoted as e t j in Equation (3), while the difference in the allocation of the entire study area over the period t is termed A t in Equation (4).
e t j = 2 m i n i = 1 J   C t i j C t i i , i = 1 J   C t i j C t i j × 100 % i = 1 J   j = 1 J   C t i j
E t = j = 1 J   e t j 2
The shift difference represents the change in space use resulting from the transfer of a space category from one location to another over different periods. In Equation (5), the difference in space category j from t to d t j over the period is denoted as the shift component, where it is equal to d t j minus the difference between the quantity component q t j and the exchange component e t j .
s t j = d t j q t j e t j

2.3.2. Intensity Analysis

The intensity analysis model allows for the quantification of transfers into and out of a space category over a specified period. The temporal levels of change in intensity analysis include the annual average and equilibrium intensity of change. The average annual change intensity is defined as the percentage of the area of change for the space category in the study period to the total area of the study area in the time interval Y t to Y t + 1 , divided by the number of time intervals, denoted as S t in Equation (6). The intensity of equilibrium space category change is defined as the percentage of the area of change over the total area for all study periods, divided by the entire study time interval, denoted as U, as shown in Equation (7).
S t = j = 1 J   i = 1 J   C t i j C t j j j = 1 J   i = 1 J   C t i j Y t + 1 Y t × 100 %
U = t = 1 T 1   j = 1 J   i = 1 J   C t i j C t i j j = 1 J   i = 1 J   C t i j Y T Y 1 × 100 %
In intensity analysis, the changes in space category levels include the average annual increase in intensity and the average loss in intensity. The average annual increase intensity of space category i is defined as the percentage increase in the area of space category i relative to the area of space category i at a point in time Y t , divided by the time interval denoted as G t i during a given year from Y t to Y t + 1 , as shown in Equation (8). The average annual loss intensity of space category i relative to time t is the percentage decrease in the area of space category i during a given year from Y t to Y t + 1 , as a percentage of the area of space category i at time point Y t , divided by the time interval, referred to as L t i , as shown in Equation (9).
G t i = j = 1 J   C t i j C t i i Y t + 1 Y t i = 1 J   C t i j × 100 %
L t i = j = 1 J   C t i j C t i i Y t + 1 Y t j = 1 J   C t i j × 100 %
The intensity analysis of the transition level evaluates whether the transition from m to n is biased for all time intervals. Equation (10) expresses the annual average transfer intensity from spatial category m to j, denoted as P t m j . It represents the percentage of the area transferred from category m to category j relative to the area of spatial category j at time point Y t in a specific year from Y t to Y t + 1 , divided by the time interval. Similarly, Equation (11) defines the annual average transfer intensity for all non-n types of spaces, referred to as R t m . It signifies the total increase in the area of n-type spaces in a specific year from Y t to Y t + 1 as a percentage of the total area of non-n types of spaces at time point Y t , divided by the time interval.
P t m j = C t m j Y t + 1 Y t i = 1 J   C t i j × 100 %
R t m = j = 1 J   C t m j C t m m Y t + 1 Y t i = 1 J   j = 1 J   C t i j C t i m × 100 %

3. Results

3.1. PLES Distribution Characteristics

The diagram presented in Figure 2 illustrates the configuration and spatial arrangement of China’s PLES. Concerning spatial distribution, the agricultural production space, serving as a crucial area for food production, is primarily concentrated in northeastern China, as well as the plains of the Yangtze and Yellow River Basins. In contrast, the grassland ecological space, water ecological space, and other ecological spaces occupy a more significant proportion of the country in northwestern China and the Tibetan Plateau region. This distribution pattern suggests that the ecological resource endowment in this region is relatively favorable. In the region located south of the Hu Huanyong Line, there is a notable prevalence of rural living space, urban living space, and industrial production space. This spatial distribution suggests a higher level of human concentration and intensity of activity within this area. The agricultural output sector has witnessed a decline in both structural and quantitative aspects. The rural living space has witnessed an initial increase followed by a subsequent fall, suggesting that growing urbanization has encroached upon agricultural production areas, resulting in a reduction in available land. Simultaneously, the government has enacted a policy aimed at safeguarding arable land, thus ensuring the allocation of a proportionate agricultural production area during the progress of urbanization. The percentage of industrial production space increased from 0.55% in 2000 to 1.03% in 2020, while urban living space witnessed growth from 0.93% in 2000 to 1.09% in 2020. These figures indicate that the advancement of industrialization and urbanization has had a noticeable impact. In the realm of ecology, with the exception of grassland ecological spaces, all other ecological areas have experienced a notable increase in size, aligning with the contemporary emphasis on constructing a more aesthetically pleasing China as advocated by the Communist Party of China since the 18th National Congress. The decline in grassland ecological spaces may be attributed to their conversion into spaces for the agricultural and animal husbandry industries.

3.2. Analysis of the Components of the PLES

3.2.1. Analysis of Total PLES Component Change

Figure 3 depicts the composition of spatial changes in China’s PLES from 2000 to 2020. The changes observed in the two periods mostly encompass quantitative and exchange modifications. In contrast to the period spanning from 2000 to 2010, the alterations observed throughout the period from 2010 to 2020 exhibit a greater degree of discernibility in terms of quantity and exchange. During the period from 2010 to 2020, there was a significant increase in the exchange rate, accompanied by a slight decline in the quantity change. Overall, there is a noticeable upward trend in the overall change of each spatial category within China’s PLES.

3.2.2. Analysis of the Change Components of Different Categories

Figure 4 illustrates components of change for China’s PLES over different time periods. The term “Gain” is used to describe a positive change in a spatial category over a period of time; that is, an increase in quantity compared to the initial state. In contrast, “Loss” refers to a negative change in a spatial category over a period of time; that is, a reduction in quantity compared to the initial state. The term “Extent” is used to indicate the overall magnitude of change. In this context, the red-dashed line represents the overall magnitude of change in quantity, while the blue dashed line represents the combined magnitude of change in quantity and exchange. The change in overall volume exhibits an intensity of 20.85% and 7.56% for the periods 2000–2010 and 2010–2020, respectively. Similarly, the change in overall exchange demonstrates intensities of 75.23% and 88.95% for the same respective periods. Between the years 2000 and 2010, as depicted in Figure 4a, China experienced a decline in its agricultural production space and grassland ecological space. Conversely, there was an upswing in rural living space, industrial production space, urban living space, water ecological space, forest ecological space, and other ecological spaces. The industrial production space is predominantly characterized by quantitative changes.
On the contrary, alternative spatial categories are mostly characterized by exchange modifications, whereby rural residential areas exhibit a greater proportion of transfer modifications compared to other spatial categories. Between the years 2010 and 2020, as depicted in Figure 4b, China had a decline in the extent of rural living space, forest ecological space, and grassland ecological space. Conversely, there was a notable growth in agricultural production space, urban living space, industrial production space, water ecological space, and other ecological spaces. Exchange changes dominate all forms of space, with minimal transfer changes observed in the industrial production space. Quantitative changes are noted in the urban living space and other spatial categories, while the agricultural production space and rural living space experience modest transfer changes.

3.3. Intensity Analysis of the PLES

3.3.1. Change Detection at Time Interval Level

Figure 5 depicts the magnitude and intensity of the overall spatial transformation in China’s PLES across several time periods. The fluctuating intensity observed in the initial period is relatively subdued and exhibits a lesser magnitude compared to the consistent intensity represented by the red dotted line (1.32%). During the second phase, there is an observable variation in intensity, which is notably more pronounced compared to the consistent intensity exhibited by the red dotted line (1.32%). The extent and intensity of change experienced a significant increase, particularly following the year 2010. This growth resulted in a doubling of the affected area, expanding from 131,200 square kilometers during the period of 2000–2010 to 267,400 square kilometers between 2010 and 2020. This observation suggests that there is an increase in the magnitude and intensity of spatial transformations within the production–living–ecological region, and these changes exhibit an overall upward trajectory over the entire cycle.

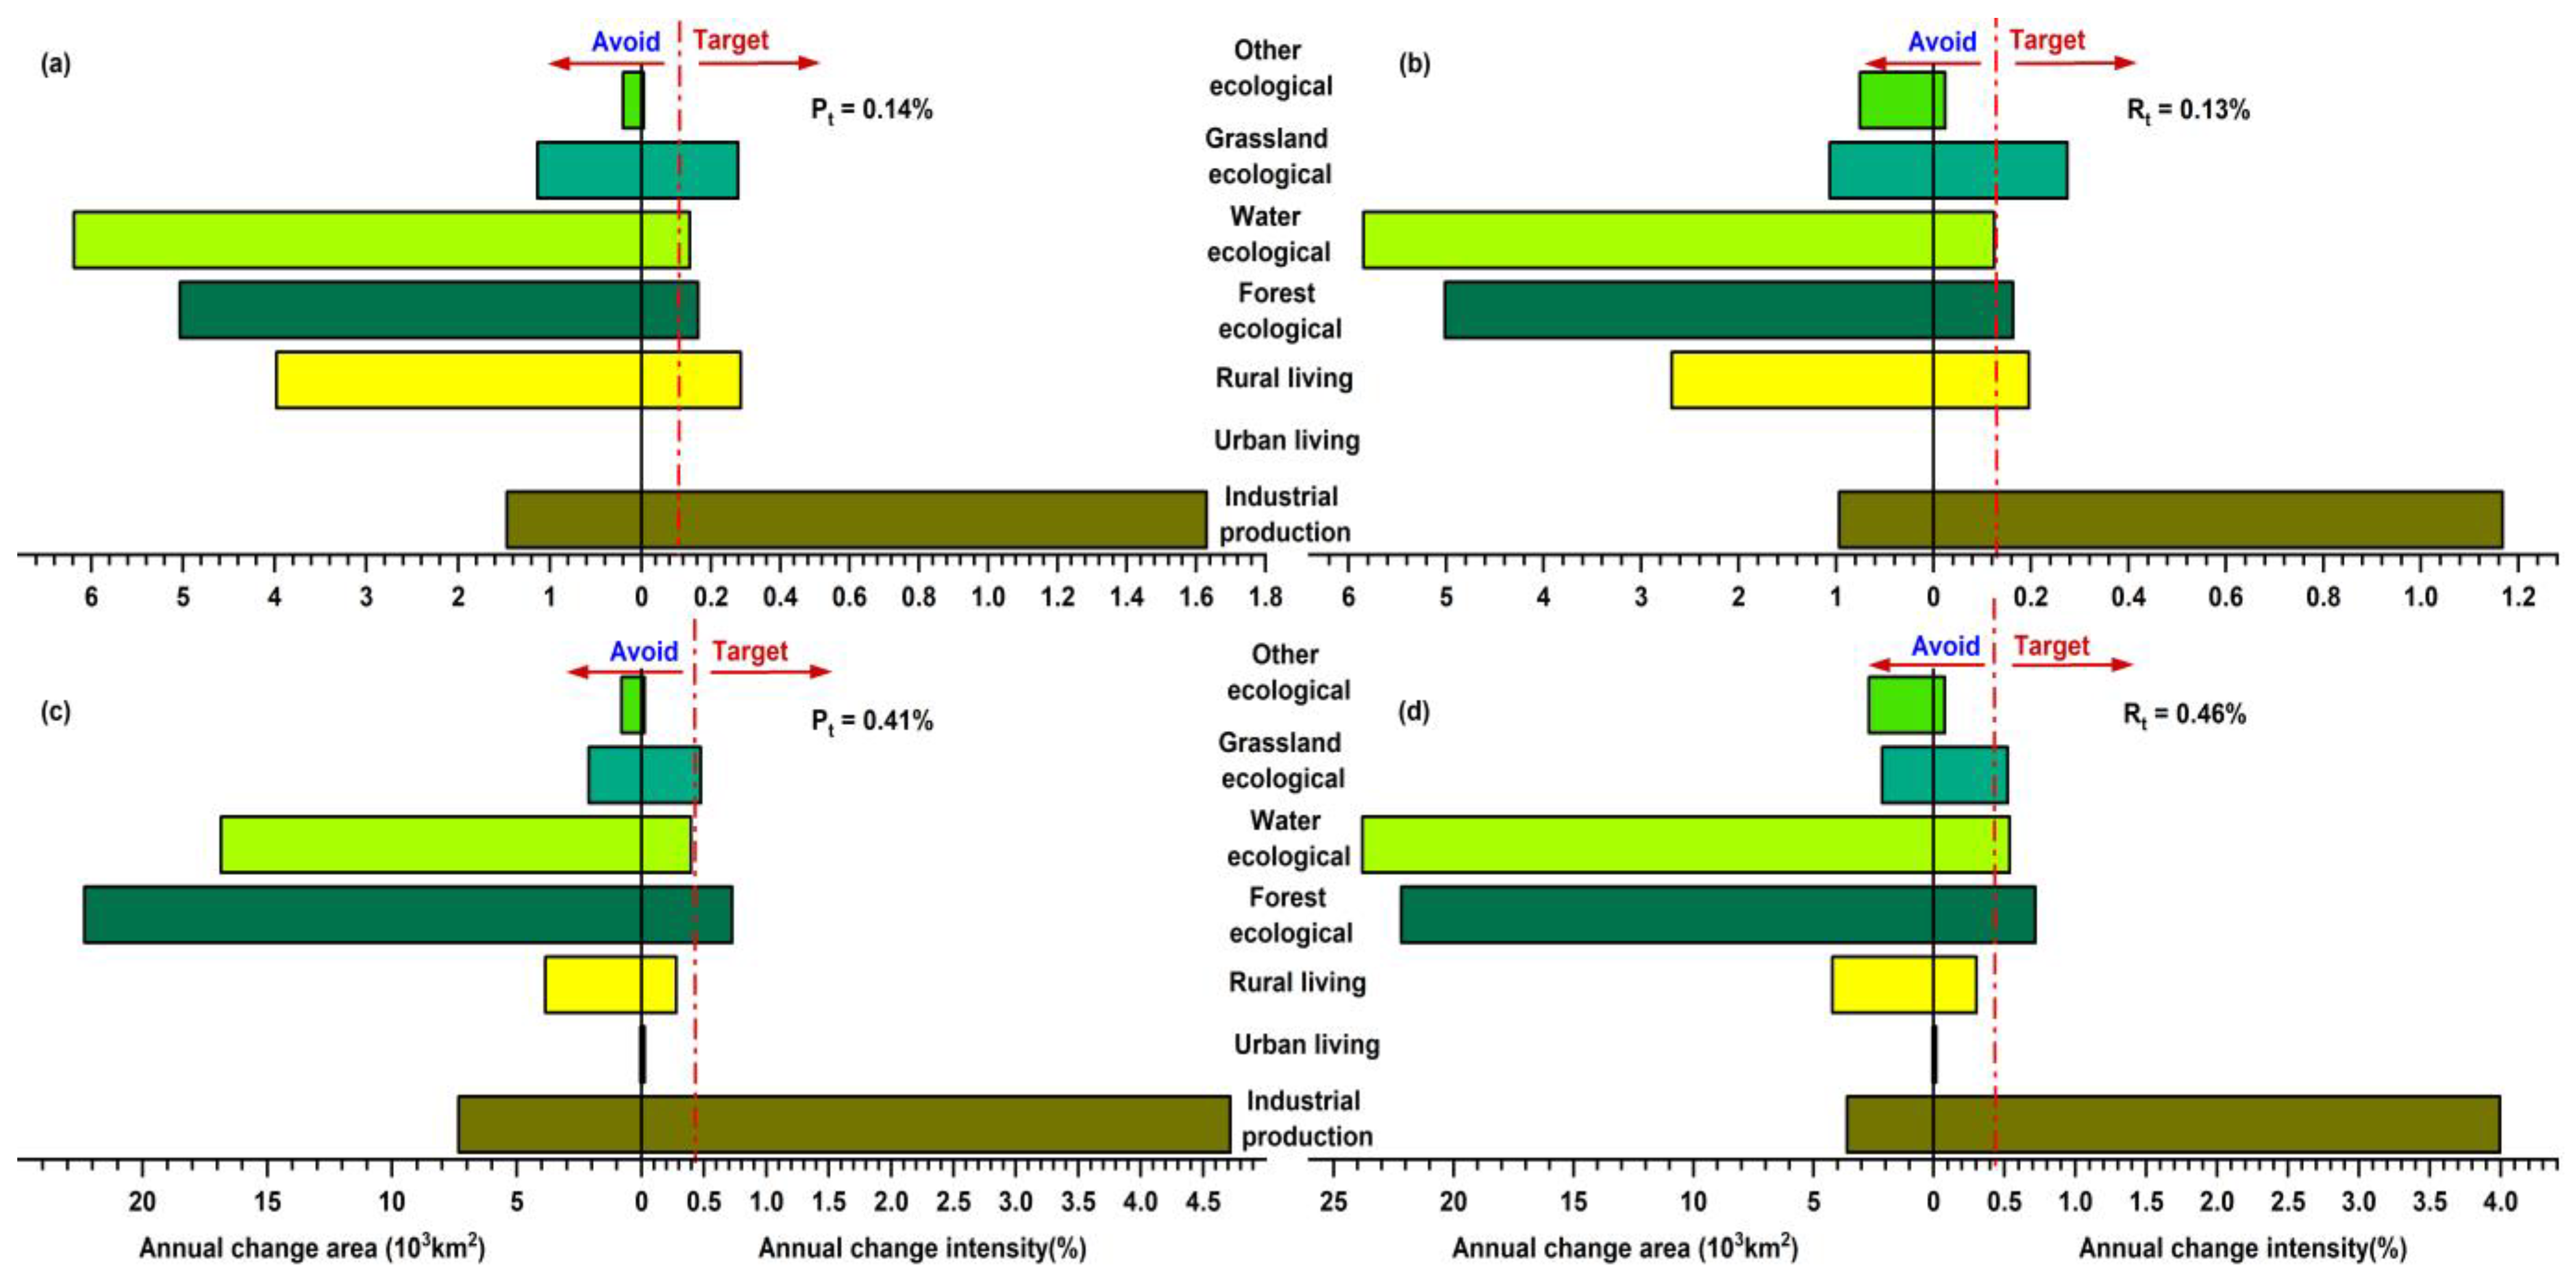
3.3.2. Change Detection at a Category Level

Figure 6 illustrates the temporal evolution of various spatial categories within China. The diagram illustrates the annual average change in area on the left side of the zero-scale line, with the yearly average change intensity depicted on the right side of the zero-scale line. The red-dashed line serves as a visual representation of the annual average intensity of change. The active status of the annual rise or decline of the spatial category is shown by the region located to the right of the red-dashed line. On the contrary, the left side of the red-dashed line signifies the state of dormancy in the annual fluctuations of the spatial category. There is a growing pattern in the average intensity of change seen between the two eras, suggesting a rise in the frequency of spatial-type transitions.
Between 2000 and 2010, there was an observed increase in intensity and decrease in intensity of the industrial production space and water ecological space, as depicted in Figure 6a. Conversely, the intensity of the agricultural production space, rural living space, and forest ecological space remained relatively stable during this period. Similarly, the intensity of other ecological spaces and the urban living space experienced minimal changes, with a dormant decrease in intensity and an active increase in intensity, respectively. The level of grassland ecological space exhibits a state of dormancy when its intensity is heightened, but it becomes active when the intensity decreases. Consequently, the reduction in the extent of the grassland ecological space is most pronounced. This suggests that the industrial production sector in regions experiencing fast urbanization and industrialization is undergoing significant and swift transformations in comparison to other types of land use. Nevertheless, the process of urbanization entails the utilization of significant portions of agricultural production space and ecological space, thereby posing potential threats to food security. As depicted in Figure 6b, during the period from 2010 to 2020, there were dynamic fluctuations in the expansion and contraction of the agricultural production space, industrial production space, and ecological spaces including forest land, grassland, and water. The rates of expansion and contraction of urban and rural living areas, as well as other ecological spaces, are currently in a state of stagnation. The expansion and contraction of urban living areas, rural living areas, and other ecological spaces remain stagnant. Significantly, the expansion of the agricultural production space, as well as the forest and grassland ecological spaces, demonstrate a more substantial increase in contrast to the preceding period. This observation indicates that the process of urbanization continues to progress steadily. Simultaneously, the observed rise in agricultural productivity and expansion of the ecological space serve as indicators of the effectiveness of the arable land protection strategy and the efforts towards constructing a visually appealing China throughout the same timeframe.

3.3.3. Agricultural Production Space Change Detection at a Transition Level

Figure 7 depicts the outcomes pertaining to the magnitude of transfers occurring within China’s agricultural output sector across various time intervals. The diagram illustrates the annual average area transfer on the left side of the zero-scale line, while the yearly average transfer intensity is depicted on the right side of the zero-scale line. The red-dashed line visually represents the mean transfer intensity. When the transfer intensity is above the mean transfer intensity for a certain spatial category, it signifies a preference towards that particular spatial category. Conversely, when the transfer intensity for a specific space falls below the mean transfer intensity, it indicates that transfers are more likely to avoid that particular category of space. The data depicted in Figure 6 demonstrate that the transfer intensity of the agricultural production space displays varying degrees of fluctuation throughout time. The findings have considerable importance in comprehending the trajectory of agricultural production space dynamics and their influence on agricultural progress and food security.
In Figure 7a,b, during the period from 2000 to 2010, there is a noticeable trend of agricultural production space being transferred to various ecological spaces such as grassland, water, and forest, as well as the rural and industrial production spaces. Conversely, other ecological spaces and the urban living space tend to avoid such transfers. Spatial transfers are observed from the grassland ecological space, forest ecological space, rural living space, and industrial production space to the agricultural production space. In contrast, alternative biological and urban habitats refrain from transitioning into areas dedicated to agricultural production. Currently, the level of exchange between different categories within the realm of space is not substantial. Nevertheless, it is worth noting that the magnitude of outward transfer surpasses that of inward transfer, particularly in the context of rural living and the industrial production space.
Figure 7c,d illustrates the transfer patterns of the agricultural production space during the period 2010–2020. The analysis reveals that there is a tendency for agricultural production space to shift towards the grassland ecological space, forest ecological space, and industrial production space. On the contrary, transfers to the urban living space, water ecological space, and other ecological spaces are avoided. When examining the transfer process, it becomes evident that the grassland ecological space, water ecological space, forest ecological space, and industrial production space tend to undergo conversion into agricultural production space. Conversely, the rural living space, other ecological spaces, and the urban living space exhibit a reluctance to undergo such conversion into agricultural production space. During this time period, there is a notable increase in the interchange of space categories, with a somewhat lower rate of transfers out compared to transfers in. This implies that the available agricultural producing area has been augmented to a considerable degree. Overall, the processes of urbanization and industrialization have led to changes in the composition of various geographical categories. The enhancement of residents’ living conditions has resulted in an escalation in the need for residential and industrial areas, thereby driving the expansion of the demand for land designated for construction purposes. This phenomenon has subsequently resulted in the displacement of agricultural producing space. The magnitude of the transfers has progressively escalated. To ensure compliance with the arable land protection strategy, additional agricultural production zones have been established in alternative locations to maintain a consistent quantity. Nevertheless, the limited fertility of certain cultivated land has resulted in the encroachment of high-quality ecological areas for agricultural purposes. This particular technique may solely meet the objective of safeguarding the quantity of arable land as outlined in the land protection policy, but it may fall short in terms of attaining the desired quality standards. The policy aimed at protecting arable land falls short in achieving the objective of attaining a balance on the trinity. At the same time, occupying ecologically rich areas is not conducive to ensuring food security and sustainable development of the ecological environment [40,41].

4. Discussion

4.1. Patterns and Processes of PLES Change

In previous land-use science, land changes were often characterized by quantitative changes only [42,43]. However, detecting the instability of spatial changes in various space categories solely through quantitative changes is sometimes a tough task. Consequently, the utilization of compositional and intensity analysis techniques becomes advantageous as they facilitate the identification of patterns, magnitudes, and intensities of alterations in land surfaces. This, in turn, encourages readers to engage in a more profound contemplation of the underlying factors contributing to various trends in change. By employing these methodologies, a more comprehensive understanding of the land change process can be obtained, providing deeper insights into the dynamic characteristics of various spatial transformations. This enables us to provide more relevant knowledge that can enhance scientific decision making and contribute to the pursuit of sustainable development.
The utilization of intensity analysis facilitates the establishment of a connection between the non-stationary attributes of spatial change patterns within the designated study region and the underlying processes, hence enhancing the comprehension of the mechanisms via which policy influences these processes. Figure 3 and Figure 5 illustrate a discernible upward trajectory in the overall magnitude of change inside China’s production–living–ecological space from the year 2000 to 2020. The data suggest that there is a decline in quantitative change, while there is an increase in exchange change and transfer change. This indicates that the later time is characterized by a move from a straightforward growth or drop in spatial categories to a greater degree of interchanges between different spatial kinds, as opposed to the earlier period. Quantitative changes take up a particular proportion, indicating changes between individual spatial types, such as an increase in town living space mainly as a direct conversion. Figure 4 illustrates a decrease in both the agricultural production space and grassland ecological space between 2000 and 2010, implying their contribution to the overall expansion of other areas. Moreover, there is a net reduction in the rural living space, forest ecological space, and grassland ecological space from 2010 to 2020, with the exchange of these spaces playing a more significant role. This implies that there may be an increase or decrease in one area and a corresponding decrease or increase in another, aligning with the findings presented in Figure 3. According to Figure 6, the loss intensity in the industrial production space, grassland ecological space, and water ecological space is notably higher than the average loss intensity. The magnitude of the rise in the industrial production space, urban living space, water ecological space, and other ecological spaces surpasses the average increase observed between 2000 and 2010. From 2010 to 2020, there was a noteworthy rise in the intensity of both loss and expansion across various ecological spaces, encompassing the agricultural production space, industrial production space, forest ecological space, grassland ecological space, and water ecological space. Notably, the intensity of loss and increase in the agricultural production space, industrial production space, grassland ecological space, and water ecological space exceeded the average intensity during this period. The changes characterized by heightened intensity mostly manifest in agricultural, industrial, and aquatic ecological domains, with all of these sectors experiencing a net increase. While the extent of change in the urban living space and industrial production space is relatively smaller compared to that of the grassland ecological space and forest ecological space, the magnitude of change is significantly higher in these types, particularly in the industrial production space, when considering their respective proportions. The aforementioned analyses demonstrate that the extent and severity of changes within the three production spaces exhibit distinct patterns throughout various time periods. The process of urbanization and industrialization has yielded distinct outcomes, including an enhancement in the living standards of inhabitants and a rise in the need for residential and industrial areas. Consequently, this has resulted in the compulsory relocation of agricultural production spaces and a gradual escalation in the magnitude of such relocations. While the strategy to protect arable land has contributed to the stability of agricultural production areas, it may have adverse implications for food security and the sustainable development of the ecological environment due to the occupation of valuable ecological spaces.

4.2. Effectiveness of Cropland Protection Policies

China has engaged in the conservation of arable land for a period exceeding two decades, starting from the year 1997 when the Circular on Further Strengthening Land Management and Effectively Protecting Arable Land was formally put into effect. The synthesis of the findings presented in Figure 4, Figure 6 and Figure 7 reveals that China’s agricultural production space did not yield the anticipated policy outcomes during the initial decade of the 20th century. During this period, the spatial changes primarily consisted of pure shifts, with a reduced occurrence of shift interchanges. During the initial decade, there was a notable trend of agricultural production space relocating away from various spatial domains, particularly rural living areas and industrial production spaces. Moreover, the magnitude of this outward shift was more pronounced compared to other spatial categories, leading to an overall decrease in the availability of agricultural production space. During the period from 2010 to 2020, there was a notable rise in the intensity of spatial-type changes. The exchanges between different types became more frequent, indicating a departure from the previous dominance of pure increases or declines in a single spatial type. There is a prevalent inclination towards the conversion of agricultural production areas into the grassland ecological spaces, forest ecological spaces, and industrial production spaces. From the perspective of agricultural production space transfer, almost all types of spaces are encompassed in the transfer process. During this time period, there is an increased and more frequent interchange of agricultural production space categories. The magnitude of outflows in terms of transfers is comparatively lower than that of inflows, resulting in a net expansion in agricultural production area. China’s economic and social development underwent substantial transformations between 2010 and 2020 due to the processes of urbanization and industrialization. Consequently, the living requirements of farmers have witnessed a notable rise. An increasing number of farmers are opting to relocate from rural areas. The prevalence of abandoned rural living places is steadily on the rise. Simultaneously, the concentration of urban dwellers and the escalation of their living requirements have resulted in the expansion of suburban peripheries and the establishment of transportation networks and other infrastructural facilities, thus augmenting the expanse of urban residential and industrial areas. The expansion of these places will unavoidably encroach upon the adjacent agricultural production areas, resulting in frequent conversion of agricultural production land between 2010 and 2020. The magnitude of loss and gain above the average intensity of exchange, and the general state of equilibrium, accompanied by a modest increase, suggests that China’s policy on protecting arable land has played a significant role. Nevertheless, when considering the conversion of space for agricultural purposes, it is primarily the ecological space with limited fertility that is being utilized. This suggests that the aims of the policy aimed at protecting arable land are likely to be achieved only during the stages of “quantity balance” or “quantity-quality balance”. The policy referred to as the “trinity” strategy, implemented in 2017, has demonstrated a lack of effective implementation and has not succeeded in attaining its intended goal of establishing a balanced and harmonious equilibrium among the various dimensions of arable land, namely quantity, quality, and ecological considerations, through the occupation and restoration of the most fertile land. As a result, the implemented strategy focused on the protection of arable land has produced some results. However, it continues to encounter obstacles, particularly in the realm of reconciling the assurance of arable land of superior quality with the preservation of ecological space.
It is noteworthy that during the period from 2000 to 2010, there was a tendency for agricultural production areas to be converted into residential and industrial spaces for farmers. However, in the subsequent period from 2010 to 2020, there was a shift towards transforming agricultural production areas into grassland and forest ecological spaces, while ensuring that the overall area is not reduced. During the period from 2000 to 2020, there was a decline in the extent to which grassland, forest, and water ecological spaces were converted into agricultural-producing areas. The aforementioned policies, namely “returning farmland to forests,” “returning farmland to grassland,” and the pursuit of a visually appealing China, have demonstrated a measure of accomplishment between 2000 and 2020. These policies have effectively facilitated the harmonious amalgamation of ecological and agricultural spaces. Nevertheless, notwithstanding these notable accomplishments, it remains imperative to enhance the safeguarding and administration of agricultural production and ecological areas. In subsequent phases of growth, it is imperative for governmental entities and researchers to delve deeper into the trajectory of sustainable development, while concurrently refining land use rules to ensure the preservation of high-quality arable land and ecological spaces. Simultaneously, it is imperative to consider regional disparities and ecosystem attributes while devising distinct land management strategies to effectively safeguard and utilize land resources in a sensible manner.

4.3. Uncertainty and Future Research Direction

The land use data included in this study have a spatial resolution of 30 m. It is important to note that resolution limitation may introduce some bias into the definition of the three spatial borders of the production–living–ecological zone. There may be a minor variance between the described scenario and the factual circumstances. Furthermore, considering the inherent constraints in time series data for land use and population density, this study opted to designate the years 2000, 2010, and 2020 as the temporal reference points. Therefore, the study could not effectively demonstrate the temporal variations in the distribution of the three organisms over successive years, nor did it adequately address the associated conservation measures, such as the “cropland occupation and compensation balance,” “restoring agricultural land forest,” “conversion of agricultural land to grassland,” and similar policies. The extended duration may lead to certain nuances of the intermediate alterations being inadvertently disregarded. In future research endeavors, it is recommended that the utilization of higher-resolution data be employed in order to enhance the precision of the findings. This would provide a more accurate depiction of the spatial boundaries of the three organisms, thereby reflecting the true circumstances with greater fidelity. Simultaneously, it is advisable to extend the duration of data collection in order to encompass a greater number of consecutive years, thus providing a more comprehensive depiction of the geographical transformations within the production–living–ecological domain. This approach will provide a more profound comprehension of the prevailing spatial trends and the impact of policy implementation across distinct time periods. In order to achieve this objective, the government has the capacity to modify and enhance the implementation strategies of policies in accordance with the prevailing circumstances. Furthermore, it is worth considering the integration of rasterized socio-economic data and night-time illumination data, among other factors, to enhance the comprehensiveness of artificial surface information.
However, we must also honestly admit that due to the limitations of the research topic and data processing methods, we did not conduct a targeted mechanism discussion in this article. We focus on the study of changes at the geospatial level and build on the prior situation in this paper. This preliminary work provides the necessary background and theoretical support for our future in-depth exploration of the underlying mechanisms. We plan to conduct in-depth research on the influencing mechanisms of changes in the intensity of the PLES in order to more comprehensively understand and explain the changes in geographical space. This integration facilitates a more in-depth analysis of the transformations taking place in both urban and rural areas, offering a comparative evaluation of their respective intensities. Conducting a thorough data analysis of urban and rural agricultural production areas will contribute to a comprehensive comprehension of the patterns and features associated with their growth.

5. Conclusions

This study utilized the Global30 dataset and SEDAC population density spatial distribution data to create a dataset representing the Chinese PLES. Three components of change were calculated using this dataset, and an analysis of the intensity of the Chinese PLES was conducted to examine the pattern of change over two time intervals.
The findings indicate that China’s agricultural output is mostly concentrated in the northeastern region and the plains of the Yangtze and Yellow River Basins, which are the main grain-producing areas. Conversely, the northwestern region and the Tibetan Plateau region occupy a relatively larger proportion of ecological space. In the region located south of the Hu Huanyong Line, a significant proportion of land is allocated to rural living areas, urban living areas, and industrial production zones. Between the years 2000 and 2020, there was an observable increase in the intensity of three living spaces. This increasing trend was primarily characterized by quantitative and exchange-related alterations. The magnitude of change exhibited an upward trend, rising from 131,200 km2 during the period of 2000–2010 to 267,400 km2 during the subsequent period of 2010–2020. During the period from 2000 to 2010, there was an active state observed in the intensities of the industrial production space and water ecological space, with both increasing and decreasing trends. Conversely, the intensities of the agricultural production space, rural living space, and forest ecological space remained relatively inactive, with dormant trends. The intensities of other ecological spaces and the urban living space exhibited a dormant trend in decreasing intensity, while showing an active trend in increasing intensity. The grassland ecological space displayed a dormant trend in increasing intensity, but an active trend in decreasing intensity, with the latter being the most prominent. From 2010 to 2020, there was an active trend observed in the intensities of the agricultural production space, industrial production space, forest ecological space, grassland ecological space, and water ecological space, with both increasing and decreasing intensities. The levels of intensity in urban living areas, rural living spaces, and other ecological places exhibited variations in their dormant states. Between 2000 and 2010, the agricultural production space decreased and tended to transfer out of the grassland, water, forest, rural living, and industrial production spaces, while avoiding transfers to other ecological spaces and the urban living space. Subsequently, from 2010 to 2020, there was a slightly increase in the agricultural production space. It tended to transfer out of the grassland, forest, and industrial production spaces, avoiding transferring to the urban life space, water, and other ecological spaces.

Author Contributions

All authors contributed significantly to this manuscript. G.C. and Q.G. were responsible for the original idea and the theoretical aspects of the paper. Q.G. was responsible for the data collection and pre-processing. D.D. drafted the manuscript. All authors have read and agreed to the published version of the manuscript.

Funding

This research was funded by the Open Project of Hebei State Key Laboratory of Mine Disaster Prevention, North China Institute of Science and Technology (2019).

Institutional Review Board Statement

Not applicable.

Informed Consent Statement

Not applicable.

Data Availability Statement

The data presented in this study are available on request from the corresponding author.

Conflicts of Interest

The authors declare no conflict of interest.

References

  1. Hao, Q.; Peng, J.; Wei, Y.; Wang, F.-L.; Yao, H.-S.; Li, Y.; Wang, W.; Zhang, S.-H.; Deng, L.; Zhao, Y.-T.; et al. The connotation of territory and the suggestions of drawing up spatial planning in the New Era. J. Nat. Resour. 2021, 36, 2219–2247. [Google Scholar] [CrossRef]
  2. Duan, Y.; Huang, A.; Lu, H.; Ji, Z.; Xu, Y. Analysis on concept and theories of “Production-Living-Ecological” spaces. J. China Agric. Univ. 2023, 28, 170–182. [Google Scholar]
  3. Huang, A.; Xu, Y.; Lu, L.; Liu, C.; Zhang, Y.; Hao, J.; Wang, H. Research progress of the identification and optimization of production-living-ecological spaces. Prog. Geogr. 2020, 39, 503–518. [Google Scholar] [CrossRef]
  4. Fang, C.; Yang, J.; Fang, J.; Huang, X.; Zhou, Y. Optimization Transmission Theory and Technical Pathways that Describe Multiscale Urban Agglomeration Spaces. Chin. Geogr. Sci. 2018, 28, 543–554. [Google Scholar] [CrossRef]
  5. Bren d’Amour, C.; Reitsma, F.; Baiocchi, G.; Barthel, S.; Güneralp, B.; Erb, K.-H.; Haberl, H.; Creutzig, F.; Seto, K.C. Future urban land expansion and implications for global croplands. Proc. Natl. Acad. Sci. USA 2017, 114, 8939–8944. [Google Scholar] [CrossRef]
  6. Jiang, P.; Li, M.; Cheng, L. Dynamic response of agricultural productivity to landscape structure changes and its policy implications of Chinese farmland conservation. Resour. Conserv. Recycl. 2020, 156, 104724. [Google Scholar] [CrossRef]
  7. Chen, M.X.; Liang, L.W.; Wang, Z.B.; Zhang, W.Z.; Yu, J.H.; Liang, Y. Geographical thoughts on the relationship between ‘Beautiful China’ and land spatial planning. J. Geogr. Sci. 2020, 30, 705–723. [Google Scholar] [CrossRef]
  8. Tobias, S.; Price, B. How Effective Is Spatial Planning for Cropland Protection? An Assessment Based on Land-Use Scenarios. Land 2020, 9, 20. [Google Scholar] [CrossRef]
  9. Gao, J.; O’Neill, B.C. Mapping global urban land for the 21st century with data-driven simulations and Shared Socioeconomic Pathways. Nat. Commun. 2020, 11, 2302. [Google Scholar] [CrossRef]
  10. Deng, Z.; Quan, B. Intensity Analysis to Communicate Detailed Detection of Land Use and Land Cover Change in Chang-Zhu-Tan Metropolitan Region, China. Forests 2023, 14, 939. [Google Scholar] [CrossRef]
  11. Bu, Z.; Fu, J.; Jiang, D.; Lin, G. Production–Living–Ecological Spatial Function Identification and Pattern Analysis Based on Multi-Source Geographic Data and Machine Learning. Land 2023, 12, 2029. [Google Scholar] [CrossRef]
  12. Lin, G.; Fu, J.; Jiang, D. Production–Living–Ecological Conflict Identification Using a Multiscale Integration Model Based on Spatial Suitability Analysis and Sustainable Development Evaluation: A Case Study of Ningbo, China. Land 2021, 10, 383. [Google Scholar] [CrossRef]
  13. Peng, Y.; Luan, Q.; Xiong, C. Evaluation of Spatial Functions and Scale Effects of “Production–Living–Ecological” Space in Hainan Island. Land 2023, 12, 1637. [Google Scholar] [CrossRef]
  14. Huang, J.; Lin, H.; Qi, X. A literature review on optimization of spatial development pattern based on ecological-production-living space. Prog. Geogr. 2017, 36, 378–391. [Google Scholar]
  15. Liu, J.; Liu, Y.; Li, Y. Classification evaluation and spatia-temporal analysis of “production–living–ecological” spaces in China. Acta Geogr. Sin. 2017, 72, 1290–1304. [Google Scholar]
  16. Zhang, H.; Xu, E.; Zhu, H. An ecological-living-industrial land classification system and its spatial distribution in China. Resour. Sci. 2015, 37, 1332–1338. [Google Scholar]
  17. Li, J.Y.; Zheng, X.Q.; Zhang, C.X.; Chen, Y.M. Impact of Land-Use and Land-Cover Change on Meteorology in the Beijing-Tianjin-Hebei Region from 1990 to 2010. Sustainability 2018, 10, 22. [Google Scholar] [CrossRef]
  18. Liu, B.; Pan, L.B.; Qi, Y.; Guan, X.; Li, J.S. Land Use and Land Cover Change in the Yellow River Basin from 1980 to 2015 and Its Impact on the Ecosystem Services. Land 2021, 10, 23. [Google Scholar] [CrossRef]
  19. Yang, H.F.; Zhong, X.N.; Deng, S.Q.; Nie, S.N. Impact of LUCC on landscape pattern in the Yangtze River Basin during 2001–2019. Ecol. Inform. 2022, 69, 14. [Google Scholar] [CrossRef]
  20. Wei, T.; Shangguan, D.; Shen, X.; Ding, Y.; Yi, S. Dynamics of Land Use and Land Cover Changes in An Arid Piedmont Plain in the Middle Reaches of the Kaxgar River Basin, Xinjiang, China. ISPRS Int. J. Geo-Inf. 2020, 9, 87. [Google Scholar] [CrossRef]
  21. Yu, M.Y.; Meng, F.; Cui, J. Spatial Analysis of Land Use and Land Cover Changes on the Basis of RS and GIS. In Proceedings of the International Conference on Civil Engineering and Transportation (ICCET 2011), Jinan, China, 14–16 October 2011; pp. 1711–1714. [Google Scholar]
  22. Aldwaik, S.Z.; Pontius, R.G. Intensity analysis to unify measurements of size and stationarity of land changes by interval, category, and transition. Landsc. Urban Plan. 2012, 106, 103–114. [Google Scholar] [CrossRef]
  23. Pontius, R.G.; Millones, M. Death to Kappa: Birth of Quantity Disagreement and Allocation Disagreement for Accuracy Assessment; Taylor & Francis: Abingdon, UK, 2011; Volume 32, pp. 4407–4429. [Google Scholar]
  24. Deng, Z.; Quan, B. Intensity Characteristics and Multi-Scenario Projection of Land Use and Land Cover Change in Hengyang, China. Int. J. Environ. Res. Public Health 2022, 19, 8491. [Google Scholar] [CrossRef]
  25. Huang, B.; Huang, J.; Pontius, R.G., Jr.; Tu, Z. Comparison of Intensity Analysis and the land use dynamic degrees to measure land changes outside versus inside the coastal zone of Longhai, China. Ecol. Indic. 2018, 89, 336–347. [Google Scholar] [CrossRef]
  26. Fan, X.; Quan, B.; Deng, Z.; Liu, J. Study on Land Use Changes in Changsha–Zhuzhou–Xiangtan under the Background of Cultivated Land Protection Policy. Sustainability 2022, 14, 15162. [Google Scholar] [CrossRef]
  27. Quan, B.; Pontius, R.G.; Song, H. Intensity Analysis to communicate land change during three time intervals in two regions of Quanzhou City, China. GISci. Remote Sens. 2020, 57, 21–36. [Google Scholar] [CrossRef]
  28. Shafizadeh-Moghadam, H.; Minaei, M.; Feng, Y.; Pontius, R.G. GlobeLand30 maps show four times larger gross than net land change from 2000 to 2010 in Asia. Int. J. Appl. Earth Obs. Geoinf. 2019, 78, 240–248. [Google Scholar] [CrossRef]
  29. Varga, O.G.; Pontius, R.G., Jr.; Szabó, Z.; Szabó, S. Effects of Category Aggregation on Land Change Simulation Based on Corine Land Cover Data. Remote Sens. 2020, 12, 1314. [Google Scholar] [CrossRef]
  30. Zhou, Z.; Quan, B.; Deng, Z. Effects of Land Use Changes on Ecosystem Service Value in Xiangjiang River Basin, China. Sustainability 2023, 15, 2492. [Google Scholar] [CrossRef]
  31. Yuan, N.; Feng, Y.Q.; Liang, S.H.; Wang, G.J.; Yin, T.; Yan, D.Z.; Wu, P.; Kuang, X.X.; Wan, L. Spatial gathering characteristics of drought in the Qinghai-Tibet Plateau. Front. Environ. Sci. 2022, 10, 12. [Google Scholar] [CrossRef]
  32. Chatterjee, S.; Dinda, A. Determination of Characterized Urban Thermal Zones (UTZ) for Assessing Microclimates in the Tropical Metropolitan Area of Kolkata. Sust. Cities Soc. 2022, 80, 17. [Google Scholar] [CrossRef]
  33. Mushore, T.D.; Mutanga, O.; Odindi, J. Determining the Influence of Long Term Urban Growth on Surface Urban Heat Islands Using Local Climate Zones and Intensity Analysis Techniques. Remote Sens. 2022, 14, 22. [Google Scholar] [CrossRef]
  34. Kuang, W.; Zhang, S.; Du, G.; Yan, C.; Wu, S.; Li, R.; Lu, D.; Pan, T.; Ning, J.; Guo, C.; et al. Monitoring periodically national land use changes and analyzing their spatiotemporal patterns in China during 2015–2020. J. Geogr. Sci. 2022, 32, 1705–1723. [Google Scholar] [CrossRef]
  35. Xi, J. Holding high the great banner of socialism with Chinese characteristics and unitedly striving for the comprehensive construction of a modernized socialist country. People’s Daily, 26 October 2022; p. 001. [Google Scholar]
  36. Wang, J.Y.; He, D.Q. Sustainable urban development in China: Challenges and achievements. Mitig. Adapt. Strateg. Glob. Chang. 2015, 20, 665–682. [Google Scholar] [CrossRef]
  37. Hu, J. Advancing Firmly Along the Road of Socialism with Chinese Characteristics Striving to Build a Moderately Prosperous Society in All Aspects. People’s Daily, 18 November 2012; p. 001. [Google Scholar]
  38. Fu, J.; Gao, Q.; Jiang, D.; Li, X.; Lin, G. Spatial–temporal distribution of global production–living–ecological space during the period 2000–2020. Sci. Data 2023, 10, 589. [Google Scholar] [CrossRef] [PubMed]
  39. Pontius, R.G.; Santacruz, A. Quantity, exchange, and shift components of difference in a square contingency table. Int. J. Remote Sens. 2014, 35, 7543–7554. [Google Scholar] [CrossRef]
  40. Li, L.; Zheng, S.; Zhao, K.; Shen, K.; Yan, X.; Zhao, Y. The Quantitative Impact of the Arable Land Protection Policy on the Landscape of Farmland Abandonment in Guangdong Province. Remote Sens. 2022, 14, 4991. [Google Scholar] [CrossRef]
  41. Zhou, Y.; Li, X.; Liu, Y. Cultivated land protection and rational use in China. Land Use Pol. 2021, 106, 105454. [Google Scholar] [CrossRef]
  42. Lai, L.; Huang, X.J.; Yang, H.; Chuai, X.W.; Zhang, M.; Zhong, T.Y.; Chen, Z.G.; Chen, Y.; Wang, X.; Thompson, J.R. Carbon emissions from land-use change and management in China between 1990 and 2010. Sci. Adv. 2016, 2, 8. [Google Scholar] [CrossRef]
  43. Ning, J.; Liu, J.; Kuang, W.; Xu, X.; Zhang, S.; Yan, C.; Li, R.; Wu, S.; Hu, Y.; Du, G.; et al. Spatiotemporal patterns and characteristics of land-use change in China during 2010–2015. J. Geogr. Sci. 2018, 28, 547–562. [Google Scholar] [CrossRef]
Figure 1. Technical framework.
Sustainability 15 16837 g001
Figure 2. Structure and spatial pattern of China’s PLES, 2000 (a), 2010 (b), 2020 (c).
Sustainability 15 16837 g002
Figure 3. Composition of spatial changes in China’s PLES, 2000–2020.
Sustainability 15 16837 g003
Figure 4. Components of change in China’s PLES, 2000–2010 (a), 2010–2020 (b).
Sustainability 15 16837 g004
Figure 5. Scale and intensity of total spatial changes in China’s PLES, 2000–2020.
Sustainability 15 16837 g005
Figure 6. Intensity of changes in different spatial types of China’s PLES, 2000–2010 (a), 2010–2020 (b).
Sustainability 15 16837 g006
Figure 7. Intensity of changes in different spatial types of the agricultural production space, 2000–2010 (a,b), 2010–2020 (c,d).
Sustainability 15 16837 g007
Table 1. China’s PLES classification system.
Primary CategorySecondary CategoryContent
The production space1. Agricultural production spaceGlobeLand30: cropland
2. Industrial production spaceGlobeLand30: artificial surface
The living space3. Urban living spacePopulation density is greater than 1500/km2
4. Rural living spacePopulation density is 300–1500/km2
The ecological space5. Forest ecological spaceGlobeLand30: forest, bush
6. Grassland ecological spaceGlobeLand30: grass
7. Water ecological spaceGlobeLand30: wetlands, water, glaciers, and permanent snow cover
8. Other ecological spacesGlobeLand30: tundra, bare land
Disclaimer/Publisher’s Note: The statements, opinions and data contained in all publications are solely those of the individual author(s) and contributor(s) and not of MDPI and/or the editor(s). MDPI and/or the editor(s) disclaim responsibility for any injury to people or property resulting from any ideas, methods, instructions or products referred to in the content.

