Article

Research on the Spatial and Temporal Dynamics of Crowd Activities in Commercial Streets and Their Relationship with Formats—A Case Study of Lao Men Dong Commercial Street in Nanjing

1
Department of Urban Planning, College of Landscape Architecture, Nanjing Forestry University, Nanjing 210037, China
2
Jinpu Reasearch Institute, Nanjing Forestry University, Nanjing 210037, China
3
Department of Urban Planning, School of Architecture, Southeast University, Nanjing 210096, China
*
Author to whom correspondence should be addressed.
Sustainability 2023, 15(24), 16838; https://doi.org/10.3390/su152416838
Submission received: 18 November 2023 / Revised: 11 December 2023 / Accepted: 11 December 2023 / Published: 14 December 2023

Abstract

:
Crowd activity is an important indicator of commercial streets’ attractiveness and developmental potential. The development of positioning technologies such as GPS and mobile signal tracking has provided a large amount of trajectory data for studying crowd activities on commercial streets. These data can not only be used for the statistics, extraction, and visualization of crowd information, but they also facilitate the exploration of deeper insights into dynamic behaviors, choices, trajectories, and other details of crowd activities. Based on this, this article proposes a new framework for analyzing crowd activities to explore the spatial activity patterns of crowds and understand the dynamic spatial needs of people by analyzing their correlations with local formats. Specifically, we analyze the spatial activity characteristics of a crowd in the Lao Men Dong Commercial Street area by identifying the stay points and trajectory clusters of the crowd, and we establish a regression analysis model by selecting commercial street format variables to evaluate their impact on crowd activities. Through case analysis of the Lao Men Dong Commercial Street, this study confirms that our method is feasible and suitable for spatial research at different scales, thereby providing relevant ideas for format location selection, spatial layout, and other planning types, and for promoting the sustainable development of urban spaces.

1. Introduction

The transformation of consumer patterns and the structural transformation of commercial formats have raised concerns about the vitality and survival capacity of commercial streets [1]. The rise of new shopping methods such as online retail and food delivery is gradually changing people’s consumption patterns, and the constantly changing combination of formats is also having a strong impact on the stable development of commercial streets, leading to a gradual loss of their attractiveness [2]. For example, although the number of people in Nanjing’s commercial streets on National Day reached 1.379 million in 2021, it was still down by 22.89% compared with 2020 (http://wlj.nanjing.gov.cn, accessed on 11 December 2022). Considering the impact of the COVID-19 epidemic, this drop in numbers is still related to the decline in the attractiveness of commercial streets; the vacancy rate of commercial street stores in Japan rose from 8.98% in 2006 to 14.62% in 2012, and this is an annually increasing trend [3]. In response to this declining trend, understanding the rules governing people’s activities and space requirements is the main approach to effectively deal with the current situation of commercial streets. On one hand, the dynamic activities of crowds are the main driving factors of changes in commercial streets [4]; on the other hand, crowd activities are also dynamically updated with changes in the time and space of commercial street environments [5,6,7,8]. Meanwhile, formats are different business forms developed by operators through the combination of corresponding elements to meet different consumption needs, and they are used to represent the existing or realized forms of retail and service industry activities. The choice, changes, and specific forms of formats are active choices made by retail operators as consumer-positioning changes. The formats’ function and intensity of a commercial street directly indicate the economic development level of the commercial street [9]. Therefore, it is crucial to analyze the characteristics of crowd space activities in commercial streets and guide the rational layout of formats to improve the competitiveness of commercial streets and promote their sustainable development.
Researchers from various fields have conducted in-depth explorations and research on how to better understand people’s spatiotemporal activity patterns to guide the dynamic and stable development of spatial environments. Previous studies have mainly focused on measuring human activity space; through methods such as the standard deviation ellipse [10], minimum spanning tree [11], and space-time prism [12], we have gradually developed a clear understanding of human spatial activity. With the paradigm shift brought about by big data and machine learning in the quantification of commercial-street space indicators [13,14], the development and use of data such as those from location-based services [15,16] and social media [17,18] have facilitated a large number of studies on the spatiotemporal activities of crowds. For example, Yang used nighttime light data to represent the intensity of crowd activities in different regions and used Gaussian functions to visualize and model the spatial waves in the change in human activity intensity [19]. Meanwhile, innovations in research methods have deepened our understanding of crowd activity. The mining of algorithms such as kernel density estimation, dynamic community detection, and unsupervised learning algorithms helps us interpret human spatiotemporal activity rules from a deeper perspective [20,21,22]. The discovery of periodic patterns, clustering patterns, outliers, and other patterns of crowd activities guides us to pay attention to the connection between different groups of people with different social attributes and spatial characteristics [23,24,25]. In addition, the mining of quantitative indicators of crowd activities provides strong support for analyzing the spatial regularity of crowd activities [26,27,28]. Bao et al. proposed an algorithm to identify the home location of Twitter users and combined it with the radius of gyration of crowd activities to analyze the daily activity patterns of the crowd [29]; Xu et al. used a trajectory segmentation method to extract six movement indicators in crowd activity data to quantify crowd activity characteristics [30]. These studies have overcome the limitations of traditional methods, such as difficult data collection and insufficient in-depth analysis of activity patterns and have provided a more comprehensive understanding of how people pass through and use space. However, current research methods on crowd activities in commercial streets mainly aim to analyze the correlation between crowd gathering areas [21,31] and the built environment [32]. Since location distribution does not reflect the details of crowd activities, such as activity types and trajectory characteristics, this limitation makes it difficult to determine behavioral choices and activity paths in space, thereby affecting the overall understanding of the utilization of commercial street spaces. Therefore, further research is still needed on how to determine the dynamic activity characteristics and behavior selection process of people in the environment.
Crowd activity is an important indicator of the attractiveness and development potential of commercial streets [33]. The characterization of crowd activities in commercial streets is not only the product of the number of people and the distribution of time and space locations, but also the result of a series of the activities produced by the selection of the formats of the commercial street, which jointly reveal the characteristics of the associated crowd activities. Among them, crowd trajectories contain information such as the location distribution and activity status of people, which can intuitively reflect the activities and types of crowds [34]. Therefore, analyzing the characteristics of crowd activities in commercial streets based on crowd trajectories can more accurately demonstrate the activity patterns of people in these streets.
In this context, we propose a framework to analyze the characteristics of crowd activities based on the perspective of people’s stay and movement in commercial streets. The residence time and area of the crowd are the main contents of analyzing crowd activities [35], and the stay behavior reflects how people are carrying out activities corresponding to the type of the formats. For instance, people stay in the catering space with the purpose of eating. Studying the movement trajectory characteristics of people in commercial streets can help us evaluate the advantages and disadvantages of the functional layout and spatial planning of commercial streets and provide feasible suggestions for the functional layout of commercial streets [36]. Therefore, studying the activity characteristics of people’s movement and stay to master their behavioral states in commercial street spaces is helpful to understand people’s usage of different spaces in commercial streets and reflect the degree of attraction of various types of format spaces to crowd activities, thereby providing a strong reference for commercial street planning, meeting people’s space needs, and achieving the sustainable development of commercial streets.
In this study, we focus on the behavioral choices of people in a commercial street, analyze the dynamic activity characteristics of the crowd by determining people’s stay patterns and activity trajectory clusters, explore the activity information of the crowd in the commercial street at different times and spaces, and analyze the behavioral choices and activity trajectory clusters of people in space to enhance our understanding of the use of different spaces in commercial streets, thereby promoting the sustainable development of commercial street spaces. Based on this, we explore the correlation between crowd activities and commercial street formats by establishing a regression analysis model. Therefore, the study aims to answer the following two questions: (1) at the commercial block level, what are the characteristics of a crowd’s stay activities and spatial trajectories? (2) What is the relationship between crowd activities and formats based on trajectory clusters? By answering these questions, we aim to understand the dynamic spatial needs of crowds and provide a reference for the spatial layout and location selection of commercial street formats.
The remainder of this paper is organized as follows. Section 2 reviews and discusses previous studies. Section 3 introduces the research site and methodological design. Section 4 discusses the results of the analysis. Section 5 presents the findings, innovations, and limitations of this study, and Section 6 provides a summary.

2. Literature Review

To better understand crowd activities and their relationship with commercial formats, we conducted a literature review on the application of pedestrian activity trajectories and the correlation between crowd activities and formats.

2.1. Related Research on Pedestrian Activity Trajectories

The mining of pedestrian trajectory data provides a good opportunity for research in related fields concerning cities and can be divided into two types: macroscopic and microscopic. At the macro level, pedestrian activity trajectory patterns can reflect spatial connections and usage [37] and show the temporal and spatial distribution characteristics and mobility laws of the urban population [38,39]. Additionally, the analysis of pedestrian activity trajectory characteristics can complement the shortcomings of traditional techniques in urban spatial research. For example, Chris et al. conducted a multi-modal observation of the number of people in different locations to determine the fairness of streets’ spatial locations to users [40]. Williams et al. measured public life based on image processing technology [41]. Some Chinese scholars’ research on related aspects mainly reflects the urban land use types and functional properties through crowd activity patterns. Liu et al. combined pedestrian trajectory patterns and the remote-sensing image recognition of urban land use types to study population activity characteristics in various urban functional areas [42]; Zhang et al. modeled the relationship between pedestrian trajectory information and urban mixed land use and analyzed urban structure and land use [43]. In addition, the study of activity trajectories contributes to the identification of urban spatial structures and hotspot spatial regions [44,45,46].
At the micro level, because pedestrian activity trajectories can intuitively record people’s spatiotemporal distribution, behavior types, and dynamic activities [34,47,48], some researchers have used pedestrian activity trajectories to analyze a crowd’s walking preferences and spatial vitality evaluation. Research suggests that factors such as route length, travel time, and walking purpose are all considerations for walking choices [49,50,51,52,53]. Sevtsuk, et al. compared pedestrian route choices under different models based on the pedestrian trajectory data set of San Francisco and explained the estimated route characteristics of pedestrian route preferences [54]; Yamamoto et al. found that roadside restaurants have different effects on route choice on weekdays and holidays by building a nested logit model of downtown-area patterns and walking-route-choice behavior [55]. Similarly, pedestrian trajectories are an important data support for spatial vitality evaluation. For example, Niu et al. established an analytical framework for the vitality of small public spaces based on pedestrian trajectories [56]. Related studies in China mainly use pedestrian trajectories as data support and apply them to the measurement of the vitality evaluation system of small public spaces. Hou et al. quantified the use of public spaces through people’s location information [57]. In addition, pedestrian trajectories explain the link between population activity and factors such as climate and accessibility [58,59].

2.2. Research on the Correlation between Population Activity and Formats

The relationship between formats and crowd activity has always been an important research topic in urban development. Studies have shown that formats and crowd activity are closely linked [60,61,62,63,64,65]. For example, M. Frick, et al. used exploratory spatial statistics and ordinary least squares (OLS) regression to analyze the correlation between retail format density and school proximity and socio-demographic differences in New York City, and they evaluated whether there were differences in retail format agglomeration patterns [66]. Berendes et al. evaluated customer trajectories to study crowd activity behavior in commercial streets and revealed different clusters of crowd activities through cluster analysis [67]. As one of the factors influencing people’s travel activities, formats can help automatically generate journey paths for different groups of people. Santos et al. proposed a personalized travel recommendation system based on points of interest (POI) to provide personalized and diversified recommendations for different groups of people [68], indicating that the function and accessibility of formats can improve the travel experience of a group. Chinese scholars have mainly analyzed the impact of various characteristics of formats on crowd activities. Shi et al. coupled the spatial relationship between crowd activity and formats and proposed a correlation index between the aggregation of different types of formats and population [69]. Population activities are important factors influencing the spatial layout and location selection of formats [8,70]. Shi et al. quantitatively explored the significant impact of population activity on the number of takeaways through a spatial econometric model [71]. Similarly, the characteristics of formats, such as density and diversity, have different impacts on crowd activities [35,72]. Chen et al. used street view images and machine learning technology to identify crowd activity and proposed that the number of various types of formats is positively correlated with pedestrian activity [73].
To sum up, crowd activities are closely related to the spatial environment. However, research on the correlation between crowd activities and commercial street formats is still limited. Therefore, taking into account the dynamic characteristics and continuity of people’s activities in space, this study used continuous trajectory data to determine the use of commercial street space by identifying the spatial status (moving or staying) of people, and starting from the subjective perspective of the crowd, it is related to the commercial street format to supplement the research content in this aspect.

3. Data and Methods

3.1. Study Area

The study area is located on the Lao Men Dong Commercial Street in Nanjing City, Jiangsu Province, and covers an area of approximately 700,000 square meters (Figure 1). Lao Men Dong Commercial Street retains the historical buildings of the Ming and Qing dynasties, reflecting the style of traditional residential houses in Nanjing. On the basis of developing its own historical and cultural characteristics, the commercial street introduces many types of industries, such as gourmet catering, leisure, and entertainment, and forms a walking-oriented space environment, which is one of the national 5A [74] scenic tourist spots. The pedestrian flow in the densely populated area where Lao Men Dong commercial street is located ranks first in the Jiangsu Province tourism consumption cluster. During the National Day holiday, passenger volume has reached 2.05 million people. (http://wlj.nanjing.gov.cn, accessed on 11 December 2022). There are many types of formats in the commercial street, which are mainly distributed in strips on both sides of the middle of the commercial street. This article reorganizes formats into 7 commonly used categories based on their classification standards [9] (Table 1), among which there are many types of catering formats that provide catering and other services for tourists. However, the number of public services and other types of formats is relatively small. This commercial street is characterized by frequent population flow and a diversified formats structure, and it is suitable as the research object of this study.

3.2. Data

This study used three types of data: formats, road network data, and crowd trajectory point data. Formats and road network data were collected from the Gaode Developer platform (https://lbs.amap.com/, accessed on 11 December 2022). using Python. The formats data primarily included the formats’ name, category, spatial location, and other information. Road network data primarily include information on road lengths, widths, and spatial locations. Population trajectory point data were collected using Wi-Fi probe devices, and the time–space position information of the trajectory points was calculated using Python. In addition, according to field research, population activities in the Lao Men Dong commercial block are most frequent between 13:00 and 20:00. Therefore, this study collected data from 13:00 to 20:00 on 26 November to 7 December 2022; these dates were chosen to avoid national statutory holidays, poor weather conditions, etc., and crowd activities are relatively less affected by external factors, so these special circumstances would not affect the research results.
Cleaning of raw data is essential to ensure data accuracy. We checked the accuracy of the formats and road network data through field research and cleaned and changed incorrect and incomplete data. For example, for roads that were too low in grade and not collected by the Gaode developer platform, we completed the road network data by manually recording information such as the length, width, and spatial coordinates of both ends of the road.

3.3. Method

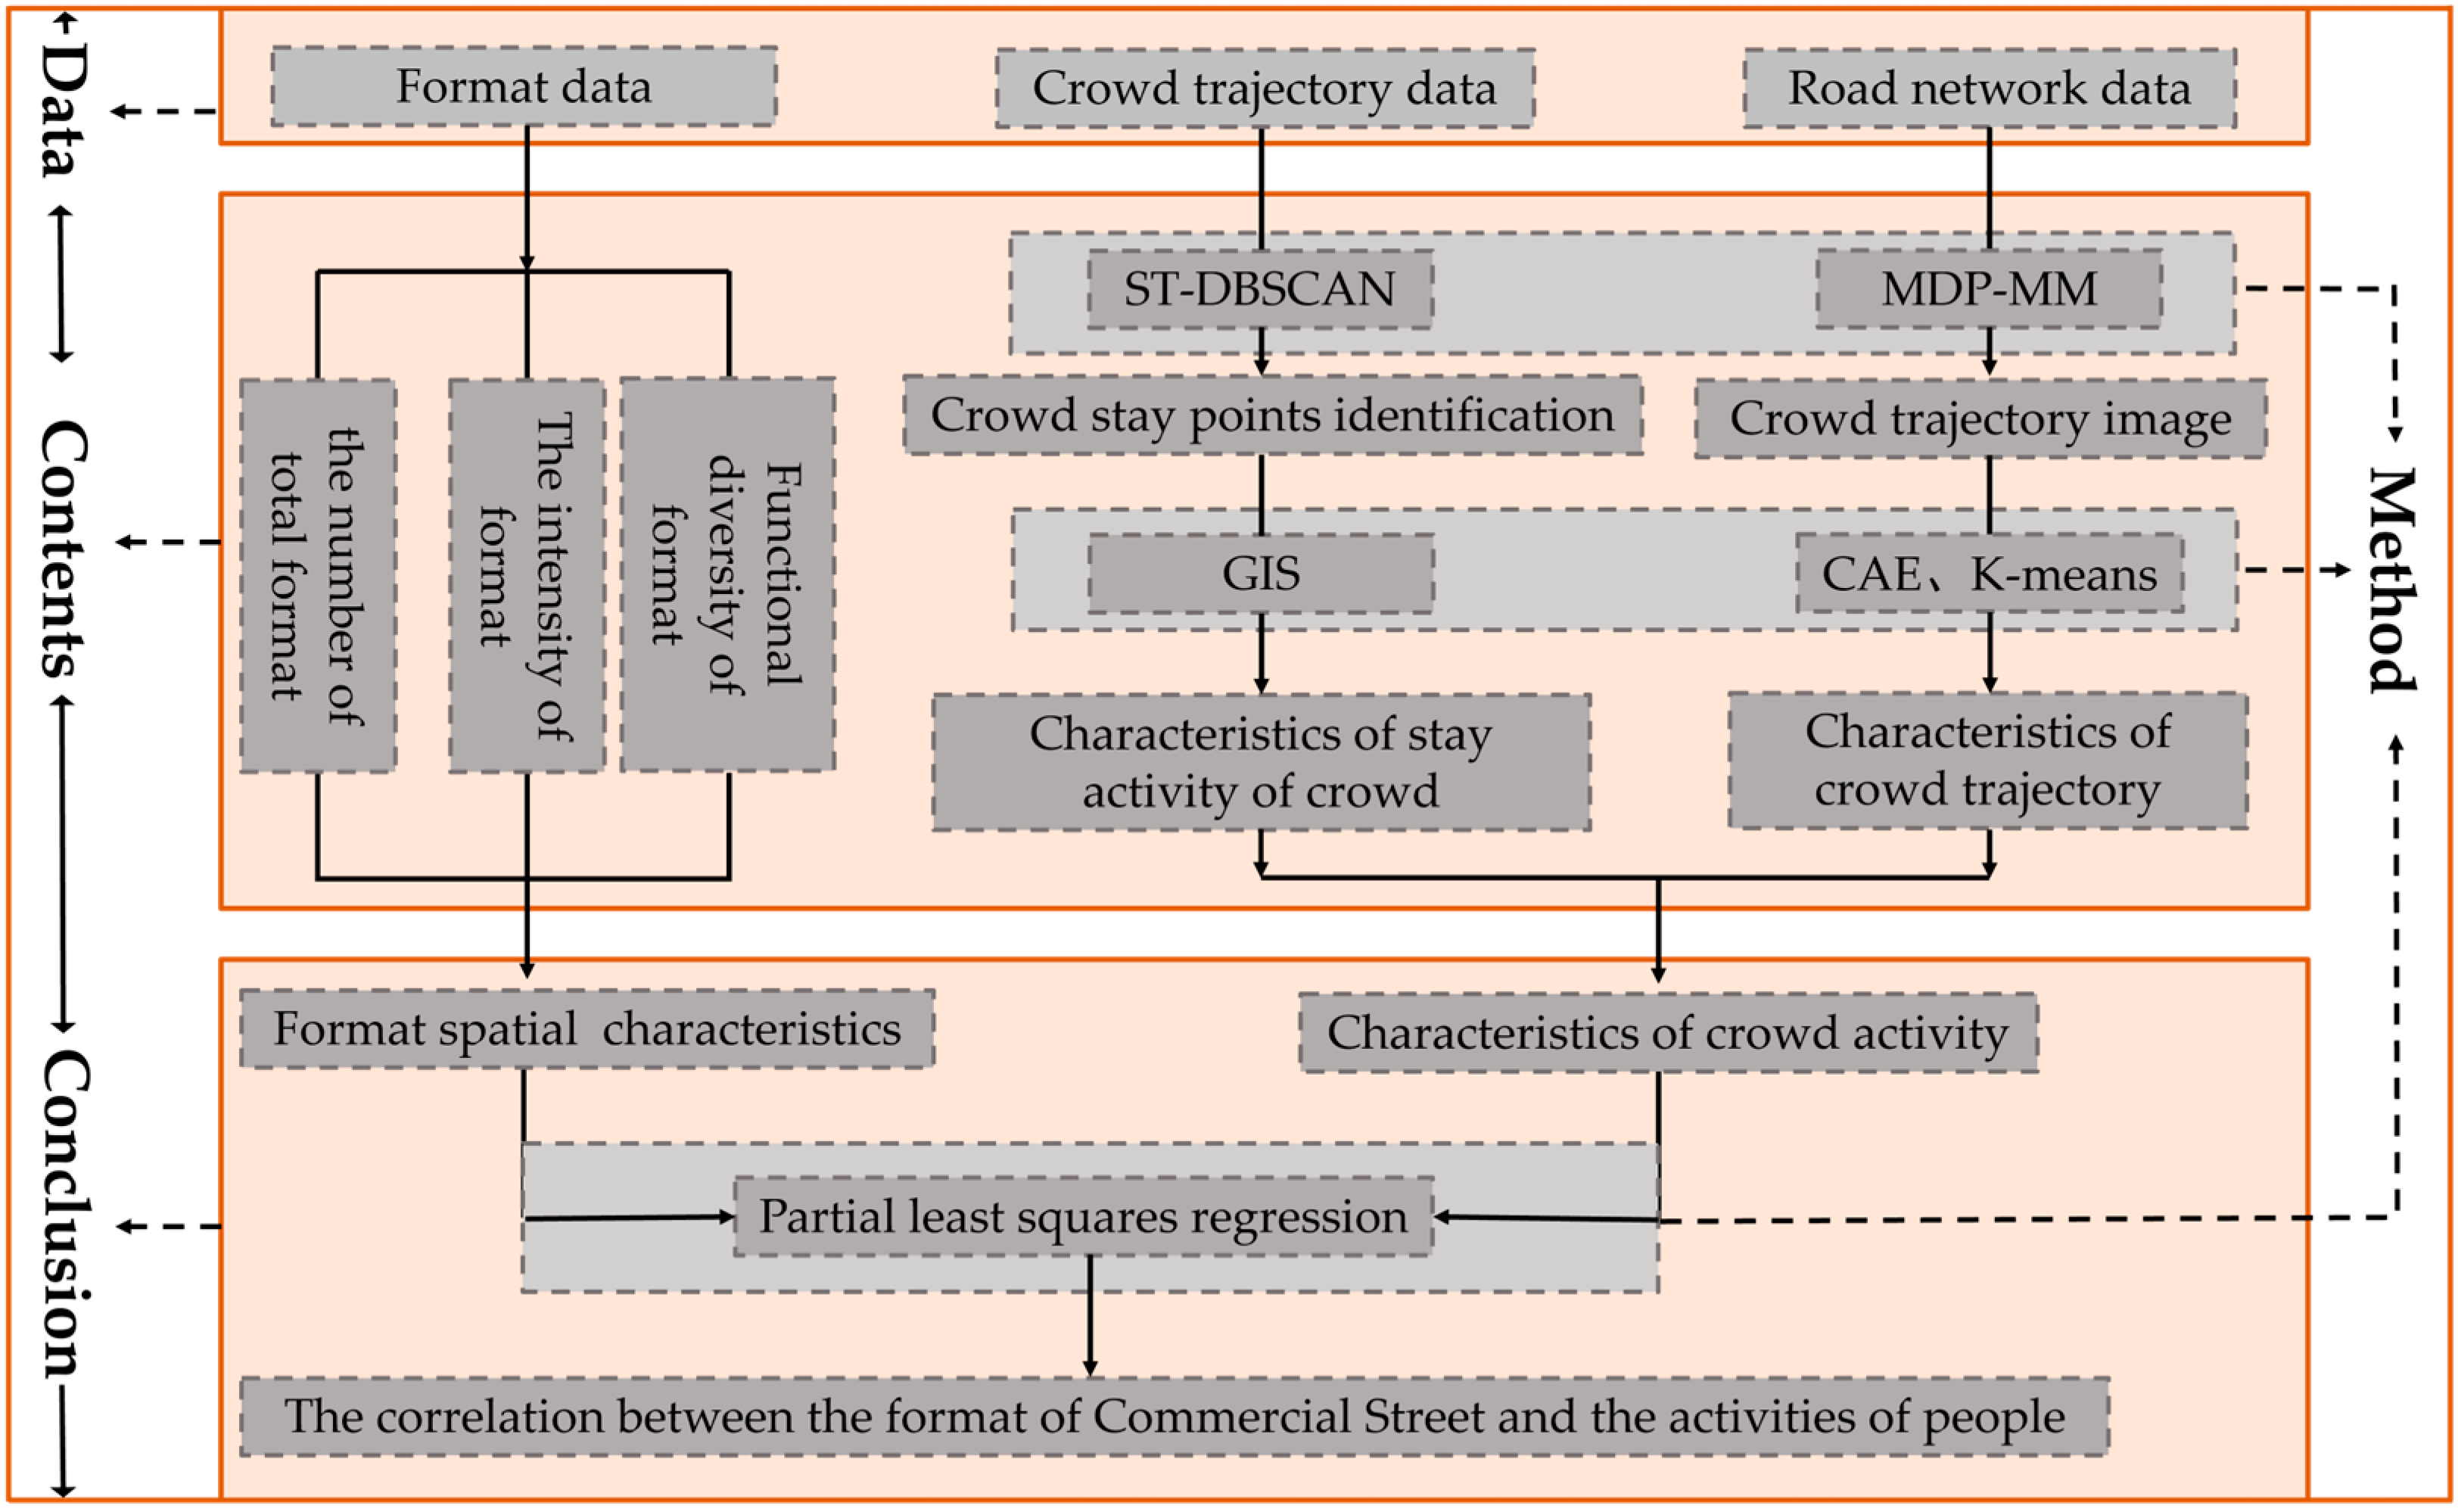
In order to determine the characteristics of formats that affect crowd activities, we obtained and calculated crowd trajectory data based on Wi-Fi probe equipment and constructed a research framework that explores the characteristics of crowd activities and links them with commercial street formats (Figure 2). This framework comprises two main parts. First, we proposed an analysis method based on trajectory data to mine crowd activity characteristics and obtain dynamic and continuous spatial information on crowds on commercial streets by analyzing crowd stay characteristics and trajectory clustering. Subsequently, the characteristics of crowd activity and variables of commercial street formats were analyzed, and a regression analysis model was introduced to explore the correlation between commercial street formats and crowd activities.

3.3.1. Acquisition of Crowd Trajectory Data

With the gradual increase in the penetration rate of smart phones (https://www.statista.com/statistics/201183/forecast-of-smartphone-penetration-in-the-us/, accessed on 11 December 2022), many scholars have gradually begun to use Wi-Fi detection data to analyze the characteristics of human activities [75,76]. Although the data provided by traditional methods such as questionnaires and interviews are detailed, there are disadvantages such as high costs and difficulty in large-scale research, compared with methods such as GPS and video surveillance. However, the data of Wi-Fi probes have the advantages of a high accuracy and wide coverage [56], so this study used Wi-Fi probes to obtain crowd trajectory data [36,77]. According to the effective monitoring radius of 150 m of Wi-Fi probe devices, the study set up 6 Wi-Fi probe devices in Lao Men Dong Commercial Street (Figure 3). The location of the equipment ensured that the entire high street could be covered, so that all crowd data generated on-site could be collected. At the same time, considering the high concentration of people in and around the central area of Lao Men Dong Commercial Street, the Wi-Fi probe equipment were concentrated in these areas as much as possible to collect more accurate and comprehensive crowd data, and to be able to further analyze crowd activities in the commercial street.
Due to the large amount of crowd trajectory point data obtained, the trajectory point data inevitably had information loss, obvious deviation from other trajectory points, and data duplication. Missing information, such as received signal strength indication (RSSI), media access control address (MAC), and abnormal track points, could be deleted directly because it could not be supplemented reasonably; in the situation that the trajectory point data kept repeating during the survey period, the information of fixed devices such as merchants’ fixed routers and researchers’ computers were also be received by the Wi-Fi probes. After processing the data, python programming was used to calculate the spatial position information of the people, importing the output into the ArcGIS platform for visualization and subsequent analysis.

3.3.2. Crowd Spatial Characteristics Analysis Method

Current research on crowd activities is mainly based on people’s spatial coordinates, time, and other information, using methods such as kernel density analysis, hot and cold spot analyses, and trajectory clustering to explore people’s distribution characteristics and behavior patterns. By connecting them with external factors of different types such as the built environment, climate, and social attributes, we could explore the impact of crowd activities on the external environment. However, people are always accompanied by a dynamic behavioral process of moving or staying at a spot in space, so it is important to understand what activities people like to perform at what time. Although these methods can intuitively display people’s space needs, they cannot help us understand the behavioral preferences of the crowd in a refined manner, nor can the purpose of people’s behavior (rest, walking) be known. Therefore, we mainly analyzed the characteristics of crowd activities from the two perspectives of stay and movement, and we also analyzed the degree of use of space-related configuration facilities and the use of space at different times, so as to help the city better meet people’s needs for the use of different spaces.
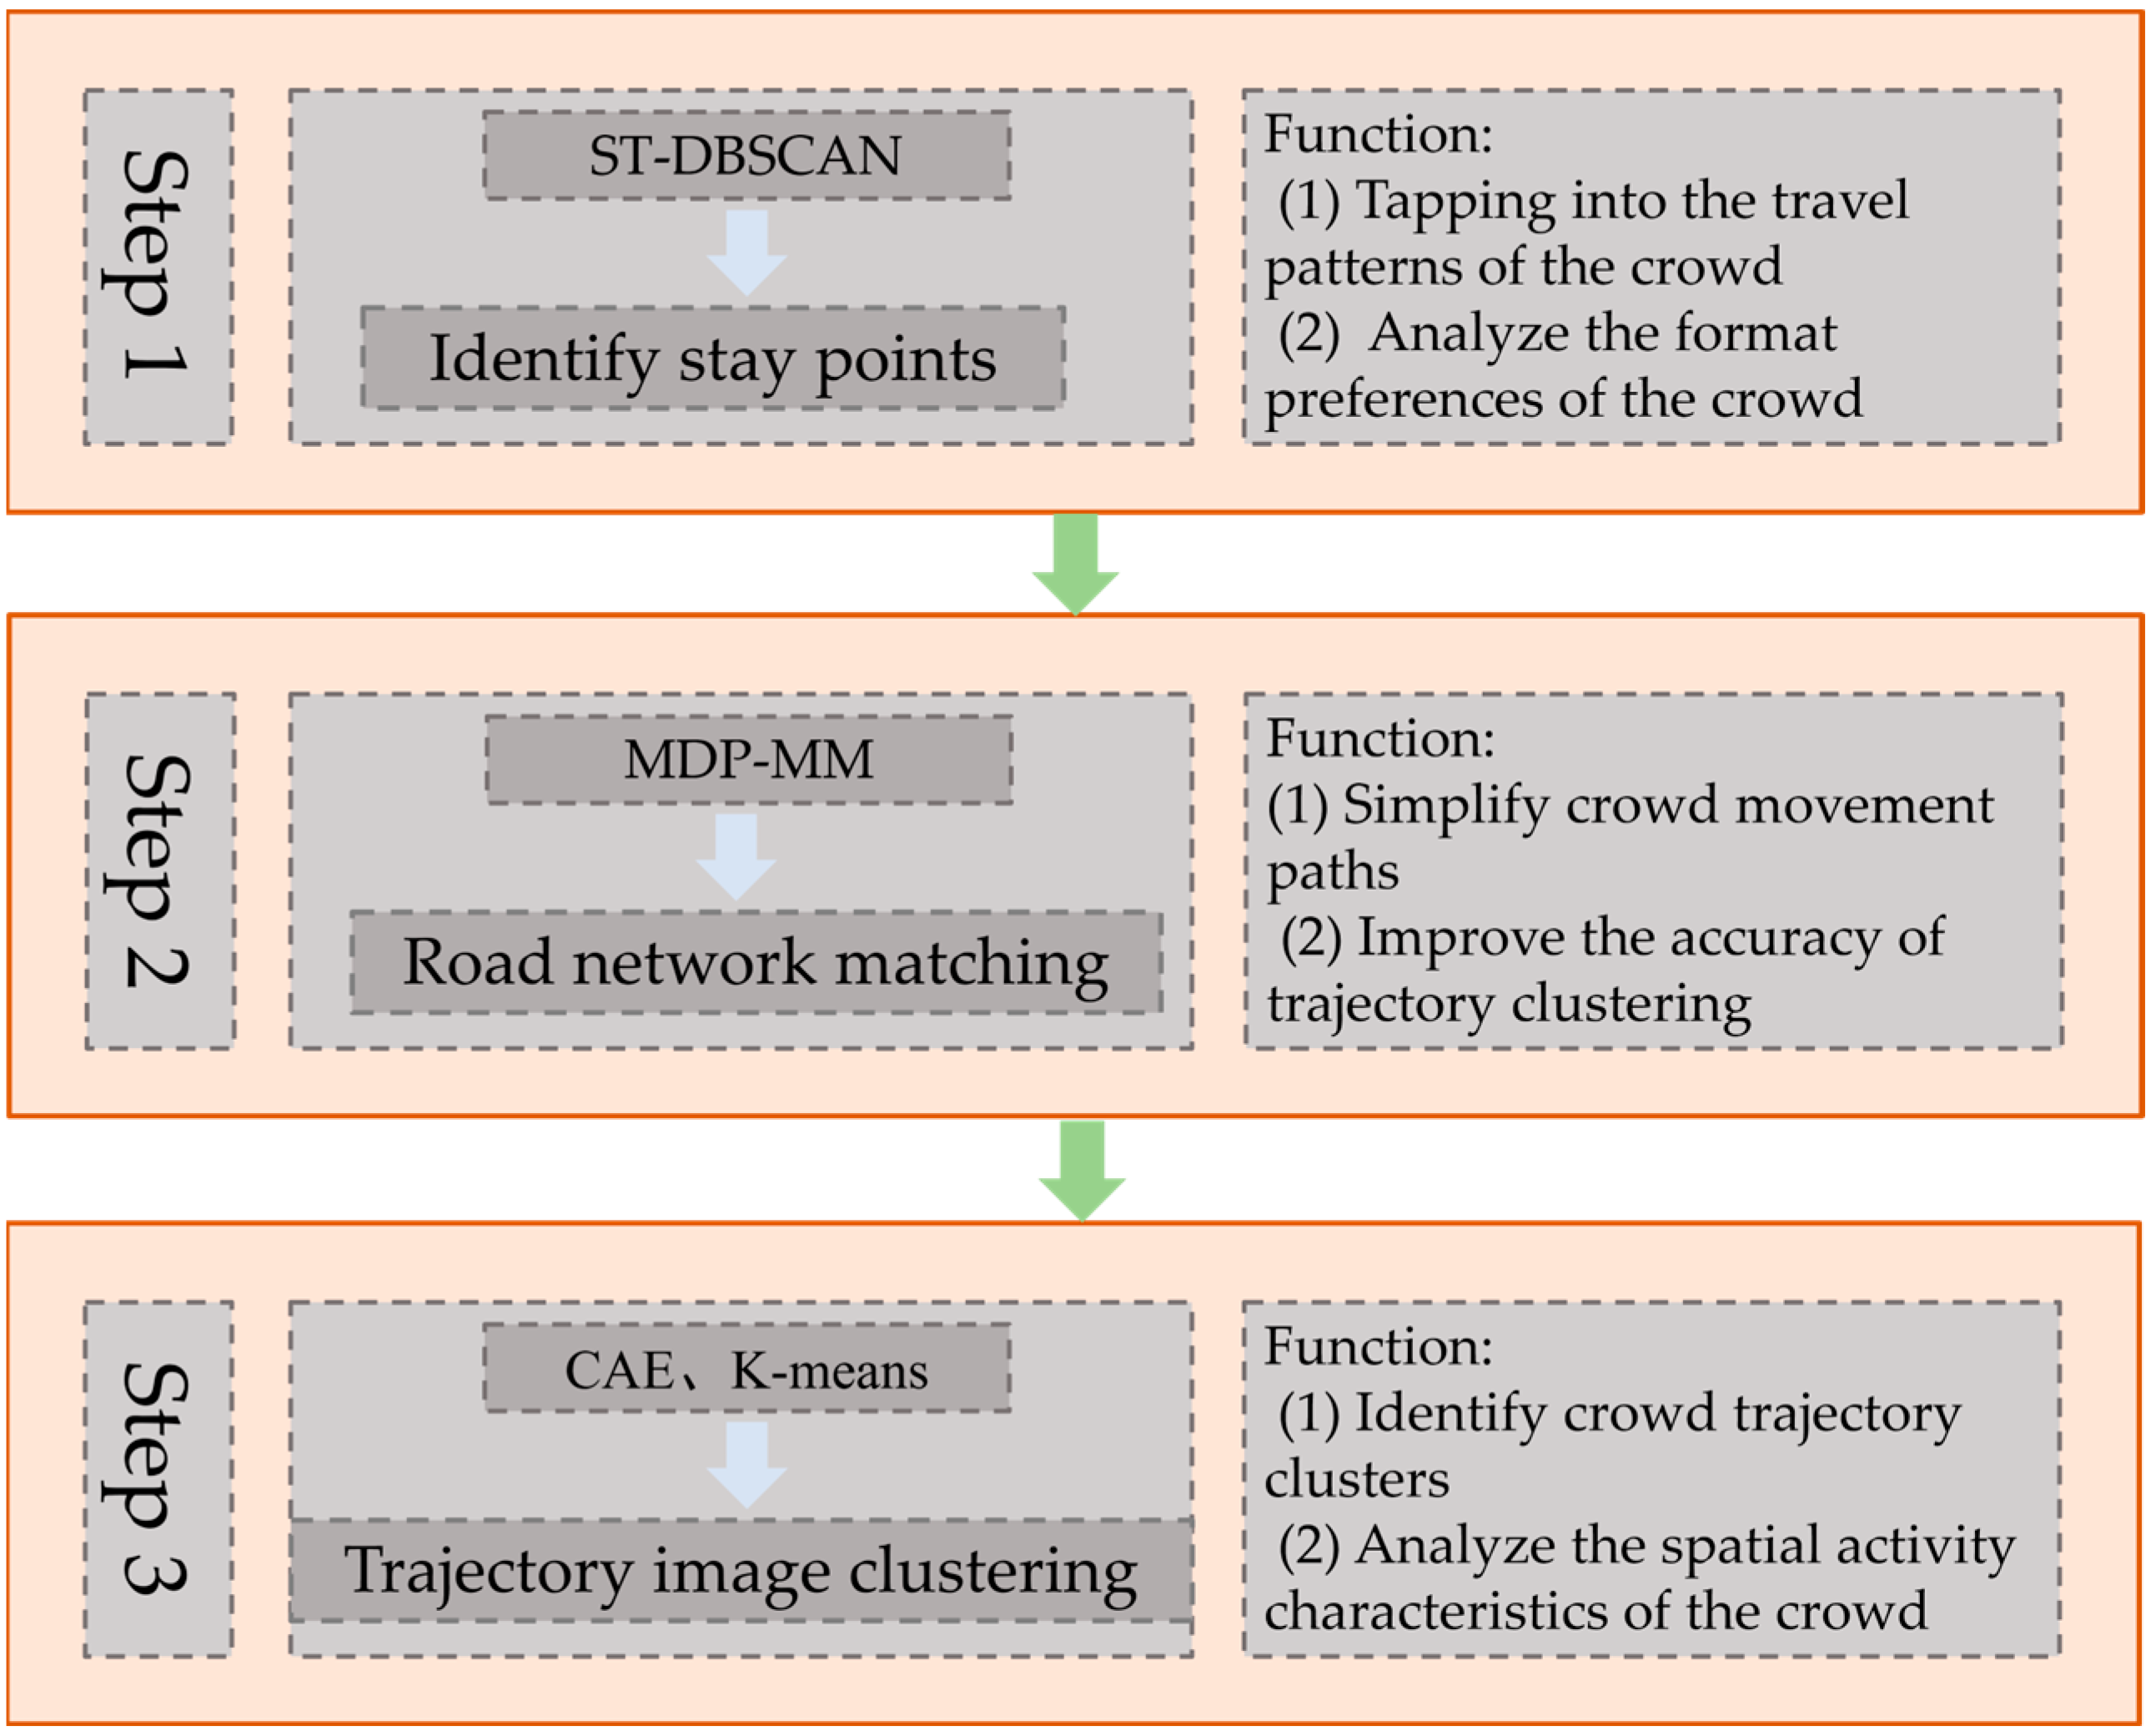
We mainly analyzed the characteristics of crowd activities from the perspectives of stay and movement, and we used methods such as stay point identification, road network matching, and CAE (Figure 4). Because of the randomness of crowd activities and the diversity of travel purposes, the effect of similarity measurement on trajectories determined through supervised learning algorithms is poor [78]. Therefore, before clustering and analyzing crowd trajectories, we used the road network matching algorithm to make up for it. The road network matching algorithm can convert complex trajectories into simple crowd travel sections to improve the accuracy of trajectory clustering. Therefore, it can effectively make up for the shortcomings of CAE processing data and obtain crowd activity characteristics by combining with CAE trajectory clustering.
The first step is to identify a crowd’s stop points so that characteristics such as travel preferences, behavior patterns, and purpose of activities of the crowd in the commercial street can be explored [79]. Identification of crowd stay is based on two thresholds of space and time [35] (Figure 5); this study used the spatio-temporal density-based spatial clustering of application with noise (ST-DBSCAN) algorithm to identify crowd stay points. The ST-DBSCAN algorithm can simultaneously consider the time and space distance thresholds of trajectory points and accurately extract trajectory points that meet the stay criteria on a three-dimensional scale by setting corresponding constraints. According to field observations, this study set the spatial distance threshold and time threshold as 5 min and 10 m, respectively; that is, when some track points of a person were always moving within 10 m within 5 min, these trajectory points were determined as a population stay and regarded as one stay.
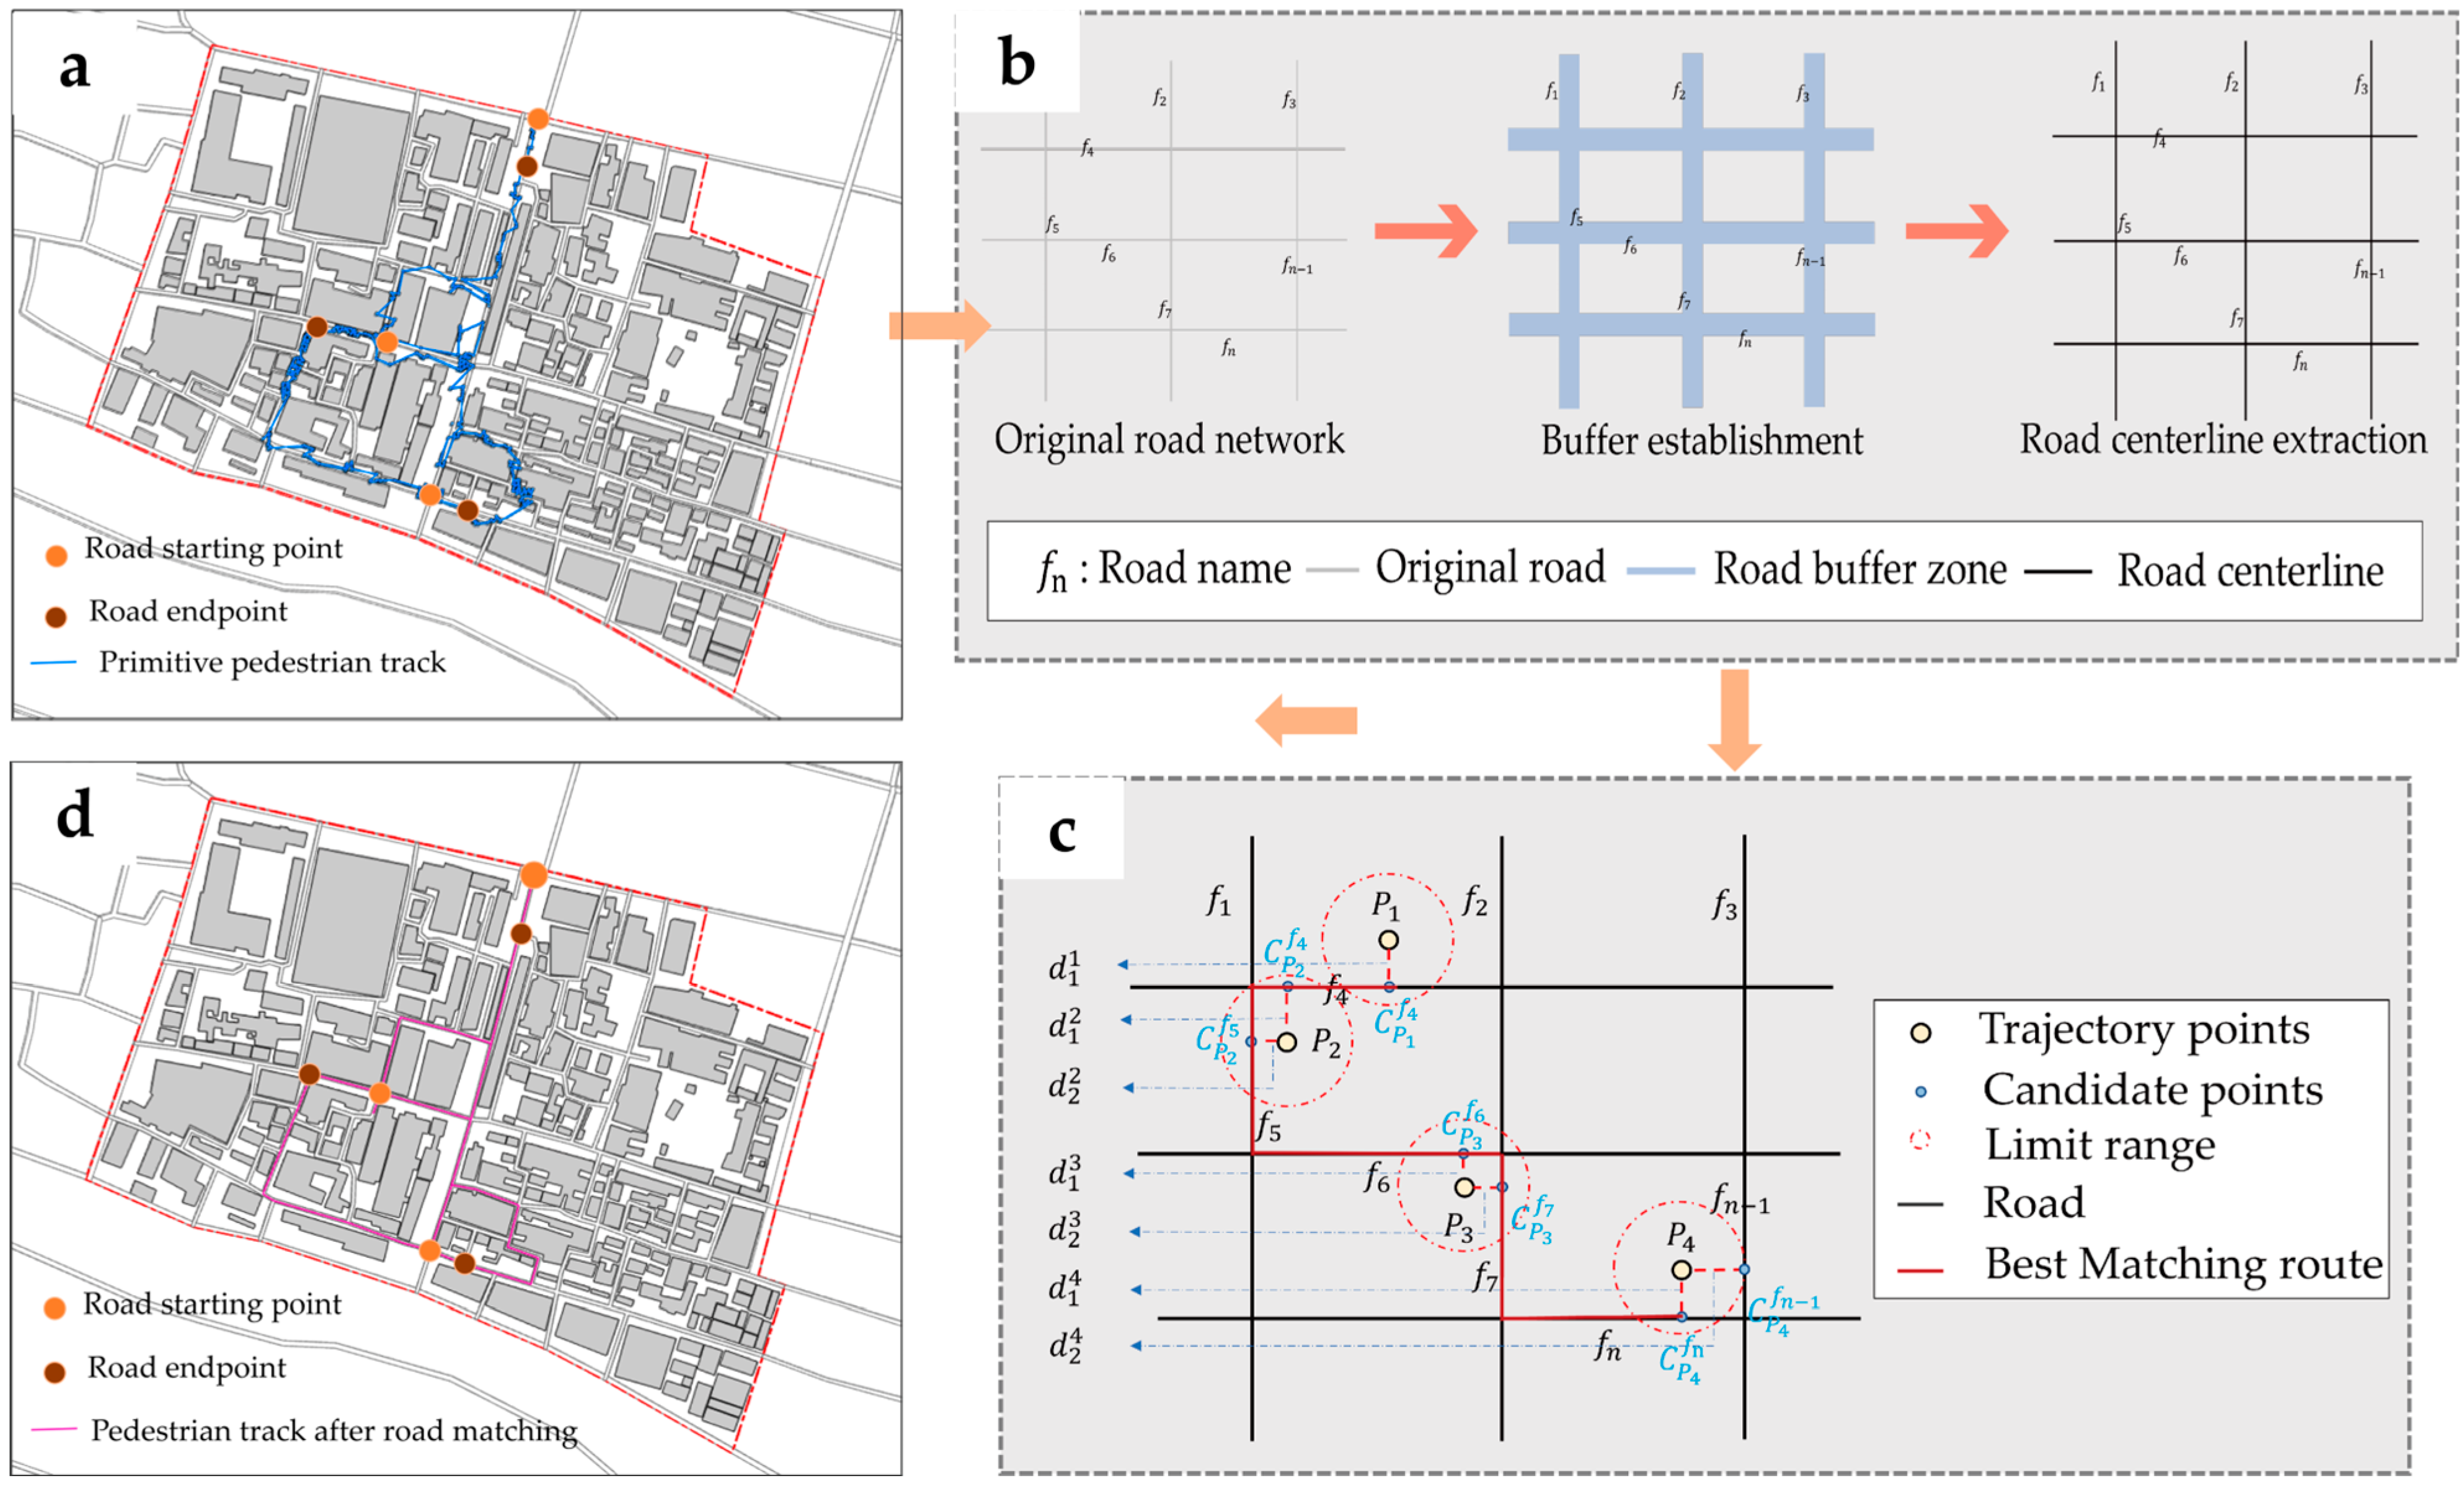
The second step is to perform road network matching to simplify the travel trajectory of the crowd and improve the accuracy of trajectory clustering (Figure 6). Before road matching, we must first determine the road network to be matched; therefore, we drew the road’s centerline based on the original road network of Lao Men Dong Commercial Street and generated the information topology table for each road (Table 2). Second, we used multi-criteria dynamic programming map-matching (MDP-MM) [80] for the crowd trajectory matching of road networks. The MDP-MM algorithm can reduce the number of candidate paths corresponding to each trajectory point, further match the optimal path of the crowd trajectory, and ensure the accuracy of road network matching when computational complexity is reduced. Finally, we selected spatial proximity (h( r x , 1 i )) to judge the best matching path, as spatial proximity is considered to be an effective route evaluation criterion [81], and we compared each candidate path by calculating the sum of Euclidean distances between different trajectory points and each candidate point, as shown in Formula (1). When the value of spatial proximity is at the minimum, the matched path is the optimal matching path of the trajectory, and the candidate point is the best candidate point. As shown in Figure 6c, since the value of d 1 1 + d 2 2 + d 2 3 + d 1 4 is at the minimum, the red trajectory line is the optimal path for trajectory point matching.
h ( r x , 1 i ) = p i d x i
In Formula (1), i refers to the number of trajectory points in the personal trajectory path; x refers to the serial number of the candidate point, with a value of 1 or 2; p i refers to the trajectory point; and d x i refers to the number of points from the trajectory point to its candidate straight-line distance between points.
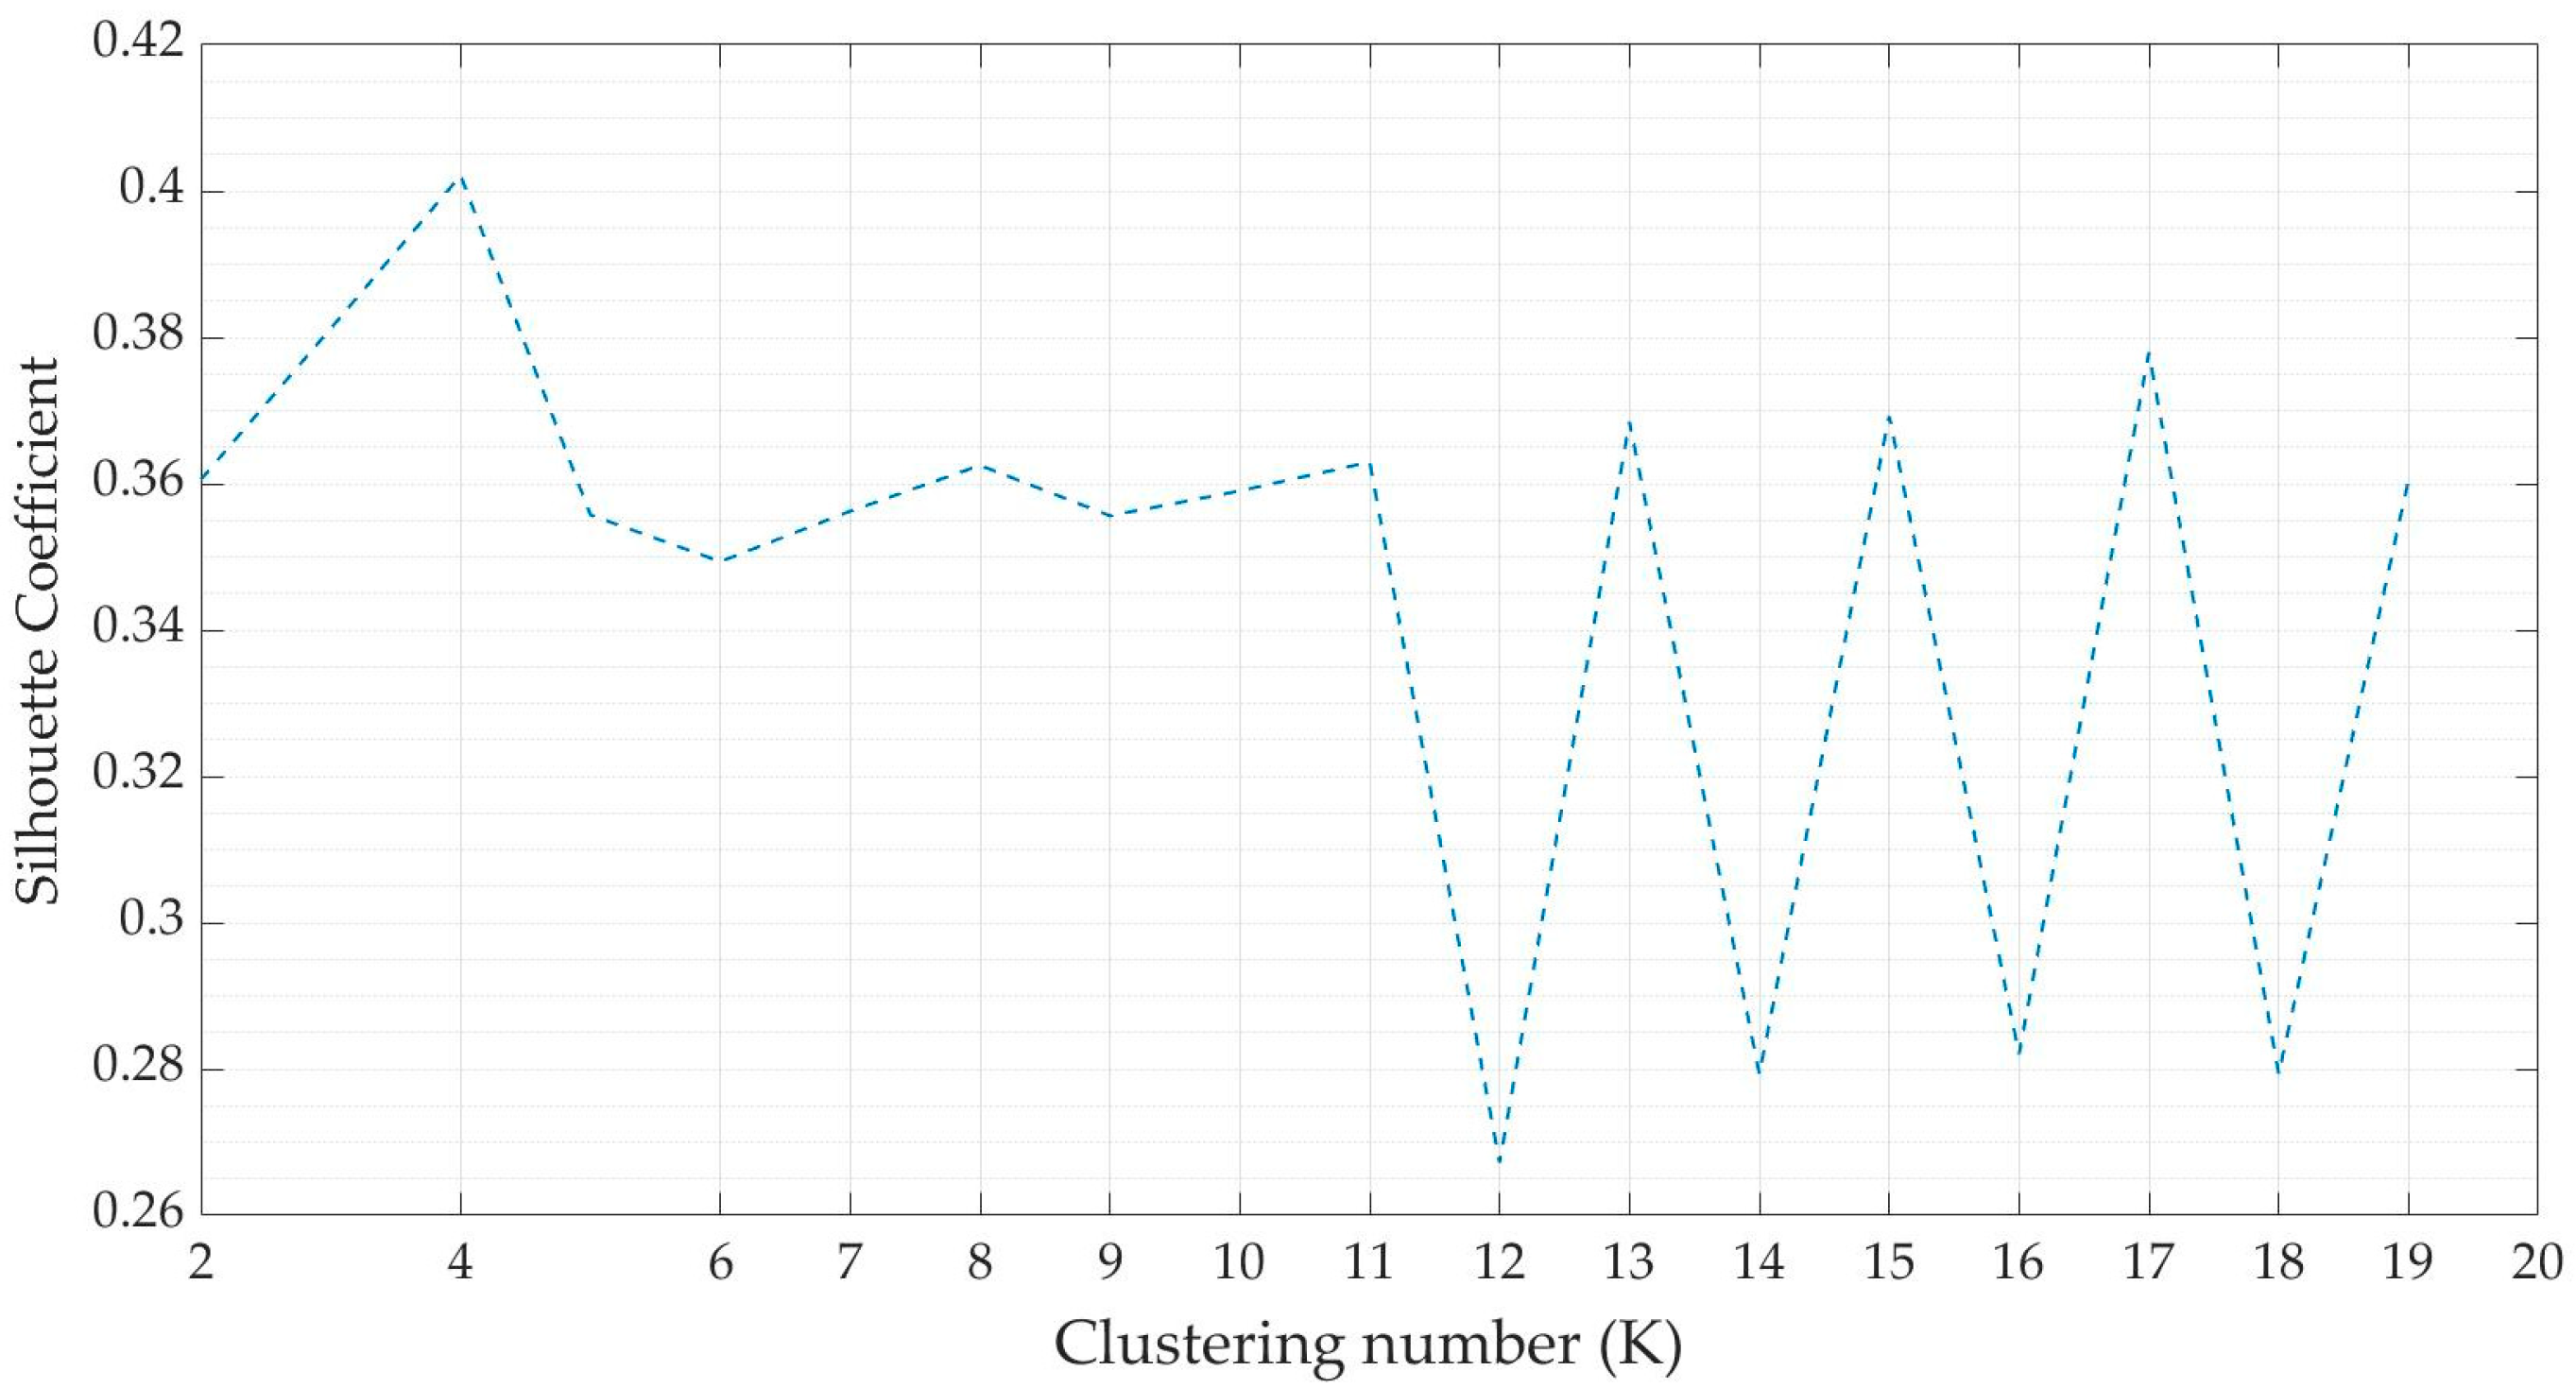
The third step involves clustering analysis of crowd trajectories to obtain the spatial activity characteristics of crowd dynamic continuity. We used CAE to perform cluster analysis on crowd trajectories. CAE can overcome the noise that appears in trajectory line clustering, extract the features of trajectory images, and generate eigenvector values, which can replace images for cluster analysis, thus fully meeting the needs of subsequent clustering algorithms, and it has a high accuracy for image clustering [82]. First, we constructed the structure of CAE by setting various parameters (Figure 7), input the collected 14,257 trajectory image data into CAE as a training data set, and generated the corresponding output image. During training, the weights of the neural network were adjusted to reduce the error between the input image and the output image, and they were evaluated based on the loss value to ensure that the input image maintains a high degree of similarity with its output image after training. After gradually extracting the features of the trajectory image data, we calculated the feature vector values and determined the crowd trajectory clusters by introducing the K-means clustering algorithm and silhouette coefficients. As shown in Figure 8, when K = 4, the silhouette coefficient reached its highest value, indicating a better clustering effect. Therefore, there are four main types of trajectory clusters in the crowd trajectory on the Lao Men Dong Commercial Street. Finally, the different trajectory clusters were visualized using ArcGIS 10.2 software.

3.3.3. Variable Selection and Statistical Analysis

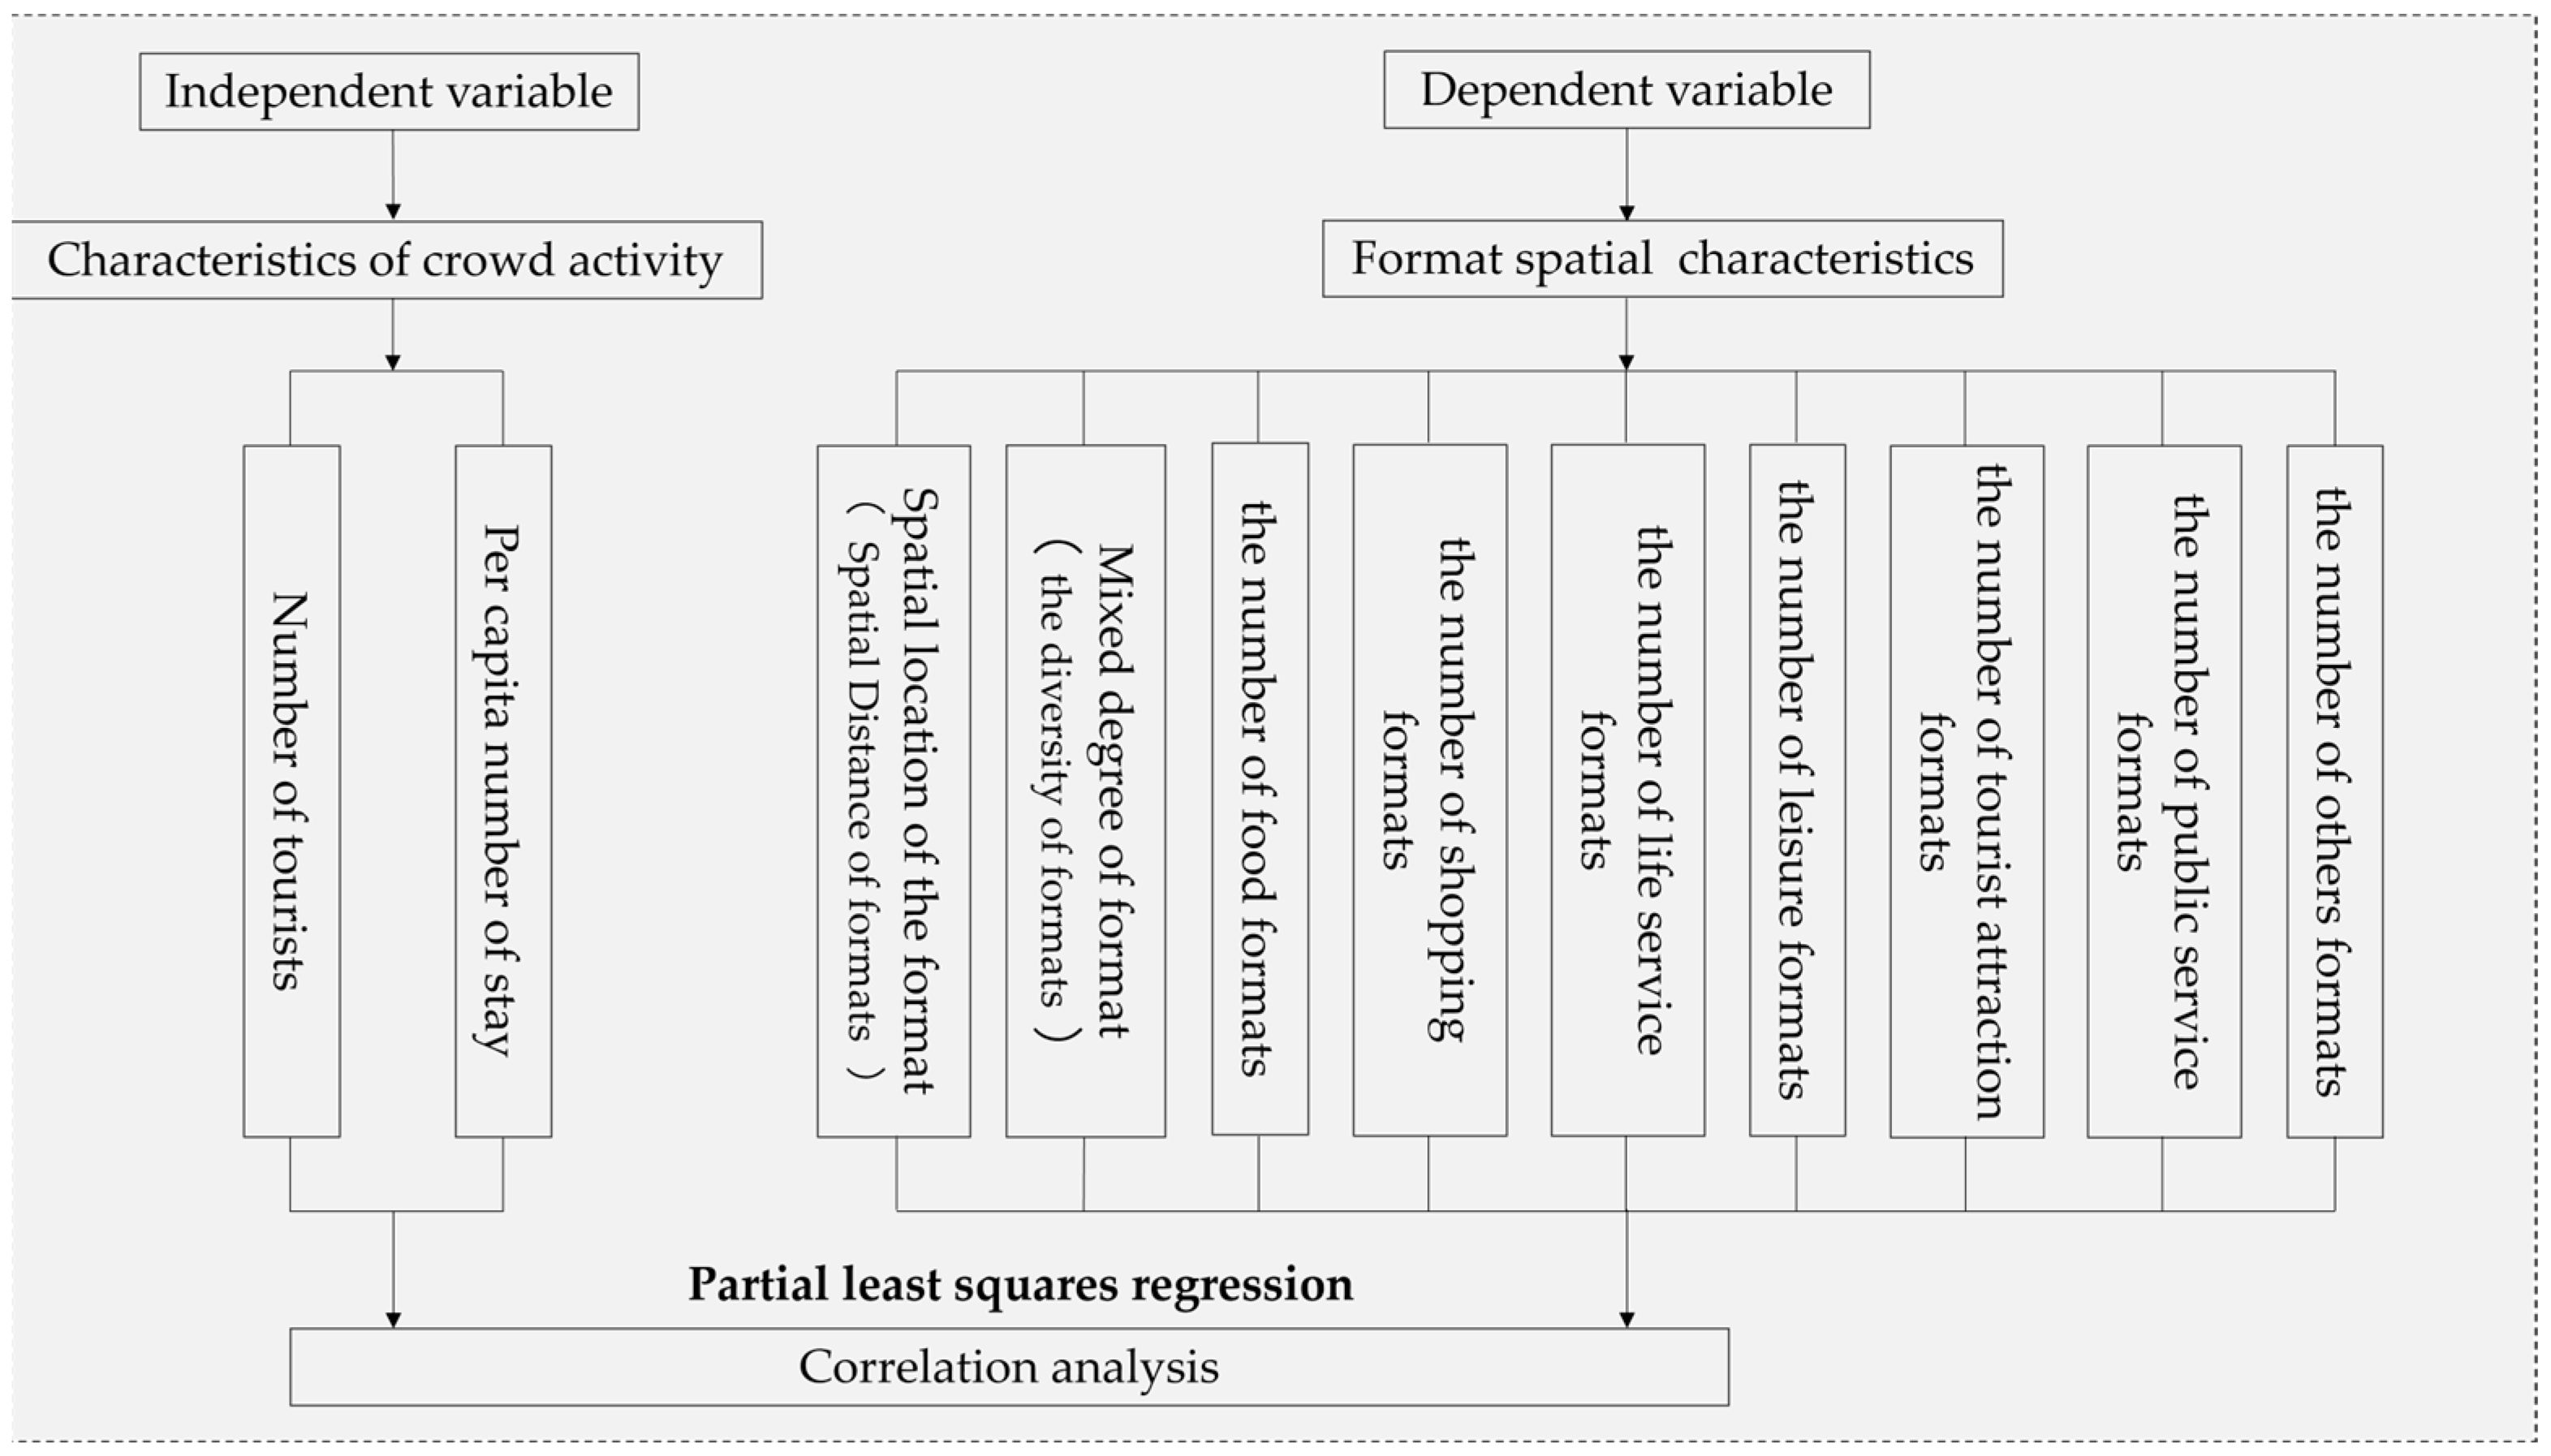
Sorting out all the types of variables was the most critical part of the analysis (Table 3). First, we established a 10 m buffer zone for each type of crowd trajectory cluster to determine the range of crowd activities and used it as an analysis unit. Then, we set crowd activity as the dependent variable of the correlation study and selected the number of people in different analysis units and the number of stays per capita to represent the characteristics of the crowd trajectory and the characteristics of the crowd stay for the correlation analysis.
As the primary independent variable in the correlation study, we explained the impact of formats on crowd activities from three aspects: spatial location, formats intensity, and formats mix, and we quantified these three aspects using the spatial distance, quantity, and diversity of formats. Among them, we further calculated the number of various types of format types in Lao Men Dong Commercial Street according to the classification standards of format types in Table 1. In addition, in order to quantify the degree of diversification of commercial street formats, this study used the entropy index to calculate (Formula (2)), and the range of diversity values was from 0 to 1. The greater the entropy, the higher the degree of diversity of formats. It is worth emphasizing that the formats in the independent variable refer to the formats visited according to the scope of the stay area under the analysis unit, rather than all formats within the analysis unit.
D i v e r s i t y = i = 1 i = n p i × ln p i ln n
In Formula (2), “ p i ” refers to the proportion of the i-th type of format in the total number of formats, and “n” refers to the number of categories in the formats.
To further explore the relationship between commercial street formats and crowd activity characteristics, we used the partial least squares regression (PLSR) analysis method to link crowd spatial activity characteristics with formats (Figure 9). Considering that this study analyzed the activity characteristics of the crowd from the perspective of people’s stay or movement in the space, correlation analysis was conducted with various variables of the formats. Analysis methods such as Generalized additive models [84] and gray dynamic double excitation analysis [85,86] can handle the correlation analysis of the impact of multiple independent variables on a single dependent variable in the regression model, but they cannot solve the limitation of the number of dependent variables. However, PLSR (Formula (3)) is a many-to-many multiple regression modeling analysis method suitable for measuring the degree of association between variables at different scales [87]. For the situation where two dependent variables are selected for modeling in this study, PLSR can effectively handle the complex relationship between multiple variables in the dependent and independent variables and conduct regression modeling. It can also conduct more in-depth analysis of the correlation and ensure that the analysis results are more reasonable, which is one of the effective methods to test whether the causal relationship is significant [88].
Y j * ^ = a j 1 X 1 * + a j 2 X 2 * + a j 3 X 3 * + + a j m X m * j = 1,2 , p
In Formula (3), j is the number of dependent variables (Y), m is the number of independent variables (X), X 1 * and Y j * refer to the standardized variables of the independent variable (X) and the dependent variable (Y), respectively, and Y j * ^ refers to the p standardized dependent variables.
In order to test the explanatory effect of the independent variables on the dependent variable in the PLSR model, we used the variable importance in projection (VIP) criterion to reflect the importance of the independent variables to the PLSR model through the VIP value and show the degree of fit of the variables to the model. When the number of principal components is different, the importance of the independent variable in explaining the dependent variable is reduced. When the VIP value is larger, the independent variable plays a more important role in explaining the dependent variable. In Formula (4), p is the number of independent variables; m is the number of components extracted by PLS from the original variables; t h represents the h-th component; R(Y, t h ) represents the explanatory ability of component t h on the dependent variable Y, which is the square of the correlation coefficient between the two; w h j is the jth component of axis w h , and w h is the eigenvector of matrix X h 1 T Y h 1 Y h 1 T X h 1 .
V I P j = p h = 1 m R ( Y , t h ) w h j 2 / h = 1 m R ( Y , t h )

4. Results

4.1. Characteristics of Crowd Activities

4.1.1. Spatiotemporal Characteristics of Crowd Stay Activities

To gain a more intuitive understanding of the characteristics of people’s stay activities on the commercial street, we identified and extracted 76,430 stay points; that is, people in the commercial street had a total of 76,430 stay activities during the research period. We analyzed the stay characteristics of the crowd in the commercial street from the perspective of time and space. This information reflects the space usage of the commercial street and the behavioral preferences of the crowd, and it shows the characteristics of the formats in the places where the crowd frequently stays, that is, spaces with high-intensity attractiveness.
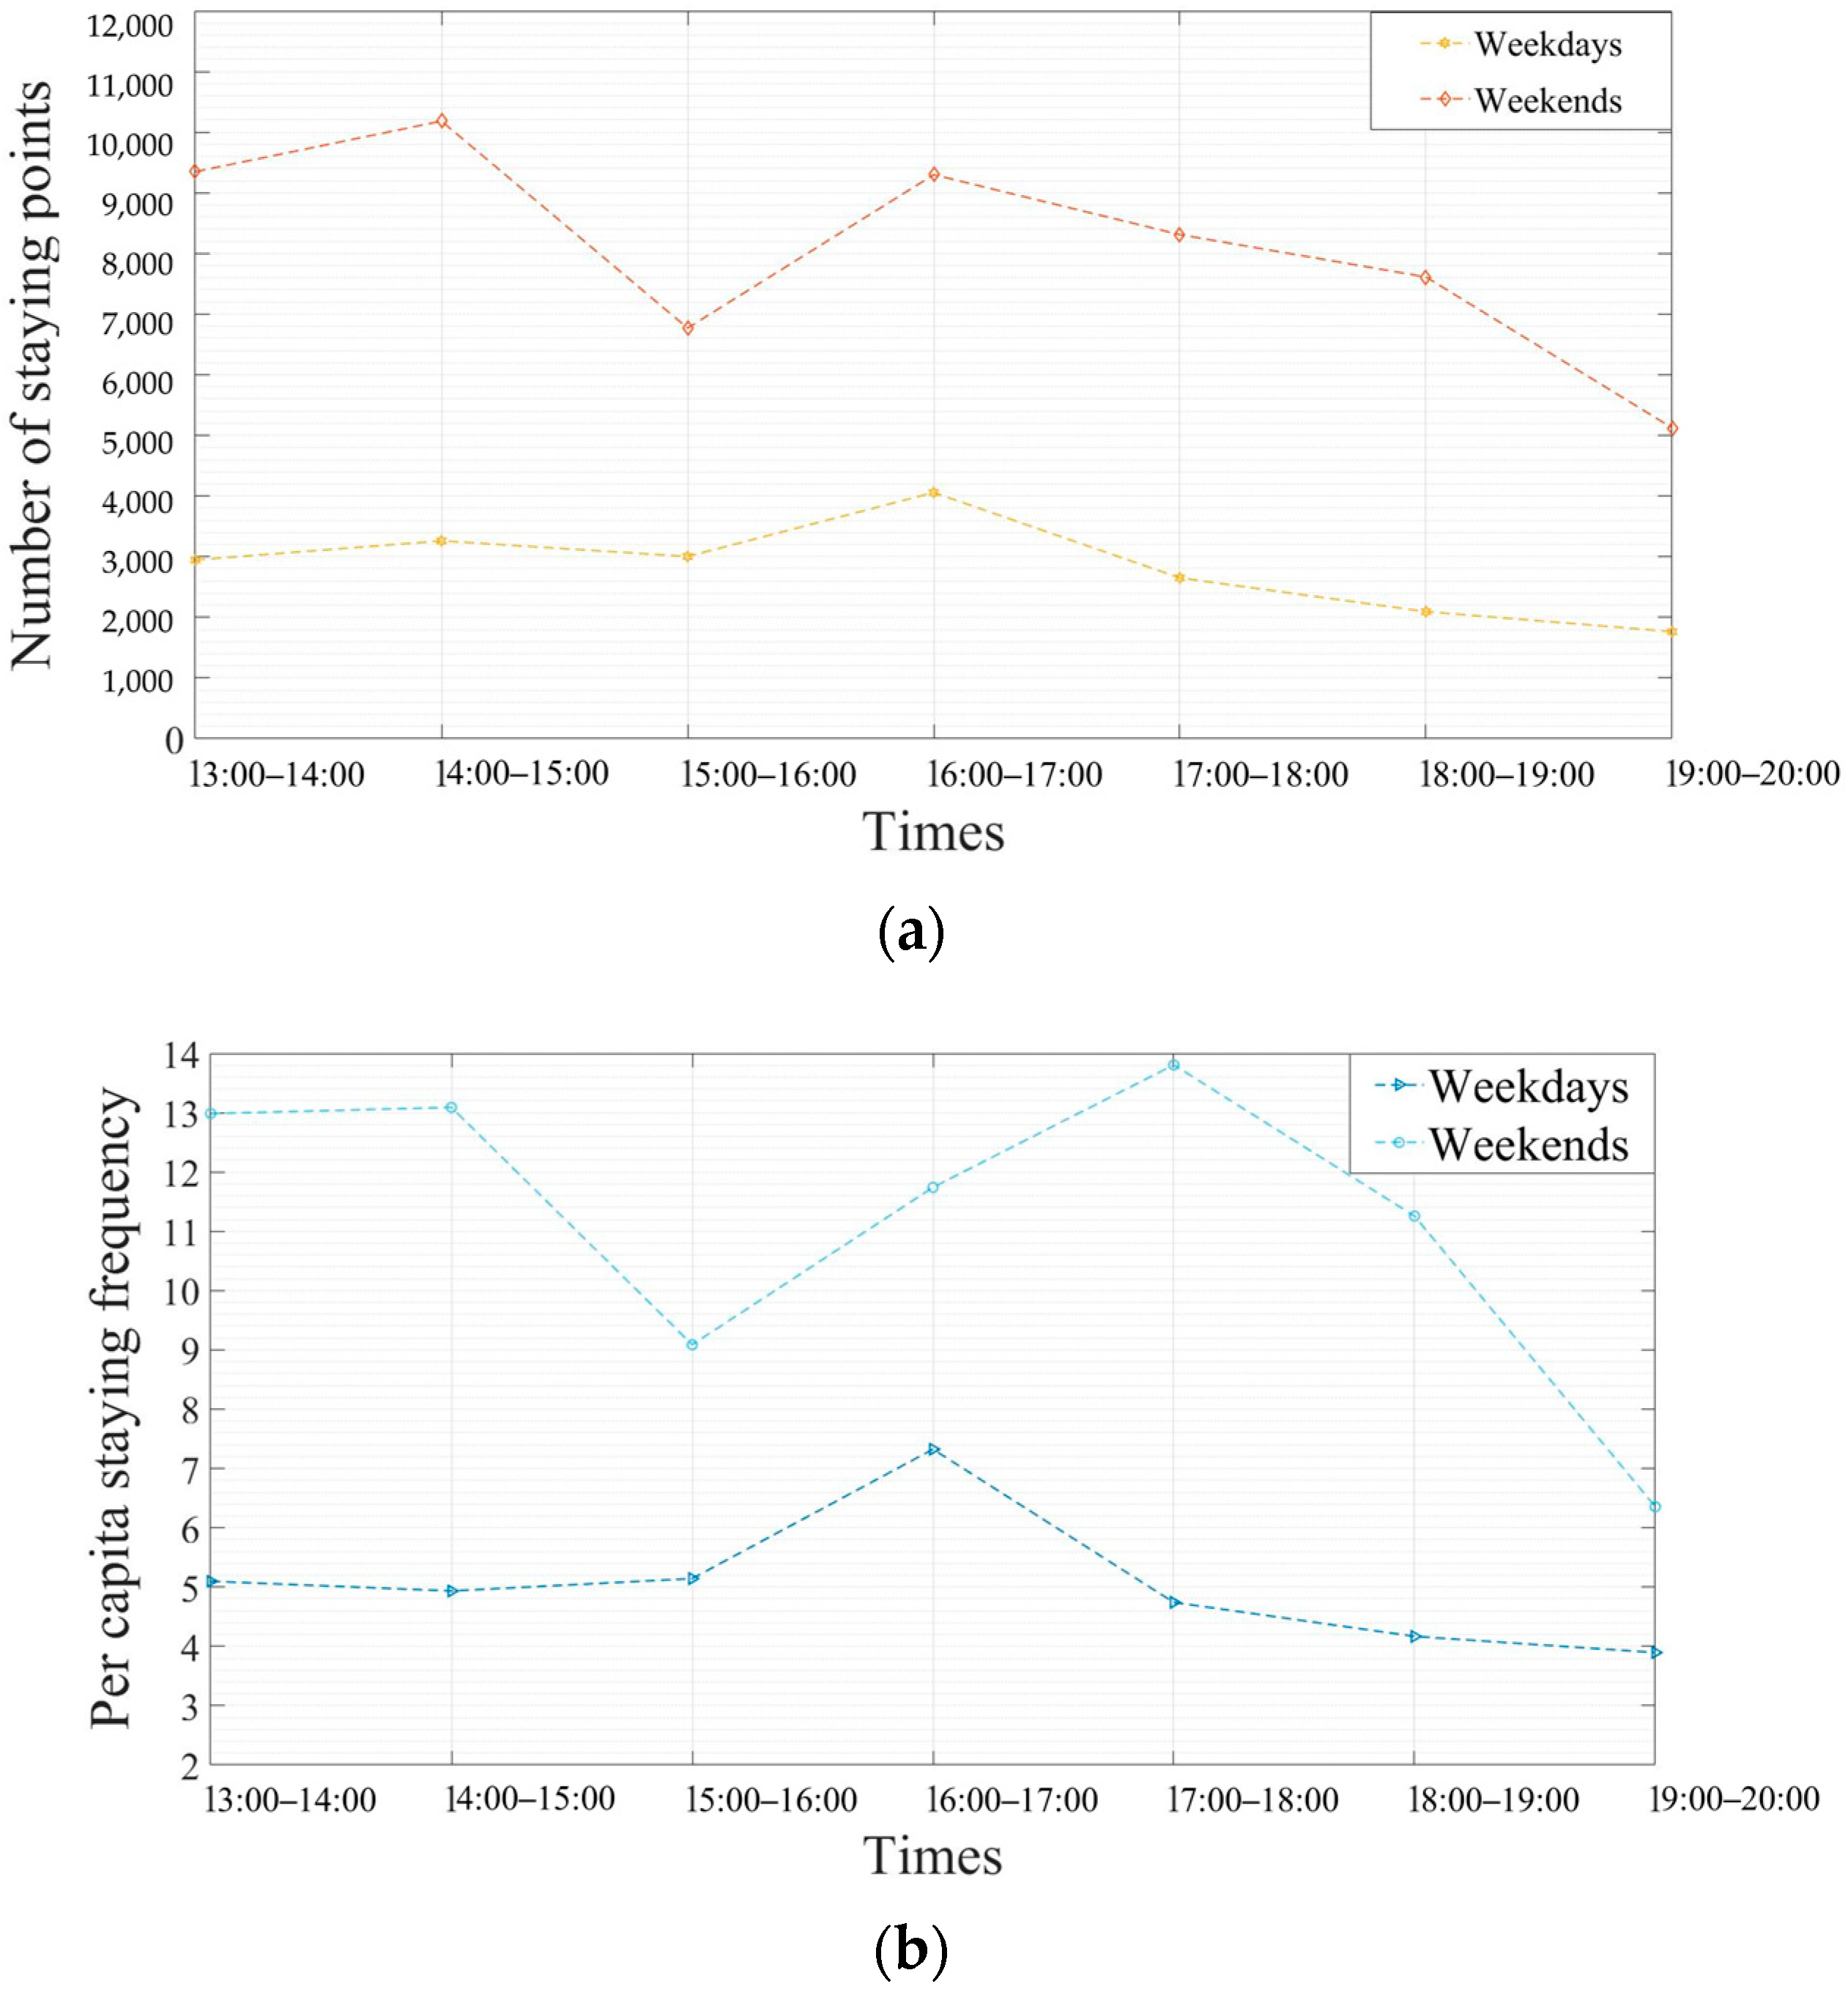
In the temporal dimension, crowd stay activities in Lao Men Dong Commercial Street exhibited a certain degree of regularity. Figure 10 is a line chart of the stay time of people on the commercial street, showing the frequency and number of stays per capita during different time periods on weekdays and weekends. Although the hourly frequency of crowd stays and the number of stays per person during weekends were much higher than those on weekdays, both exhibited a similar trend of change. Crowd stay activities increased from 13:00 to 15:00, and both the frequency of stay and number of stays per capita peaked. Subsequently, people gradually carried out walking activities, such as sightseeing and play, and the stay activities of the crowds gradually decreased. As people began to eat, rest, and engage in other activities on the commercial street, the frequency of crowd stays after 17:00 appeared as a short-term peak period. With the end of the series of activities, people gradually left the commercial street, and the frequency of stays decreased. However, the average number of stays per person on weekends peaked at 18, mainly because people have more free and flexible time on weekends and are more willing to sit for entertainment, games, and other activities.
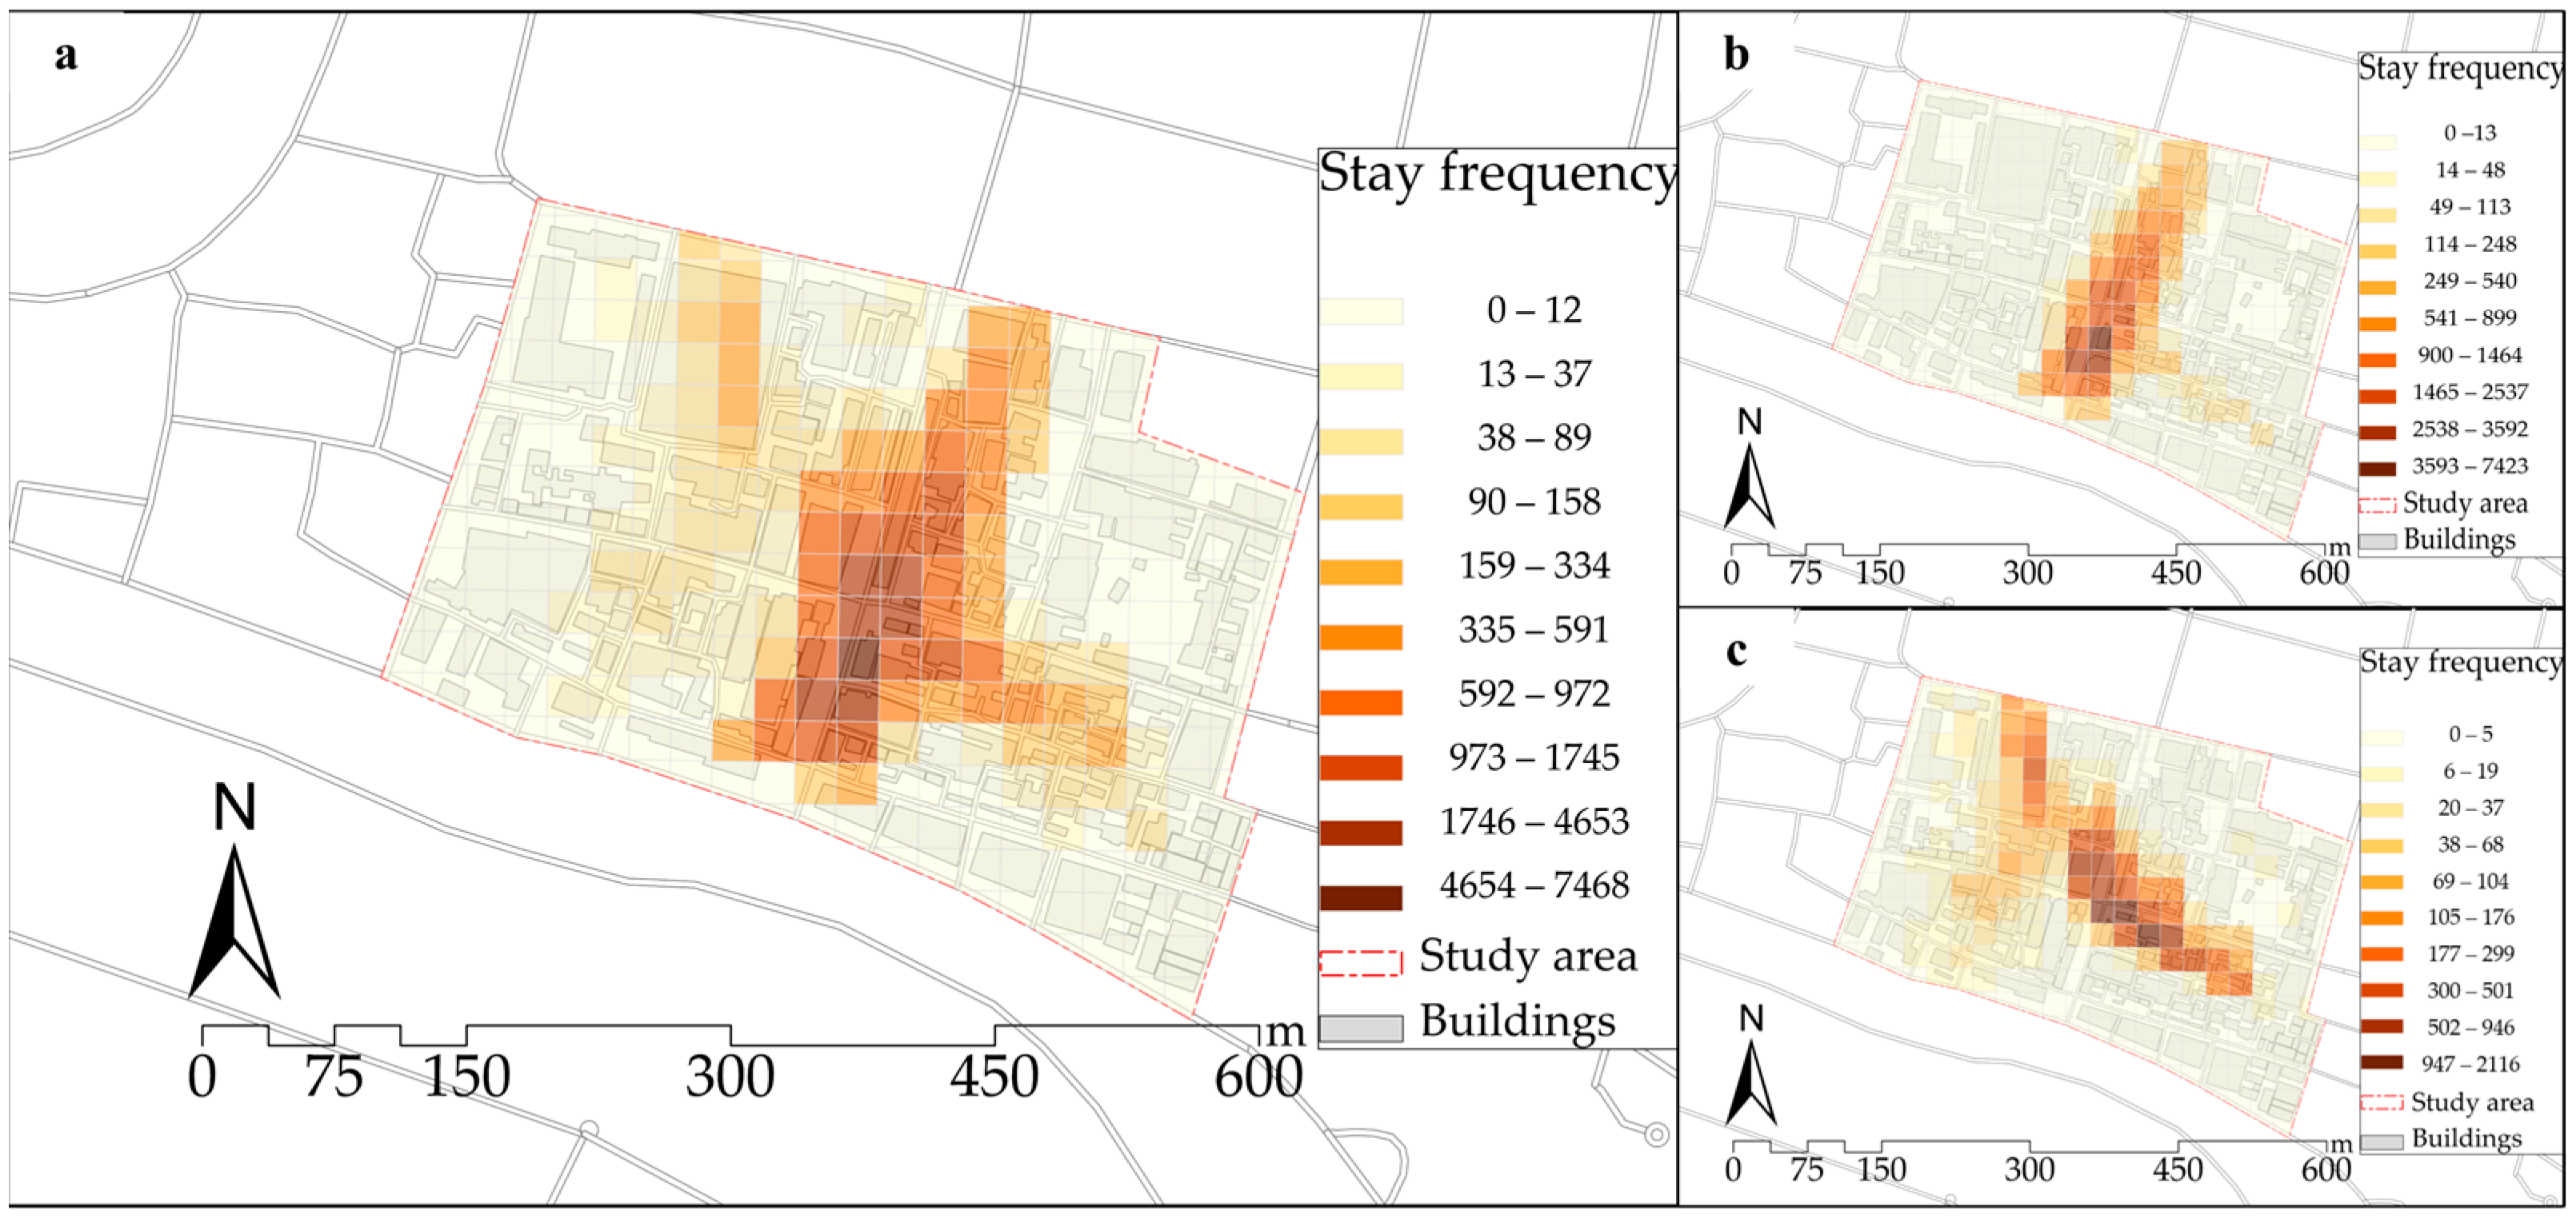
From the perspective of spatial distribution, the spatial stay activities of the crowd showed clear differences during different periods (Figure 11). Figure 11a shows that the distribution of the overall spatial stay activities of the crowd was relatively scattered, and different degrees of stay activities occurred in different regions. The intensity of crowd stay in the central axis of the commercial street was relatively frequent, and the activity intensity at the central point was the highest. Because this space is mainly for catering and leisure, the crowd was characterized by commercial stops, rest, and other activities when using the space. However, the intensity of stays in the outer areas of the commercial street was relatively low. As there were fewer types of formats in these places, mainly life-related formats, the crowd mainly engaged in activities such as social watching and sightseeing and seldom stayed.
Figure 11b,c show the distribution of the crowd space stay activities on weekdays and weekends. The intensity of the crowd space stay on weekends was much higher than that on weekdays, showing different characteristics of space stays. During weekends, crowd activities were relatively concentrated, mainly in the central places of the commercial street. Not only because there were enough leisure facilities and a good sightseeing experience in the central places, but also because the formats in the central places were more popular, people were willing to spend enough time to stop and enjoy the commercial street. During weekdays, the activities of crowds were relatively scattered, and people tended to stay in the east–west axis places and the northwest area of the commercial street; the types of formats in these places were mainly retail and cultural facilities. Relatively low dwell intensities are shown in other regions.

4.1.2. The Characteristics of the Crowd Spatial Trajectories

To explore dynamic information such as crowd spatial movement characteristics and flow trends, we collected crowd trajectory data and calculated crowd trajectory clusters. Crowd trajectory clustering refers to the similarity clustering of people’s moving trajectory routes within a certain space. Because of the differences in the content of space use and purpose of activity among the crowds, four types of moving trajectory clusters were observed in the commercial street; combined with the crowd staying activities, we summarized the typical crowd spatial trajectory characteristics (Figure 12).
This study found that 76.31% of crowd trajectories showed certain regularities, whereas 23.69% of crowd trajectories showed irregularities. Because this section mainly examines the cluster characteristics of crowd trajectories on the commercial street, irregular crowd trajectories are not discussed for the time being.
Figure 12 shows the four types of crowd trajectory clusters mined based on trajectory clustering. Comparing the four types of trajectory clusters, each cluster has significantly different crowd trajectory characteristics.
(1)
Crowd trajectory cluster 1 (Figure 12a), accounting for 40.49% of the total number of active people, is mainly distributed in the central and eastern areas of the commercial street, which is dominated by catering and retail formats. This feature has strong spatial mobility, and people mainly carry out activities such as sightseeing and consumption and have short stays in spaces such as retail and recreational facilities.
(2)
Crowd-tracking cluster 2 (Figure 12b) is mainly concentrated in the middle of the commercial street, where the formats are mainly retail and leisure. The spatial mobility of the crowd under this characteristic is weak; crowds often stop and stay for a long time in leisure, entertainment, and other formats. The stay activities of the crowd are relatively concentrated, accounting for 18.48% of the total number of active people.
(3)
Trajectory cluster 3 (Figure 12c) is mainly concentrated in the central and southern parts of the commercial street, which is dominated by catering and entertainment formats. Under these conditions, the spatial mobility of a crowd is strong. Although the crowd stays more frequently, they mainly conduct short-stay activities such as watching and resting, and the number of active people accounts for 13.54% of the total number of active people.
(4)
In contrast, the number of people in trajectory cluster 4 (Figure 12d) is relatively small at only 3.8%. They are mainly active in the northwest and southeast places of the commercial street, which is dominated by cultural and leisure industries. The spatial flow of crowds is weak, and people mainly carry out short-stay activities such as sightseeing and eating.
In this study, through a cluster analysis of crowds’ moving trajectory combined with the characteristics of the crowds’ stay spaces, the characteristics of the crowds’ spatial trajectory are summarized. The four different trajectory clusters exhibit different characteristics of crowd spatial activity: trajectory clusters 1 and 2 are the main spatial patterns of crowd activity, trajectory cluster 3 has strong spatial mobility, and trajectory cluster 4 has the lowest level of spatial activity. At the same time, these four different trajectory clusters all indicate that people are willing to enter or leave Lao Men Dong Commercial Street from the entrance and exit due north. This is because this entrance is an important landscape symbol of Lao Men Dong Commercial Street, and people like to pass by it and take photos to commemorate it. Although the other two entrances and exits are officially designated entrances and exits, due to the small number of surrounding formats, the traffic frequency is relatively low.

4.2. The Relationship between Commercial Street Formats and Crowd Activity Characteristics

Based on the regression analysis model established in Section 3.3.3, analysis results are shown in Table 4. The spatial distance and mix of formats have a negative impact on crowd activity. Although they both have a certain positive effect on crowd stay activity, the impact is small, and the correlation coefficients are only 0.01 and 0.05. This shows that people’s choice of formats in commercial streets is relatively clear, and they mainly choose to go to catering and retail format spaces for stay activities. At the same time, as the spatial distance between formats increases, the time and labor costs for people to obtain format information becomes higher, resulting in people being unwilling to travel to and stay in distant format areas. In addition, the number of different types of format has different effects on crowd activities. Food, shopping, tourist attraction, and public service facilities have a significant positive effect on crowd activities, and people are more willing to stay in these four types of format. These four categories are the main format types that perform entertainment functions in commercial streets, so this result was also expected before the study. The life service format has a certain positive effect on the number of people. People mainly wait and look around in this space, but they are not willing to stay here; on the contrary, leisure formats and other types of formats have a positive impact on people’s stay activities. Since leisure formats have longer usage time costs, they are prone to generating more business stopover behaviors. However, there are many foreign tourists in Lao Men Dong Commercial Street, and they do not have enough time cost to use the space, resulting in a weak negative effect on the format and the number of people. In addition, according to the VIP value, it was found that in the PLSR model, shopping formats, life service formats, and public service facility formats have a greater role in explaining changes in the number of people and the number of stays per capita, and the VIP values of other variables play an important role in explaining the dependent variable in the regression model.

5. Discussion

5.1. Research Findings

In this paper, we propose a new crowd activity analysis framework based on the quantitative measurement of crowd trajectory data and commercial street formats. We analyze crowd activities based on crowd stay patterns and moving trajectory clusters. Finally, we establish a regression model to determine the quantitative relationship between crowd activity characteristics and commercial formats characteristics on the Lao Men Dong Commercial Street.
The main contributions of this paper are as follows:
(1)
A new framework for crowd activity analysis was proposed. Compared with traditional research methods, the framework can improve the efficiency and accuracy of data analysis, and it uses machine learning algorithms such as supervised learning algorithms and convolutional autoencoders to extract crowd-dynamic spatial activity information. Although research on machine learning algorithms for studying crowd activities has made some progress, S. Williams et al. used image processing technology to conduct quantitative statistics of location information in time and space dimensions and qualitative discussions of human activities [41]. However, it is not comprehensive to only rely on location information to measure crowd activities. Y. Li et al. used deep learning methods to explore the relationship between a street’s built environment and the street vitality but ignored the details of crowd activities [33]. Therefore, we used stay points to identify people’s stay or movement behavior in space to obtain the activity status of the crowd, and we explore the influencing factors of crowd activities in combination with the space environment they live in. Furthermore, this method can help us understand the flow trend of people in space by studying the crowd’s activity trajectory clusters, which can provide guidance for the spatial layout of commercial streets. This method is not only limited to commercial streets; it is also helpful for us to conduct correlational analysis of crowd activities in different spatial environments, such as parks, central areas, cities, and other spatial scales, making it easier to obtain the characteristics of crowd activities at different spatial scales.
(2)
We extracted the visited formats in a commercial street according to the stay areas under different trajectory clusters and analyzed the correlation between the characteristics of crowd activities and formats under different spatial activity ranges. Based on a subjective perspective of people’s preferences for formats, we explored the reasons why people chose commercial formats. Previous studies tended to discuss all commercial formats within the scope of the research [89,90], that is, they tended to include all business formats within the scope of research into the scope of discussion and used the business formats in the research area as part of the spatial environment to study the connection between people and space. However, we focused on commercial formats visited on a commercial street, which is more targeted and reflects the real needs and behavioral preferences of people on the street.
(3)
The proposed crowd analysis framework was applied to a commercial street. The results show that our method can accurately characterize the spatiotemporal characteristics of crowd activity on commercial streets, and understanding the stay rules of crowds can inspire retailers and provide certain suggestions for the spatial layout of business formats. Therefore, this method is effective and contributes significantly to enhancing the competitiveness of commercial streets. In addition, Lao Men Dong is a typical representative of small-scale, low-rise commercial streets with rich format types, diverse functions, and frequent crowd activities. Since this type of commercial street emphasizes pedestrian orientation, in order to ensure the safety and comfort of crowd activities, any destination in most commercial streets should be limited to 800 m, and the total walking distance should not exceed 1500 m [91]. The area of Lao Men Dong Commercial Street is 700,000 square meters. Its spatial scope exceeds the spatial scale of most low-rise commercial streets, and it has strong universal applicability. Therefore, revealing the degree of correlation between format space and crowd activities in Lao Men Dong Commercial Street can also provide insights into the sustainable development of commercial streets of the same scale.
At the same time, by analyzing the characteristics of crowd activities in commercial streets, this study mainly obtains three findings. The results show that the intensity of stay activity on weekends is much higher than that on weekdays. On weekends, the concentration of stay activity is higher, and people are more willing to stay in catering, leisure, and other spaces. On weekdays, the stay activities are more scattered, and people mainly stay in retail, cultural, and entertainment spaces. However, the time trends of the two stay frequencies present a similar curve, and people’s stay activities mainly occur at 15:00 and 17:00. This finding can be expected in the early stages of research, so that crowd stay activity on the commercial street was predictable.
Second, by observing 14,257 trajectory image datapoints collected on Lao Men Dong Commercial Street, the study extracted four crowd activity trajectory clusters on the commercial street. According to the frequency of activity trajectories, trajectory cluster 1 is the main spatial activity mode of people, and the spatial mobility of the crowd is strong, indicating that the central places of the commercial street are more attractive to people, and that they are more willing to stay in the spaces of catering and retail industries.
Finally, we found that various variables of formats provide independent explanations of crowd activity. The mix of formats is negatively correlated with crowd activity. This is contrary to previous research results [33]. Different research perspectives may lead to varying results. The research in this paper is based on a correlation analysis between people and the formats mix from the perspective of consumers. The relationship between the two was analyzed based on the perspective of the space environment, indicating that a space with a higher diversity of formats can give people more choices of formats [35,92]. However, people will choose to go to places with higher diversity but do not necessarily choose multiple types of formats for stay activities. Therefore, although the conclusions of the two aspects differ, they do not conflict. Meanwhile, the spatial location of the formats has a negative effect on crowd activity. The increase in spatial distance not only leads to more time and energy costs for tourists but also makes it increasingly difficult for tourists to obtain information about formats. In addition, different types of formats have different impacts on crowd activities, and people are more willing to go to food, shopping, tourist attraction, and public service formats to stay and carry out a series of activities.

5.2. Limitations

This study has some limitations. First, since the purpose of this study was to propose a framework for analyzing crowd activities and to verify the method using commercial street formats, we ignored the impact of other characteristics of the commercial street on the crowd activity (such as transparency and green viewing rate). Future studies should explore the impact of other aspects of commercial streets on crowds.
Second, because of the performance limitations of the equipment, the time selected for collecting crowd data could only be during the time period with high traffic in commercial streets (13:00–20:00), and it is impossible to collect data for the entire day, which may lead to a failure to observe crowd stay activity rules at other times. Moreover, the data used in this study were obtained in a relatively short period of time in the winter of 2022. Nanjing belongs to the humid northern subtropical climate zone. The average temperature during the selected survey time was maintained at about 11 degrees Celsius, which would have had little impact on crowd activities. Although the data set is sufficient to develop and test the method proposed in this study, further investigation and analysis are needed for the study of temperature extremes in other seasons. We are currently collecting data for other seasons and hope to address this limitation in the future.
Third, this study did not consider the preferences and needs of individual tourists regarding commercial formats. The crowd trajectory clusters obtained in this study had similar trajectory paths for most people; however, some special crowd trajectories still exist. These trajectories make it difficult to summarize the common spatial characteristics and have little influence on the results of this study. Therefore, this study did not take into account the interaction between these special trajectories and format spaces; however, the layout of commercial formats in a commercial street should not only con-sider the space needs of most groups but also meet the real needs of individual tourists. Therefore, the next step in this research is to consider special crowd trajectories in the discussion category related to crowd activities and formats.
Fourth, we were unable to handle some special data. During the data collection period, we observed that occasional tourist groups on the commercial street engaged in sightseeing and play overseen by tour guides. Their behavior and activities on the commercial street and their demand for commercial spaces were not spontaneous. Therefore, deleting the corresponding data should be considered before the subsequent analysis. However, owing to the limitations of the data attributes of Wi-Fi probes, we are currently unable to observe and process the corresponding data from massive crowd trajectories.

6. Conclusions

Abandoning being oriented toward commercial interests [93] and re-examining people’s space needs as a development guide for commercial streets can promote social cohesion and drive the attractiveness of commercial streets [94]. Therefore, we propose a research framework to study the characteristics of crowd activities and to quantify the relationship between crowd activities and the spatial characteristics of commercial street formats, and we applied it to Lao Men Dong Commercial Street to verify the feasibility of the method. This method can be applied to the study of spatial crowd activities at different scales, and it supplements the method of studying the characteristics of crowd activities.
In the case study of Lao Men Dong Commercial Street, we identified the state of people moving or staying in the space and understood the rules of the time and space coverage of the crowd: during the period between 15:00 and 17:00, the crowd stay behavior in the commercial street is more frequent. On weekends, people are more willing to stay in catering and leisure functions and carry out corresponding activities, while during weekdays, people mainly stay in retail and cultural and entertainment functions. The intensity of the formats has a positive effect on the stay activities of the crowd, but the spatial location and mixing degree of the formats have little effect on the stay activities. The crowd activity trajectories in Lao Men Dong Commercial Street mainly show four patterns (Figure 12), among which the spatial mobility of trajectory cluster 1 is the strongest. The spatial location and mixing degree of the formats have little influence on the choice of crowd activities, and different types of formats have different impacts on crowd activities. In addition, the spatial distance and mix of format have a small impact on crowd activities, but they have a certain positive effect on people’s stay activities. The intensity of different types of format also has different effects on people’s stay activities. People are more willing to engage in activities in food formats, shopping formats, tourist attractions formats, and public service facility formats and perform corresponding stay behaviors. Therefore, during activities in commercial streets, people are more inclined to go to formats that are closer to the entrance and exit and have relatively concentrated format functions.
In summary, this article proves that the proposed crowd analysis framework can effectively analyze the dynamic activity characteristics of crowds in commercial streets, and it proves that people’s activities in time and space are not random but related to specific formats spaces. Applying this method to different spaces can help designers and urban decision-makers understand crowd preferences and spatial needs in a more refined manner so that they can provide certain opinions on urban space planning, facility layout, and other fields based on population needs, thereby achieving the sustainable development of urban spaces.

Author Contributions

Methodology, X.H., Y.R. and Y.T.; Formal analysis, X.H. and Y.R.; Investigation, Y.R.; Resources, Y.R. and Y.S.; Writing—original draft, X.H., Y.R., Y.T. and Y.S.; Visualization, Y.S. All authors have read and agreed to the published version of the manuscript.

Funding

This research was funded by the Priority Academic Program Development of Jiangsu Higher Education Institutions.

Institutional Review Board Statement

Informed consent was obtained from all subjects involved in the study.

Informed Consent Statement

Informed consent was obtained from all subjects involved in the study.

Data Availability Statement

The raw/processed data required to reproduce these findings cannot be shared at this time as the data also forms part of an ongoing study.

Conflicts of Interest

The authors declare no conflict of interest.

References

  1. Ntounis, N.; Saga, R.S.; Warnaby, G.; Loroño-Leturiondo, M.; Parker, C. Reframing high street viability: A review and synthesis in the English context. Cities 2023, 134, 104182. [Google Scholar] [CrossRef]
  2. Maliene, V.; Fowles, S.; Atkinson, I.; Malys, N. A sustainability assessment framework for the high street. Cities 2022, 124, 103571. [Google Scholar] [CrossRef]
  3. Yu, H. Trend Analysis of The Development of Commercial Street In Japan. Jiangsu Commer. Forum 2016, 381, 3–7. [Google Scholar] [CrossRef]
  4. Johnstone, M.-L. The servicescape: The social dimensions of place. J. Mark. Manag. 2012, 28, 1399–1418. [Google Scholar] [CrossRef]
  5. Peters, M.; Muellmann, S.; Christianson, L.; Stalling, I.; Bammann, K.; Drell, C.; Forberger, S. Measuring the association of objective and perceived neighborhood environment with physical activity in older adults: Challenges and implications from a systematic review. Int. J. Health Geogr. 2020, 19, 1–20. [Google Scholar] [CrossRef]
  6. Torrens, P.M. Data science for pedestrian and high street retailing as a framework for advancing urban informatics to individual scales. Urban Inform. 2022, 1, 9. [Google Scholar] [CrossRef]
  7. Wang, Y.; Chau, C.K.; Ng, W.; Leung, T. A review on the effects of physical built environment attributes on enhancing walking and cycling activity levels within residential neighborhoods. Cities 2016, 50, 1–15. [Google Scholar] [CrossRef]
  8. Zhao, P.; Liu, X.; Kwan, M.-P.; Shi, W. Unveiling cabdrivers’ dining behavior patterns for site selection of ‘taxi canteen’using taxi trajectory data. Transp. A Transp. Sci. 2020, 16, 137–160. [Google Scholar]
  9. Shi, Y.; Hu, X.; Yang, H.; Yang, J. Format compositions and spatial distribution characteristics of central districts in megacities: People’s Square and Shanghai’s Lujiazui District. Urban Des. Int. 2019, 24, 260–270. [Google Scholar] [CrossRef]
  10. Zahavi, Y. The UMOT Project; A Report Prepared for the US Department of Transportation, Research and Special Programs Administration, and the Federal Republic of Germany Ministry of Transport; DOT-RSA–DPW-20-79-3; US Department of Transportation: Washington, DC, USA, 1979. [Google Scholar]
  11. Schönfelder, S.; Axhausen, K.W. Activity spaces: Measures of social exclusion? Transp. Policy 2003, 10, 273–286. [Google Scholar] [CrossRef]
  12. Miller, H.J. A measurement theory for time geography. Geogr. Anal. 2005, 37, 17–45. [Google Scholar] [CrossRef]
  13. Dong, Y.-H.; Peng, F.-L.; Guo, T.-F. Quantitative assessment method on urban vitality of metro-led underground space based on multi-source data: A case study of Shanghai Inner Ring area. Tunn. Undergr. Space Technol. 2021, 116, 104108. [Google Scholar] [CrossRef]
  14. Sulis, P.; Manley, E.; Zhong, C.; Batty, M. Using mobility data as proxy for measuring urban vitality. J. Spat. Inf. Sci. 2018, 16, 137–162. [Google Scholar] [CrossRef]
  15. Yue, W.; Chen, Y.; Thy, P.T.M.; Fan, P.; Liu, Y.; Zhang, W. Identifying urban vitality in metropolitan areas of developing countries from a comparative perspective: Ho Chi Minh City versus Shanghai. Sustain. Cities Soc. 2021, 65, 102609. [Google Scholar] [CrossRef]
  16. Zhang, X.; Sun, Y.; Chan, T.O.; Huang, Y.; Zheng, A.; Liu, Z. Exploring impact of surrounding service facilities on urban vibrancy using Tencent location-aware data: A case of Guangzhou. Sustainability 2021, 13, 444. [Google Scholar] [CrossRef]
  17. Meng, Y.; Xing, H. Exploring the relationship between landscape characteristics and urban vibrancy: A case study using morphology and review data. Cities 2019, 95, 102389. [Google Scholar] [CrossRef]
  18. Wu, C.; Ye, X.; Ren, F.; Du, Q. Check-in behaviour and spatio-temporal vibrancy: An exploratory analysis in Shenzhen, China. Cities 2018, 77, 104–116. [Google Scholar] [CrossRef]
  19. Yang, J.; Yuan, M.; Yang, S.; Zhang, D.; Wang, Y.; Song, D.; Dai, Y.; Gao, Y.; Gong, J. Spatial Diffusion Waves of Human Activities: Evidence from Harmonized Nighttime Light Data during 1992–2018 in 234 Cities of China. Remote Sens. 2023, 15, 1426. [Google Scholar] [CrossRef]
  20. Han, T.; Yao, H.; Sun, X.; Zhao, S.; Zhang, Y. Unsupervised discovery of crowd activities by saliency-based clustering. Neurocomputing 2016, 171, 347–361. [Google Scholar] [CrossRef]
  21. Zhang, Y.; Liu, L.; Wang, H. A new perspective on the temporal pattern of human activities in cities: The case of Shanghai. Cities 2019, 87, 196–204. [Google Scholar] [CrossRef]
  22. Zhao, Y.; Chen, B.Y.; Gao, F.; Zhu, X. Dynamic community detection considering daily rhythms of human mobility. Travel Behav. Soc. 2023, 31, 209–222. [Google Scholar] [CrossRef]
  23. Hung, C.-C.; Peng, W.-C.; Lee, W.-C. Clustering and aggregating clues of trajectories for mining trajectory patterns and routes. VLDB J. 2015, 24, 169–192. [Google Scholar] [CrossRef]
  24. Yuan, G.; Zhao, J.; Xia, S.; Zhang, Y.; Li, W. Multi-granularity periodic activity discovery for moving objects. Int. J. Geogr. Inf. Sci. 2017, 31, 435–462. [Google Scholar] [CrossRef]
  25. Zhang, D.; Li, N.; Zhou, Z.-H.; Chen, C.; Sun, L.; Li, S. iBAT: Detecting anomalous taxi trajectories from GPS traces. In Proceedings of the 13th International Conference on Ubiquitous Computing, Beijing, China, 17–21 September 2011; pp. 99–108. [Google Scholar]
  26. Gonzalez, M.C.; Hidalgo, C.A.; Barabasi, A.-L. Understanding individual human mobility patterns. Nature 2008, 453, 779–782. [Google Scholar] [CrossRef]
  27. Song, C.; Koren, T.; Wang, P.; Barabási, A.-L. Modelling the scaling properties of human mobility. Nat. Phys. 2010, 6, 818–823. [Google Scholar] [CrossRef]
  28. Song, C.; Qu, Z.; Blumm, N.; Barabási, A.-L. Limits of predictability in human mobility. Science 2010, 327, 1018–1021. [Google Scholar] [CrossRef]
  29. Bao, J.; Yang, Z.; Zeng, W.; Shi, X. Exploring the spatial impacts of human activities on urban traffic crashes using multi-source big data. J. Transp. Geogr. 2021, 94, 103118. [Google Scholar] [CrossRef]
  30. Xu, Y.; Belyi, A.; Bojic, I.; Ratti, C. Human mobility and socioeconomic status: Analysis of Singapore and Boston. Comput. Environ. Urban Syst. 2018, 72, 51–67. [Google Scholar] [CrossRef]
  31. Li, J.; Li, J.; Yuan, Y.; Li, G. Spatiotemporal distribution characteristics and mechanism analysis of urban population density: A case of Xi’an, Shaanxi, China. Cities 2019, 86, 62–70. [Google Scholar] [CrossRef]
  32. Zhang, A.; Zhai, S.; Liu, X.; Song, G.; Feng, Y. Investigating the Association between Streetscapes and Mental Health in Zhanjiang, China: Using Baidu Street View Images and Deep Learning. Int. J. Environ. Res. Public Health 2022, 19, 16634. [Google Scholar] [CrossRef] [PubMed]
  33. Li, Y.; Yabuki, N.; Fukuda, T. Exploring the association between street built environment and street vitality using deep learning methods. Sustain. Cities Soc. 2022, 79, 103656. [Google Scholar] [CrossRef]
  34. Sun, J.; Jiang, Q.; Lu, C. Recursive social behavior graph for trajectory prediction. In Proceedings of the IEEE/CVF Conference on Computer Vision and Pattern Recognition, Seattle, WA, USA, 13–19 June 2020; pp. 660–669. [Google Scholar]
  35. Zhao, P.; Xu, Y.; Liu, X.; Kwan, M.-P. Space-time dynamics of cab drivers’ stay behaviors and their relationships with built environment characteristics. Cities 2020, 101, 102689. [Google Scholar] [CrossRef]
  36. Hu, X.; Shen, P.; Shi, Y.; Zhang, Z. Using Wi-Fi probe and location data to analyze the human distribution characteristics of green spaces: A case study of the Yanfu Greenland Park, China. Urban For. Urban Green. 2020, 54, 126733. [Google Scholar] [CrossRef]
  37. Feng, Z.; Zhu, Y. A survey on trajectory data mining: Techniques and applications. IEEE Access 2016, 4, 2056–2067. [Google Scholar] [CrossRef]
  38. Luo, F.; Cao, G.; Mulligan, K.; Li, X. Explore spatiotemporal and demographic characteristics of human mobility via Twitter: A case study of Chicago. Appl. Geogr. 2016, 70, 11–25. [Google Scholar] [CrossRef]
  39. Scherrer, L.; Tomko, M.; Ranacher, P.; Weibel, R. Travelers or locals? Identifying meaningful sub-populations from human movement data in the absence of ground truth. EPJ Data Sci. 2018, 7, 19. [Google Scholar] [CrossRef]
  40. De Gruyter, C.; Zahraee, S.M.; Young, W. Understanding the allocation and use of street space in areas of high people activity. J. Transp. Geogr. 2022, 101, 103339. [Google Scholar] [CrossRef]
  41. Williams, S.; Ahn, C.; Gunc, H.; Ozgirin, E.; Pearce, M.; Xiong, Z. Evaluating sensors for the measurement of public life: A future in image processing. Environ. Plan. B Urban Anal. City Sci. 2019, 46, 1534–1548. [Google Scholar] [CrossRef]
  42. Liu, X.; He, J.; Yao, Y.; Zhang, J.; Liang, H.; Wang, H.; Hong, Y. Classifying urban land use by integrating remote sensing and social media data. Int. J. Geogr. Inf. Sci. 2017, 31, 1675–1696. [Google Scholar] [CrossRef]
  43. Zhang, J.; Li, X.; Yao, Y.; Hong, Y.; He, J.; Jiang, Z.; Sun, J. The Traj2Vec model to quantify residents’ spatial trajectories and estimate the proportions of urban land-use types. Int. J. Geogr. Inf. Sci. 2021, 35, 193–211. [Google Scholar] [CrossRef]
  44. Kong, X.; Liu, Y.; Wang, Y.; Tong, D.; Zhang, J. Investigating public facility characteristics from a spatial interaction perspective: A case study of Beijing hospitals using taxi data. ISPRS Int. J. Geo-Inf. 2017, 6, 38. [Google Scholar] [CrossRef]
  45. Zhou, G.; Li, C.; Li, M.; Zhang, J.; Liu, Y. Agglomeration and diffusion of urban functions: An approach based on urban land use conversion. Habitat Int. 2016, 56, 20–30. [Google Scholar] [CrossRef]
  46. Xiong, W.; Yang, J. The Identification and Dynamics of Urban Shadow Areas from the Perspective of People Flows—A Case Study of Nanjing. Buildings 2023, 13, 2934. [Google Scholar] [CrossRef]
  47. Marčetić, D.; Maleš, L.; Ribarić, S. Crowd motion pattern detection at the microscopic level. In Proceedings of the 2019 42nd International Convention on Information and Communication Technology, Electronics and Microelectronics (MIPRO), Opatija, Croatia, 20–24 May 2019; pp. 1093–1098. [Google Scholar]
  48. Ge, W.; Collins, R.T.; Ruback, R.B. Vision-based analysis of small groups in pedestrian crowds. IEEE Trans. Pattern Anal. Mach. Intell. 2012, 34, 1003–1016. [Google Scholar] [PubMed]
  49. Guzman, L.A.; Arellana, J.; Castro, W.F. Desirable streets for pedestrians: Using a street-level index to assess walkability. Transp. Res. Part D Transp. Environ. 2022, 111, 103462. [Google Scholar] [CrossRef]
  50. Miranda, A.S.; Fan, Z.; Duarte, F.; Ratti, C. Desirable streets: Using deviations in pedestrian trajectories to measure the value of the built environment. Comput. Environ. Urban Syst. 2021, 86, 101563. [Google Scholar] [CrossRef]
  51. IRVIN, K. How far, by which route and why? A spatial analysis of pedestrian preference. J. Urban Des. 2008, 13, 81–98. [Google Scholar]
  52. Liu, Y.; Yang, D.; Timmermans, H.J.; de Vries, B. The impact of the street-scale built environment on pedestrian metro station access/egress route choice. Transp. Res. Part D Transp. Environ. 2020, 87, 102491. [Google Scholar] [CrossRef]
  53. Hino, K.; Baba, H.; Kim, H.; Shimizu, C. Validation of a Japanese walkability index using large-scale step count data of Yokohama citizens. Cities 2022, 123, 103614. [Google Scholar] [CrossRef]
  54. Sevtsuk, A.; Basu, R.; Li, X.; Kalvo, R. A big data approach to understanding pedestrian route choice preferences: Evidence from San Francisco. Travel Behav. Soc. 2021, 25, 41–51. [Google Scholar] [CrossRef]
  55. Yamamoto, T.; Takamura, S.; Morikawa, T. Structured random walk parameter for heterogeneity in trip distance on modeling pedestrian route choice behavior at downtown area. Travel Behav. Soc. 2018, 11, 93–100. [Google Scholar] [CrossRef]
  56. Niu, T.; Qing, L.; Han, L.; Long, Y.; Hou, J.; Li, L.; Tang, W.; Teng, Q. Small public space vitality analysis and evaluation based on human trajectory modeling using video data. Build. Environ. 2022, 225, 109563. [Google Scholar] [CrossRef]
  57. Hou, J.; Chen, L.; Zhang, E.; Jia, H.; Long, Y. Quantifying the usage of small public spaces using deep convolutional neural network. PLoS ONE 2020, 15, e0239390. [Google Scholar] [CrossRef] [PubMed]
  58. Chou, K.-Y.; Paulsen, M.; Nielsen, O.A.; Jensen, A.F. Analysis of cycling accessibility using detour ratios—A large-scale study based on crowdsourced GPS data. Sustain. Cities Soc. 2023, 93, 104500. [Google Scholar] [CrossRef]
  59. Liang, S.; Leng, H.; Yuan, Q.; Wang, B.; Yuan, C. How does weather and climate affect pedestrian walking speed during cool and cold seasons in severely cold areas? Build. Environ. 2020, 175, 106811. [Google Scholar] [CrossRef]
  60. Kirchner, T.R.; Gao, H.; Anesetti-Rothermel, A.; Carlos, H.; House, B. Longitudinal human mobility and real-time access to a national density surface of retail outlets. In Proceedings of the International Workshop on Urban Computing, New York, NY, USA, 24 August 2014. [Google Scholar]
  61. Chen, T.-Y.; Chen, L.-C.; Chen, Y.-M. Mining location-based service data for feature construction in retail store recommendation. In Proceedings of the Advances in Data Mining. Applications and Theoretical Aspects: 17th Industrial Conference, ICDM 2017, New York, NY, USA, 12–13 July 2017; pp. 68–77. [Google Scholar]
  62. Yang, W.; Ai, T. POI information enhancement using crowdsourcing vehicle trace data and social media data: A case study of gas station. ISPRS Int. J. Geo-Inf. 2018, 7, 178. [Google Scholar] [CrossRef]
  63. Chen, Y.-Y.; Cheng, A.-J.; Hsu, W.H. Travel recommendation by mining people attributes and travel group types from community-contributed photos. IEEE Trans. Multimed. 2013, 15, 1283–1295. [Google Scholar] [CrossRef]
  64. Liao, C.; Dai, T.; Zhao, P.; Ding, T. Weighted centrality and retail store locations in Beijing, China: A temporal perspective from dynamic public transport flow networks. Appl. Sci. 2021, 11, 9069. [Google Scholar] [CrossRef]
  65. McKenzie, G.; Janowicz, K.; Adams, B. Weighted multi-attribute matching of user-generated points of interest. In Proceedings of the 21st ACM SIGSPATIAL International Conference on Advances in Geographic Information Systems, Orlando, FL, USA, 5–8 November 2013; pp. 440–443. [Google Scholar]
  66. Frick, M.; Castro, M.C. Tobacco retail clustering around schools in New York City: Examining “place” and “space”. Health Place 2013, 19, 15–24. [Google Scholar] [CrossRef]
  67. Berendes, C.I. Towards analyzing high street customer trajectories-A data-driven case study. In Proceedings of the Business Information Systems Workshops: BIS 2019 International Workshops, Seville, Spain, 26–28 June 2019; Revised Papers 22. pp. 313–324. [Google Scholar]
  68. Santos, F.; Almeida, A.; Martins, C.; Gonçalves, R.; Martins, J. Using POI functionality and accessibility levels for delivering personalized tourism recommendations. Comput. Environ. Urban Syst. 2019, 77, 101173. [Google Scholar] [CrossRef]
  69. Shi, P.; Xiao, Y.; Zhan, Q. A study on spatial and temporal aggregation patterns of urban population in Wuhan City based on Baidu heat map and POI data. Int. Rev. Spat. Plan. Sustain. Dev. 2020, 8, 101–121. [Google Scholar] [CrossRef]
  70. Karamshuk, D.; Noulas, A.; Scellato, S.; Nicosia, V.; Mascolo, C. Geo-spotting: Mining online location-based services for optimal retail store placement. In Proceedings of the 19th ACM SIGKDD International Conference on Knowledge Discovery and Data Mining, Chicago, IL, USA, 11–14 August 2013; pp. 793–801. [Google Scholar]
  71. Shi, Y.; Tao, T.; Cao, X.; Pei, X. The association between spatial attributes and neighborhood characteristics based on Meituan take-out data: Evidence from shanghai business circles. J. Retail. Consum. Serv. 2021, 58, 102302. [Google Scholar] [CrossRef]
  72. Zheng, Z.; Zhou, S. Scaling laws of spatial visitation frequency: Applications for trip frequency prediction. Comput. Environ. Urban Syst. 2017, 64, 332–343. [Google Scholar] [CrossRef]
  73. Chen, L.; Lu, Y.; Ye, Y.; Xiao, Y.; Yang, L. Examining the association between the built environment and pedestrian volume using street view images. Cities 2022, 127, 103734. [Google Scholar] [CrossRef]
  74. Andersen, D.C. Credit constraints, technology upgrading, and the environment. J. Assoc. Environ. Resour. Econ. 2016, 3, 283–319. [Google Scholar] [CrossRef]
  75. Kontokosta, C.E.; Johnson, N. Urban phenology: Toward a real-time census of the city using Wi-Fi data. Comput. Environ. Urban Syst. 2017, 64, 144–153. [Google Scholar] [CrossRef]
  76. Traunmueller, M.W.; Johnson, N.; Malik, A.; Kontokosta, C.E. Digital footprints: Using WiFi probe and locational data to analyze human mobility trajectories in cities. Comput. Environ. Urban Syst. 2018, 72, 4–12. [Google Scholar] [CrossRef]
  77. Zhou, Y.; Lau, B.P.L.; Koh, Z.; Yuen, C.; Ng, B.K.K. Understanding Crowd Behaviors in a Social Event by Passive WiFi Sensing and Data Mining. IEEE Internet Things J. 2020, 7, 4442–4454. [Google Scholar] [CrossRef]
  78. Li, L.; Li, X.; Yang, Y.; Dong, J. Indoor tracking trajectory data similarity analysis with a deep convolutional autoencoder. Sustain. Cities Soc. 2019, 45, 588–595. [Google Scholar] [CrossRef]
  79. Spaccapietra, S.; Parent, C.; Damiani, M.L.; de Macedo, J.A.; Porto, F.; Vangenot, C. A conceptual view on trajectories. Data Knowl. Eng. 2008, 65, 126–146. [Google Scholar] [CrossRef]
  80. Chen, B.Y.; Yuan, H.; Li, Q.; Lam, W.H.; Shaw, S.-L.; Yan, K. Map-matching algorithm for large-scale low-frequency floating car data. Int. J. Geogr. Inf. Sci. 2014, 28, 22–38. [Google Scholar] [CrossRef]
  81. Marchal, F.; Hackney, J.; Axhausen, K.W. Efficient map matching of large global positioning system data sets: Tests on speed-monitoring experiment in Zürich. Transp. Res. Rec. 2005, 1935, 93–100. [Google Scholar] [CrossRef]
  82. Ahn, H.; Lee, S.; Ko, H.; Kim, M.; Han, S.W.; Seok, J. Searching similar weather maps using convolutional autoencoder and satellite images. ICT Express 2023, 9, 69–75. [Google Scholar] [CrossRef]
  83. Yue, Y.; Zhuang, Y.; Yeh, A.G.; Xie, J.-Y.; Ma, C.-L.; Li, Q.-Q. Measurements of POI-based mixed use and their relationships with neighbourhood vibrancy. Int. J. Geogr. Inf. Sci. 2017, 31, 658–675. [Google Scholar] [CrossRef]
  84. Yang, Y.; Ratkowsky, D.A.; Yang, J.; Shi, P. Effects of Plant Coverage on the Abundance of Adult Mosquitos at an Urban Park. Plants 2023, 12, 983. [Google Scholar] [CrossRef]
  85. Mal, H.; Yu, P.; Yang, Y.; Tao, L.; Mba, D. A Novel Grey Incidence Decision-making Method Embodying Development Tendency and Its Application. J. Grey Syst. 2021, 33, 1181899. [Google Scholar]
  86. Yu, P.; Yang, Y.; Ma, H.; Mba, D. Evaluation of High-Quality Development of Manufacturing Industry Using a Novel Grey Dynamic Double Incentive Decision-Making Model. Math. Probl. Eng. 2022, 2022, 1181899. [Google Scholar] [CrossRef]
  87. Aggarwal, C.; Ge, H.; Defo, M.; Lacasse, M.A. Hygrothermal performance assessment of wood frame walls under historical and future climates using partial least squares regression. Build. Environ. 2022, 223, 109501. [Google Scholar] [CrossRef]
  88. Wold, H. Soft modelling: The basic design and some extensions. Syst. Under Indirect. Obs. Part II 1982, 36–37. [Google Scholar]
  89. Fang, K.; Wang, X.; Chen, L.; Zhang, Z.; Furuya, N. Research on the correlation between pedestrian density and street spatial characteristics of commercial blocks in downtown area: A case study on Shanghai Tianzifang. J. Asian Archit. Build. Eng. 2019, 18, 233–246. [Google Scholar] [CrossRef]
  90. Yue, W.; Chen, Y.; Zhang, Q.; Liu, Y. Spatial explicit assessment of urban vitality using multi-source data: A case of Shanghai, China. Sustainability 2019, 11, 638. [Google Scholar] [CrossRef]
  91. Mehanna, W.A.E.-H.; Mehanna, W.A.E.-H. Urban renewal for traditional commercial streets at the historical centers of cities. Alex. Eng. J. 2019, 58, 1127–1143. [Google Scholar] [CrossRef]
  92. Hahm, Y.; Yoon, H.; Choi, Y. The effect of built environments on the walking and shopping behaviors of pedestrians; A study with GPS experiment in Sinchon retail district in Seoul, South Korea. Cities 2019, 89, 1–13. [Google Scholar] [CrossRef]
  93. Yan, Q.; Hu, Y.; Ye, H.B. Time to update China’s panda loan terms. Science 2020, 367, 373. [Google Scholar] [CrossRef] [PubMed]
  94. Hubbard, P. The Battle for the High Street: Retail Gentrification, Class and Disgust; Springer: Berlin/Heidelberg, Germany, 2017. [Google Scholar]
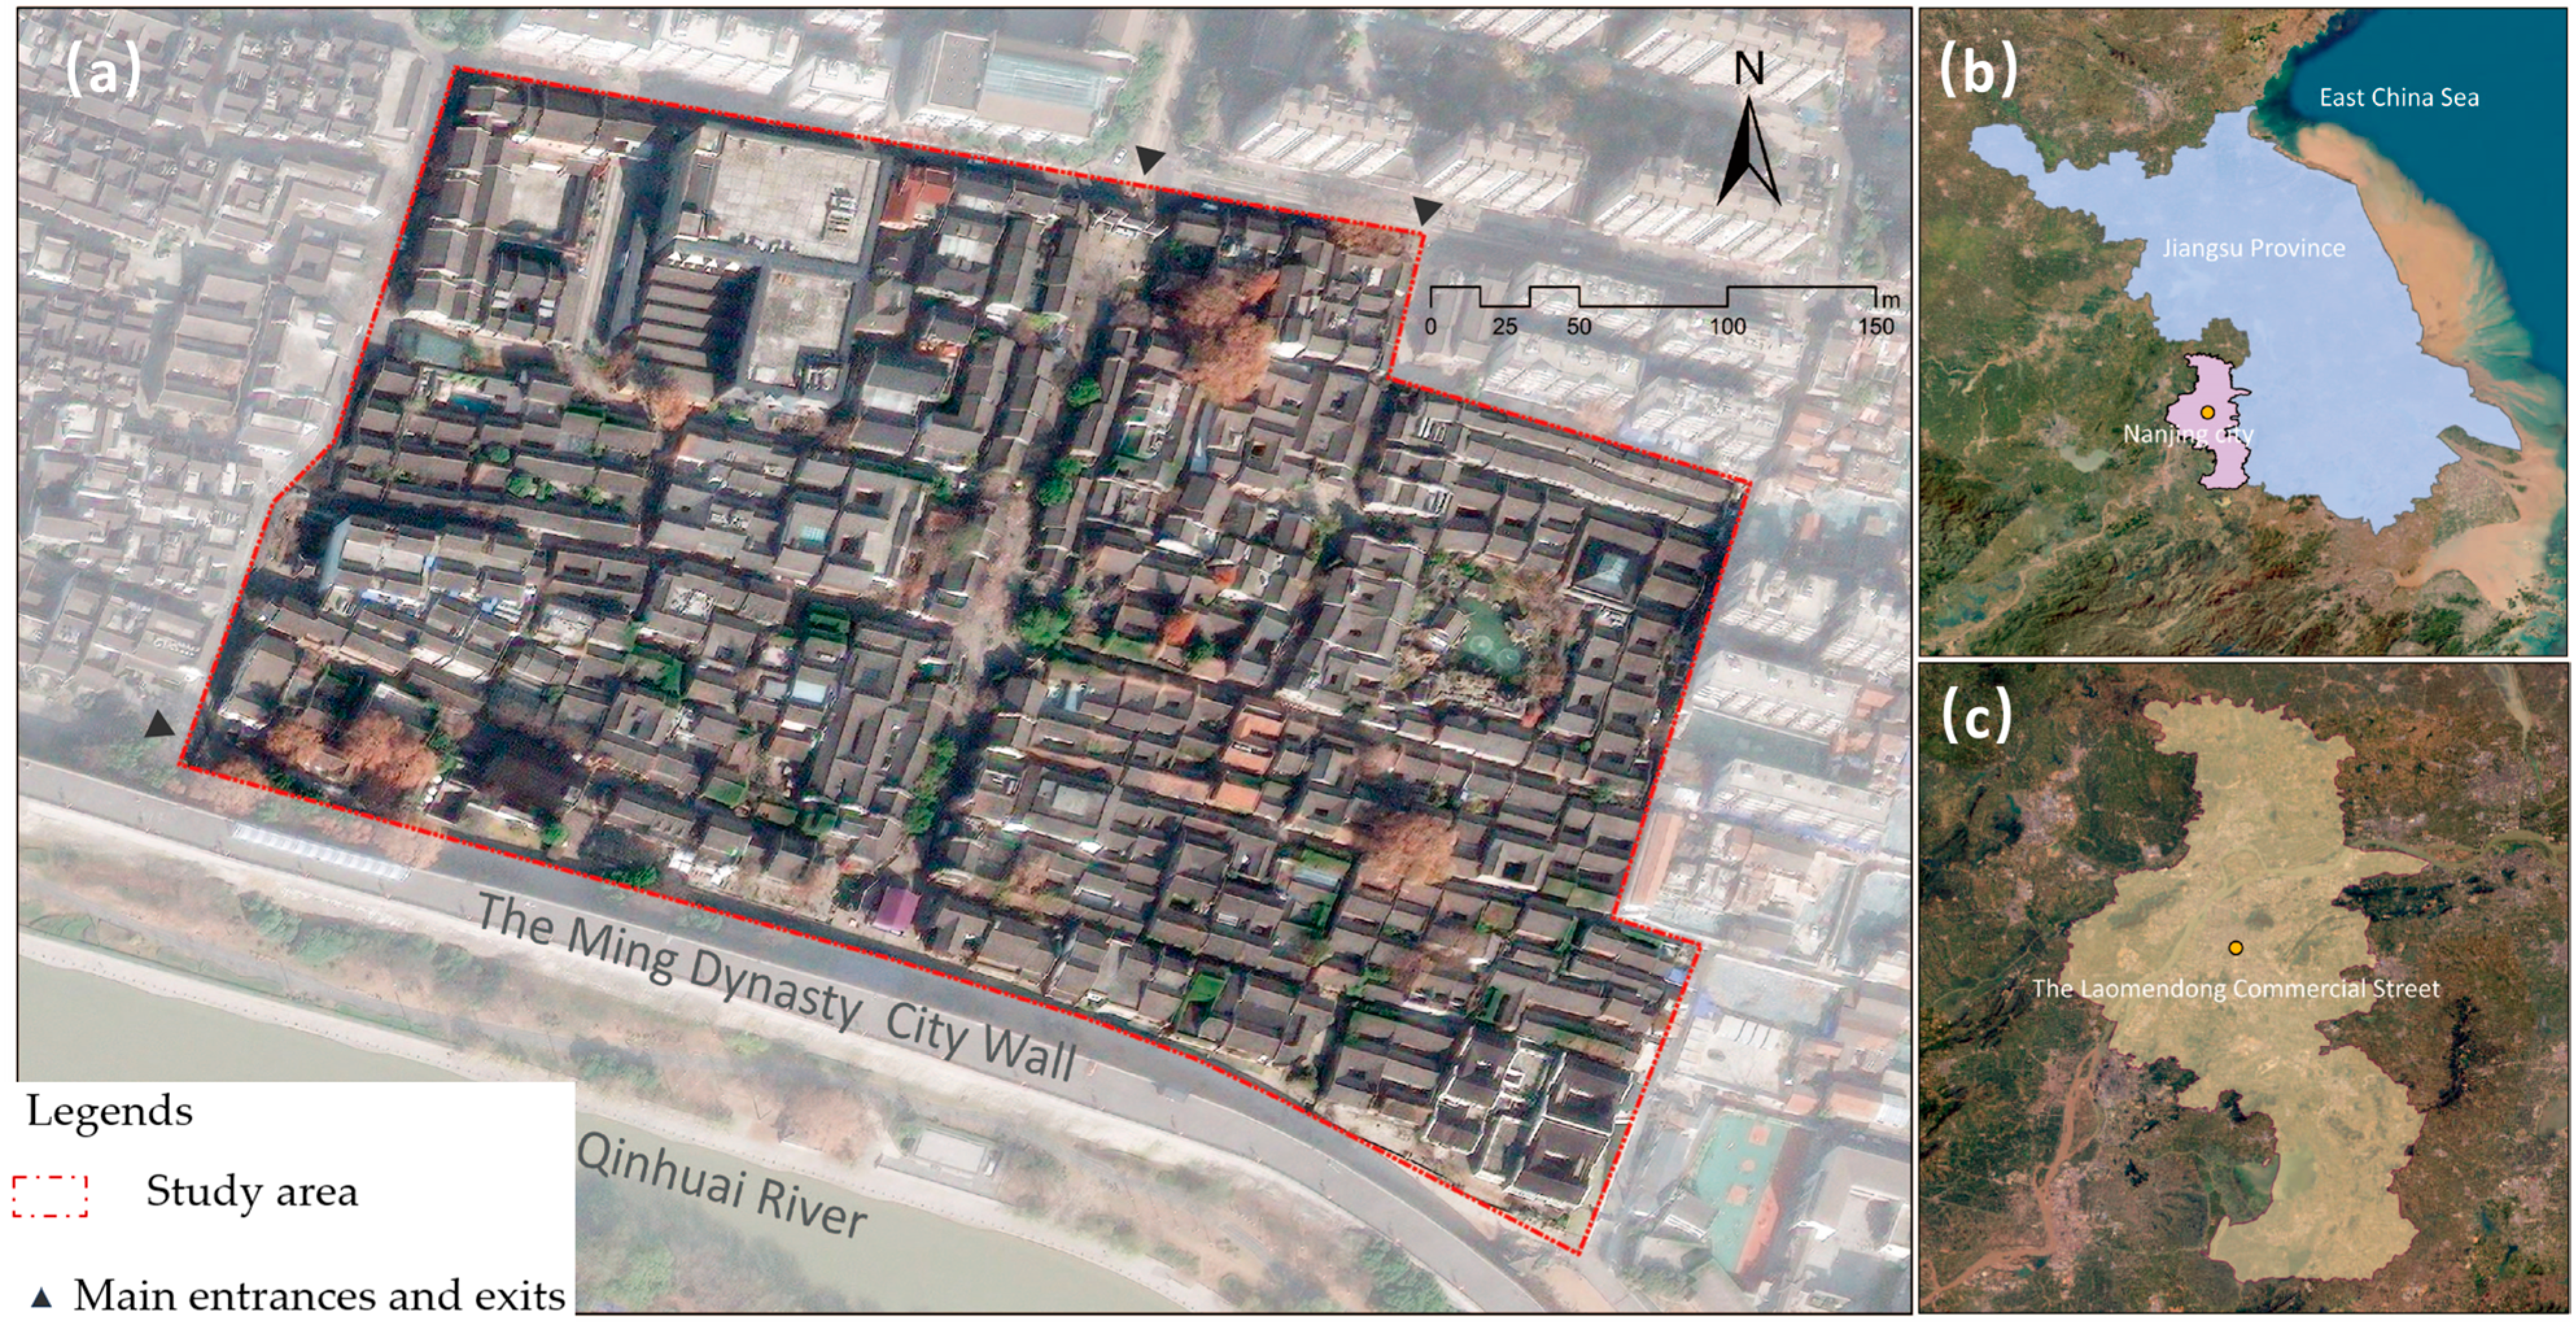
Figure 1. Study area. (a) The Lao Men Dong commercial street and its surrounding environment; (b) location of Jiangsu; (c) location of Lao Men Dong commercial street in Jiangsu.
Sustainability 15 16838 g001
Figure 2. Research framework. Note: MDP-MM, multi-criteria dynamic programming map-matching; CAE, convolutional autoencoder.
Sustainability 15 16838 g002
Figure 3. The facility layout, including placement of probes.
Sustainability 15 16838 g003
Figure 4. Flowchart of population trajectory clustering.
Sustainability 15 16838 g004
Figure 5. Diagram of stay points.
Sustainability 15 16838 g005
Figure 6. Road network matching. (a) Original trajectory. (b) Identify the road network being matched (schematic diagram). (c) Determine the candidate points and candidate paths of the tracking point matching road network (schematic diagram). (d) The trajectory after matching the road network.
Sustainability 15 16838 g006
Figure 7. The architecture of the CAE.
Sustainability 15 16838 g007
Figure 8. Number of clusters and silhouette coefficient.
Sustainability 15 16838 g008
Figure 9. Research steps of correlation analysis.
Sustainability 15 16838 g009
Figure 10. Hourly variations in stay activities. (a) Number of stay points. (b) Number of stays per capita.
Sustainability 15 16838 g010
Figure 11. Spatial staying activity distribution of people in Lao Men Dong Commercial Street. (a) The spatial characteristics of crowd stay activities. (b) Spatial stay characteristics of the crowd on weekdays. (c) Spatial stay characteristics of the crowd on weekends.
Sustainability 15 16838 g011
Figure 12. Spatial distribution of clusters of different moving trajectories. (a) Trajectory cluster 1. (b) Trajectory cluster 2. (c) Trajectory cluster 3. (d) Trajectory cluster 4.
Sustainability 15 16838 g012
Table 1. Statistics of Lao Men Dong commercial formats form.
Serial NumberFormat DivisionQuantityType
1Food82Restaurant, snack, sweets and dessert, coffee shop, teahouse, and bar
2Shopping52Store, house building materials, hotels, home appliance, specialist shops, shop, and market
3Life service36Graphics express printing, photo studio, and lottery sale
4Leisure33Cinema, theater
5Tourist attractions26Art museum, exhibition hall, museum, and scenic spot
6Public service12Public toilet, government agencies
7Others19Clinic, drugstore, other non-commercial functions
Source: We obtained formats data from the Gaode Developer platform (https://lbs.amap.com/, accessed on 11 December 2022).
Table 2. Partial road information topology table.
NameLength (m)Starting Point CoordinatesTarget Point Coordinates
f145.92118.7827855, 32.0150326118.782684, 32.0146936
f250.86118.7817985. 32.0138379118.7813574, 32.0139388
f326.18118.7821165, 32.0129845118.7823343, 32.0129092
Table 3. Connotations and algorithms of various characteristic indicators in the model.
VariablesConditionConnection and Algorithm
Dependent variablesNumber of touristsRefers to the strength of crowd trajectory clusters and reflects the intensity of the trajectory characteristics of the population.
Number of tourists is the number of people performing similar activity trajectories during the study time.
Per capita number of stayRefers to the intensity of spatial residence, and the intensity reflecting the characteristics of the population’s stay activity.
Average number of tourists’ stay in the analysis cell.
Independent variablesSpatial distance of formatsRefers to the spatial location of the format and reflects the convenience of the format to the tourists.
The spatial distance of the format refers to the average distance of the road network from each entrance and exit to the format.
Quantity of each types of formatRefers to the intensity of format, reflects the number of visits to the format, and refers to the number of food formats, shopping formats, life service formats, leisure formats, tourist attraction formats, public service formats, and other formats.
The number of formats is the number of each type of visited format in the analysis unit.
Diversity of formatsRefers to the degree of format and reflects the extent to which the population is inclined to the functional intensity of the format.
Diversity is calculated using the entropy method [83].
Table 4. Results of partial least squares regression analysis.
Development VariablesDependent Variables
Coefficients
(Number of Tourists)
VIP Scores
(Number of Tourists)
Coefficients
(Per Capita Number of Stays)
VIP Scores
(Per Capita Number of Stays)
Spatial location of formats−0.030.2530.010.39
Mixed degree of formats−0.150.6170.050.682
The number of food formats0.160.9070.310.898
The number of shopping formats0.141.3080.401.293
The number of life service formats0.181.28−0.071.263
The number of leisure formats−0.010.8850.260.873
The number of tourist attraction formats0.140.9530.200.962
The number of public service formats0.211.270.221.252
The number of other formats−0.201.0370.091.027
Disclaimer/Publisher’s Note: The statements, opinions and data contained in all publications are solely those of the individual author(s) and contributor(s) and not of MDPI and/or the editor(s). MDPI and/or the editor(s) disclaim responsibility for any injury to people or property resulting from any ideas, methods, instructions or products referred to in the content.