Article

A Streamline Sustainable Business Performance Reporting Model by an Integrated FinESG Approach

by
Victoria Bogdan
1,
Luminita Rus
1,*,
Dana Simona Gherai
1,
Adrian Gheorghe Florea
2 and
Nicoleta Georgeta Bugnar
3
1
Department of Finance and Accounting, Faculty of Economic Sciences, University of Oradea, 410087 Oradea, Romania
2
Department of Business Economics, Faculty of Economic Sciences, University of Oradea, 410087 Oradea, Romania
3
Department of International Relations, Faculty of Economic Sciences, University of Oradea, 410087 Oradea, Romania
*
Author to whom correspondence should be addressed.
Sustainability 2023, 15(24), 16860; https://doi.org/10.3390/su152416860
Submission received: 28 October 2023 / Revised: 1 December 2023 / Accepted: 11 December 2023 / Published: 14 December 2023

Abstract

:
ESG reporting and disclosure enable financial performance by attracting revenues and optimizing managerial decisions. Within this landscape falls the present study that aimed to examine the quality of ESG reporting connected to the financial performance of listed companies. Stratified analysis revealed four groups of companies according to the average value of ROA and ROE indicators, as well as four classes according to the average ESG disclosure score. The analysis of GRI topics and materiality disclosure scores showed an average disclosure level on ESG components, located between a satisfactory and a good level of disclosure. Also, companies were found to be more inclined to disclose data on the sustainability strategy but provided poor and vague information on the business model. The results of comparative clustering analysis based on FinESG reporting and disclosure scores showed that 31.57% of companies maintained their position in the final ranking. Content analysis of sustainability reports by Leximancer, v.5.0 software highlighted that the most salient topic was “employees”, and it revealed correlations between the themes “employees” and “emissions”. The practical implications of the study were found in the promotion of an integrated reporting that best meets the needs of both stakeholders and those of environmental protection and the development of society.

1. Introduction

In current business models adjusted to the growing needs of implementing sustainable development strategies, environmental, social, and governance (ESG) information, as well as financial considerations, play an increasingly important role in the investment decision-making process. Therefore, companies face a growing demand from investors, as well as external and internal stakeholders, to quickly and accurately disclose their ESG performance. But there are significant challenges, for instance, the need to report according to the requirements of multiple ESG frameworks and protocols and to coordinate inputs between functions, groups, and networks. In this context, more and more studies are oriented towards the quality analysis of sustainability reporting and ESG content analysis using various artificial intelligence algorithms, like natural language processing (NLP), machine learning (ML), or deep learning (DL) [1,2,3,4,5,6,7,8,9,10]. Corporate reporting has acquired new dimensions since the emergence and implementation of the triple bottom line (TBL) concept, and standards and regulations have been added to traditional financial reporting frameworks for reporting and disclosing information on environmental and social aspects, guiding companies towards a development sustainable business through management’s integration of a TBL approach [11,12,13]. Also, theories such as stakeholder theory, corporate social responsibility, and corporate sustainability have provided explanations regarding the meaning of sustainability for business and what actions or practices can be carried out by companies to be considered performing from a sustainability point of view. At the same time, with the publication of Global Reporting Initiative (GRI) guidelines and standards [14] for reporting ESG information, it has become increasingly clear how sustainability performance can be assessed and reported. However, in the last decades with the development of new multidisciplinary theories (green economics, co-evolution, governance, systems theory, and other multi-level perspective theories), the focus has shifted from what sustainability represents for companies and what information must be reported for quantification sustainability performance towards how sustainability is implemented in companies and the business model, how information is reported and presented in sustainability reports, and how ESG information performance can be integrated into the company’s overall performance, alongside financial performance [15,16,17,18].
According to the New EU Corporate Sustainability Reporting Directive (CSRD) [19], the class of companies that must report and disclose in compliance with the European Sustainability Reporting Standards (ESRS) is extended to all large companies and all companies listed on EU-regulated markets. These standards introduce more detailed reporting requirements and third-party assurance of reported data. ESRS is based on the aggregation of existing best practices; the use of existing international standards and frameworks; and new sustainability reporting obligations arising from recent European legislation and regulations, such as the Sustainable Financial Disclosure Regulations (SFDR) and the European Sustainability Classification of Doing Business (EU Taxonomy). Also, from January 2027, all EU-listed companies on the regulated markets, with more than 10 employees, must start reporting according to the new CSRD requirements. Currently, the mandatory disclosure of non-financial information by certain listed Romanian companies was introduced as a result of transposing the non-financial reporting EU Directive (NFRD) into domestic regulations [20,21].
Consequently, all companies that individually or on a consolidated level have on average more than 500 employees are required to disclose material ESG information as part of their annual reporting. The disclosure should take the form of a non-financial statement/report included in the management report. This statement must contain a brief description of the company’s business model; the policies and results of the actions taken regarding environmental, social, and employee issues; human rights and the fight against corruption; anti-discrimination; main risks; and relevant key performance indicators (KPIs). Also, in April 2022, the Bucharest Stock Exchange (BSE) published ESG Reporting Guidelines [22] in support of companies that are required to report and disclose ESG information, a guide that in its content presents the importance and necessity of such a guideline clarifies what ESGs are and their importance, provides a summary of the regulations in the field and presents in the section reporting principles, sustainability reporting frameworks and standards, and the reporting and disclosure method. A distinct section of the manual is dedicated to climate change reporting in the context of implementing ESG reporting, and the pragmatic nature of this guidance is found in the section that describes each stage of the ESG reporting process with a focus on identifying material ESG issues, sustainability strategy and objectives, description on actions and results, and meeting investors’ expectations. The examination of these guidelines and ESG reporting frameworks and regulations constituted the theoretical premises for designing the present research investigation.
With this panorama in mind, the purpose of this study was to analyze the ESG information reporting and disclosure model and some classic financial performance indicators to provide an opinion on an integrated reporting model consisting of the association of the two categories of indicators. To achieve this objective, a sample of listed companies was used for which the financial performance measured by four classic indicators (ROA, ROE, NetProfit, and Cash_liquid) was examined for the current year of analysis and the average of five years. Also, companies were selected by the ESG risks scores calculated by the rating agency Sustainalytics and made publicly available on the platform https://bvbresearch.ro/ReportDashboard/ESGScores, accessed on 16 February 2023. Further on, grades were awarded for the information disclosed in the sustainability reports published for the current year of analysis and previous years. To carry out the qualitative analysis regarding the information on the ESG components from the sustainability reports, content analysis was used, and the data processing was carried out with the help of Leximancer v5.0 software; also, Tableau software version 2023.1.0 and Python 3.7 software were used to visualize the results of the analysis. Based on a general score for both financial and ESG performance, a ranking of the sampled listed companies was made. Realizing that the center of gravity is increasingly shifting towards how companies integrate sustainability issues into their business model and improving the quality of ESG reporting in the investigation process, answers were sought to the following research questions:
Q1: How do companies choose to display ESG data and where are they most frequently disclosed?
Q2: How thoroughly are ESG data reported for the current and previous years?
Q3: How do companies rank after ESG and FinESG performance?
Q4: Which are the main ESG themes disclosed in sustainability reports?
The main contribution of the study was found in the promotion of the integrated approach of reporting sustainability aspects and financial performance indicators responding to the current needs of stakeholders, environmental protection, and society development. The present paper is organized as follows: in the section following the introduction, the state of knowledge regarding the investigated topic is described synthetically, the review of significant publications was carried out on two paths of investigation, the ESG performance correlated to the financial indicators, and the relevant studies that developed a content analysis of ESG data reported, and then the next part presents the data description and collection, as well as the research methodology. The following sections describe the analysis carried out in layers of investigation and the results obtained with several preliminary conclusions. The study ends with discussions on the most significant outcomes and outlines the main conclusions, contributions, and limits of the research.

2. Literature Review

2.1. ESG Impact on Financial Performance

According to the international literature on the topic, ESG factors are of increasing interest [23], being considered extremely important in saving decisions [24]. A series of studies or empirical models have contributed in recent years to the process of evaluating the impact of ESG factors on financial performance among companies, but due to the lack of clear evidence [24,25] and the fact that the empirical results are not unequivocal [26], this link still remains unresolved. Several studies highlighted a positive, non-linear relationship between ESG and financial performance [27,28,29,30,31]. Moreover, recent research [32,33] has been oriented towards the analysis of the investment optimization in green production technologies and the study of the multi-item inventory system in order to ensure the sustainability of the multi-layer supply chain. Barman et al. [34] applied the non-dominated sorting genetic algorithm (NSGA-II) technique to optimize the products sale price, wholesale price, order quantity, and inventory scheduling policy to maximize the general profit of the supply chain.
The study of 1038 European companies by De Lucia, Pazienza, and Bartlett [28] shows a positive relationship between ESG practices and financial indicators ROA and ROE, using a combined approach of machine learning techniques and an interference model (ordered logistic regression). Azmi et al. [29] examined, on a sample of 251 banks, the relationship between ESG performance and bank value. The period under examination was 2011–2017, and banks from 44 emerging economies were chosen. The authors, using the System Generalized Method of Moments (GMM) estimation in order to control endogeneity, identified a non-linear relationship between ESG activity and bank value. Results proved low levels of ESG activity that have a positive impact on the value of the bank. In the same note, Agoraki et al. [31] examined a group of 1816 listed European firms in terms of the association of firms’ ESG reputational risk and financial performance. The analysis was carried out for the listed companies in the period 2007–2021, considering the period of COVID-19 and the compliance behavior with the changes in the EU regulatory policy. The results obtained by the authors showed that companies with a lower ESG reputation risk have reduced information asymmetry, are less financially constrained, and have better performance. Instead, Rahi, Akter, and Johansson [26] showed a negative relationship between ESG practices and financial performance, expressed by return on invested capital (ROIC), ROE, and earnings per share (EPS) proxies. The authors conducted a quantitative study on 39 sampled financial companies in Sweden, Finland, Denmark, and Norway for the period 2015–2019. The Thomson Reuters Eikon database was used for ESG and financial performance (FP) indicator data. From the perspective of the results, a negative relationship was identified between ESG and FP practices (return on equity and earnings per share, return on invested capital), but also a positive relationship between governance and return on assets.
On the other hand, Alareeni and Hamdan [35] investigated the relationships between ESG disclosure and firms’ financial (ROE), operating (ROA), and market performance (Tobin’s Q) and the extent to which they are positive, negative, or even neutral. The authors analyzed the S&P 500 listed companies in the USA during the years 2009–2018. The study revealed that ESG positively affects a company’s performance measures, but at the same time, the separate measurement of ESG sub-components showed that environmental disclosure (EVN) and corporate social responsibility (CSR) are negatively associated with ROA and ROE. Looking at the two different perspectives found in the literature, a common characteristic can still be identified, namely, the fact that overinvesting in ESG factors has a negative impact on financial performance, as it unbalances the company’s financial structure [36]. Also, Duque-Grisales and Aguilera-Caracuel [37] demonstrated that the financial performance (FP) of multinational companies in emerging nations is investigated to determine if is connected to higher environmental, social, and governance scores [38]. As outlined, there is a statistically significant link between an organization’s ESG score and its financial performance. Other scholars such as Garcia, Mendes-Da-Silva, and Orsato [39] suggested ESG performance should be examined in industries with high social and environmental repercussions, such as those that are susceptible to widespread societal taboos, moral disputes, and political pressures.

2.2. Text Analysis and Machine Learning in ESG and Financial Performance Analysis

Knowing the fact that there is an extremely high availability of data and electronic documents, the phenomenon of text analysis as a machine learning approach has gained momentum [40]. From the perspective of presentation, electronic data are divided into structured data or unstructured data. If structured data are generally easy to search and well defined, unstructured data contain complex data, for example, in corporate electronic documents [41]. Thus, considering the abundance of unstructured data, extracting knowledge from them is necessary to conduct studies and research [40]. In this direction, Angin et al. [2] tested various machine learning methods optimized for NLP-based text classification tasks to achieve success in classifying reports based on their relevance to SDGs.
Regarding keyword-based filtering, it has become popular in analyzing companies’ ESG characteristics [42]. Nevertheless, it relies on lexical combinations of simple error-prone query words or statistics, and successful text analysis requires understanding the semantics of the text. Distributed representation of words in vector space can surprise the syntactic and semantic relations of words. Representations of this kind [43] are learned from large bodies of text, and computed word embeddings are often used as features for a downstream task. The authors Goel et al. [44] extracted sentences from sustainability reports by matching word embedding vectors in a sentence with a taxonomy of ESG indicators. The sentences are then ranked by potential importance based on the presence of quantitative indicators and are used as data digitization methods for decision support mechanisms.
Raman, Bang, and Nourbakhsh [8] aimed in their research work at detecting historical trends in ESG discussions by analyzing transcripts of corporate earnings calls. From this point of view, the authors tried to exploit the latest advances in neural language modeling to understand the linguistic structure in ESG discourse. A first approach was to develop a classification model to rank the relevance of a text sentence to ESG. A pre-trained language model was refined on a small dataset of corporate sustainability reports for this purpose. The semantic knowledge encoded in this taxonomy model was then leveraged by applying sentences from the conference recording using a new method of remote monitoring. Extensive empirical assessments of diversified pre-training techniques demonstrated the proposed transitional learning framework performance. Following the results, the authors identified the that in the last 5 years, approximately 15% of the discussions during the earnings calls referred to ESG, meaning that ESG factors are integral to the business strategy.
Sharma, Gupta, and Gupta [10] conducted a study examining whether considering ESG data scores can lead to profitable investments while promoting sustainability. The authors’ experiment indicated that higher ESG scores will lead to better financial performance. They used ML models, such as linear and random forest regression, and they were shown to perform better when the training data set included ESG and financial data. The analysis resulted in a positive relationship between ESG data and financial growth parameters. In Margot et al.’s [45] research, a machine learning algorithm was developed to identify patterns between companies’ ESG profiles and financial performance. The machine learning algorithm consists of regularly updated rules that map areas in a multidimensional ESG feature space to forecast excess returns. Composite predictions are converted to scores that are used to filter investments for stocks with positive scores. This machine learning algorithm non-linearly associates ESG functions with financial performance. This is an effective stock screener that goes beyond traditional strategies that analyze stocks based on their ESG ratings. With the help of these powerful and non-linear techniques such as machine learning, researchers have found prevailing disclosures in a company’s ESG profile [45]. Gutierrez-Bastamante and Espinosa-Leal [6] proposed an evaluation of the degree of affinity of the Nordic companies’ reports published within Global Reporting Initiatives (GRI). To achieve this goal, they implemented and tested a series of NLP and text extraction techniques. Thus, strings, text bodies, and hybrid semantic similarities were extracted from the reports, and the models were evaluated through the intrinsic evaluation methodology. In order to complete the semantic evaluation, a quantitative ranking score was developed based on matching the indices. As the final results, Global Vectors for Word Representation (GloVE) and Latent Semantic Analysis (LSA) seemed to be the best methods for the study undertaken by the authors. According to them, their findings will lead to an automatic process of evaluating sustainability reports, which could have an impact on the environment. Following the same NLPs algorithms, the results of the study conducted by Huang, Wang, and Yang [4] indicate that the proposed model for extracting information from financial reports, created by the authors and called FinBERT, outperformed other NLPs in sentiment analysis, and the proposed algorithms identify patterns without mislabeling, using contextual data in financial texts. The major advantages of FinBERT, created by Huang, Wang, and Yang [4], are especially noticeable in the case of small samples and in situations where texts contain concepts that are not frequently used. Another noteworthy aspect for our approach is that FinBERT is better at identifying patterns in reported data on ESG actions. Also, another relevant study to our explorative approach is of Nitlarp and Kiattisin [3], who conducted their ESG content analysis based on machine learning techniques using Leximancer v5.0 software.

3. Materials and Methods

3.1. Sample Selection

The sample of Romanian companies listed at the Bucharest Stock Exchange (BSE) was established based on the information published on the BVB Research Hub platform, https://bvbresearch.ro/, accessed on 16 February 2023, related to reported ESG scores, following the analysis carried out based on the reports and information made public for 2021 by the Sustainalytics rating agency. Starting from these scores calculated based on the Sustainalytics ESG Risk Ratings Methodology [46] and the public information found at https://bvbresearch.ro/ReportDashboard/ESGScores, accessed on 16 February 2023, the sample consisting of 19 companies was formed. Of the 19 companies, 2 are banks and the other 17 carry out business activities in the following fields of activity: oil and gas, energy, pharmaceuticals, real estate, plastics, etc. The data collection period for the financial performance indicators was 2017–2021, through accessing the data available on the EMIS platform. For the ESG information, it was the year 2021. Where sustainability reports published in previous years were found, they were inventoried and examined using Leximancer v5.0 software to extract key concepts and significant themes prevalent in the reporting.

3.2. Data

Financial performance represented and still represents an objective for economic entities, but it is also a subject of attention for researchers in the field. In our approach, we started the research by establishing the support database in identifying the answers to the research questions we proposed. We established this database for entities whose securities are traded through the Bucharest Stock Exchange (BSE) and for which ESG information has been published on the BVB ResearchHub platform. Thus, by accessing the EMIS platform (https://www.emis.com, accessed on 16 February 2023), we collected the indicators that we considered relevant for our research, some of them dedicated to assessing financial performance. The period for which data on financial indicators were collected is 2017–2021, for all 19 companies for which ESG scores for https://bvbresearch.ro/ReportDashboard/ESGScores, accessed on 16 February 2023, were identified, and were published for 2021. The indicators for which information was collected were grouped into the following categories: size indicators that differentiate the types of economic entities in Romania, turnover, the annual average number of employees, and total assets. The total equity indicator was also added, as well as financial performance measurement indicators, net profit/loss for the period, cash and cash equivalents, return on assets (ROA), and return on equity (ROE). All values are expressed in million lei, except for the ratios (expressed in %) and the average number of employees.
For the ESG information analysis, public information from five categories of sources was consulted: those published in the sustainability reports written in Romanian and English existing on the companies’ websites; those from the sustainability reports published by BVB; those included in the annual integrated reports of the selected companies; the public ESG information available at https://bvbresearch.ro/ReportDashboard/ESGScores, accessed on 16 February 2023; and the ESG information made public on the companies’ websites at the specific button, called ESG. The ESG information was collected manually, and the information published in the sustainability reports of the selected companies was mainly used.
Out of the 19 sampled companies for 17 companies, sustainability reports and ESG information were published in English, and for 9 companies, sustainability reports published in English for the years preceding the analyzed year (2021) were found to be published for a previous period of more than 2 years. Four companies have a distinct ESG button created on their website for communication, and only three companies of these have ESG information published in English as well. Only one pharmaceutical company (ATB) disclosed ESG information in its integrated report prepared for 2021, and six companies disclosed ESG information as non-financial information in the non-financial report or statement prepared for prior years also. Most companies also published ESG information in the annual report prepared for 2021, the analyzed year. All ESG data were centralized into separate files to facilitate data processing using statistical software.

3.3. Methodology

In the first part of the research, the analysis started from previous studies [47,48,49,50,51,52,53,54] that linked financial performance, measured by indicators of profitability and liquidity, with different variables with a social, governance, or environmental component and proceeded to determine the average values of ROA, ROE, NetProfit, and Cash_Liquid indicators for the analyzed period. Following the determination of the average values of the financial indicators, the general average score of financial performance was determined, which facilitated the classification in the performance classes and subsequently the ranking of the companies according to the general score granted for financial performance. To quantify the ESG disclosed information, the followings were used: the GRI standards taxonomy [14], the scoring technique, and the information weight calculation, as well as data presented in the sustainability reports of companies, published in Romanian and English. The reviewed and examined information from the 2021 sustainability reports was the general information reported and noted according to the compliance to GRI 1–3 [14], sector information by the compliance to GRI 11–13 [14], business economic performance data by the compliance degree with the GRI 201–207 standards [14], environmental information by the compliance degree with the GRI 301–308 standards [14], and social and governance information by the compliance level with the GRI 401–418 standards [14]. Moreover, data reported on the sustainability materiality matrix and analysis, disclosing the GRI index for cross-examination of data reported in the text of reports and the applied GRI standards [14] for preparation, and the information reported on integrated business and sustainability strategy were analyzed. To assess all ESG information disclosed by companies that is available in their sustainability reports, the scoring scale from 0 to 7 was used. Following the Sustainalytics ESG Risk Ratings Methodology [46] and the data publicly available on the BVB Research Hub platform at https://bvbresearch.ro/ReportDashboard/ESGScores, accessed on 16 February 2023, the scoring scale used for ESG data and ESG risks disclosed by the selected companies is presented in Table 1.
To facilitate the analysis of the assigned scores for the disclosure degree of ESG information and ESG risks, the average value of the scores granted for each examined ESG item was determined. Also, assigned mark weights were determined for the E, S, and G disclosed data, as well as for the materiality matrix, in the total mean value granted for information presentation. After finalizing the collection of financial data from the company’s annual reports and from the EMIS data platform, financial indicators were grouped into 2 categories: size indicators and financial performance indicators. Indicators of size, total assets, turnover, the average number of employees, and equity were used in this stage of the research process for the classification of companies by size (very small, small, medium, large, and very large), while ROA, ROE, Netprofit, and Cash_liquidities ratios were used to measure financial performance. The purpose of the first stage of the research was to group and rank the sampled companies according to their size, financial performance, and ESG performance, and finally to be ranked according to an overall average score, FinESG, determined based on an overall performance score (Financial + ESG), following the methodology of Ban et al. [55].
In the second phase of the research, based on the ranking results of companies by their integrated performance, FinESG, we proceeded to investigate and analyze the content of the sustainability reports of the top 5 companies according to the overall integrated performance and a company chosen according to its position in the ranking by ESG performance. With the help of Leximancer v5.0 software, we proceeded to continue extracting the salient concepts in the analyzed reports and further proceeded in the analysis of dominant themes, according to the significant link between concepts and themes identified by the software. Thus, all the sustainability reports found for the sampled companies and available in English were converted with the help of Leximancer into .csv files, and we explored the key concepts and thematic links. To visualize the significant results of the analysis, Tableau version 2023.1.0 and Python version 3.7 software tools were used. Leximancer is a computer software that performs quantitative content analysis using machine learning techniques. It learns what the key concepts of a text are and how they relate to each other. It performs thematic analysis and relational (or semantic) analysis of the reviewed data. According to Smith and Humphreys [56], Leximancer uses a method for unsupervised conversion of information that occurs simultaneously from the vocabulary of a natural language into semantic models. It uses two stages of co-occurring information extraction—semantic and relational—using a different algorithm for each. The algorithms used are statistical, but they use nonlinear dynamics and machine learning. Leximancer uses a combination of techniques such as Bayesian statistics that record the occurrence of a word and associate it with the occurrence of a range of other words. It then quantifies these outputs by encoding chunks of text from single sentences to groups of sentences [56].

4. Results

Companies listed on the Bucharest Stock Exchange (BSE) have been the subject of numerous and various studies analyzing the practices and quality of financial reporting, alongside the recent interest of works focusing on the link between financial and non-financial reporting, business performance, and reporting quality. Large and very large entities, with their size being expressed by total assets, have a higher quality of financial reporting. They prepare and communicate financial information of substantial quality; report higher operating cash flow; and provide relevant, quantitatively rich reports and a lot of information to the stakeholders [57]. While Caratas and Stanciu [58] examined how Romanian-listed companies comply with the non-financial reporting framework and concluded that a small number of companies fully comply with international standards, Belenesi, Bogdan, and Popa [59] observed a slow but constant increase in the amount of non-financial information disclosed, but also in the indicators by which this information is expressed, with a positive impact on stakeholders. Among recent studies that analyzed the quality of financial and non-financial reporting of Romanian listed companies are the works of Hategan, Curea-Pitorac, and Hategan [60], who investigated the level of communication with investors, as well as the essential parameters that support communication such as profit, trading portfolio, dividend decisions, typology of majority shareholding, and the extent of non-financial information reporting, and Nechita et al. [61], who argued that these companies in recent years are increasingly concerned with the compliance to GRI standards [14] by preparing non-financial reports. This exploratory study is part of the current research trends in the field of content and quality of financial and sustainability reporting (ESG), with the central objective of examining through a sample of pilot companies the way ESG information is disclosed and the correlation of financial performance with the quality of sustainability reports through qualitative analyses of classifying, ranking, and content investigation.

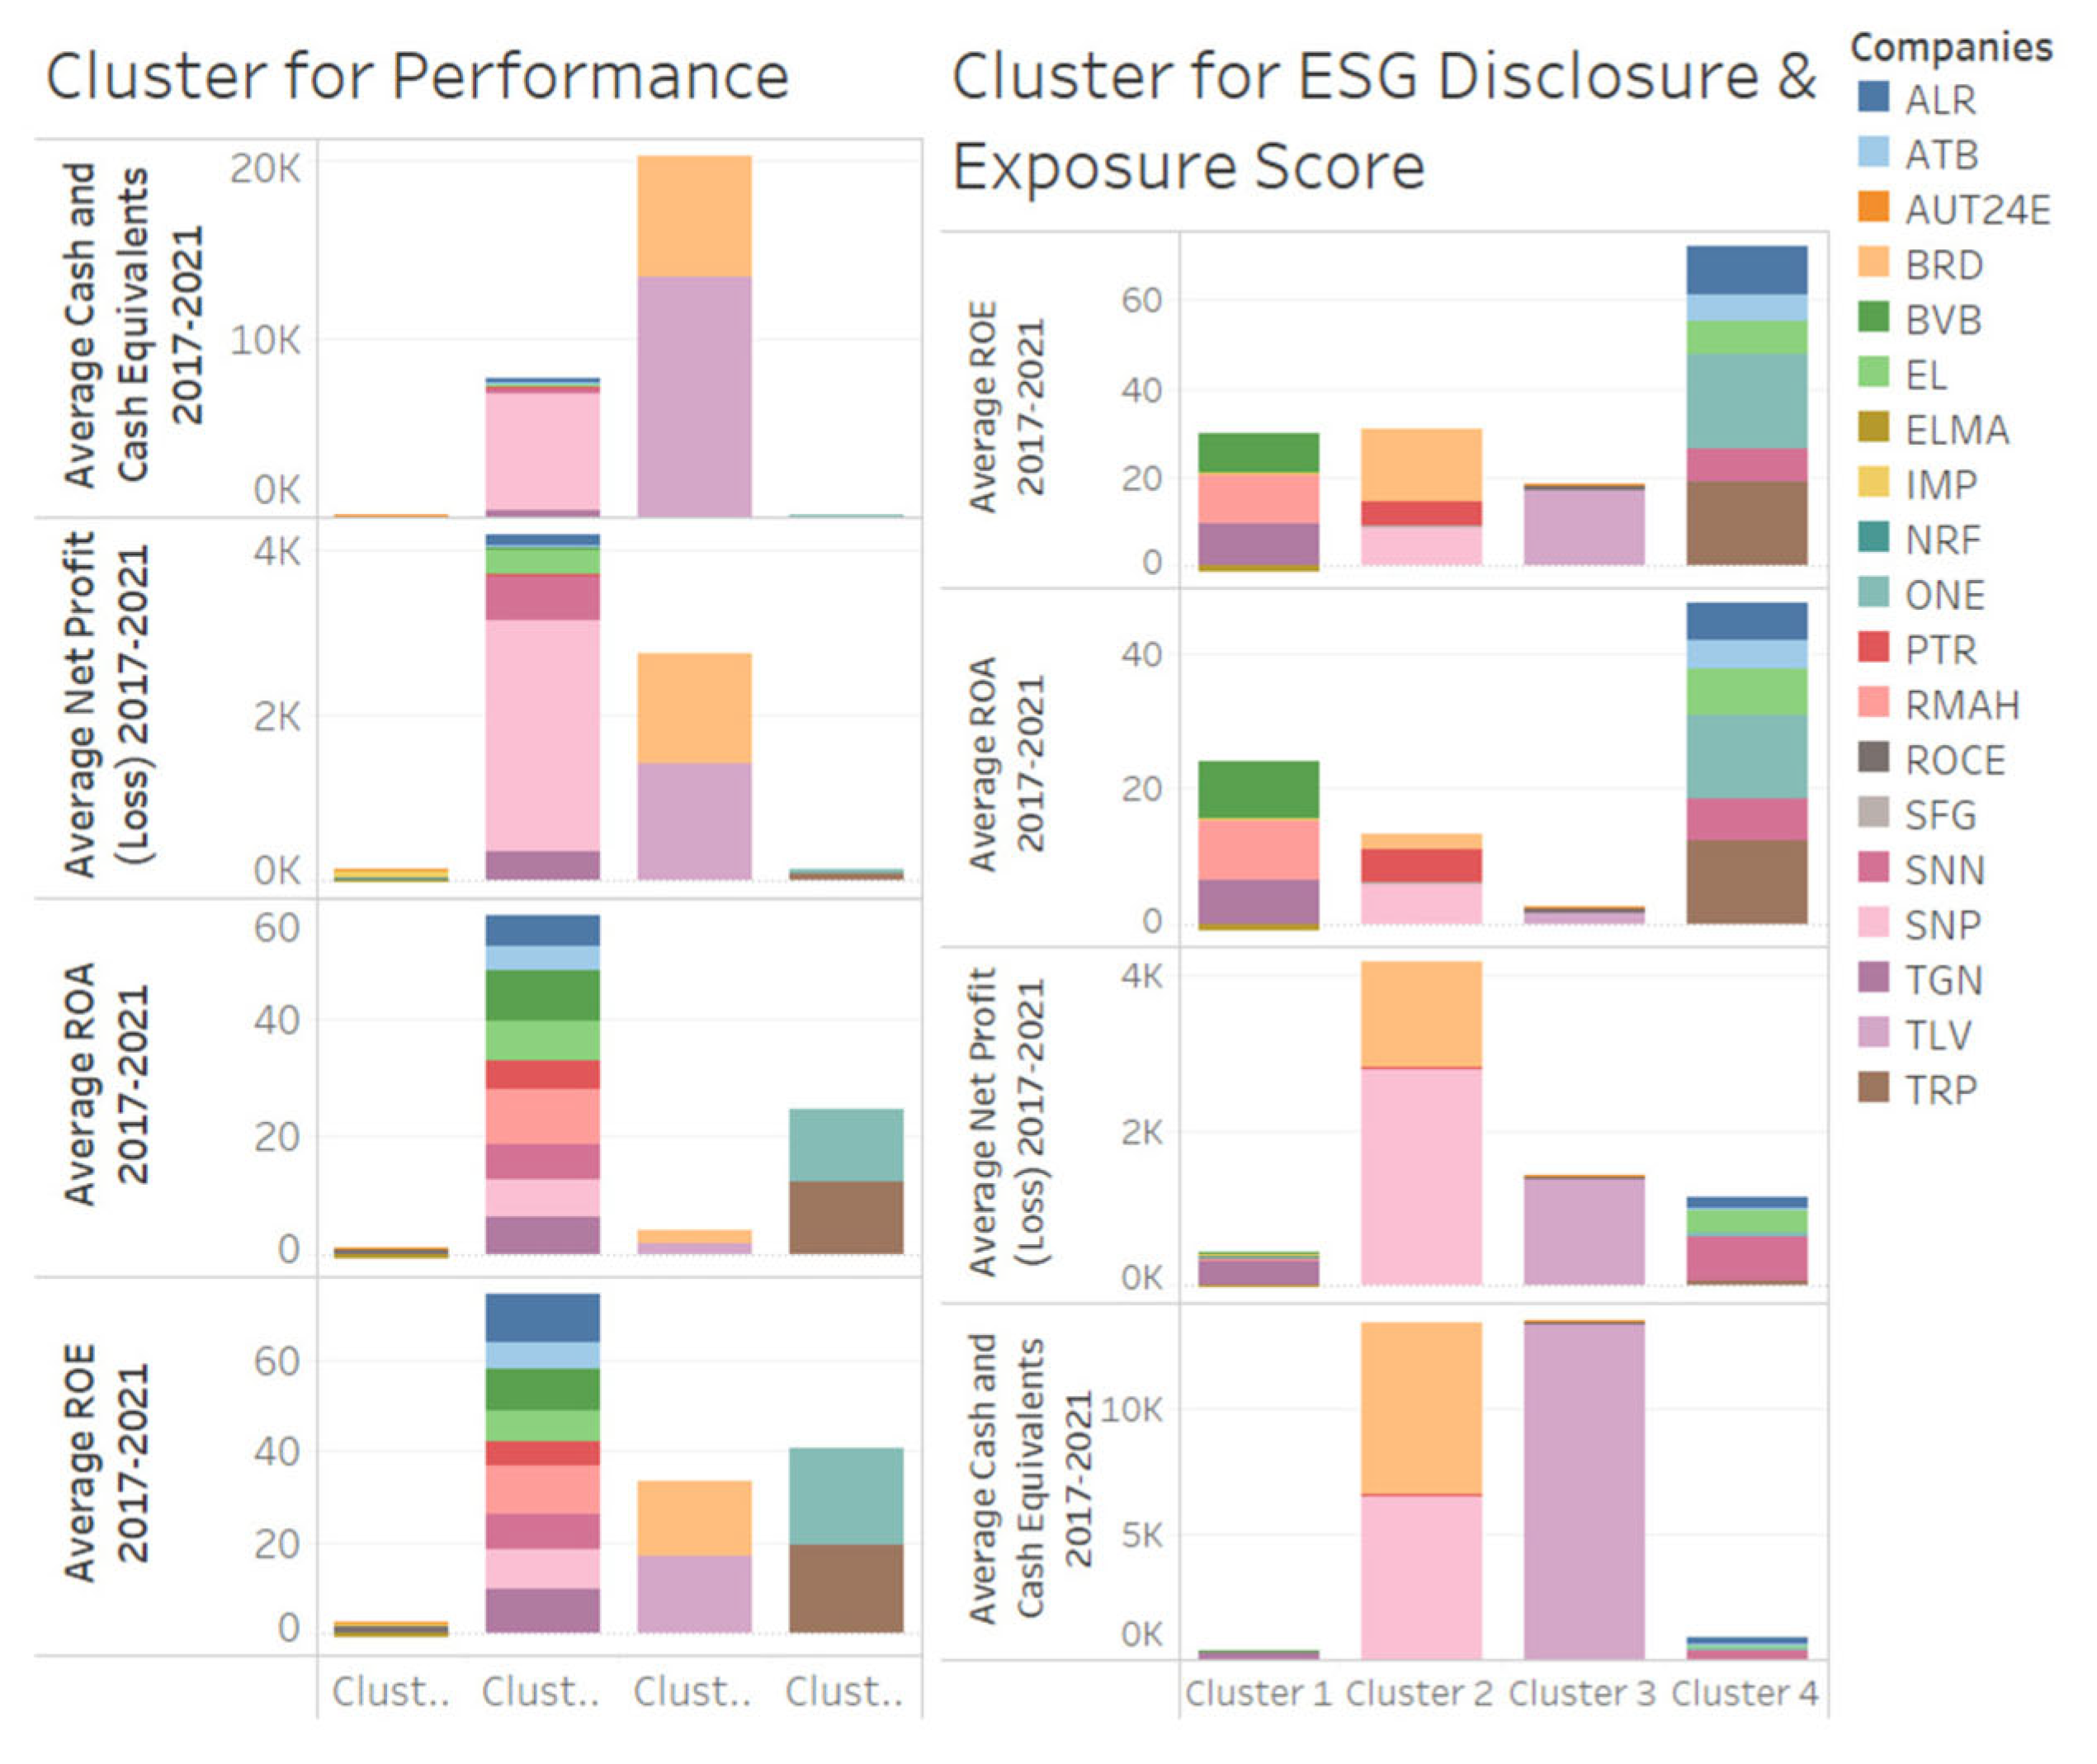
4.1. Analysis and Clustering of the Companies by Size and Financial Performance

The first category of indicators collected for the analyzed companies concerned the size indicators, the calculation of their average values, and the clustering of companies according to their size. Thus, the average values recorded by the indicators, the average number of employees, the value of net turnover, the value of total assets, and the value of equity led to the selection of the selected companies in the following size classes: E—very small, D—small, C—medium, B—large, and A—very large. The comparative analysis (Figure 1) of the average values of the financial performance indicators for the 5 years with the value of the indicators for 2021 revealed the fact that their trend was maintained, which entitled us to continue the exploratory approach by considering the average values to determine the general score assigned for the financial performance.
Further on, the 19 companies were clustered, according to the average values of ROA, as well as ROE financial indicators. According to Alsmady [62], relevant and quality financial data delivered to users have a beneficial effect on the performance of companies, measured by the use of indicators such as ROE, ROA, and EPS, leading to the reduction of information asymmetry and generating economic stability in the future. In this study, only ROA and ROE indicators were selected for the clustering of companies, as they are the most frequently used financial indicators in the literature for measuring financial performance. These are traditional financial performance measurement indicators [63], studied by processing based on econometric models [64] or in interdependence with other financial performance measures, profit margin, profit growth rate, or added economic value [65]. Dănescu and Popa [66] argue the beneficial impact of corporate governance on a company’s financial performance by showing that the extent to which companies comply with reporting rules influences the ROA indicator. Also, even statistically significant links were determined between the presence of women in the management team and these financial indicators [51,67]. The results showed four clusters (Table 2).
Cluster 2 includes most companies, nine in number, and SNP, SNN, and TGN were among the best performers in terms of financial performance, measured by the average values of the indicators for the five years analyzed. Cluster 3 is made up of the two banks, BRD and TLV, both with high financial performance. At the opposite pole with a weaker financial performance were the companies in Cluster 1, ELMA, NRFR02, and ROCE, registering the most modest average values of the financial indicators.

4.2. Content Analysis of Sustainability Reports

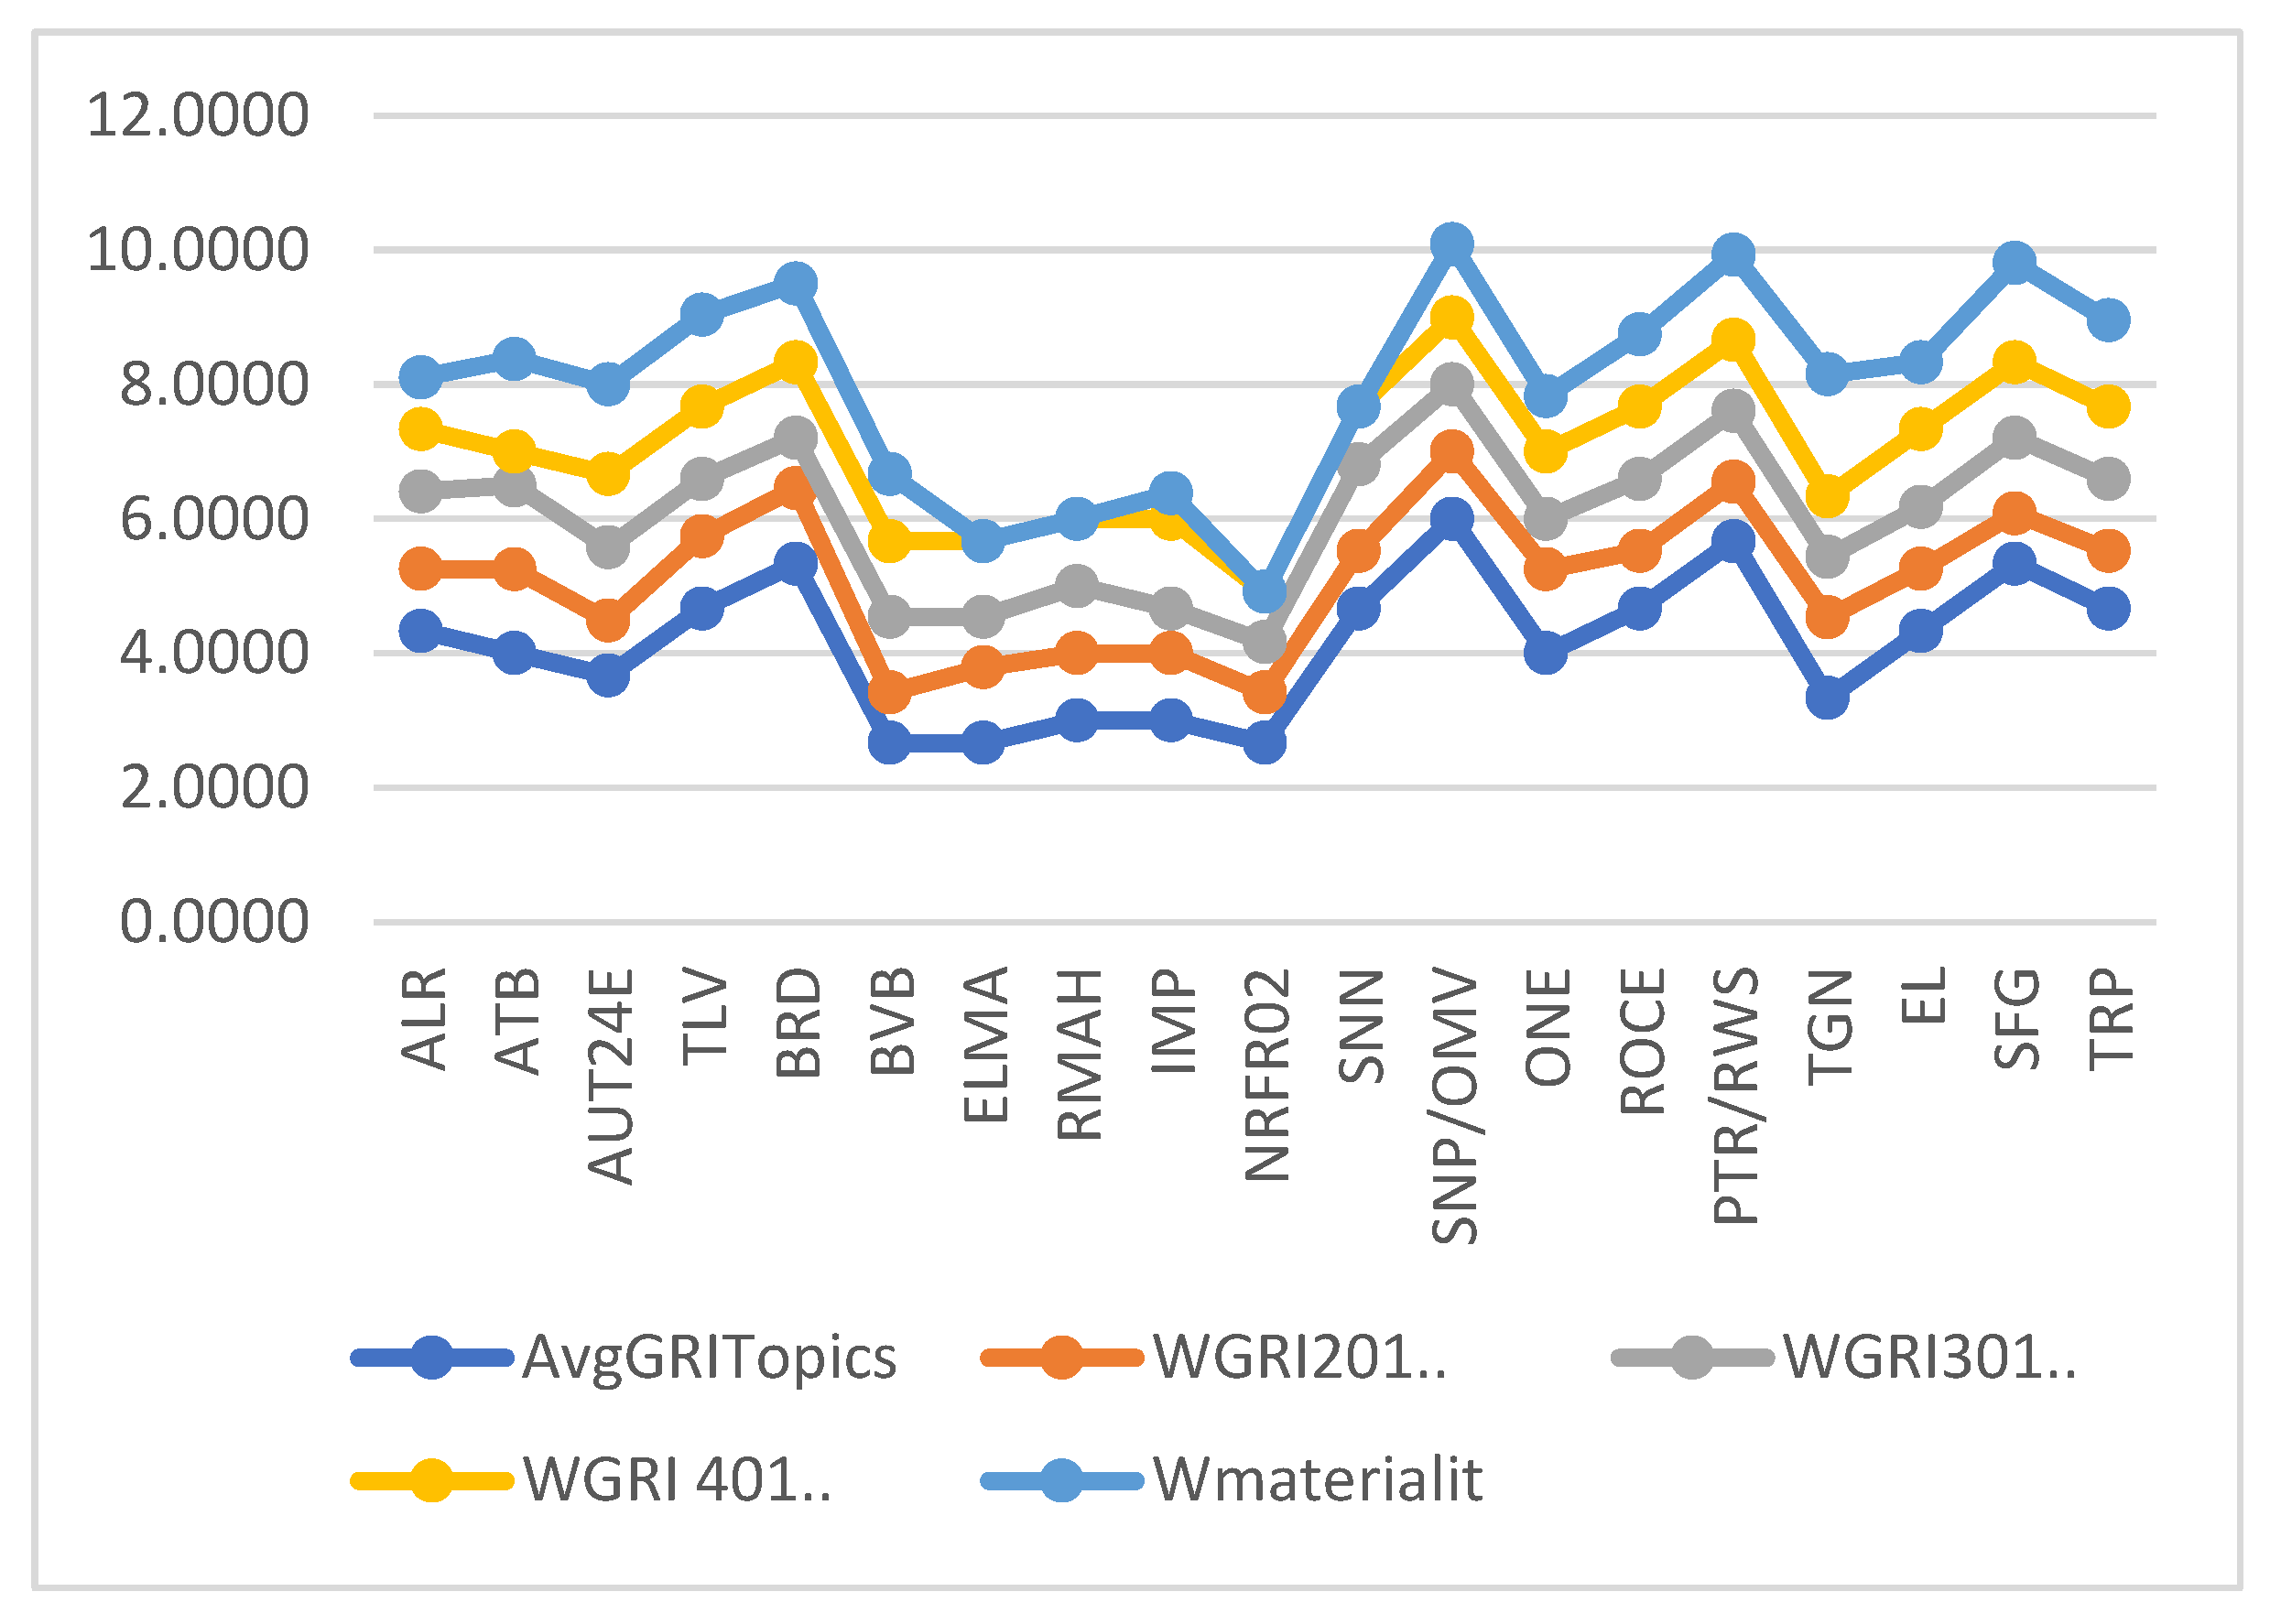
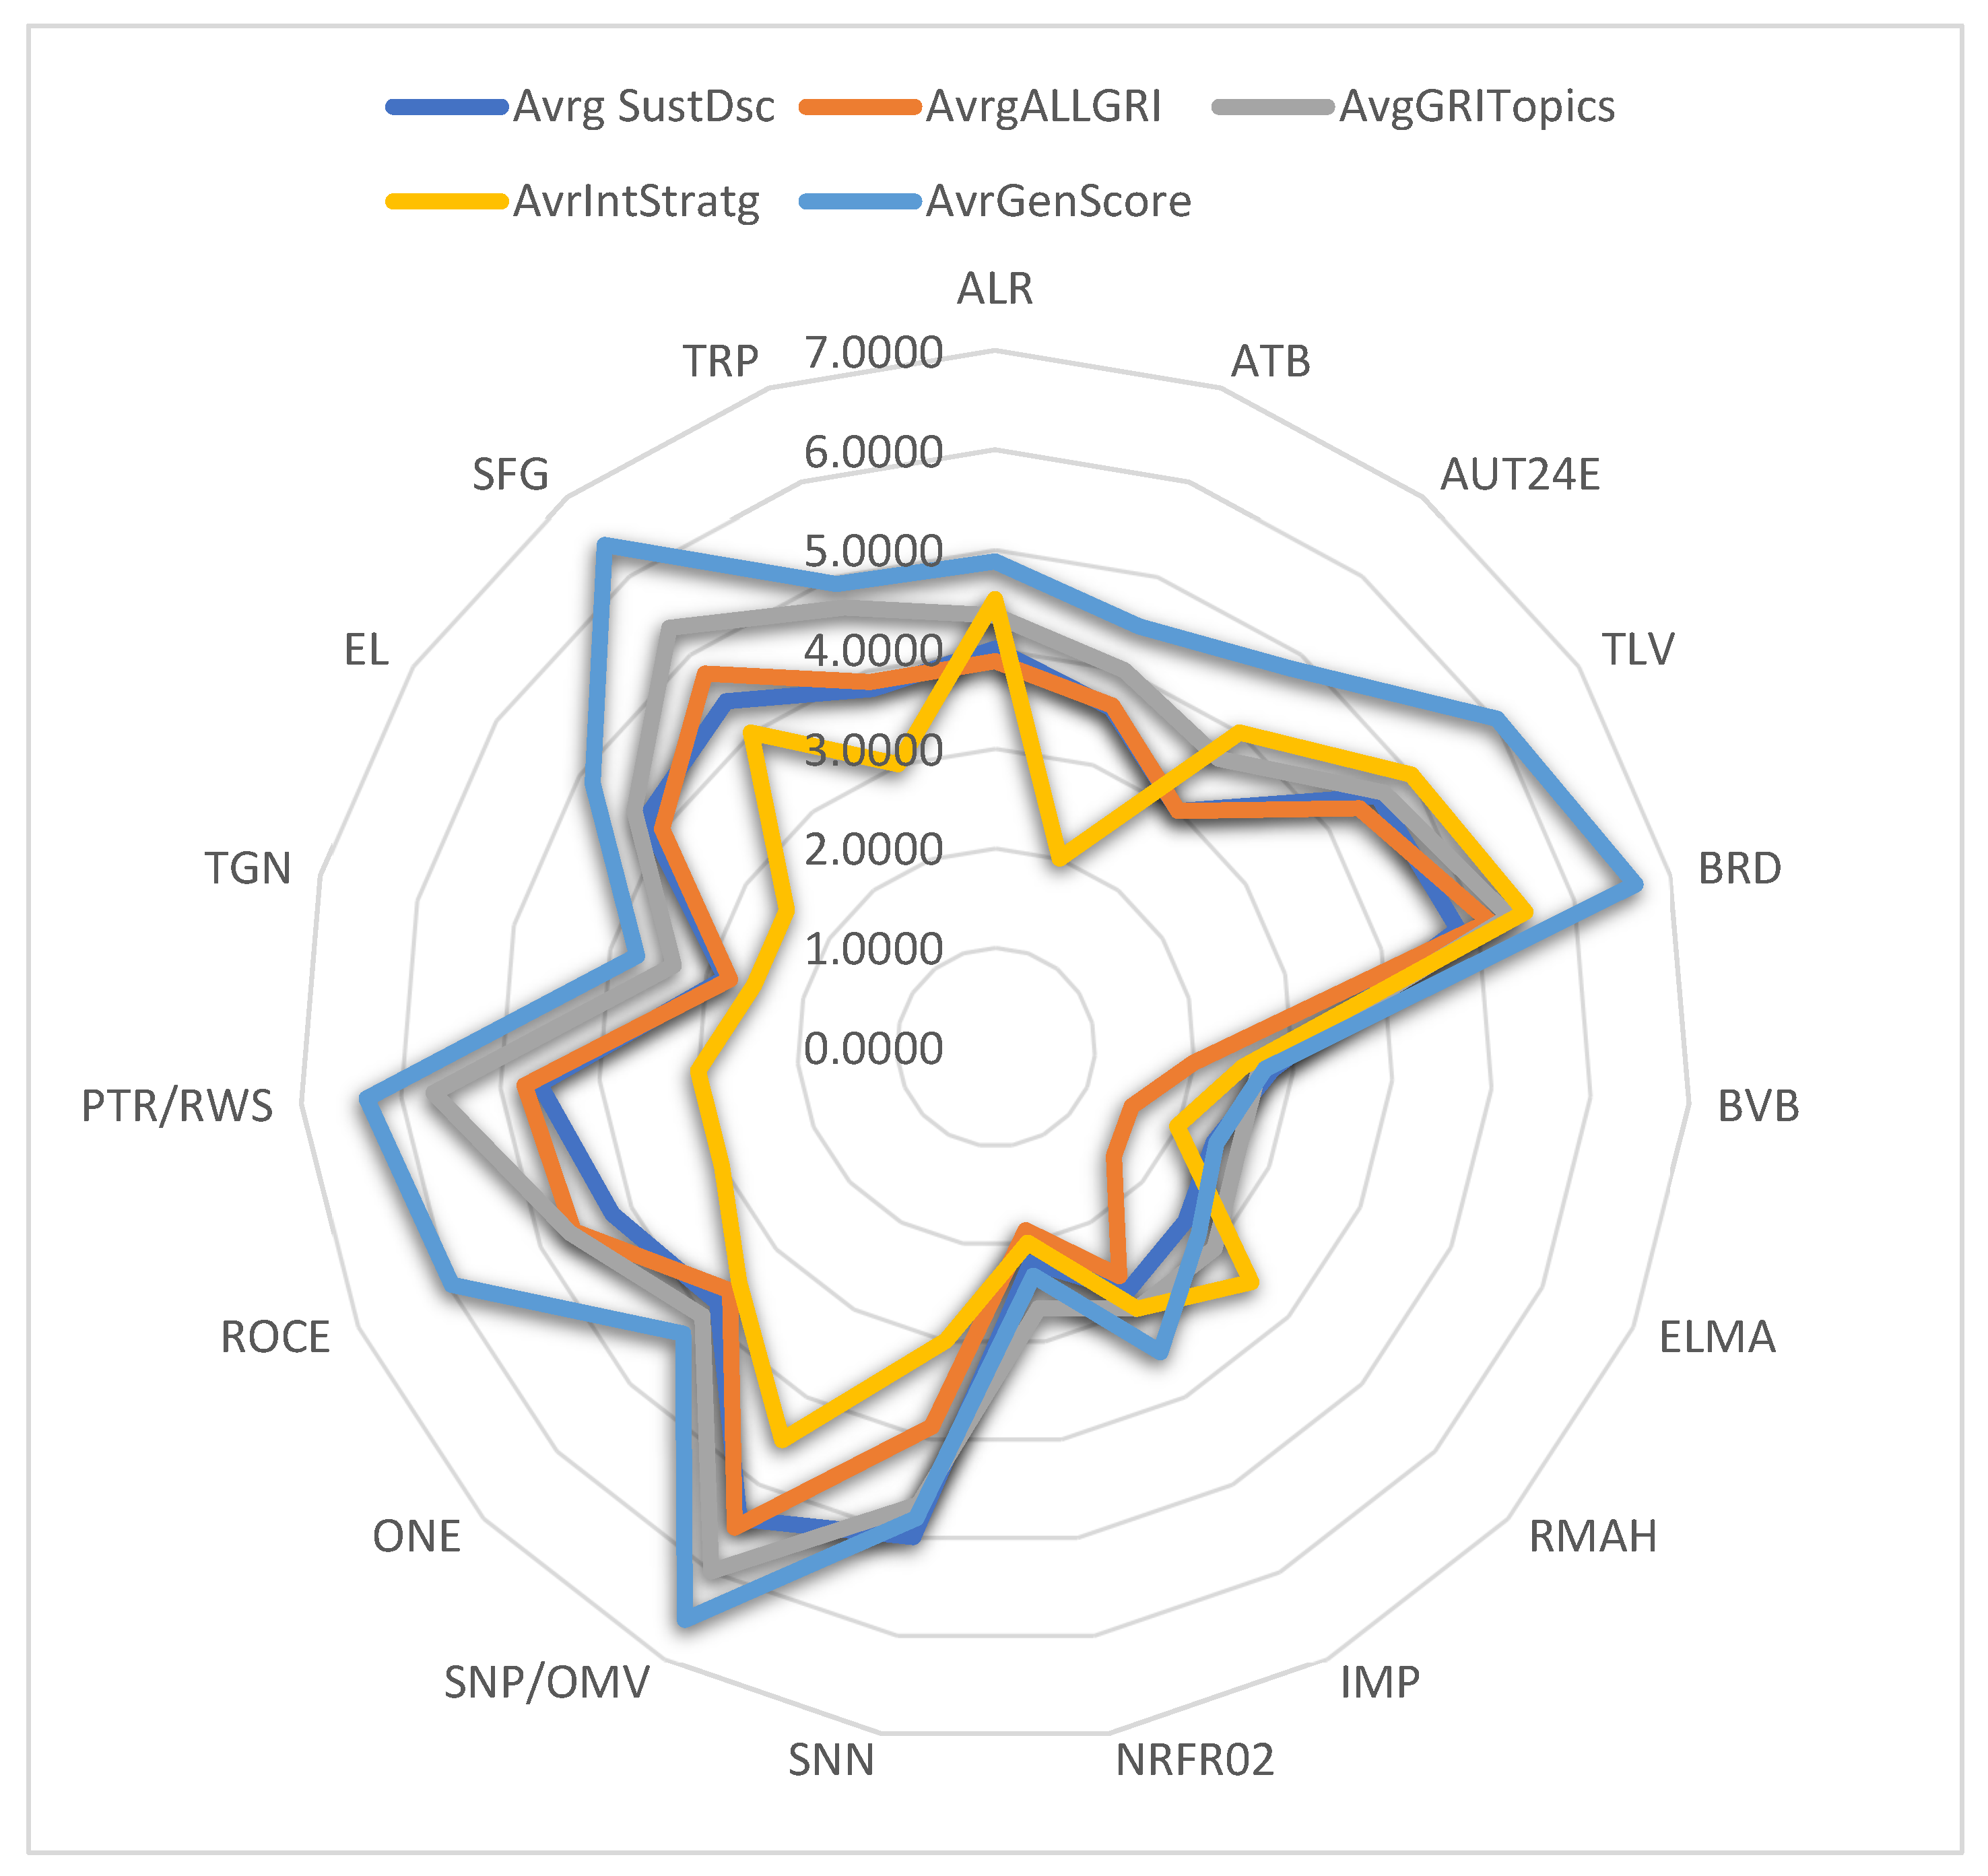
4.2.1. Analysis of Disclosure Scores on GRI Topics and Materiality

In the framework of this analysis, we aimed, after scoring the disclosure degree of ESG information contained in the sustainability reports read in Romanian, correlated with the GRI standards [14] grouped by topics, GRI 201–207, GRI 301–308, and GRI 401–418, and the information in connection to the materiality matrix, to identify the highest disclosure degree by E, S, and G components, but also to determine the weights of disclosure scores on each topic in the average disclosure degree of all GRI topics, as well as the weights of materiality scores in the total average disclosure score of the reviewed information. The results revealed that the highest average disclosure score of information was registered for the social and governance components (4.2105), related to the topics covered by GRI standards 401–418 [14], followed by the average disclosure score for the environmental component (4.1052), related to the topics of GRI standards 301–308 [14]. The lowest average disclosure score (4.0000) was recorded by business economic performance data, covered by standards 201–207 [14]. The best scores for economic performance information disclosure were recorded by the companies BRD and SNP, for environmental information disclosure; the best performers were SNN, SNP, RWS, and SFG, and in the case of social and governance information, the highest marks were obtained by BRD, SNP, RWS, and SFG. The average disclosure degree of ESG information, aggregated on the three topics, and correlated with GRI standards 201–207, 301–308, and 401–418 [14], registered the value of 4.1403, the highest degree of the disclosure being recorded by SNP (Figure 2). Depending on the applied scoring scale presented in Table 1, it can be interpreted as an average disclosure level on ESG components and GRI topics, located between a satisfactory and a good level of disclosure. The average disclosure score on the materiality matrix of sustainable development themes recorded the value of 3.6842, a value that indicates that, except for some companies (SFG, SNP, TLV, BRD, RWS), the majority do not assign real importance to the analysis of sustainability themes, according to the interest of stakeholders, as well as company management.
The preliminary conclusion that can be formulated following the analysis of the average disclosure scores on ESG components and GRI topics was that even though the concern of companies is an obvious increase for the reporting of sustainability information, the correlation of the recorded values with the average disclosure score of information on the materiality matrix demonstrated the still early stage of development of companies in the field of authentic sustainability reporting. It is quite clear from the analysis of the average disclosure scores that there is a need for a real improvement in the sustainability reporting and disclosure on ESG components in correlation with the materiality and sustainability objectives pursued from the perspective of impact on all stakeholders, as well as on integrated business strategies.

4.2.2. Analysis of Average ESG Risk Scores

As presented in the Section 3.3, in this study, grades were awarded for the ESG risk scores determined by the Sustainalytics rating agency and were publicly made available for the selected companies through the BVB Research Hub platform, at the time of its consultation, in February 2023. Thus, the scores of the ESG risk indicator, which measures the level of ESG risk that is not managed by the company, were analyzed and graded. A higher grade means a more limited range of unmanaged ESG risk. Similarly, the score calculated according to the Sustainalytics methodology was graded for the company’s exposure to material ESG risks. This indicator includes the particularities of the subsector in which the company operates, as well as its characteristics, such as its business model. A higher grade indicates a lower level of exposure to the company’s material ESG risks.
The company’s Sustainalytics score was also graded for how well the company’s management manages the recognized ESG risks. Management of ESG risks by the company management team is based on published sustainability strategies, policies, and practices. Thus, according to our methodology, higher points indicate better management performance in managing the identified ESG risks. Following the awarded points (Table 1) for the three categories of ESG risk scores, the average calculated values led to the following results: the best performance for ESG risks were obtained by the PTR company, and the worst performance was recorded by NFRF02. Analyzing the grades awarded for exposure to ESG risks, the best-ranked company was found to be AUT24E, and from the perspective of managing ESG risks as effectively as possible, the best performer proved to be SNP/OMV Petrom; at the opposite pole with poor performance was ELMA. In terms of overall average points, the highest average value was recorded by the ESG risk management indicator (16.8618), followed by the average value of the ESG risk indicator (14.2806), and the lowest average value was registered for the exposure indicator of companies to material ESG risks (1.4192).
Consequently, we can formulate a preliminary conclusion, namely, that from the key aspects related to the risks involved in ESG reporting and disclosure, companies are mainly concerned with the effective management of ESG risks, from which results the need to identify and implement new sustainability piloting tools and ESG disclosing practices.

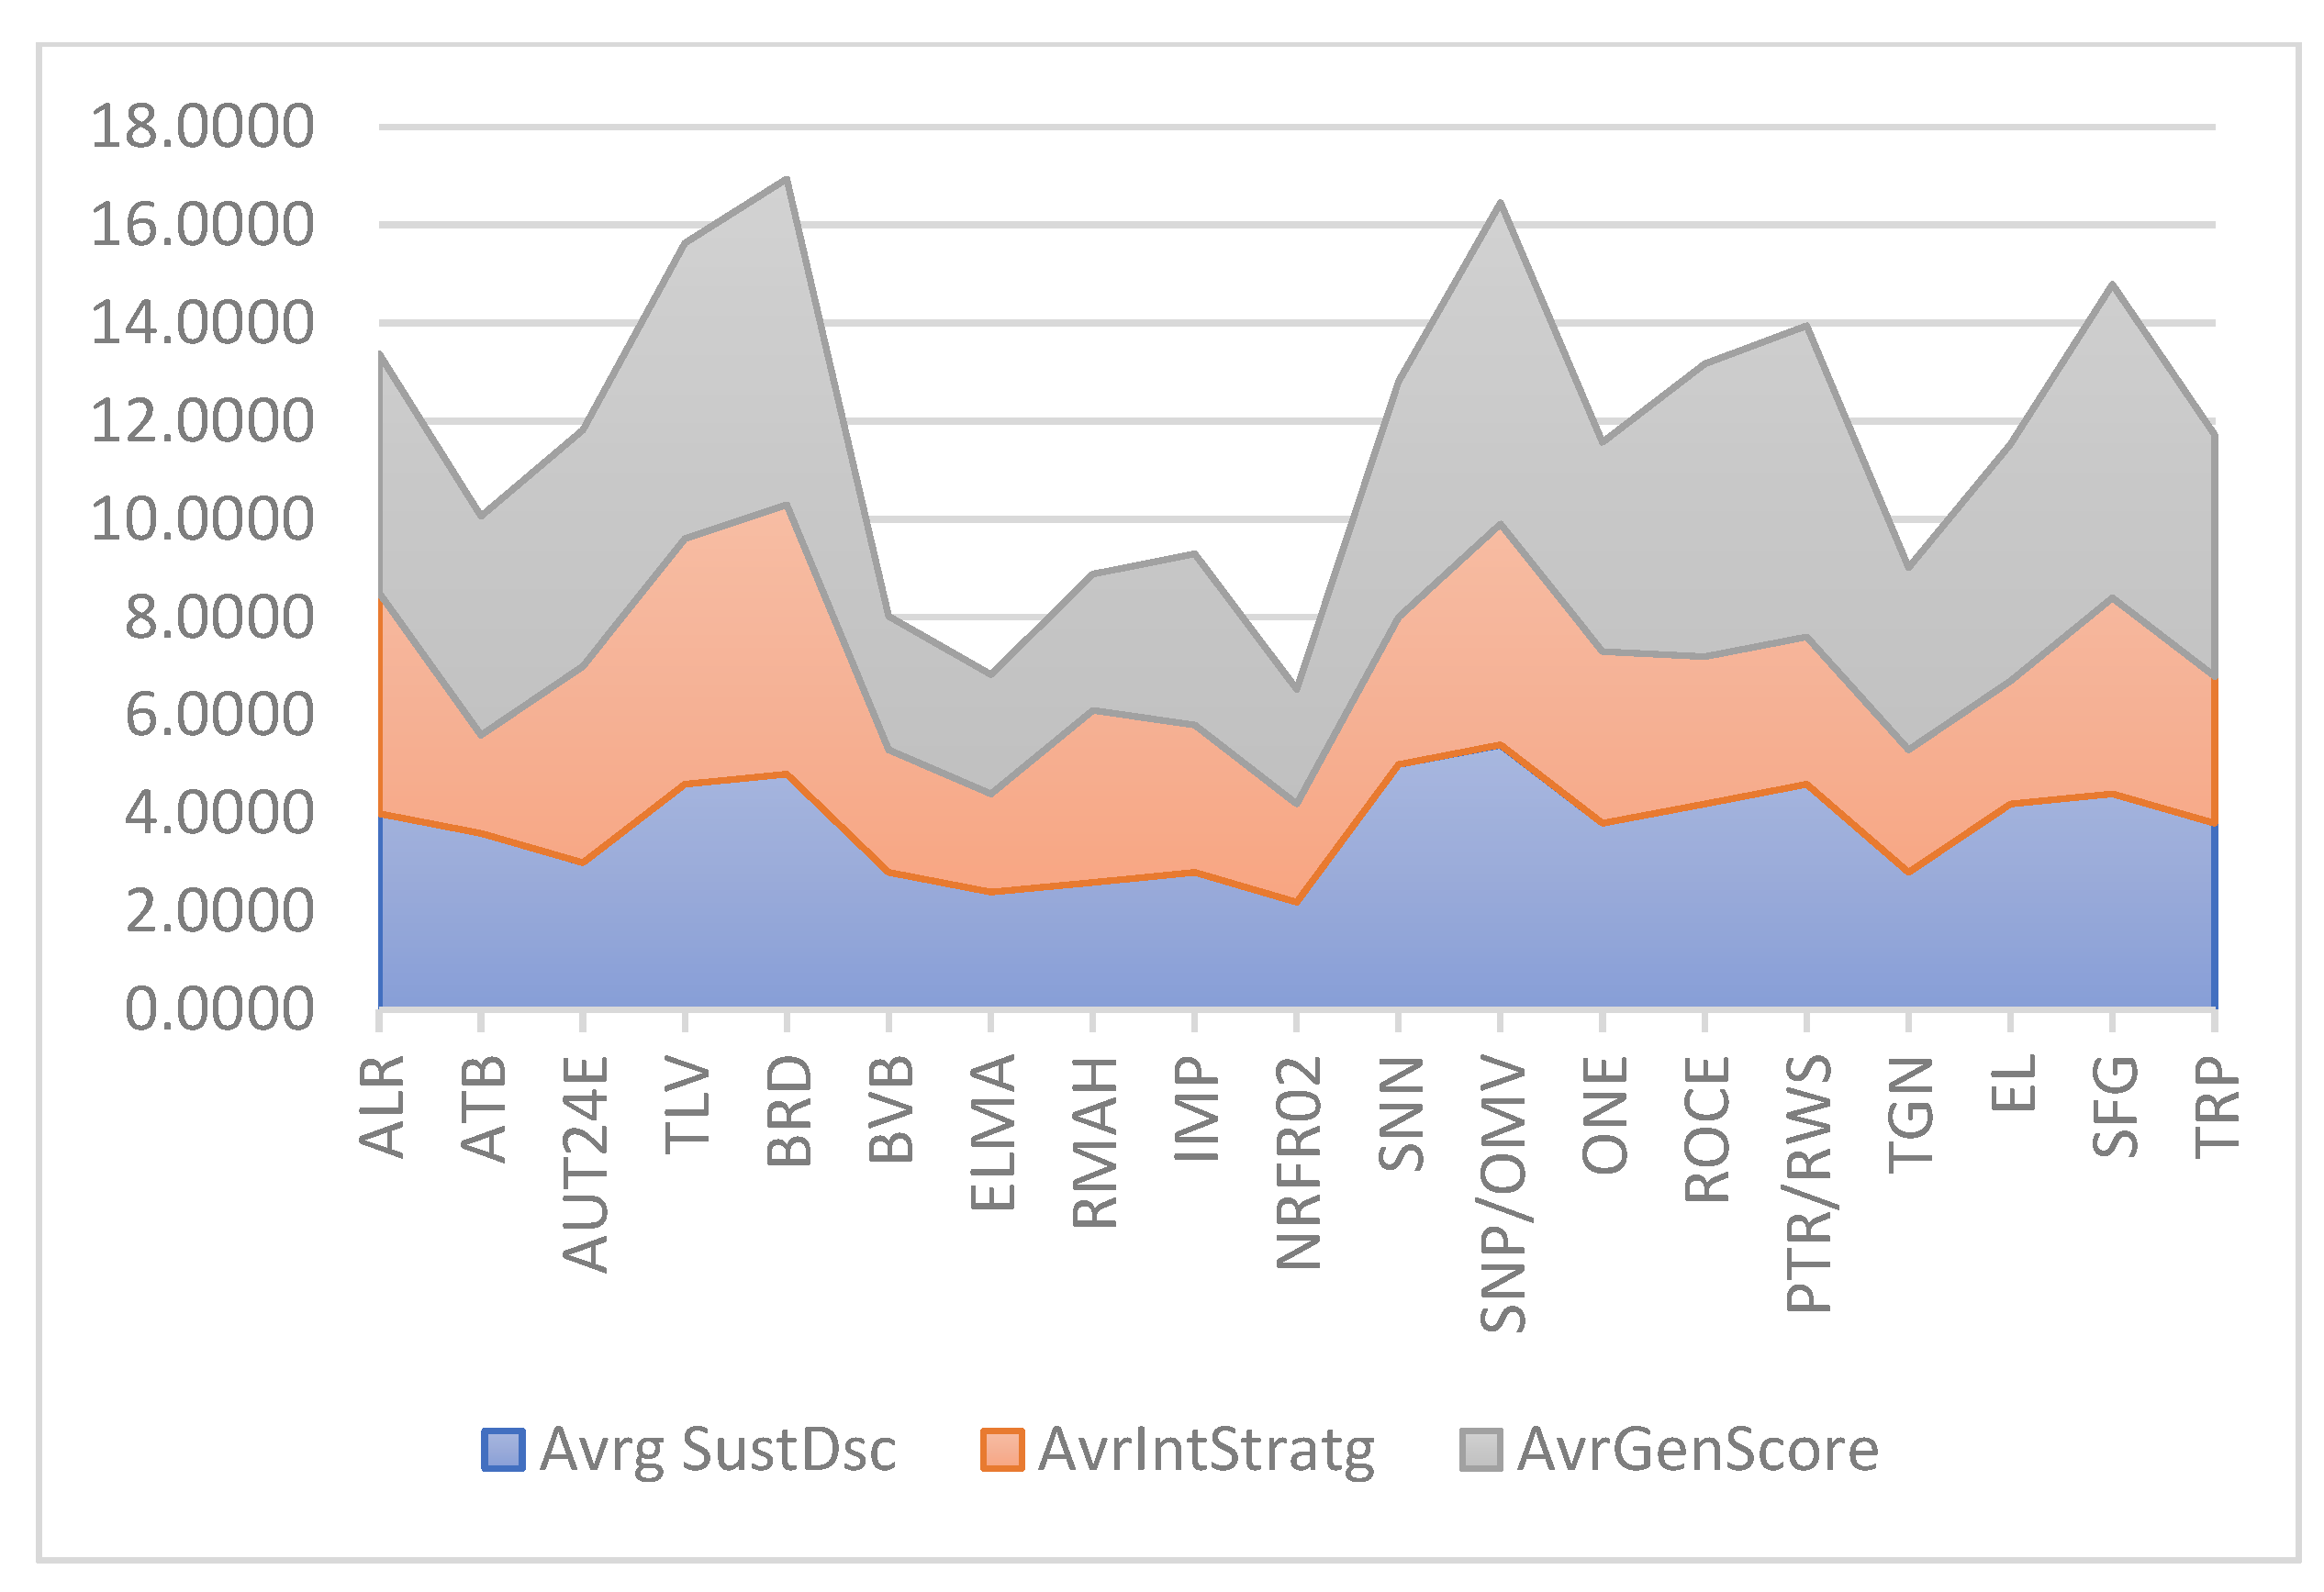
4.2.3. Analysis of Average Disclosure Scores on Integrated Business and Sustainability Strategy

For most Romanian-listed companies, non-financial reporting is a compliance issue. According to the report “ESG—Opportunity to change strategy?” Elaborated by PricewaterhouseCoopers (PwC) Romania in collaboration with the Bucharest Stock Exchange in 2022 [68], only 30% have the plan to deliver on ESG goals, and only 10% have an integrated and sustainable business strategy. For these reasons, the sustainability reports of the selected companies were graded for disclosure and description of the integrated business model and the integrated sustainability strategy.
The best disclosure of the Integrated business model was identified in the case of the BRD company, while the best-rated companies from the sustainability strategies were TLV, BRD, and SNP. The average disclosure score on information regarding the integrated business model recorded a much lower value (2.5263) than the average score for the information regarding the sustainability strategies (4.1052). Therefore, at the time of the qualitative examination, we noticed that the 19 companies were ready to report and disclose data regarding the sustainability strategy but provided little and vague information regarding the business model and whether this model is an integrated one. The average aggregate disclosure score (Figure 3) on integrated business and sustainability strategy information (3.3157) was analyzed in comparison with the average disclosure score on sustainability information from the peer-reviewed reports (3.7368) and with the overall average disclosure score of all inventoried and graded ESG information (4.6517).

4.2.4. Analysis of Sustainability Average Disclosure Scores

The aim pursued in this section was to determine and compare the average disclosure scores of sustainability information for all GRI aspects included by companies in their sustainability reports drawn up for the year 2021, the average disclosure score on ESG components, and topics from the GRI 201–418 standards [14], as well as the average disclosure score obtained for the integrated business model, and the communicated sustainability strategy. The total average disclosure score obtained for disclosing all sustainability aspects covered by GRI was 3.5460, lower than the average score recorded for disclosing ESG information on GRI topics 201–418 [14] (4.1403), but higher than the average disclosure score recorded for reporting and disclosure of the information on the integrated business model, as well as sustainability strategy (3.3157). The best average disclosure score for reporting all sustainability aspects covered by the GRI was recorded by SNP. The average sustainability information disclosure score that also included the score given for the GRI index used, as well as the compliance statement, was 3.7368, with the best score also recorded by the SNP company. Considering all peer-reviewed sustainability information from the sustainability reports of the sampled companies for the year 2021, we calculated an overall average disclosure score for which the obtained value was 4.6517, indicating a medium to good reporting and disclosure performance (Table 3).
According to the value of the general sustainability information disclosure score (Figure 4), the best-ranked company was BRD, with an average score of 6.6415, followed by SNP, with an average score of 6.5528, and PTR with 6.3413. The obtained results led us to the preliminary conclusion aimed at ranking the companies with the best performance in reporting and disclosing sustainability information, wherein their position undergoes changes depending on the quantity and quality of the information reported, not only on ESG components, but also on the compliance degree with the GRI requirements, as well as the statement included in the sustainability report. The ranking of the best-performing companies according to sustainability reporting and disclosure was found to be significantly influenced by the degree of importance given by companies to all aspects of sustainability, likely to influence the decisions of interested parties.

4.2.5. Clustering of Companies by the Overall ESG Disclosure Score, Average ESG Risk Disclosure Score, and the Average ESG Risk Exposure Score

Non-financial reporting (ESG) activities and disclosure of sustainability practices are of interest to both business leaders and decision-makers, improving the financial performance of entities and implicitly enhancing their reputation [69]. Thus, an analysis of the sampled companies according to the average values recorded for the general disclosure score on ESG data (Table 4), the average values for the ESG risk scores, and the score for exposure to the risks of ESG actions are considered justified and opportune.
Clusters 1 and 4 contain an equal number of companies; the best-performing companies by overall ESG disclosure score were in Cluster 2, as well as one company in Cluster 3 (TLV).

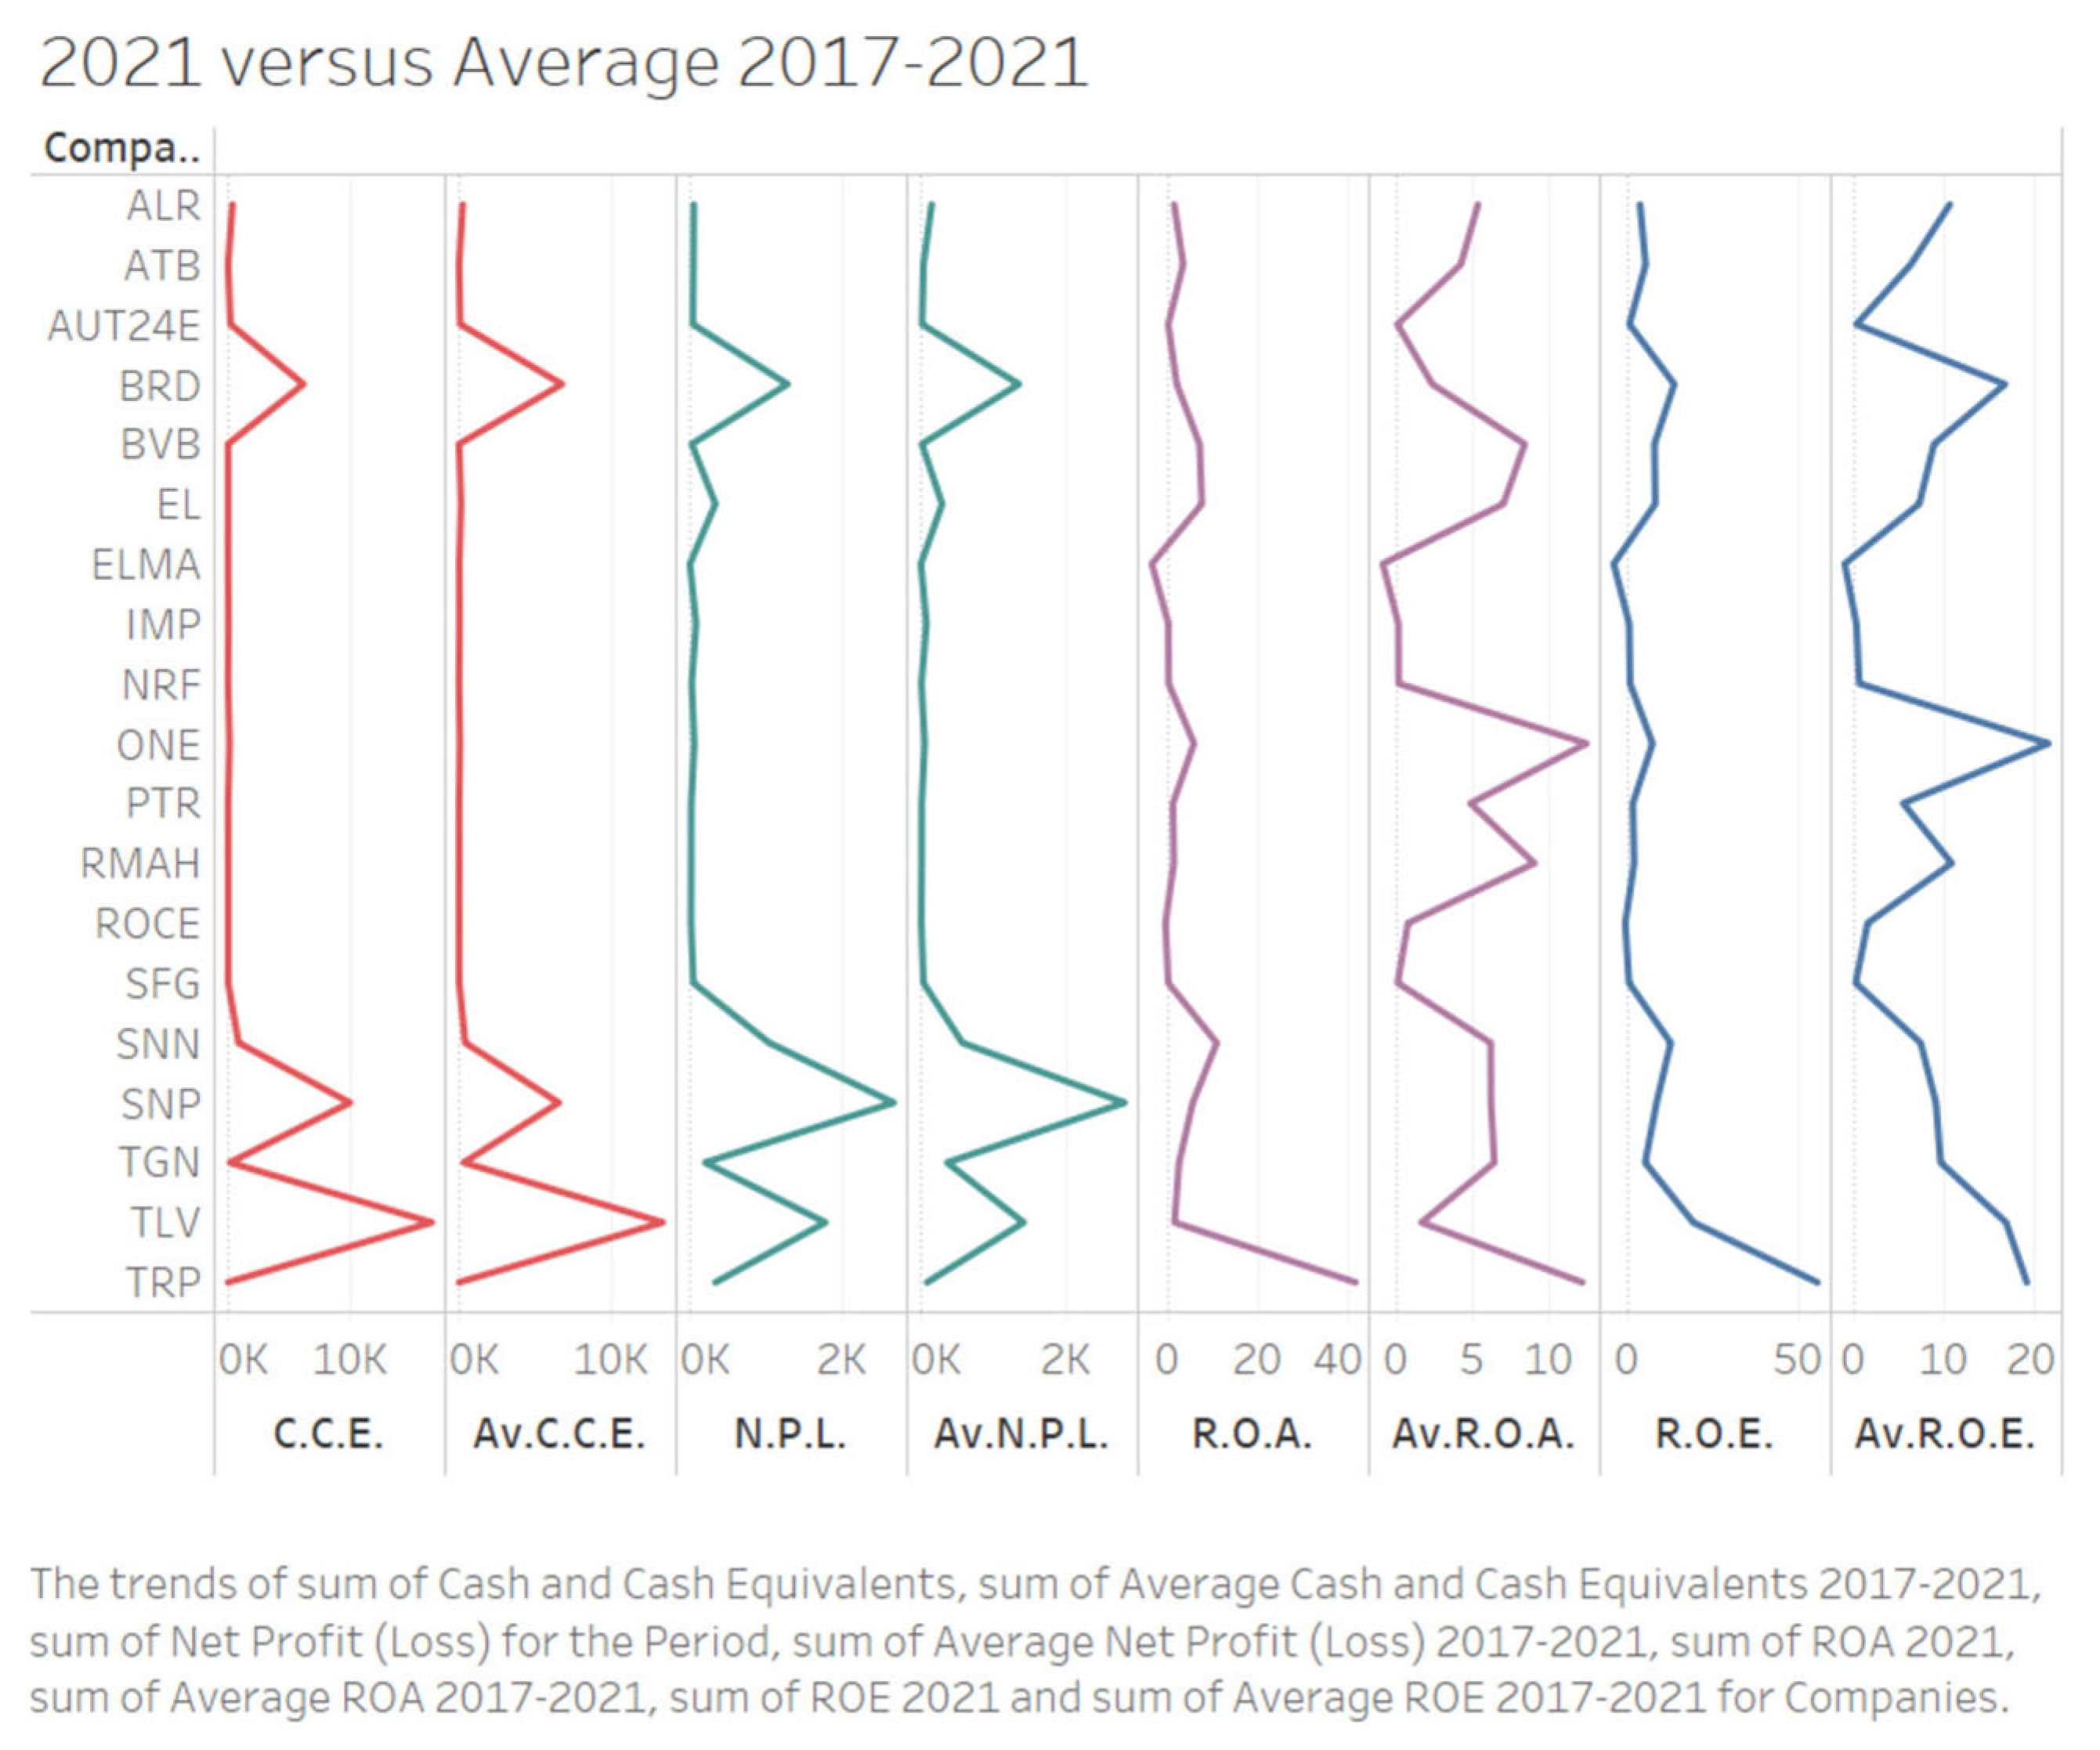
4.2.6. Analysis of Financial and ESG Performance Scores and the Final Ranking of Companies

To observe whether there was any connection between the financial performance of the companies and the exposure to ESG risks, as well as the disclosure degree of ESG information, a comparative analysis of the clustering results according to the criteria of financial performance, as well as ESG risks, was performed (Figure 5).
The comparative analysis of the clustering results, according to Fin and ESG performance, revealed that eight companies (ELMA, IMP, NRF, PTR, SNP, TLV, ONE, and TRP) kept their place in the cluster, regardless of the classification criterion (Fin or ESG performance), which leads us to appreciate that for these companies, there was a connection between financial performance and exposure to ESG risks, an exposure that determined the disclosure of sustainability actions on E, S, and G components.
At the end of this research stage, the aim was on the overall average score given to the sampled companies for their financial performance, measured by ROA, ROE, Netprofit, and Cash_liquid indicators, as well as the overall average disclosure score assigned for the sustainability performance of ESG reporting to determine the average global disclosure score. Thus, for the calculation of the average scores for the financial performance, the average values of the above-mentioned indicators, and companies awarded scores according to the recorded average performance, were employed. The ranking results according to the average financial performance indicators showed that the best-performing company was TLV, followed by SNP and BRD, and at the opposite pole, the weakest were ELMA and NRFR02 (Table 5). The global average disclosure score was determined based on the selected average financial indicators, the overall average ESG component disclosure score, and the weights from the methodology of Ban et al. [55]. After determining the overall FinESG reporting and disclosure score, which we can consider a score of integrated reporting, it was observed that the best positioned and performing company was TLV, followed by SNP and BRD, and the worst performing were ELMA and NRFR02 (Table 5).
The results revealed that even though the average financial performance score had a greater influence on the overall FinESG integrated reporting score value, as well as the final ranking of companies, the position of PTR and SFG companies was interesting to examine and significant in terms of interpreting the reporting influence for sustainability on the quality of integrated reporting and the positioning of companies according to financial and ESG performance. Thus, it can be seen that PTR, according to financial performance, was ranked 16th, and after ESG reporting 4th, in the final ranking according to the average FinESG score, it was 9th. The SFG company was in a similar situation, ranked 13th according to financial performance and 3rd according to the sustainability score in the final ranking according to the average FinESG score occupying the 8th position. And the position ROCE company in the final ranking according to the FinESG score showed that a better sustainability reporting performance significantly influences the position in the final hierarchy, with it being in the 17th position after the average score obtained for financial performance and in the final ranking at 10th place, as a result of the positive influence of the ESG reporting score. It is also worth mentioning the position of the companies SNP, ATB, ELMA, and NRFR02, which are in the same positions both in terms of the average score obtained for reporting financial performance and the average disclosure score for ESG data, which, except for ATB, did not alter their position in the final ranking. Of course, the relevance of the ranking increased importance in analyses carried out within the same business sectors and industries. In the present study, the aim was to observe and interpret the influence of the average ESG score on the final ranking.
The preliminary conclusion was that 31.57% of the companies analyzed based on the FinESG integrated reporting and disclosure score maintained their position in the final ranking of companies or even managed to outperform other companies. In the current context, we believe that this percentage is worth considering for further analyses of sectors and industries, as well as for monitoring the process of improving sustainability reporting, facilitating company risk and uncertainty management specific to sustainability actions, and the development of new tools for analysis and control of the processes involved.

5. Discussion on the Qualitative Analysis of Sustainability Reports

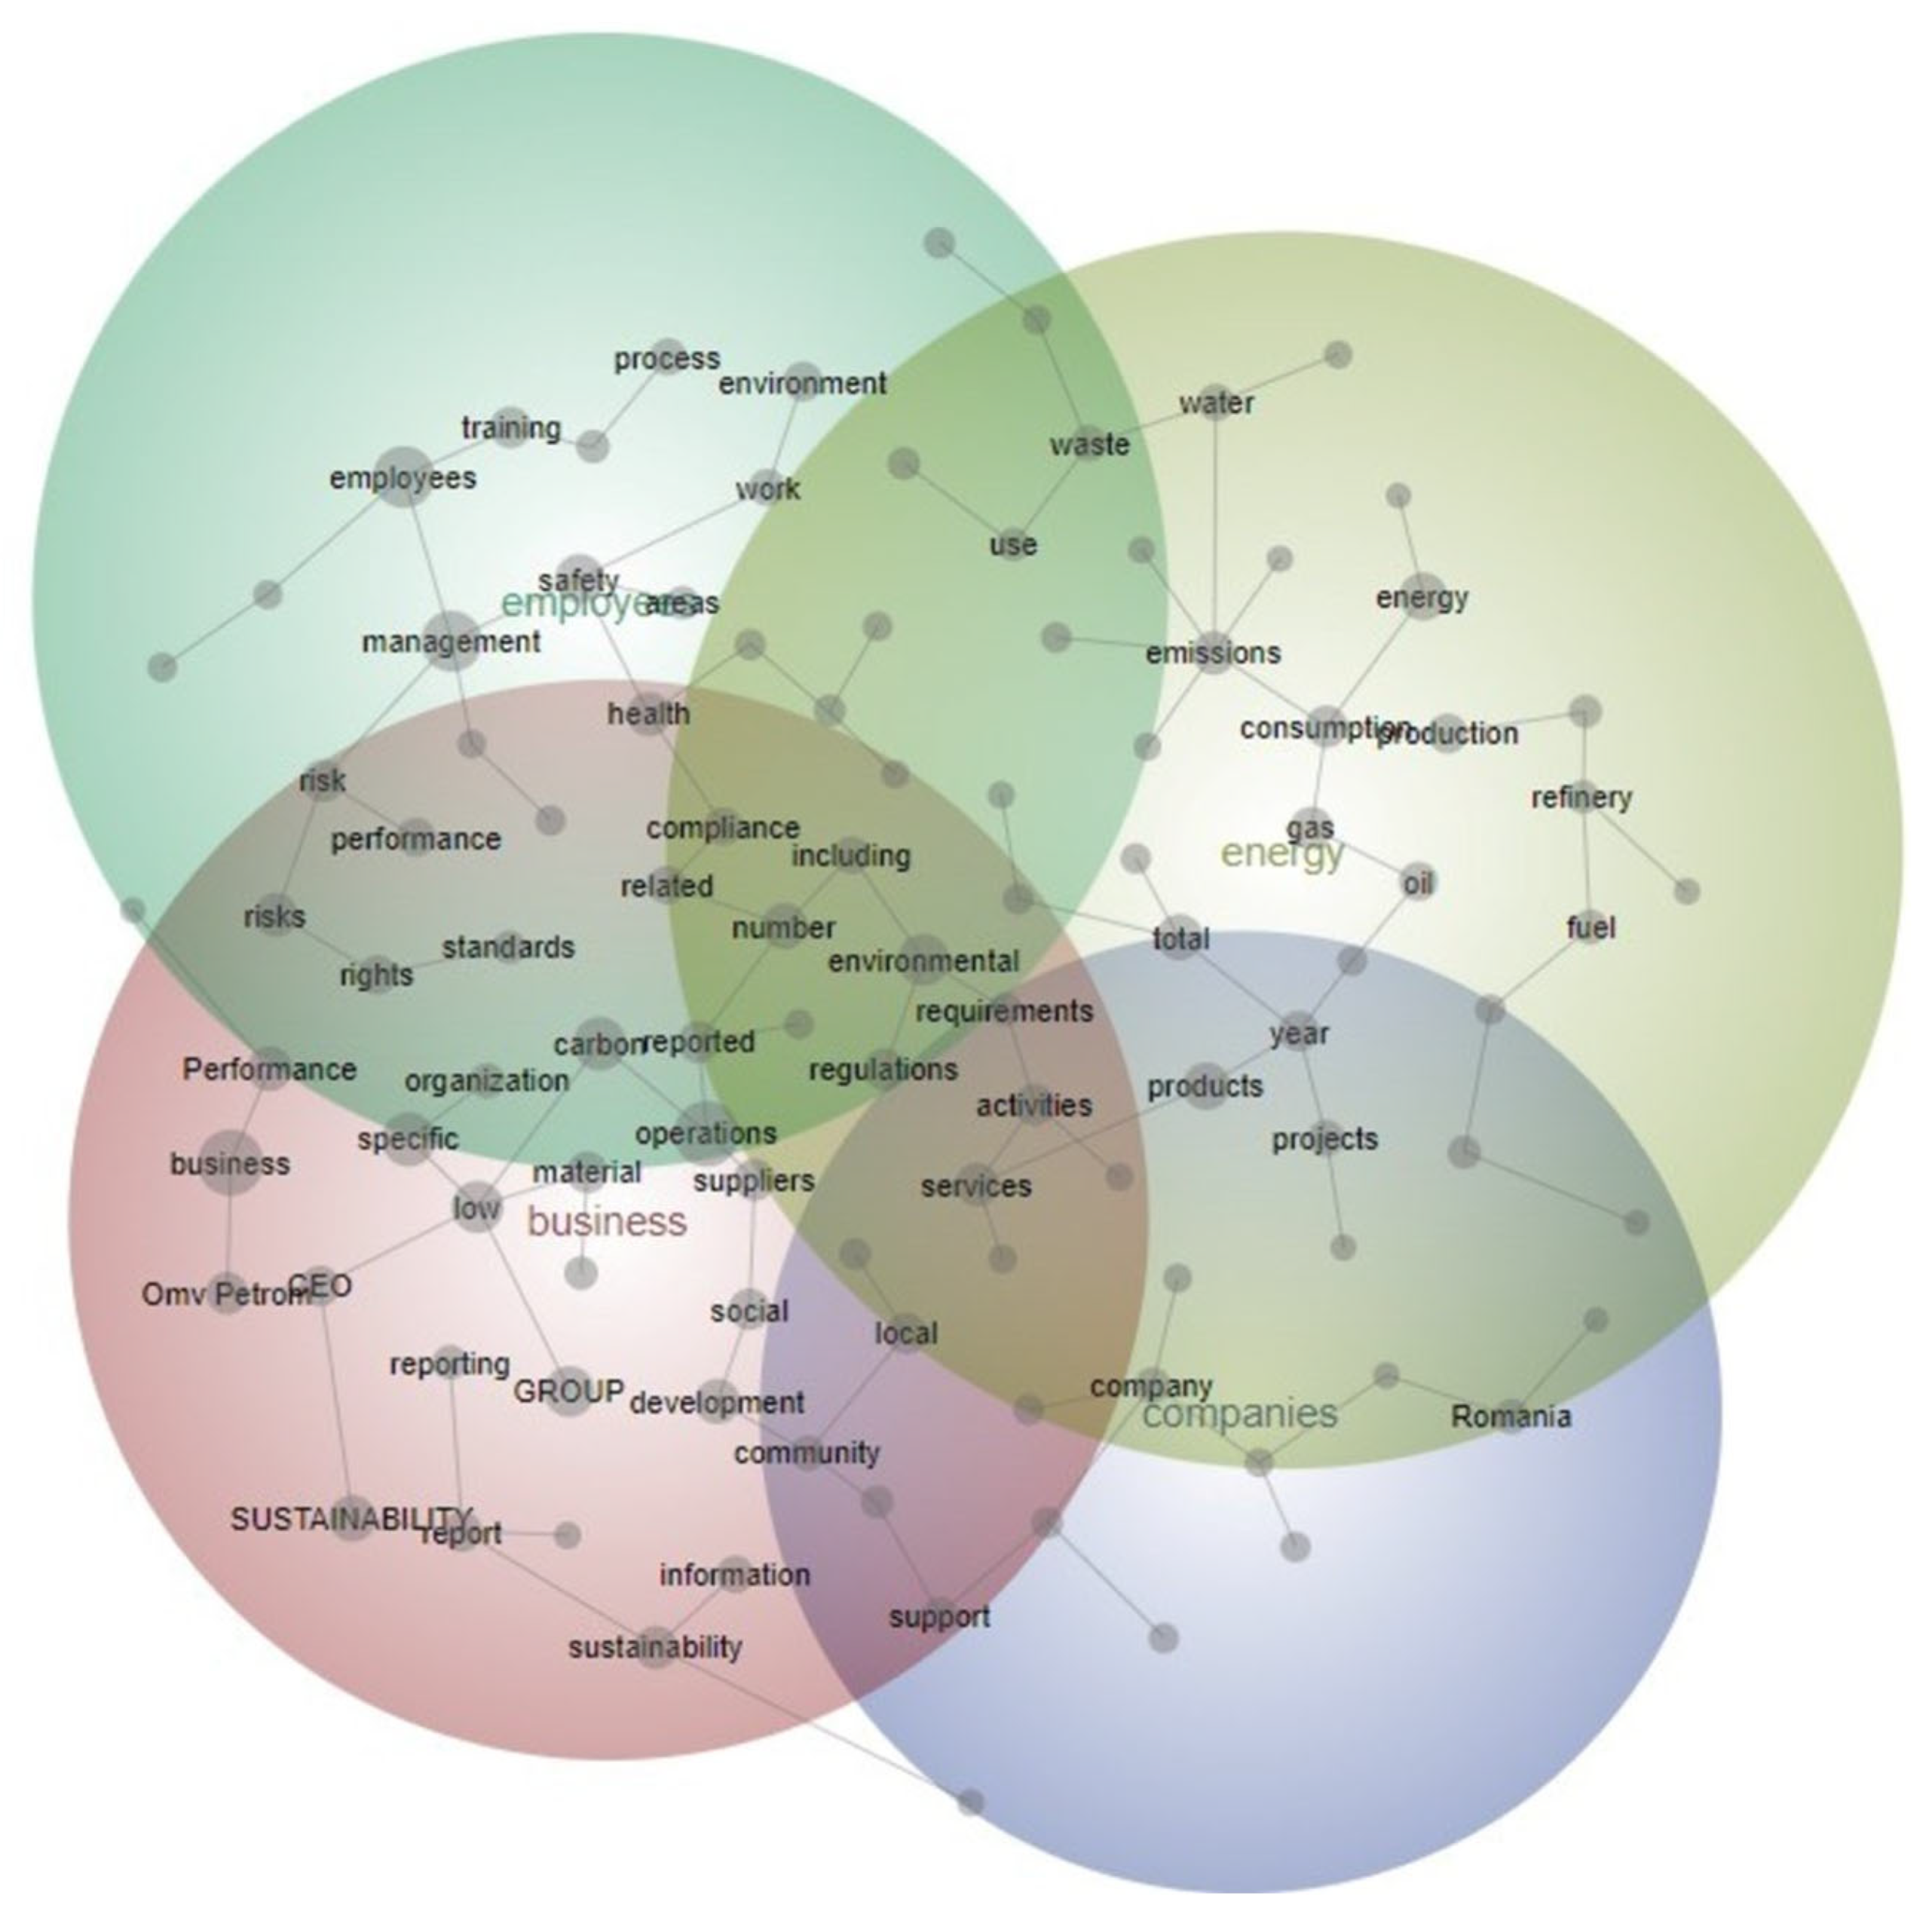
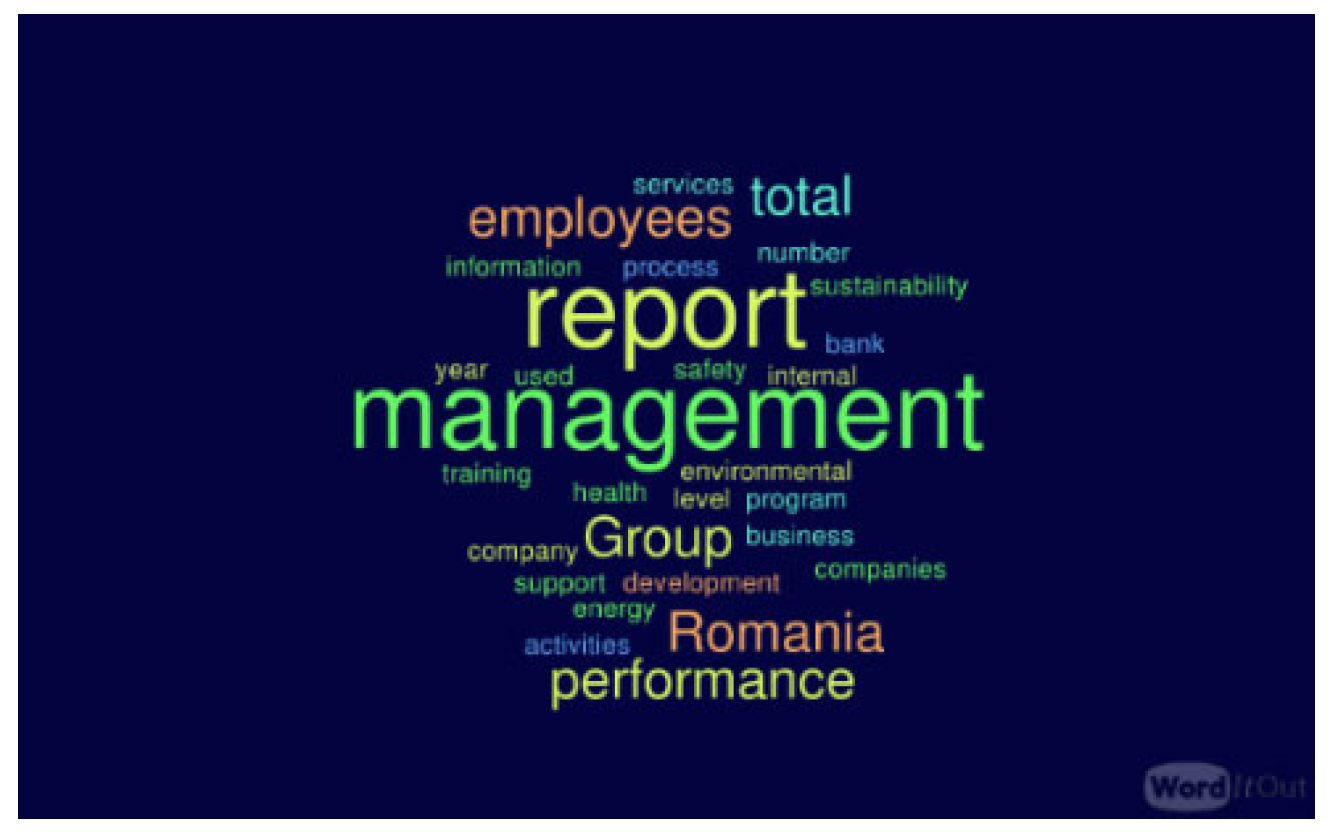
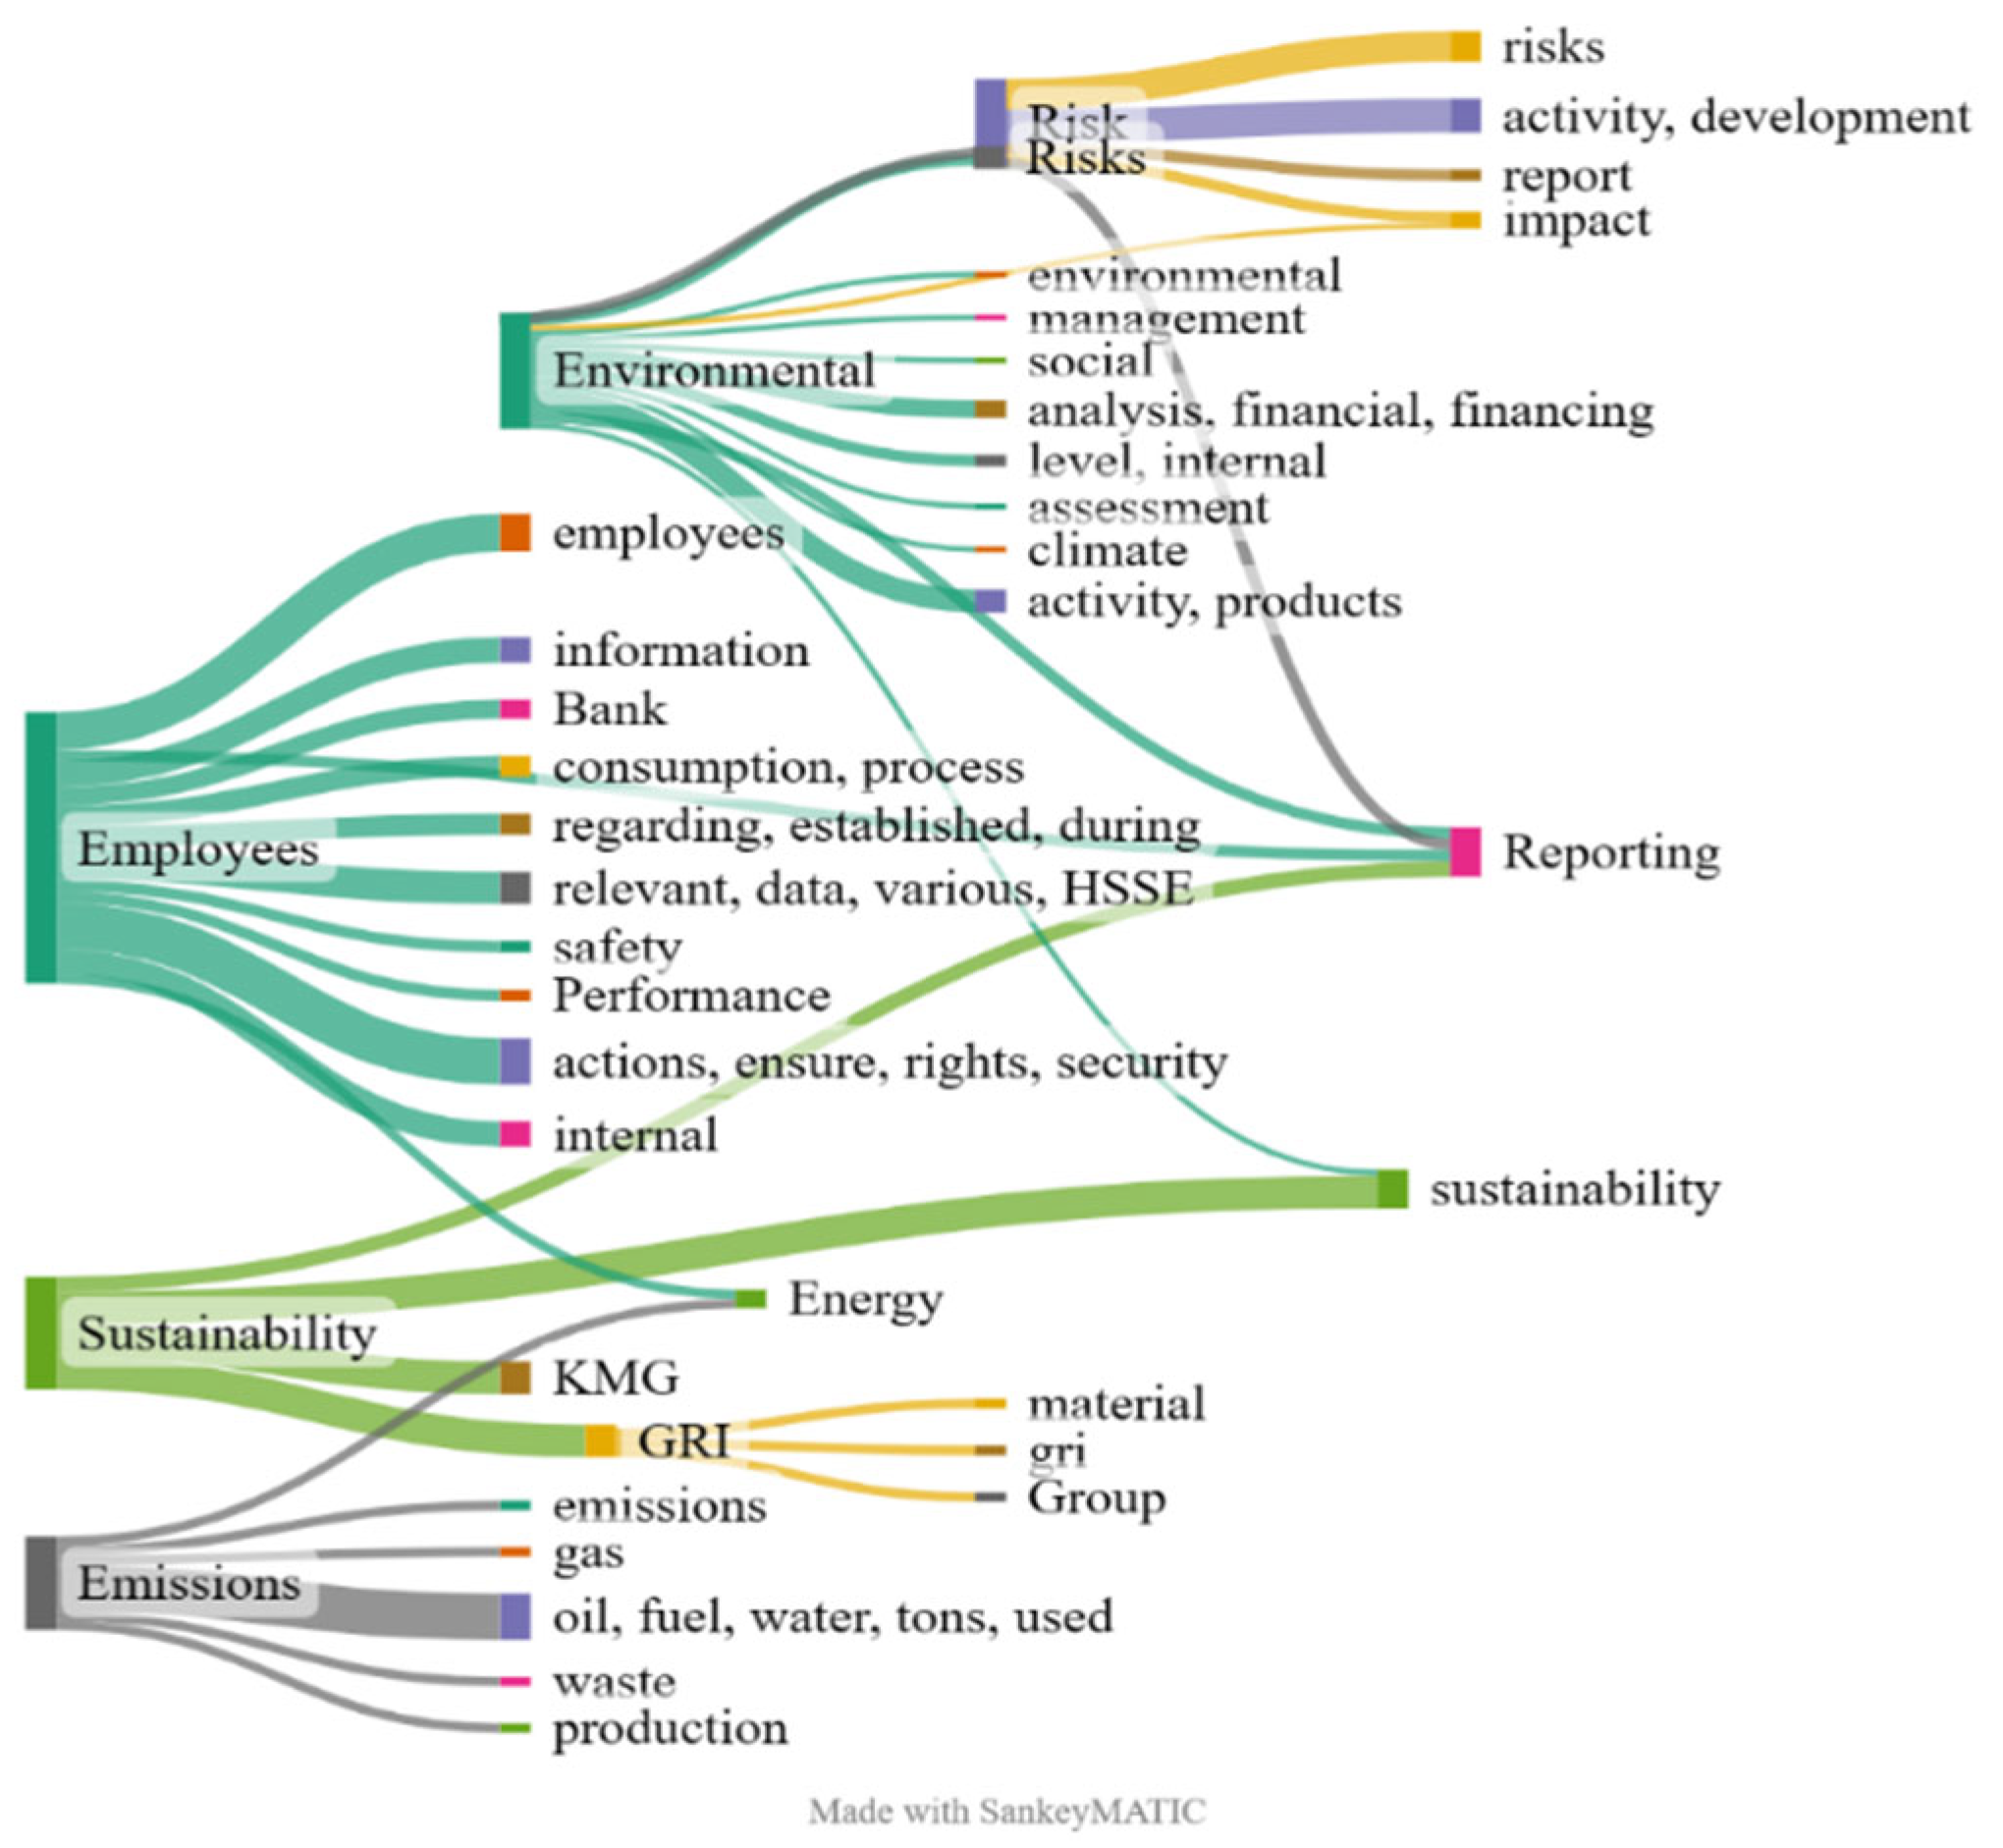
5.1. Concepts and Themes Extraction by Leximancer Exploration

Analyzing sustainability reports explored with Leximancer makes it easy to visualize emerging and developed topics using a map view that directly links data regions where concepts appear. Thematic maps enable quick reading of ESG information contained in sustainability reports. This allows one to see what the main themes are, rather than imposing one’s interpretations influenced by regulatory requirements or GRI standards [14]. The proximity of two concepts indicates how often they appear or not in similar conceptual contexts. Therefore, when two concepts are placed at a distance, this shows that they are not used in the same context [56]. Themes are colored circles around groups of concepts. The result of the content analysis of the sustainability reports for the top-ranked companies according to the overall ESG disclosure score indicated the presence of four main dominant themes: companies, business, employees, and energy. Lines or paths navigate the most likely path in the space between concepts to help read the map (Figure 6). The connection score reflects the extent (equivalent to the degree score in network analysis) to which the topic is connected to other concepts in the map [41]. A significant agglomeration of concepts was observed within the dominant theme, business, and at the intersection of the themes of employees and business, most concepts can be identified. The more often two concepts appear together in the same sentence, the more likely they are to be related. Leximancer then compares each bank of concepts and creates indirect links between them, meaning that even if the concepts do not appear together in the same sentence, there may still be an indirect link between them. Thus, Leximancer arranges concepts and presents them according to the strength of association and semantic similarity [3].
From the analysis of the main concepts extracted with the help of Leximancer from the sustainability reports of the first six companies ranked by the value of the overall average ESG disclosure score, 198 concepts resulted, which were examined by frequency. The highest recorded frequency was eight words. Selecting a frequency of five words, 29 concepts were found (Figure 7). Among the 29, the dominant concepts were report, management, performance, group, employees, Romania, and total.
The content analysis of the sustainability reports of the top six ranked companies according to the overall ESG score, summarized in Figure 8 (designed at https://sankeymatic.com/build/, accessed on 11 April 2023), revealed the significant links between the main themes and dominant concepts disclosed. Thus, analyzing the connectivity links, the concept of “reporting” was highlighted, presenting information about the themes: risk/risks, environmental, employees, and sustainability. Most of the information was provided on the theme “employees” and refers to actions, ensure, rights, data, safety, consumption, process, security, and others. An important aspect in light of the ESG analysis was that of the connectivity between the themes “employees” and “emissions” realized through “energy”. “Environmental” was presented as being connected to the terms management, social, analysis, climate, activity, financial, and products.
Also, from the study of the connectivity links, we observed that reporting for sustainability requires compliance with the requirements of the GRI standards [14], with a special focus on the “environmental” topic. Aspects of the protection of the environment by reducing emissions into the atmosphere were identified through the information extracted from the sustainability reports and referred to the concepts of gas emissions, oil, fuel, water, used items, waste, and production.

5.2. Major ESG Concepts and Themes Outlined from the Content Analysis of All Sustainability Reports

In the last stage of the qualitative research, the sustainability reports of 17 companies out of the 19 sampled, publicly available online in English and for all years for which it was possible to download them, were explored using the Leximancer v5.0 software. The content analysis demonstrated the existence of the following prominent themes: management, company, products, energy, report, and board. The dominant concepts with the highest frequency were employees, management, and business; in the top ten prominent concepts, the terms products, energy, safety, development, and performance were also found. We present in Table 6 the top 25 concepts with the highest frequency and the themes associated with them.
The three plots analysis performed through the Sankey diagram using Python vs. 3.7. (Figure 9) aimed to identify the mainstream ESG concepts by exploring the connectivity between the text of sustainability reports, consolidated GRI standards [14], and most salient ESG information disclosed by each of the 17 sampled companies. A total of 56 sustainability reports published online in English for all 17 companies were identified and analyzed, covering the period 2011–2021. For the years 2011 and 2012, only for the SNP company did we find the sustainability reports published. The companies SNP/OMV and PTS/RWS had the most sustainability reports published online in English, eight in number, followed by the companies ALRO, ATB, and ROCE with five sustainability reports published in English. For the other companies, at most three reports published and available online in English were identified. For NFR02 and BRD, only sustainability reports published in English for the year 2021 were found.
The links between the components can be observed and examined by the height of the rectangular calves. From exploring the links between the text components of the 56 sustainability reports analyzed, the dominant ESG topics were employees, management, business, company, safety, products, activities, energy, risk, environment, and operations. Thus, we can conclude that all 17 companies for which the text content of the sustainability reports published online in English was examined disclose ESG information with a higher frequency on the topics mentioned above. The most salient topic was related to the social component of ESG, namely, employees.

6. Conclusions

This exploratory study was based on the characteristics of qualitative research with quantitative elements and aimed to investigate reporting and disclosure of ESG information practices, linked to classic financial performance indicators. Thus, to analyze the overall financial and ESG reporting performance for the sample of listed companies, the technique of awarding grades according to the criteria mentioned in the Section 3.3 of this paper was used. To assess and interpret the overall integrated performance referred in the study as FinESG, the overall scores for financial performance, and ESG performance, were first analyzed, and then the overall score for an integrated performance reporting model, FinESG, was determined. The results obtained in the first stage of the research provided us with the answers to the first formulated questions, and the results of the content analysis of the sustainability reports published in English showed the dominant trends in the disclosure of ESG topics. The findings are in line with those of Margot et al. [45]; Nitlarp and Kiattisin [3]; Angin et al. [2]; Huang, Wang, and Yang [4]; and Lee et al. [5].
Therefore, from the first analyses carried out on the size indicators (total assets, turnover, average employees, and total equity), the sampled companies were grouped into five classes: E—very small, D—small, C—medium, B—large, and A—very large. And the analysis of the financial performance measured by four indicators, ROA, ROE, NetProfit, and Cash_liquid, for the year 2021, as well as the average of the years 2017–2021, indicated the relative maintenance of the indicators, which determined the classification of the companies and their subsequent ranking according to the average values recorded of indicators for the five years. For clustering, ROA and ROE indicators were used, and the results indicated four groups. The ranking of companies according to financial performance showed that the best-performing companies according to the average score awarded to the indicators for the five years were TLV, SNP, BRD, SNN, and TGN; two of them are banks, and the other three operate in the oil, gas, and energy sector. The first three ranked companies were in the first size class, A.
Also, in this first stage of the research, the sustainability reports were examined, as well as other categories of reports, integrated and annual, published by the selected listed companies for the year 2021, in order to look for answers to research questions three, four, and five, as well as the ESG information published on the companies’ websites on a separate button. From reading and evaluating the ESG information and other sustainability aspects reported for the year 2021, we found that mostly sampled companies preferred ESG indicator reporting and disclosure within the sustainability reports, and very few presented information in the integrated report, or they preferred to disclose data within the annual report or in the text of a non-financial statement. Only four companies presented ESG information on the dedicated button on their websites. It is worth emphasizing that the results of the in-depth and detailed analysis of ESG and sustainability information disclosure in these reports allowed for the formulation of preliminary conclusions for each analysis carried out. Hence, we noticed the early stage of the companies from the perspective of ESG information reporting and disclosure on topics delimited according to the GRI and materiality standards [14], and here, the need to improve the quality of reporting from one period to another emerged, but also the growing concern of management for the adequate management of risks associated with ESG actions. On the other hand, the average general disclosure score (3.3157) on integrated business and sustainability strategy information was low compared to the other average ESG scores calculated, which rather indicated the preparatory stage within which the analyzed companies were in, as well as the fact that management’s attention must be oriented to clarify the business model, if it is an integrated one or not, and to disclose the outline of the business reporting model along with the description of sustainability strategies.
The analysis of the average scores obtained by companies for reporting and disclosing sustainability information in different categories led us to the result regarding the ranking of companies that change according to the quantity and quality of disclosed ESG information. The analysis of the companies’ performance according to the average ESG disclosure score, risks, and exposure to ESG risks revealed the existence of four groups of companies, and the best-performing companies according to the general average ESG disclosure score were BRD, SNP, SFG, PTR, and TLV. The comparative analysis of cluster composition by financial and ESG disclosure performance revealed that 42% of the companies maintained their position in the clusters, hence the presumption that there is a connection between the financial performance of these companies and exposure to ESG risks, which calls for permanent monitoring of ESG actions by management. At the end of the first stage of the research, the best-ranked companies according to the overall average score of integrated FinESG performance were found to be TLV, SNP, BRD, SNN, and TGN, and the analysis of the positions of the companies in the overall ranking compared to the ranking of Fin and ESG performance allowed for the formulation of conclusions regarding future sustainability strategies and actions combined with performance measurement through financial indicators. In the current context of the expansion of discussions around integrated reporting, the conclusion of the first part of the research can be circumscribed around the indicators for quantifying and evaluating the quality of integrated reporting and performance FinESG, and a set of financial and ESG indicators considered relevant by companies’ management could be selected to build a FinESG composite indicator that allows for the integrated analysis of performance from one period to another. Therefore, the preliminary and the general conclusions are of practical use for managers at different levels within companies, as well as for executive and non-executive managers, for the identification of new managerial tools to optimize the performance of Fin and ESG reporting and disclosure indicators.
The second stage of the research consisted of the qualitative investigation of 56 sustainability reports published by the sampled companies for all the years for which they were made public, in English, from the perspective of textual content analysis to identify dominant ESG themes and concepts. Leximancer v5.0 software was used for this purpose, and Sankey diagrams were designed to visualize and interpret significant links between items. Content analysis of the reports for the top six ranked companies by overall ESG disclosure performance score revealed four dominant themes and seven concepts with the highest frequency. It can be concluded that the dominant topic, and that which had the highest connectivity score, was employees. Then, a content analysis of all sustainability reports for 17 companies was carried out, where the results led to six dominant themes, and among the dominant concepts, the one with the highest frequency and the highest degree of connectivity was also employees. Consequently, the most prominent topic in the content of the analyzed sustainability reports was employees, with significant direct links to the concepts of actions, ensure, rights, security, data, relevance, consumption, process, performance, and indirect to the concept of reporting. This result is relevant from the perspective of the highlighted dominant themes and concepts and the correlations between the different themes, for instance, employees–emissions through energy.
The results of the study can be useful to company management for reconfiguring the disclosure of ESG information in future sustainability reports, as well as for academics for more in-depth thematic analyses. The research contributions of the present study were found in the methodology but especially in the content analysis of sustainability reports. The main limitations of the paper were found in the sampled companies and methodology of assigning grades for ESG information disclosed in the sustainability reports. Future research will focus on larger studies conducted on a wide number of companies and possibilities to measure the reporting quality of different ESG themes through aggregated indicators. It will be also of interest to model FinESG integrated performance prediction using artificial intelligence algorithms.

Author Contributions

Conceptualization, V.B. and L.R.; data curation, N.G.B.; formal analysis, D.S.G.; investigation, V.B.; methodology, V.B. and L.R.; project administration, A.G.F.; resources, A.G.F.; software, D.S.G.; supervision, V.B.; validation, V.B., L.R. and D.S.G.; visualization, N.G.B.; writing—original draft, V.B., L.R. and D.S.G.; writing—review and editing, A.G.F. All authors have read and agreed to the published version of the manuscript.

Funding

This research has been funded by the University of Oradea, within the Grants Competition “Scientific Research of Excellence Related to Priority Areas with Capitalization through Technology Transfer: INO-TRANSFER—UO-2nd Edition”, Project No. 230/28 October 2022.

Data Availability Statement

The analyzed data during the current study are available from the corresponding author on reasonable request.

Conflicts of Interest

The authors declare no conflict of interest. The funders had no role in the design of the study; in the collection, analyses, or interpretation of data; in the writing of the manuscript; or in the decision to publish the results.

References

  1. Sebrina, N.; Taqwa, S.; Afriyenti, M.; Septiari, D. Analysis of Sustainability Reporting Quality and Corporate Social Responsibility on Companies Listed on the Indonesia Stock Exchange. Cogent Bus. Manag. 2023, 10, 2157975. [Google Scholar] [CrossRef]
  2. Angin, M.; Taşdemir, B.; Yılmaz, C.A.; Demiralp, G.; Atay, M.; Angin, P.; Dikmener, G. A RoBERTa Approach for Automated Processing of Sustainability Reports. Sustainability 2022, 14, 16139. [Google Scholar] [CrossRef]
  3. Nitlarp, T.; Kiattisin, S. The Impact Factors of Industry 4.0 on ESG in the Energy Sector. Sustainability 2022, 14, 9198. [Google Scholar] [CrossRef]
  4. Huang, A.H.; Wang, H.; Yang, Y. FinBERT: A Large Language Model for Extracting Information from Financial Text. Contemp. Account. Res. 2023, 40, 806–841. [Google Scholar] [CrossRef]
  5. Lee, O.; Joo, H.; Choi, H.; Cheon, M. Proposing an Integrated Approach to Analyzing ESG Data via Machine Learning and Deep Learning Algorithms. Sustainability 2022, 14, 8745. [Google Scholar] [CrossRef]
  6. Gutierrez-Bustamante, M.; Espinosa-Leal, L. Natural Language Processing Methods for Scoring Sustainability Reports—A Study of Nordic Listed Companies. Sustainability 2022, 14, 9165. [Google Scholar] [CrossRef]
  7. Wang, J.; Bhowmick, A.; Cevik, M.; Basar, A. Deep Learning Approaches to Classify the Relevance and Sentiment of News Articles to the Economy. In CASCON’20, Proceedings of the 30th Annual International Conference on Computer Science and Software Engineering, Toronto, ON, Canada, 10–13 November 2020; Shaddick, L., Jourdan, G.-V., Onut, V., Ng, T., Eds.; IBM Corp.: Riverton, NJ, USA, 2020; pp. 207–216. [Google Scholar]
  8. Raman, N.; Bang, G.; Nourbakhsh, A. Mapping ESG Trends by Distant Supervision of Neural Language Models. Mach. Learn. Knowl. Extr. 2020, 2, 453–468. [Google Scholar] [CrossRef]
  9. Nugent, T.; Stelea, N.; Leidner, J.L. Detecting Environmental, Social and Governance (ESG) Topics Using Domain-Specific Language Models and Data Augmentation. In Flexible Query Answering Systems, Proceedings of the 14th International Conference, FQAS 2021, Bratislava, Slovakia, 19–24 September 2021; Andreasen, T., De Tre, G., Kacprzyk, J., Larse, H.L., Bordigna, G., Zadrozny, S., Eds.; Springer: Berlin, Germany, 2021; Volume 12871, pp. 157–169. [Google Scholar] [CrossRef]
  10. Sharma, U.; Gupta, A.; Gupta, S.K. The Pertinence of Incorporating ESG Ratings to Make Investment Decisions: A Quantitative Analysis Using Machine Learning. J. Sustain. Financ. Invest. 2022, 1–15. [Google Scholar] [CrossRef]
  11. Elkington, J. Cannibals with Forks: The Triple Bottom Line of 21st Century Business; Capstone: Oxford, UK, 1997. [Google Scholar]
  12. Jamali, D. Insights into triple bottom line integration from a learning organization perspective. Bus. Process Manag. J. 2006, 12, 809–821. [Google Scholar] [CrossRef]
  13. Slaper, T.; Hall, T. The Triple Bottom Line: What Is It and How Does It Work? Indiana Univ. Kelley Sch. Bus. 2011, 86, 4–8. [Google Scholar]
  14. GSSB. Consolidated Set of GRI Sustainability Reporting Standards 2016. GSSB. 2016. Available online: http://www.ekvilib.org/wp-content/uploads/2018/03/GRI-standardi-2016.pdf (accessed on 11 January 2023).
  15. Chang, R.-D.; Zuo, J.; Zhao, Z.-Y.; Zillante, G.; Gan, X.-L.; Soebarto, V. Evolving theories of sustainability and firms: History, future directions and implications for renewable energy research. Renew. Sustain. Energy Rev. 2017, 72, 48–56. [Google Scholar] [CrossRef]
  16. Foxon, T.J. A coevolutionary framework for analysing a transition to a sustainable low carbon economy. Ecol. Econ. 2011, 70, 2258–2267. [Google Scholar] [CrossRef]
  17. Jänicke, M. “Green growth”: From a growing eco-industry to economic sustainability. Energy Policy 2012, 48, 13–21. [Google Scholar] [CrossRef]
  18. Rotmans, J.; Loorbach, D. Complexity and transition management. J. Ind. Ecol. 2009, 13, 184–196. [Google Scholar] [CrossRef]
  19. The European Parliament and the Council of the European Union. Directive (EU) 2022/2464 of 14 December 2022 Amending Regulation (EU) No 537/2014, Directive 2004/109/EC, Directive 2006/43/EC and Directive 2013/34/EU, as Regards Corporate Sustainability Reporting; The European Parliament and the Council of the European Union: Brussels, Belgium, 2022; pp. 15–80. Available online: https://eur-lex.europa.eu/legal-content/RO/TXT/PDF/?uri=CELEX:52021PC0189&from=EN/ (accessed on 3 February 2023).
  20. Ministry of Public Finance. Order of the Minister of Public Finance No. 3456/2018 for Amending and Supplementing Accounting Regulations; Ministry of Public Finance: Bucharest, Romania, 2018; pp. 14–16. Available online: https://static.anaf.ro/static/10/Anaf/legislatie/OMFP_3456_2018.pdf (accessed on 25 January 2023).
  21. Ministry of Public Finance. Order of the Minister of Public Finance No. 1938/2016 for Amending and Supplementing Accounting Regulations; Ministry of Public Finance: Bucharest, Romania, 2016; pp. 28–32. Available online: https://static.anaf.ro/static/10/Anaf/legislatie/OMFP_1938_2016.pdf (accessed on 25 January 2023).
  22. Krzysztofik, M.; Düring, N.; Fennema, S.; Scheepens, W. ESG Reporting Guidelines. Bucharest, Romania. 2022. Available online: https://bvb.ro/info/Rapoarte/Ghiduri/ESG_Reporting_Guidelines.pdf (accessed on 19 January 2023).
  23. Galletta, S.; Mazzù, S.; Naciti, V. A Bibliometric Analysis of ESG Performance in the Banking Industry: From the Current Status to Future Directions. Res. Int. Bus. Finance 2022, 62, 101684. [Google Scholar] [CrossRef]
  24. Gao, W.; Li, M.; Zou, C. Analysis of the Impact of ESG on Corporate Financial Performance under the Epidemic Based on Static and Dynamic Panel Data. Wirel. Commun. Mob. Comput. 2022, 2022, 6851518. [Google Scholar] [CrossRef]
  25. Iazzolino, G.; Bruni, M.E.; Veltri, S.; Morea, D.; Baldissarro, G. The Impact of ESG Factors on Financial Efficiency: An Empirical Analysis for the Selection of Sustainable Firm Portfolios. Corp. Soc. Responsib. Environ. Manag. 2023, 30, 1917–1927. [Google Scholar] [CrossRef]
  26. Rahi, A.F.; Akter, R.; Johansson, J. Do Sustainability Practices Influence Financial Performance? Evidence from the Nordic Financial Industry. Account. Res. J. 2022, 35, 292–314. [Google Scholar] [CrossRef]
  27. Fulton, M.; Kahn, B.M.; Sharples, C. Sustainable Investing: Establishing Long-Term Value and Performance. SSRN Electron. J. 2012, 1–72. [Google Scholar] [CrossRef]
  28. De Lucia, C.; Pazienza, P.; Bartlett, M. Does Good ESG Lead to Better Financial Performances by Firms? Machine Learning and Logistic Regression Models of Public Enterprises in Europe. Sustainability 2020, 12, 5317. [Google Scholar] [CrossRef]
  29. Azmi, W.; Hassan, M.K.; Houston, R.; Karim, M.S. ESG Activities and Banking Performance: International Evidence from Emerging Economies. J. Int. Financ. Mark. Inst. Money 2021, 70, 101277. [Google Scholar] [CrossRef]
  30. Bruna, M.G.; Loprevite, S.; Raucci, D.; Ricca, B.; Rupo, D. Investigating the Marginal Impact of ESG Results on Corporate Financial Performance. Financ. Res. Lett. 2022, 47, 102828. [Google Scholar] [CrossRef]
  31. Agoraki, M.-E.K.; Giaka, M.; Konstantios, D.; Patsika, V. Firms’ Sustainability, Financial Performance, and Regulatory Dynamics: Evidence from European Firms. J. Int. Money Finance 2023, 131, 102785. [Google Scholar] [CrossRef]
  32. Barman, A.; Das, R.; De, P.K.; Sana, S.S. Optimal pricing and greening strategy in a competitive green supply chain: Impact of government subsidy and tax policy. Sustainability 2021, 13, 9178. [Google Scholar] [CrossRef]
  33. Barman, A.; Das, R.; De, P.K.; Dash, J.K. Optimal Pricing, Ordering, and Replenishment Policies in a Multi-Item Inventory System for Deteriorating Items under Time-Varying Backlogging Rate. J. Ind. Integr. Manag. 2022, 7, 235–256. [Google Scholar] [CrossRef]
  34. Barman, A.; Kumar Chakraborty, A.; Goswami, A.; Banerjee, P.; De, P.K. Pricing and inventory decision in a two-layer supply chain under the Weibull distribution product deterioration: An application of NSGA-II. RAIRO Oper. Res. 2023, 57, 2279–2300. [Google Scholar] [CrossRef]
  35. Alareeni, B.A.; Hamdan, A. ESG Impact on Performance of US S&P. 500-Listed Firms. Corp. Gov. Int. J. Bus. Soc. 2020, 20, 1409–1428. [Google Scholar] [CrossRef]
  36. Pacelli, V.; Pampurini, F.; Quaranta, A.G. Environmental, Social and Governance Investing: Does Rating Matter? Bus. Strategy Environ. 2023, 32, 30–41. [Google Scholar] [CrossRef]
  37. Duque-Grisales, E.; Aguilera-Caracuel, J. Environmental, Social and Governance (ESG) Scores and Financial Performance of Multilatinas: Moderating Effects of Geographic International Diversification and Financial Slack. J. Bus. Ethics 2021, 168, 315–334. [Google Scholar] [CrossRef]
  38. Li, Z. Treatment and Technology of Domestic Sewage for Improvement of Rural Environment in China-Jiangsu: A Research. Sci. Progress Res. 2021, 1, 305–314. [Google Scholar] [CrossRef]
  39. Garcia, A.S.; Mendes-Da-Silva, W.; Orsato, R.J. Corporate Sustainability, Capital Markets, and ESG Performance. In Individual Behaviors and Technologies for Financial Innovations; Springer International Publishing: Cham, Switzerland, 2019; pp. 287–309. [Google Scholar] [CrossRef]
  40. Raghupathi, V.; Ren, J.; Raghupathi, W. Identifying Corporate Sustainability Issues by Analyzing Shareholder Resolutions: A Machine-Learning Text Analytics Approach. Sustainability 2020, 12, 4753. [Google Scholar] [CrossRef]
  41. Baharudin, B.; Lee, L.H.; Khan, K. A Review of Machine Learning Algorithms for Text-Documents Classification. J. Adv. Inf. Technol. 2010, 1, 4–20. [Google Scholar] [CrossRef]
  42. Brown, M. Managing Nature–Business as Usual: Resource Extraction Companies and Their Representations of Natural Landscapes. Sustainability 2015, 7, 15900–15922. [Google Scholar] [CrossRef]
  43. Pennington, J.; Socher, R.; Manning, C. Glove: Global Vectors for Word Representation. In Proceedings of the 2014 Conference on Empirical Methods in Natural Language Processing (EMNLP), Doha, Qatar, 25–29 October 2014; Association for Computational Linguistics: Stroudsburg, PA, USA, 2014; pp. 1532–1543. [Google Scholar] [CrossRef]
  44. Goel, T.; Jain, P.; Verma, I.; Dey, L.; Paliwal, S.S. Mining Company Sustainability Reports to Aid Financial Decision-Making. In Proceedings of the AAAI-20 KDF—The AAAI-20 Workshop on Knowledge Discovery from Unstructured Data in Financial Service, New York, NY, USA, 7 February 2020. [Google Scholar]
  45. Margot, V.; Geissler, C.; De Franco, C.; Monnier, B. ESG Investments: Filtering versus Machine Learning Approaches. Appl. Econ. Finance 2021, 8, 1. [Google Scholar] [CrossRef]
  46. Sustainalytics a Morningstar Company. ESG Risk Ratings-Methodology Abstract Version 2.1; Sustainalytics: Amsterdam, The Netherlands, 2021; Available online: https://connect.sustainalytics.com/hubfs/INV/Methodology/Sustainalytics_ESG%20Ratings_Methodology%20Abstract.pdf (accessed on 16 February 2023).
  47. Brahma, S.; Nwafor, C.; Boateng, A. Board Gender Diversity and Firm Performance: The UK Evidence. Int. J. Finance Econ. 2021, 26, 5704–5719. [Google Scholar] [CrossRef]
  48. Orlitzky, M.; Schmidt, F.L.; Rynes, S.L. Corporate Social and Financial Performance: A Meta-Analysis. Organ. Stud. 2003, 24, 403–441. [Google Scholar] [CrossRef]
  49. Wang, C.; Deng, X.; Álvarez-Otero, S.; Sial, M.S.; Comite, U.; Cherian, J.; Oláh, J. Impact of Women and Independent Directors on Corporate Social Responsibility and Financial Performance: Empirical Evidence from an Emerging Economy. Sustainability 2021, 13, 6053. [Google Scholar] [CrossRef]
  50. Arora, A. Gender Diversity in Boardroom and Its Impact on Firm Performance. J. Manag. Gov. 2022, 26, 735–755. [Google Scholar] [CrossRef]
  51. Bogdan, V.; Popa, D.-N.; Beleneşi, M. The Complexity of Interaction between Executive Board Gender Diversity and Financial Performance: A Panel Analysis Approach Based on Random Effects. Complexity 2022, 2022, 9559342. [Google Scholar] [CrossRef]
  52. Li, D.; Zhao, Y.; Sun, Y.; Yin, D. Corporate Environmental Performance, Environmental Information Disclosure, and Financial Performance: Evidence from China. Human. Ecol. Risk Assess. Int. J. 2017, 23, 323–339. [Google Scholar] [CrossRef]
  53. Deswanto, R.B.; Siregar, S.V. The Associations between Environmental Disclosures with Financial Performance, Environmental Performance, and Firm Value. Soc. Responsib. J. 2018, 14, 180–193. [Google Scholar] [CrossRef]
  54. Kalash, İ. Environmental Disclosure: Determinants and Effects on Financial Performance? An Empirical Evidence from Turkey. Sosyoekonomi 2020, 28, 95–115. [Google Scholar] [CrossRef]
  55. Ban, A.I.; Ban, O.I.; Bogdan, V.; Sabau Popa, D.C.; Tuse, D. Performance Evaluation Model of Romanian Manufacturing Listed Companies by Fuzzy AHP and TOPSIS. Technol. Econ. Dev. Econ. 2020, 26, 808–836. [Google Scholar] [CrossRef]
  56. Smith, A.E.; Humphreys, M.S. Evaluation of Unsupervised Semantic Mapping of Natural Language with Leximancer Concept Mapping. Behav. Res. Methods 2006, 38, 262–279. [Google Scholar] [CrossRef]
  57. Ciocan, C.C.; Carp, M.; Gerogescu, I. The Determinants of the Financial Reporting Quality: Empirical Evidence for Romania. Audit Financ. J. 2021, 19, 301–319. [Google Scholar] [CrossRef]
  58. Caratas, M.A.; Stanciu, V. Considerations Regarding Correlated Analysis between Comply or Explain Declaration and Non-Financial Reports. Audit Financ. 2021, 19, 145–155. [Google Scholar] [CrossRef]
  59. Beleneși, M.; Bogdan, V.; Popa, D.N. Disclosure Dynamics and Non-Financial Reporting Analysis. The Case of Romanian Listed Companies. Sustainability 2021, 13, 4732. [Google Scholar] [CrossRef]
  60. Hategan, C.-D.; Curea-Pitorac, R.-I.; Hategan, V.-P. Responsible Communication of Romanian Companies for Ensuring Public Health in a COVID-19 Pandemic Context. Int. J. Environ. Res. Public Health 2020, 17, 8526. [Google Scholar] [CrossRef]
  61. Nechita, E.; Manea, C.L.; Irimescu, A.M.; Nichita, E.-M. The Content Analysis of Reporting on Sustainable Development Goals. Audit Financ. 2020, 18, 831–854. [Google Scholar] [CrossRef]
  62. Alsmady, A.A. Quality of Financial Reporting, External Audit, Earnings Power and Companies Performance: The Case of Gulf Corporate Council Countries. Res. Glob. 2022, 5, 100093. [Google Scholar] [CrossRef]
  63. Huian, M. Post M&A Accounting Performance of Romanian Banks. J. East. Eur. Res. Bus. Econ. 2012, 2012, 184557. [Google Scholar] [CrossRef]
  64. Filip, B.F. Determinants of the Profitability in the Banking Systems of Western European Countries. In Proceedings of the 25th International Business Information Management Association Conference—Innovation Vision 2020: From Regional Development Sustainability to Global Economic Growth; Soliman, K., Ed.; International Business Information Management Association, IBIMA: Amsterdam, The Netherlands, 2015; pp. 443–453. [Google Scholar]
  65. Tudose, M.B.; Rusu, V.D.; Avasilcai, S. Financial Performance—Determinants and Interdependencies between Measurement Indicators. Bus. Manag. Econ. Eng. 2022, 20, 119–138. [Google Scholar] [CrossRef]
  66. Dănescu, T.; Popa, M.-A. The Inter-Conditioning between Corporate Governance and Financial Performance. Audit Financ. 2020, 18, 578–584. [Google Scholar] [CrossRef]
  67. Tiliuţă, B.A.; Diaconu, I.R.; Oanea, D.C. The Impact of Feminine Management on Banks Financial Performance: Evidence from Selected Countries from Europe. Stud. Bus. Econ. 2021, 16, 231–246. [Google Scholar] [CrossRef]
  68. Movileanu, M.; Danila, R. ESG—Opportunity to Change Strategy? Results of an Opinion Survey Conducted among Listed Companies; PWC: Bucharest, Romania, 2022; Available online: https://www.pwc.ro/en/press-room/press-releases-2022/pwc-romania-report--only-30--of-bvb-listed-companies-have-an-esg.html/ (accessed on 16 February 2023).
  69. Nirino, N.; Santoro, G.; Miglietta, N.; Quaglia, R. Corporate Controversies and Company’s Financial Performance: Exploring the Moderating Role of ESG Practices. Technol. Forecast. Soc. Change 2021, 162, 120341. [Google Scholar] [CrossRef]
Figure 1. Financial performance indicator analysis by the average values for the period 2017–2021.
Sustainability 15 16860 g001
Figure 2. The average disclosure scores on GRI topics and materiality.
Sustainability 15 16860 g002
Figure 3. The average disclosure scores on integrated business and sustainability strategy.
Sustainability 15 16860 g003
Figure 4. The average sustainability disclosure scores.
Sustainability 15 16860 g004
Figure 5. Comparative analysis of companies by Fin and ESG performance.
Sustainability 15 16860 g005
Figure 6. Results of content analysis of the sustainability reports of the top six ranked companies by ESGGeneral Score, using Leximancer.
Sustainability 15 16860 g006
Figure 7. Most dominant concepts revealed by frequency analysis.
Sustainability 15 16860 g007
Figure 8. The links between the most relevant ESG disclosed themes and concepts of the first-ranked companies.
Sustainability 15 16860 g008
Figure 9. Sankey diagram for the main ESG topics extracted from all sustainability reports.
Sustainability 15 16860 g009
Table 1. The scoring scale used for ESG data disclosed in the 2021 sustainability reports and ESG risks.
ESG Data Scoring ScaleESG Risk Scoring ScaleExposure to ESG Risk Scoring ScaleESG Risk Management Scoring Scale
0 = none5 = negligible risk5 = negligible exposure1 = no performance
1 = very poor4 = low risk4 = low exposure2 = low performance
2 = poor3 = medium risk3 = medium exposure3 = moderate performance
3 = satisfying2 = high risk2 = high exposure4 = good performance
4 = moderate1 = severe risk1 = severe exposure5 = very good performance
5 = good
6 = very good
7 = excellent
Table 2. Clusters based on the average values of ROE and ROA ratios.
Inputs and SummaryDescriptionClustersNumber of ItemsAverage ROE 2017–2021Average ROA 2017–2021Companies
VariablesAvg. ROE 2017–2021, Avg. ROA 2017–2021Cluster 160.161570.0092597AUT24E, ELMA, IMP, NRF, ROCE, and SFG
Level of detailCompaniesCluster 298.29276.3993ALR, ATB, BVB, EL, PTR, RMAH, SNN, SNP, and TGN
ScalingNormalized
Number of clusters4
Number of points19Cluster 3216.7731.97BRD and TLV
Between-group Sum of squares3.2114
Within-group Sum of squares0.1882Cluster 4220.35512.336ONE and TRP
Total sum of squares3.3996
Table 3. Descriptive statistics of sustainability scores.
Sustainability Average ScoresMeanMedianStd. Dev.Min.Max.SkewenessEx.
Kurtosis
AvgSustainDiscSc3.743.800.962.205.40−0.048153−1.2048
AvgALLGRISc3.553.881.211.505.50−0.27412−1.0229
AvgGRITopicsSc4.144.331.052.676.000.038235−1.0826
WGRI2010.970.920.170.751.250.34585−1.0403
WGRI3010.981.000.180.671.29−0.13787−1.0977
WGRI4011.011.070.180.501.33−1.21672.1262
Wmaterialit0.911.080.570.001.82−0.56298−0.66469
AvgESGRiskSc14.3013.004.705.3322.700.20368−0.66469
AvgExposRiskSc1.421.141.310.005.331.45672.3291
AvgMNriskSc16.9019.407.114.5027.50−0.41918−0.96810
AvgIntStratgSc3.323.001.032.005.500.55078−0.62893
AvgGenScore4.654.821.442.346.64−0.18804−1.1544
Table 4. Clusters based on the average values of overall ESG disclosure score, average ESG risk disclosure score, and the average ESG risk exposure score.
Inputs and
Summary
DescriptionClustersNumber of ItemsAvgESG Risk ScoreAvgESG Expos ScoreAvgGen ScoreCompanies
VariablesAvgGenSc ESGRiskSc ESGExposScCluster 169.6650.673782.9136BVB, ELMA, IMP, NRF, RMAH, and TGN
Level of
detail
CompaniesCluster 2420.8331.39266.4814BRD, PTR, SFG, and SNP
ScalingNormalized
Number of clusters4
Number of points19Cluster 3317.3333.77305.6031AUT24E, ROCE, and TLV
Between-group sum of squares3.7079
Within-group sum of squares0.70335Cluster 4613.0001.00564.6943ALR, ATB, EL, ONE, SNN, and TRP
Total sum of squares4.4113
Table 5. Final ranking of companies by global (FinESG) disclosure score.
CompanyCategory by SizeFinP ScoreFinP RankingESGGen ScoreESG RankingGlobal ScoreFinESG Ranking
ALRC1.010774.875582.17017
ATBC0.1124124.4644121.418014
AUT24EE0.2246114.8181101.602612
TLVA37.020816.0270527.72261
BRDA20.323436.6415116.21873
BVBE0.0807152.7242270.873617
ELMAD0.0299182.4302180.749918
RMAHE0.0945142.7818160.900616
IMPD0.2782103.4953151.243215
NRFR02E0.0107192.3363190.708219
SNNB2.472644.8105113.17394
SNPA23.400726.5528218.34622
ONEE0.357784.2643131.529513
ROCED0.0308175.964361.810710
PTRE0.0611166.341341.94509
TGNB1.728053.7137142.32375
ELC1.090164.835192.21356
SFGE0.1103136.390031.99428
TRPE0.296194.916171.682011
Table 6. Top 25 ranked concepts extracted from all sustainability reports.
NoConceptsAbsolute CountRelative CountAssociated Themes
1employees4833100%management, company
2management445592%management, report
3business342371%management, report
4company320466%company, products
5report296061%management, report
6products273757%products
7energy265255%energy
8safety265055%company, management
9development252952%company, products
10performance246651%report, management
11environmental237049%report, management
12health235149%company, management
13activities227447%products, company
14sustainability218945%management, report
15group215545%report, management
16risks214844%management
17operations209943%company, products
18training205142%company, management
19risk200041%company
20consumption196241%energy
21environment195340%products, company
22Romania194240%energy
23year190639%energy
24information180137%management
25waste176937%products, energy
Disclaimer/Publisher’s Note: The statements, opinions and data contained in all publications are solely those of the individual author(s) and contributor(s) and not of MDPI and/or the editor(s). MDPI and/or the editor(s) disclaim responsibility for any injury to people or property resulting from any ideas, methods, instructions or products referred to in the content.

