Article

Assessing Water Security and Coupling Coordination in the Lancang–Mekong River Basin for Sustainable Development

1
Beijing Key Lab of Study on SCI-TECH Strategy for Urban Green Development, School of Economics and Resource Management, Beijing Normal University, Beijing 100875, China
2
Key Laboratory of Plateau Geographic Processes and Environment Change of Yunnan Province, Faculty of Geography, Yunnan Normal University, Kunming 650500, China
3
Key Laboratory of Water Cycle and Related Land Surface Processes, Institute of Geographic Sciences and Natural Resources Research, CAS, Beijing 100101, China
4
University of Chinese Academy of Sciences, Beijing 100049, China
*
Author to whom correspondence should be addressed.
Sustainability 2023, 15(24), 16880; https://doi.org/10.3390/su152416880
Submission received: 31 October 2023 / Revised: 12 December 2023 / Accepted: 13 December 2023 / Published: 15 December 2023

Abstract

:
Water security is crucial for the sustainable development of regional water resources. Here, we utilize the Driver-Pressure-State-Impact-Response (DPSIR) framework to construct an indicator system for assessing water security in the Lancang–Mekong River Basin (LMRB). This study also delves into the level of development in the coupling coordination between the economic and social systems and the water resources systems in the basin. The findings reveal that the overall water security situation in the LMRB is satisfactory, with three countries (China, Laos, and Vietnam) surpassing the “safe” threshold and three countries (Thailand, Cambodia, and Myanmar) “Basically safe”. However, water security issues persist, particularly in relation to water pollution and scarcity. Seasonal water shortages and water-related disasters arise due to uneven rainfall distribution throughout the year and inadequate regulating facilities such as wetlands and reservoirs. In addition, the overall coupling coordination level in the LMRB is low, ranging between 0.3 and 0.4, corresponding to a moderate imbalance level in the assessment criteria system. Specifically, Laos and China exhibit the highest coupling coordination level, with a degree of 0.36, whereas Thailand and Myanmar demonstrate the lowest level, with degrees of 0.33 and 0.31, respectively. Overall, our results offer a scientific foundation for the sustainable development of countries within the LMRB.

1. Introduction

Water is vital for sustaining natural ecosystems and fostering social and economic development. However, global climate change has intensified the challenges facing water security by increasing demand, degrading quality, and reducing availability [1,2,3]. This poses a significant obstacle to regional and global development, impacting food and environmental security [4,5]. Assessing water security has become crucial for promoting comprehensive and harmonious regional development [6,7]. Given the multifaceted nature of water security, a holistic approach involving various sectors is necessary [8,9]. The challenge lies in determining a suitable index system and an effective quantitative assessment method that accommodates uncertainties arising from random and fuzzy conditions [10,11,12].
Traditional water security assessments rely on a single quantitative indicator, limiting their scope. Comprehensive indices, such as the Water Poverty Index (WPI) [13,14] and the Water Resources Carrying Capacity Equilibrium Index (IWSD) [15], aim to provide a more accurate assessment. A top-down approach, involving target, criterion, and indicator levels, has gained traction for regional water security assessments, offering specific and focused analyses [16,17,18,19,20,21,22]. The DPSIR framework, analyzing drivers, pressures, state, impacts, and responses, comprehensively captures the internal relationships in water systems [23,24]. Combining this framework with water security indicators ensures a systematic reflection of the regional water resources situation.
Crucially, weighting indicators is vital for comprehensive water security assessment, reflecting their relative importance [25,26]. Subjective methods, relying on expert judgment, and objective methods, utilizing mathematical approaches based on indicator data characteristics, are employed for this purpose [27,28,29,30,31,32,33]. Integrated water security assessment involves quantitatively evaluating the overall degree of water security in an area through systematic and standardized methods that assess multiple indicators simultaneously [34,35]. The assessment system in this study, based on the DPSIR framework, aligns well with the applicability of the fuzzy comprehensive evaluation method, especially “Single-index Quantification-Multi-index Comprehensive-Multi-criteria Integration Partner (SMI-P)”.
Balancing water and socio-economic systems is crucial for regional water security. Rapid industrialization, urbanization, and population growth have increased water resource demand, leading to an imbalance between economic development and the water environment’s carrying capacity [36]. Achieving sustainable development requires balancing economic growth and water security [37,38,39]. Recent studies emphasize assessing intrinsic linkages between economic growth and the environment to reveal development trends and patterns, maintaining ecological health while balancing resource development [40,41,42]. However, there is still relatively limited research on the coordinated development of water security and the economy.
The Lancang–Mekong River Basin (LMRB) connects China and five Southeast Asian countries, sharing interdependent ties regarding water resources, ecological environment maintenance, and biodiversity conservation [43,44,45]. This region faces challenges due to rapid economic development, population growth, and urbanization, causing an imbalance between increasing water demand and its scarcity [46,47]. Research related to the progress of Lancang–Mekong River Basin studies has mainly focused on changes in precipitation [48,49,50], cooperation in water resources and management [51,52,53], hydropower dam development [54,55], changes in runoff [56,57,58,59], droughts and floods [60,61], and the water-food-energy nexus in the basin [62,63]. Although these studies have analyzed different aspects of water security, the differences in water security among the six countries in the basin have largely been neglected. This study aims to establish a systematic water security assessment system, comparing indicators in six basin countries and highlighting differences in water security status. The study employs subjective and objective weighting methods to obtain rigorous and pragmatic results. The coupling coordination model assesses the relationship between subsystems, providing a scientific reference for effective regional water resource management.

2. Materials and Methods

2.1. Data

The LMRB is a transboundary basin involving six countries, which presents challenges in selecting data for water security indicators due to inconsistent data and standards among studies in these countries. To ensure the consistency and validity of the assessment results, we used publicly available and consistent data at the global level whenever possible and recognized the limitations of data accessibility (Table 1). As the study covers several countries and specific data scales, it was difficult to obtain long-time-series data from the same source for each country. Therefore, this study refers to the current water security situation in the LMRB. The water security assessment system includes dynamic and static indicators, as well as qualitative and quantitative ones. In such a situation, evaluating a base year may be unreasonable, and the indicators need to be analyzed for their ability to characterize the time scale. In this study, data indicators were classified as described previously. Multi-year averages were used for data on water hazards and their consequences due to their contingency and uncertainty. However, there are objective limitations in obtaining data on natural water quality on a global scale, and we therefore used the average of water quality indicators published by the World Bank from 1992 to 2010 to reflect the water quality of regional natural water bodies. Finally, the most recent data update was selected for the assessment of the status quo characterization category indicators to account for differences in the availability of different indicators.

2.2. Methods

This paper adopts a comprehensive approach to assessing water security in the LMRB. The first step is to select indicators and construct an assessment system based on the DPSIR framework. Next, a combination of subjective and objective methods, namely AHP hierarchical analysis and the entropy value method, is used to measure the weight of the indicators. The SMI-P method is then used to assess the state of water security and to identify issues in each country within the basin. Finally, a coupling coordination model is used to explore the factors affecting the coordinated development of the countries in the basin. Overall, the methods used in this study provide a robust framework for assessing water security in the LMRB and identifying issues for improvement. The specific methods involved in the above are as follows:

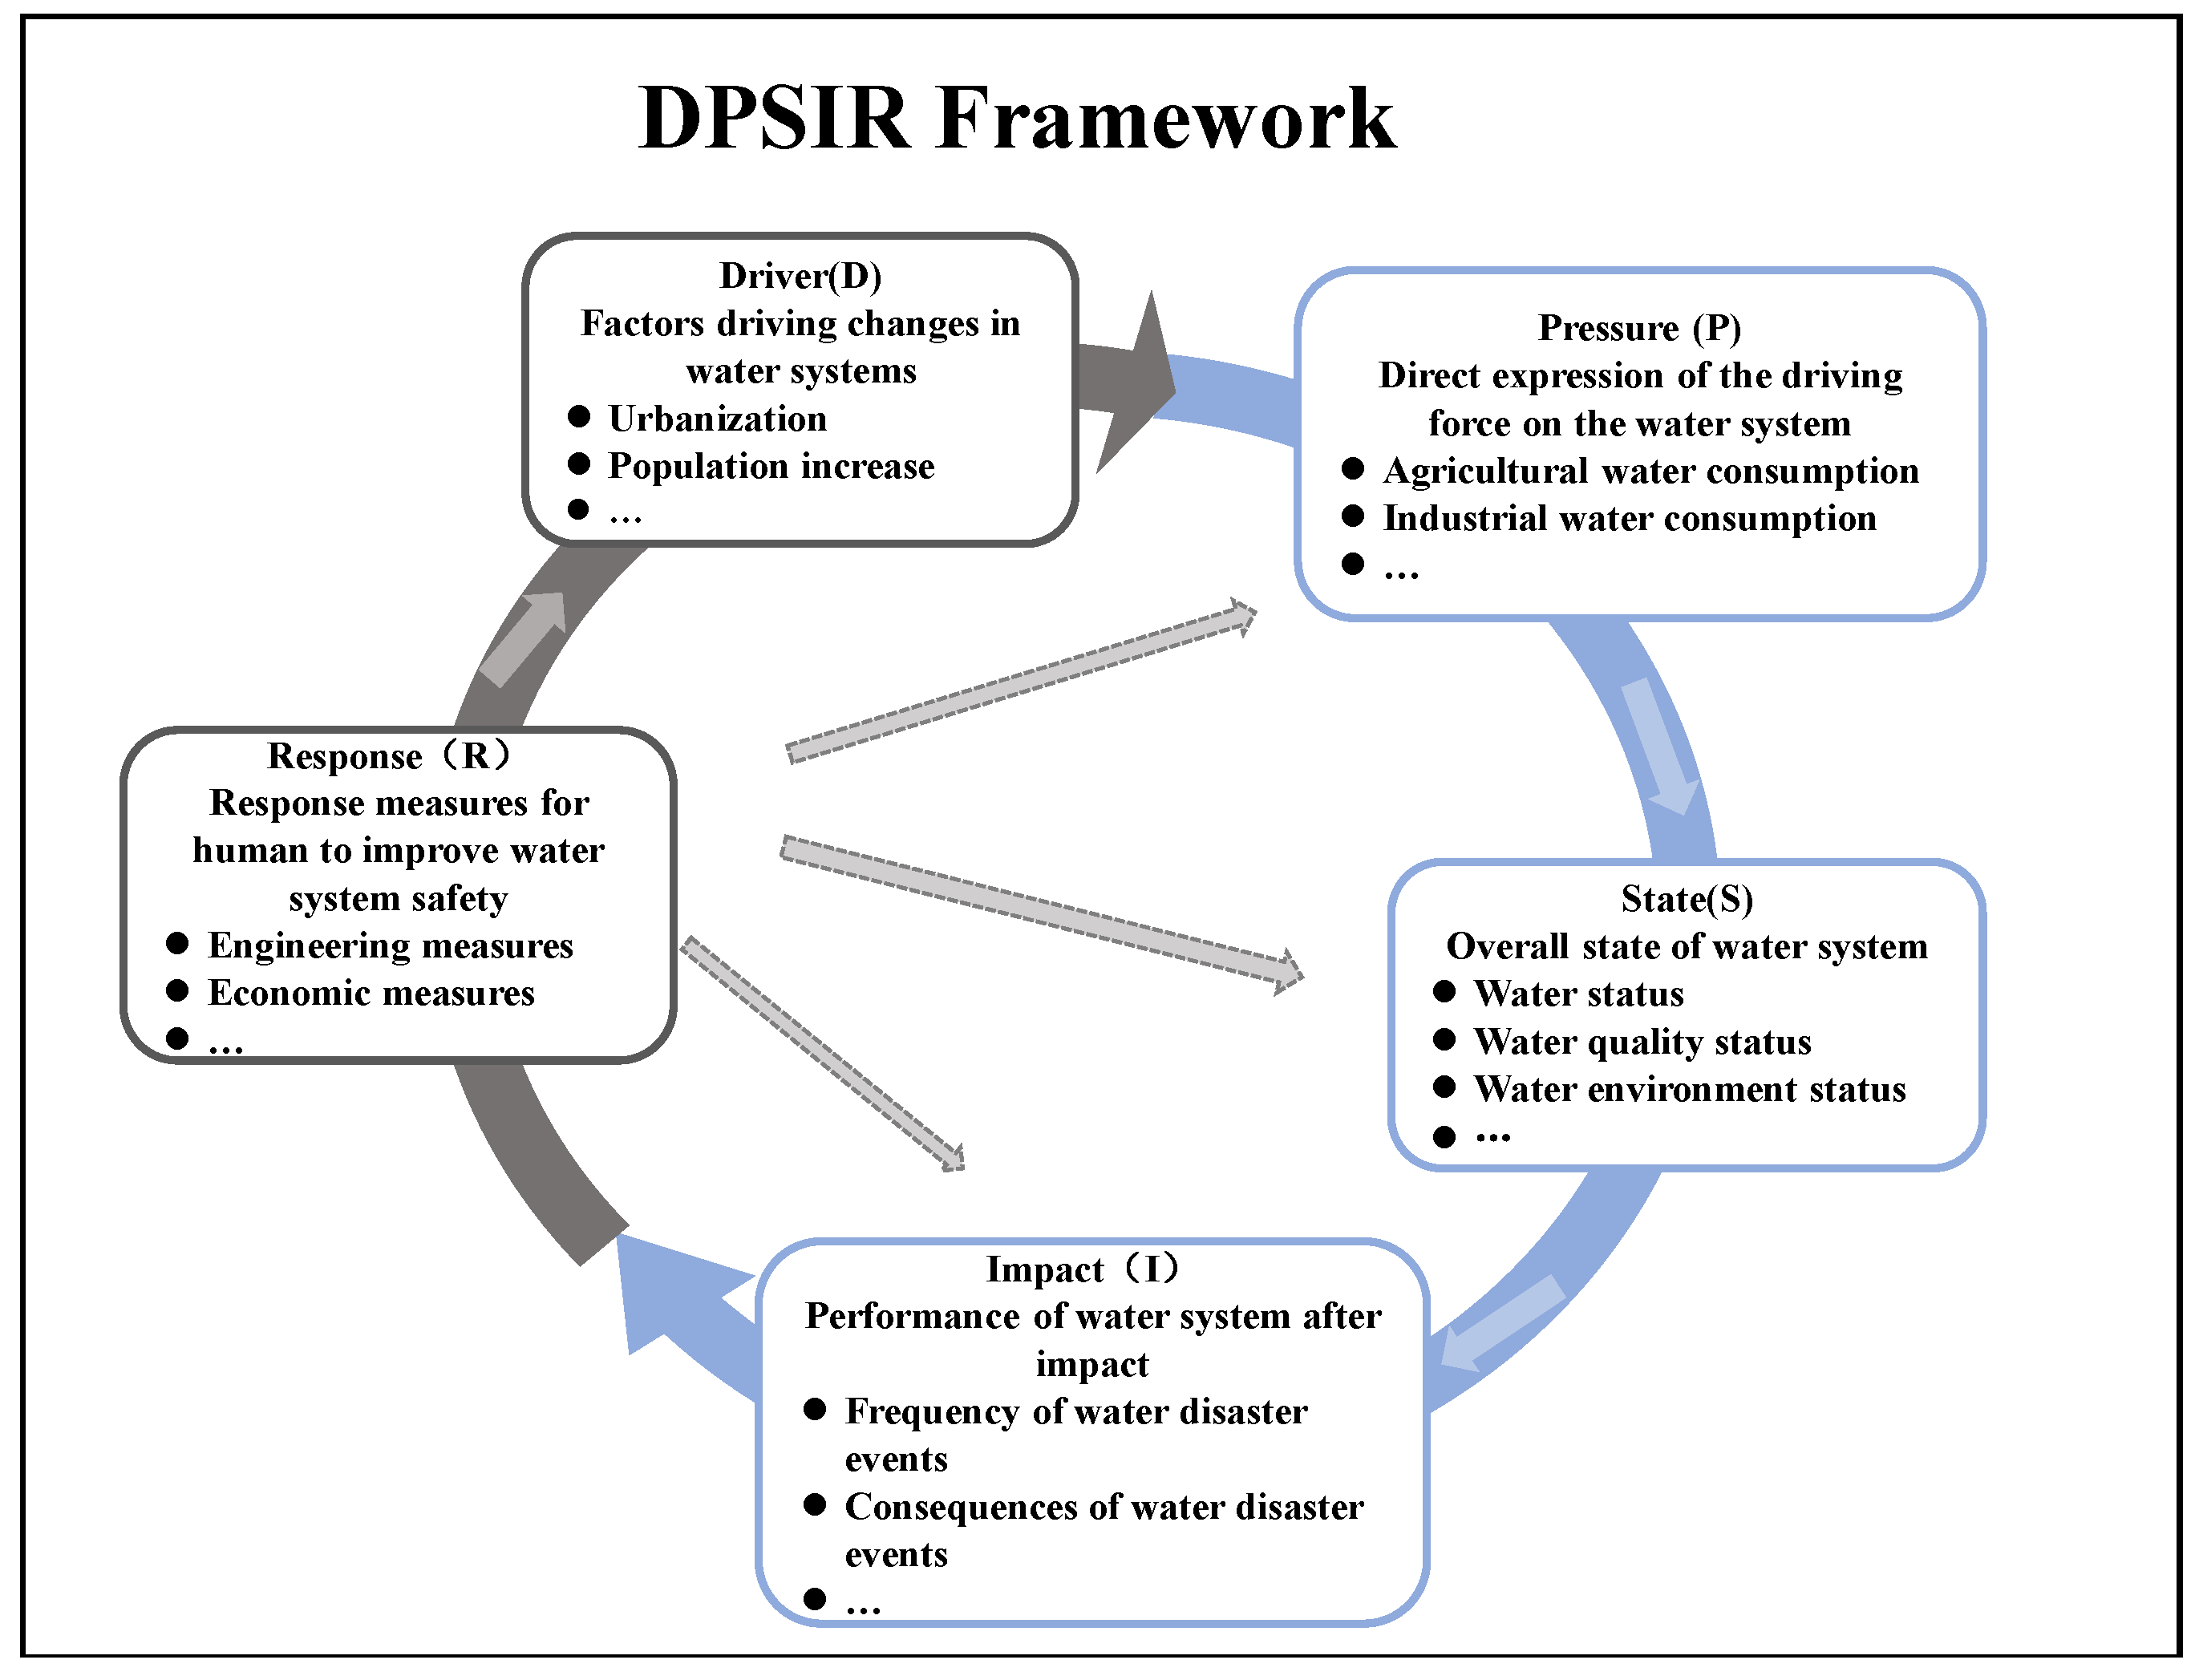
2.2.1. Indicator System Construction Method

This paper proposes a water security indicator system for the LMRB based on the DPSIR framework, where each subsystem is interconnected and mutually constrained [23,64]. The “Drivers” subsystem represents the fundamental human factors that can cause changes in water resources and the water environment, such as economic development, population growth, and urbanization. The “Pressure” subsystem is the result of the drivers and includes factors that may stress the water system and the water environment, including water use by each sector and water stress. The “State” subsystem reflects the water system and the water environment in the “Pressure” state, representing the assessment objectives, such as water quality, water quantity, and the state of the water environment. The “Response” subsystem represents the “Pressure”, “State”, and “Impact” subsystems, where relevant indicators are taken to respond to the state, mostly expressed as policy measures as well as legal and socio-economic instruments. By decoupling the feedback mechanisms among the modules of the DPSIR framework, this paper examines which human activities cause changes in the water system (D), how they affect the water system (P), what changes occur in the water system (S), what consequences they have (I), and how each country responds to the water security crisis (R). Figure 1 shows the internal linkages within the DPSIR framework.

2.2.2. Indicator Weighting Method

This paper proposes a hybrid approach for determining the weights of water security assessment indicators in the LMRB, integrating subjective and objective weighting methods. The subjective weights are derived through the Analytic Hierarchy Process (AHP), while the objective weights are calculated using the Entropy Weight Method (EWM). Based on expert opinions and an extensive literature review, we assign equal importance (50:50 weighting) to each approach in the determination of indicator weights.
In applying the Analytic Hierarchy Process (AHP) to our research, we systematically decomposed the water security assessment into hierarchical levels of criteria and sub-criteria. Experts, possessing domain knowledge, provided pairwise comparisons of these criteria based on their perceived importance. The resulting comparative judgment matrix allowed us to calculate the subjective weights of each criterion. To ensure the reliability of the AHP results, we conducted a thorough compatibility check, involving the assessment of consistency in expert judgments. Any identified inconsistencies were addressed to refine the weights. The final outcome of the AHP process was a set of weights for each indicator, crucial for the overall assessment of water security in the LMRB.
For the Entropy Weight Method (EWM), our application involved determining the objective weights of water security indicators based on their impact on the LMRB system. We calculated the information entropy for each indicator, utilizing this measure to quantify the degree of disorder or variability that each indicator introduced into the assessment. Indicators with lower information entropy, indicating a higher degree of information and system variation, were assigned greater weights in the evaluation. Conversely, indicators with higher information entropy, signifying lower information content, received lower weights. This process ensured that the EWM objectively reflected the indicators’ contributions to the overall water security assessment.

2.2.3. Integrated Water Security Assessment Method

This paper assesses the water security status of countries in the Mekong Basin using the Single-index Quantification-Multi-index Comprehensive-Multi-criteria Integration Partner (SMI-P) method of fuzzy integrated assessment. First, we quantify the indicators at the single indicator level and identify their differences among the different countries in the basin, based on their characteristic values. Second, we combine the weight values calculated at the criterion level with the quantified indicators, based on the quantification of individual indicators, to calculate the degree of certainty for each quasi-measurement level. Finally, we perform a multi-criteria synthesis to calculate the overall water security level for each country in the basin, determine the water security level, and identify the water security status.
(1)
Single-index quantification
The classification of eigenvalue criteria for water security assessment is a critical step in quantifying individual indicators. In this study, segmented linear affiliation measures are used to assess the sub-security of each indicator on a scale of 0 to 1. The values of a, b, c, d, and e correspond to the worst, worse, pass, better, and optimal levels of each indicator, respectively. The sub-safety level of positive indicators increases with increasing values, whereas the sub-safety level of negative indicators decreases. The equation is as follows [65]:
I S D i = 0 , x i a i 0.3 x i a i b i a i , a i < x i b i 0.3 + 0.3 x i b i c i b i , b i < x i c i 0.6 + 0.2 x i c i d i c i , c i < x i d i 0.8 + 0.2 x i d i e i d i , d i < x i e i   1 , x i > e i ,
I S D k = 1 , x k < e k 0.8 + 0.2 x k d k e k d k , e k x k < d k 0.6 + 0.2 x k c k d k c k , d k x k < c k 0.3 + 0.3 x k b k c k b k , c k x k < b k 0.3 x k a k b k a k , b k x k < a k 0 , x k a k ,
As the LMRB is a transboundary river, the assessment indicators used in this study should be consistent with international consensus or common practice, such as the Transboundary Waters Assessment Programme and the World Resources Institute reports. In addition, the selection of water security assessment indicators must consider regional characteristics and may be based on current values and trends in similar river systems. Notably, the assessment indicators in this study are relatively complex, and some of them lack quantitative classification criteria. Therefore, this paper draws on domestic and international research and considers the unique circumstances of the LMRB.
Specifically, the Transboundary Waters Assessment Programme (TWAP) report on the Lancang–Mekong River from the United Nations Environment Programme is used to assess average annual runoff, reservoir capacity, the density of hydropower dams, and other indicators. The proportion of the population with access to safe drinking water and basic sanitation is based on reports from the WHO/UNICEF Joint Monitoring Programme (JMP) on Water Supply, Sanitation, and Hygiene. Government investment in water and sanitation is classified according to World Bank standards for developing countries. The original EM-DAT database and the “1989–2018 dataset of typical cases of major global flood disasters” are used, among others, to classify indicators related to the frequency of droughts and floods, the number of deaths caused by water-related disasters, and the economic losses caused by water-related disasters. Water stress is assessed based on the ratio of water demand to available water, with allocation standards taken from the Water Environment Partnership in Asia (WEPA) and the report “Capacity Building for Water Quality Improvement in Lancang–Mekong Countries”. The classification of water quality indicators varies widely among countries. In this study, the World Bank values for biological oxygen demand, conductivity, and nitrate–nitrite concentration in Southeast Asian rivers are used as the standards for classification. For the classification of the indicator “area of lakes, reservoirs, and wetlands”, the proportion of these areas in the basin is used instead of the area of the LMRB alone. Population density, GDP per capita, and urbanization rate are classified based on the World Resources Institute’s (WRI) “Water Security” section.
(2)
Comprehensive multi-index
The index weight determined by the subjective and objective weighting methods is used to calculate the security levels of the five criteria layers in the DPSIR framework, using the following equations:
W D = k = 1 n 1 w k I S D k ,
W P = k = 1 n 2 w k I S D k ,
W S = k = 1 n 3 w k I S D k ,
W I = k = 1 n 4 w k I S D k ,
W R = k = 1 n 5 w k I S D k ,
where W D W P , W S W I , and WP are the security degrees of each criterion layer; w k is the kth indicator weight; and n 1 , n 2 , n 3 , n 4 , and n 5 are the numbers of classification of each layer.
(3)
Multi-criteria synthesis
The security level of the target layer in the DPSIR framework is calculated using the weight of the criterion layer as determined by the subjective and objective weighting methods. The equation is as follows:
W S D = β 1 W D + β 2 W P + β 3 W S + β 4 W I + β 5 W R ,
where W S D (Water security Degree) is the total regional water security, and β 1 , β 2 , β 3 , β 4 , and β 5 are the weights of each criterion layer. Based on relevant studies [66,67], water security is classified into five levels (Table 2).

2.2.4. Coupling Coordination Method

The coupling coordination degree model is a useful tool to analyze the degree of the coordinated development in different systems. It measures the dynamic correlation between two or more systems that interact and influence each other, reflecting the degree of interdependence and mutual constraints between the systems [41]. In the context of the DPSIR model, the five criterion layers of drivers, pressure, state, impact, and response are interrelated and mutually constrained, and the coupling coordination degree model can be used to quantitatively measure the degree of coordinated development among these subsystems. Moreover, the model can identify the lagging system, which refers to the subsystem that impedes the overall coordinated development [40,42,68]. The model involves the calculation of three index values: the coupling degree (C), the coordination index (T), and the coupling coordination degree (D). In this paper, we refer to previous studies for the categorization of the coupling coordination into five types and three stages of development based on relevant studies [69,70,71], as presented in Table 3. The equation for calculating the coupling coordination degree is as follows [72]:
C = 5 U D U P U S U I U R 5 U D + U P + U S + U I + U R
where U D , U P , U S , U D I , and U D R correspond to the integrated values of the DPSIR framework’s driver, pressure, state, impact, and response subsystem, respectively. To ensure consistency, the integrated values of each subsystem are determined based on the method described in Section 2.2.3, using the following equation:
T = α 1 U D + α 2 U P + α 3 U S + α 4 U I + α 5 U R ,
where α 1 , α 2 , α 3 , α 4 , and α 5 denote the contribution of each subsystem to the level of coordinated regional water security. In this study, it is assumed that each subsystem is equally significant in the coordinated development of regional water security, and thus, α 1 = α 2 = α 3 = α 4 = α 5 = 0.2. The equation is as follows:
D = C × T ,

3. Results

3.1. Analysis of the Indicator Weighting Results

Based on the DPSIR framework, a combination of the AHP and the EWM was employed to assign weights to 26 water security indicators in the LMRB. Figure 2 shows the calculation results. From the perspective of the criterion level, the weight distribution was mainly concentrated on the State layer (0.2689) and the Response layer (0.2974), followed by the Impact layer and the Pressure layer, with weights of 0.1785 and 0.1435, respectively. The lowest weight was calculated for the Driver layer (0.1143).
The State layer had a weight of 0.2689, and the proportion of wet season precipitation to annual precipitation had the highest weight (0.2340), emphasizing the impact of seasonal precipitation on regional water security. Forest cover, lakes, reservoirs, and wetlands had weights of 0.1306 and 0.1106, respectively, highlighting the significant impact of the water environment status within the basin. The Response layer had a weight of 0.2974, with the reservoir capacity indicator having the highest weight (0.2174). Human activities related to water management and system improvement were critical to ensuring water security. In the Impact layer, the frequency of flooding had the highest weight (0.3460), and the weight of drought frequency was 0.2758, reflecting the high impact of droughts on the regional water security in the basin. The Pressure layer had a weight of 0.1435, and the weight of water pressure was 0.4264, indicating that the ratio of regional water demand to available water is an important factor affecting regional water security. The Driver layer was mainly driven by the GDP per capita (0.4422) and the urbanization rate (0.3590), reflecting the strong impact of economic development on water systems and the environment in the LMRB.

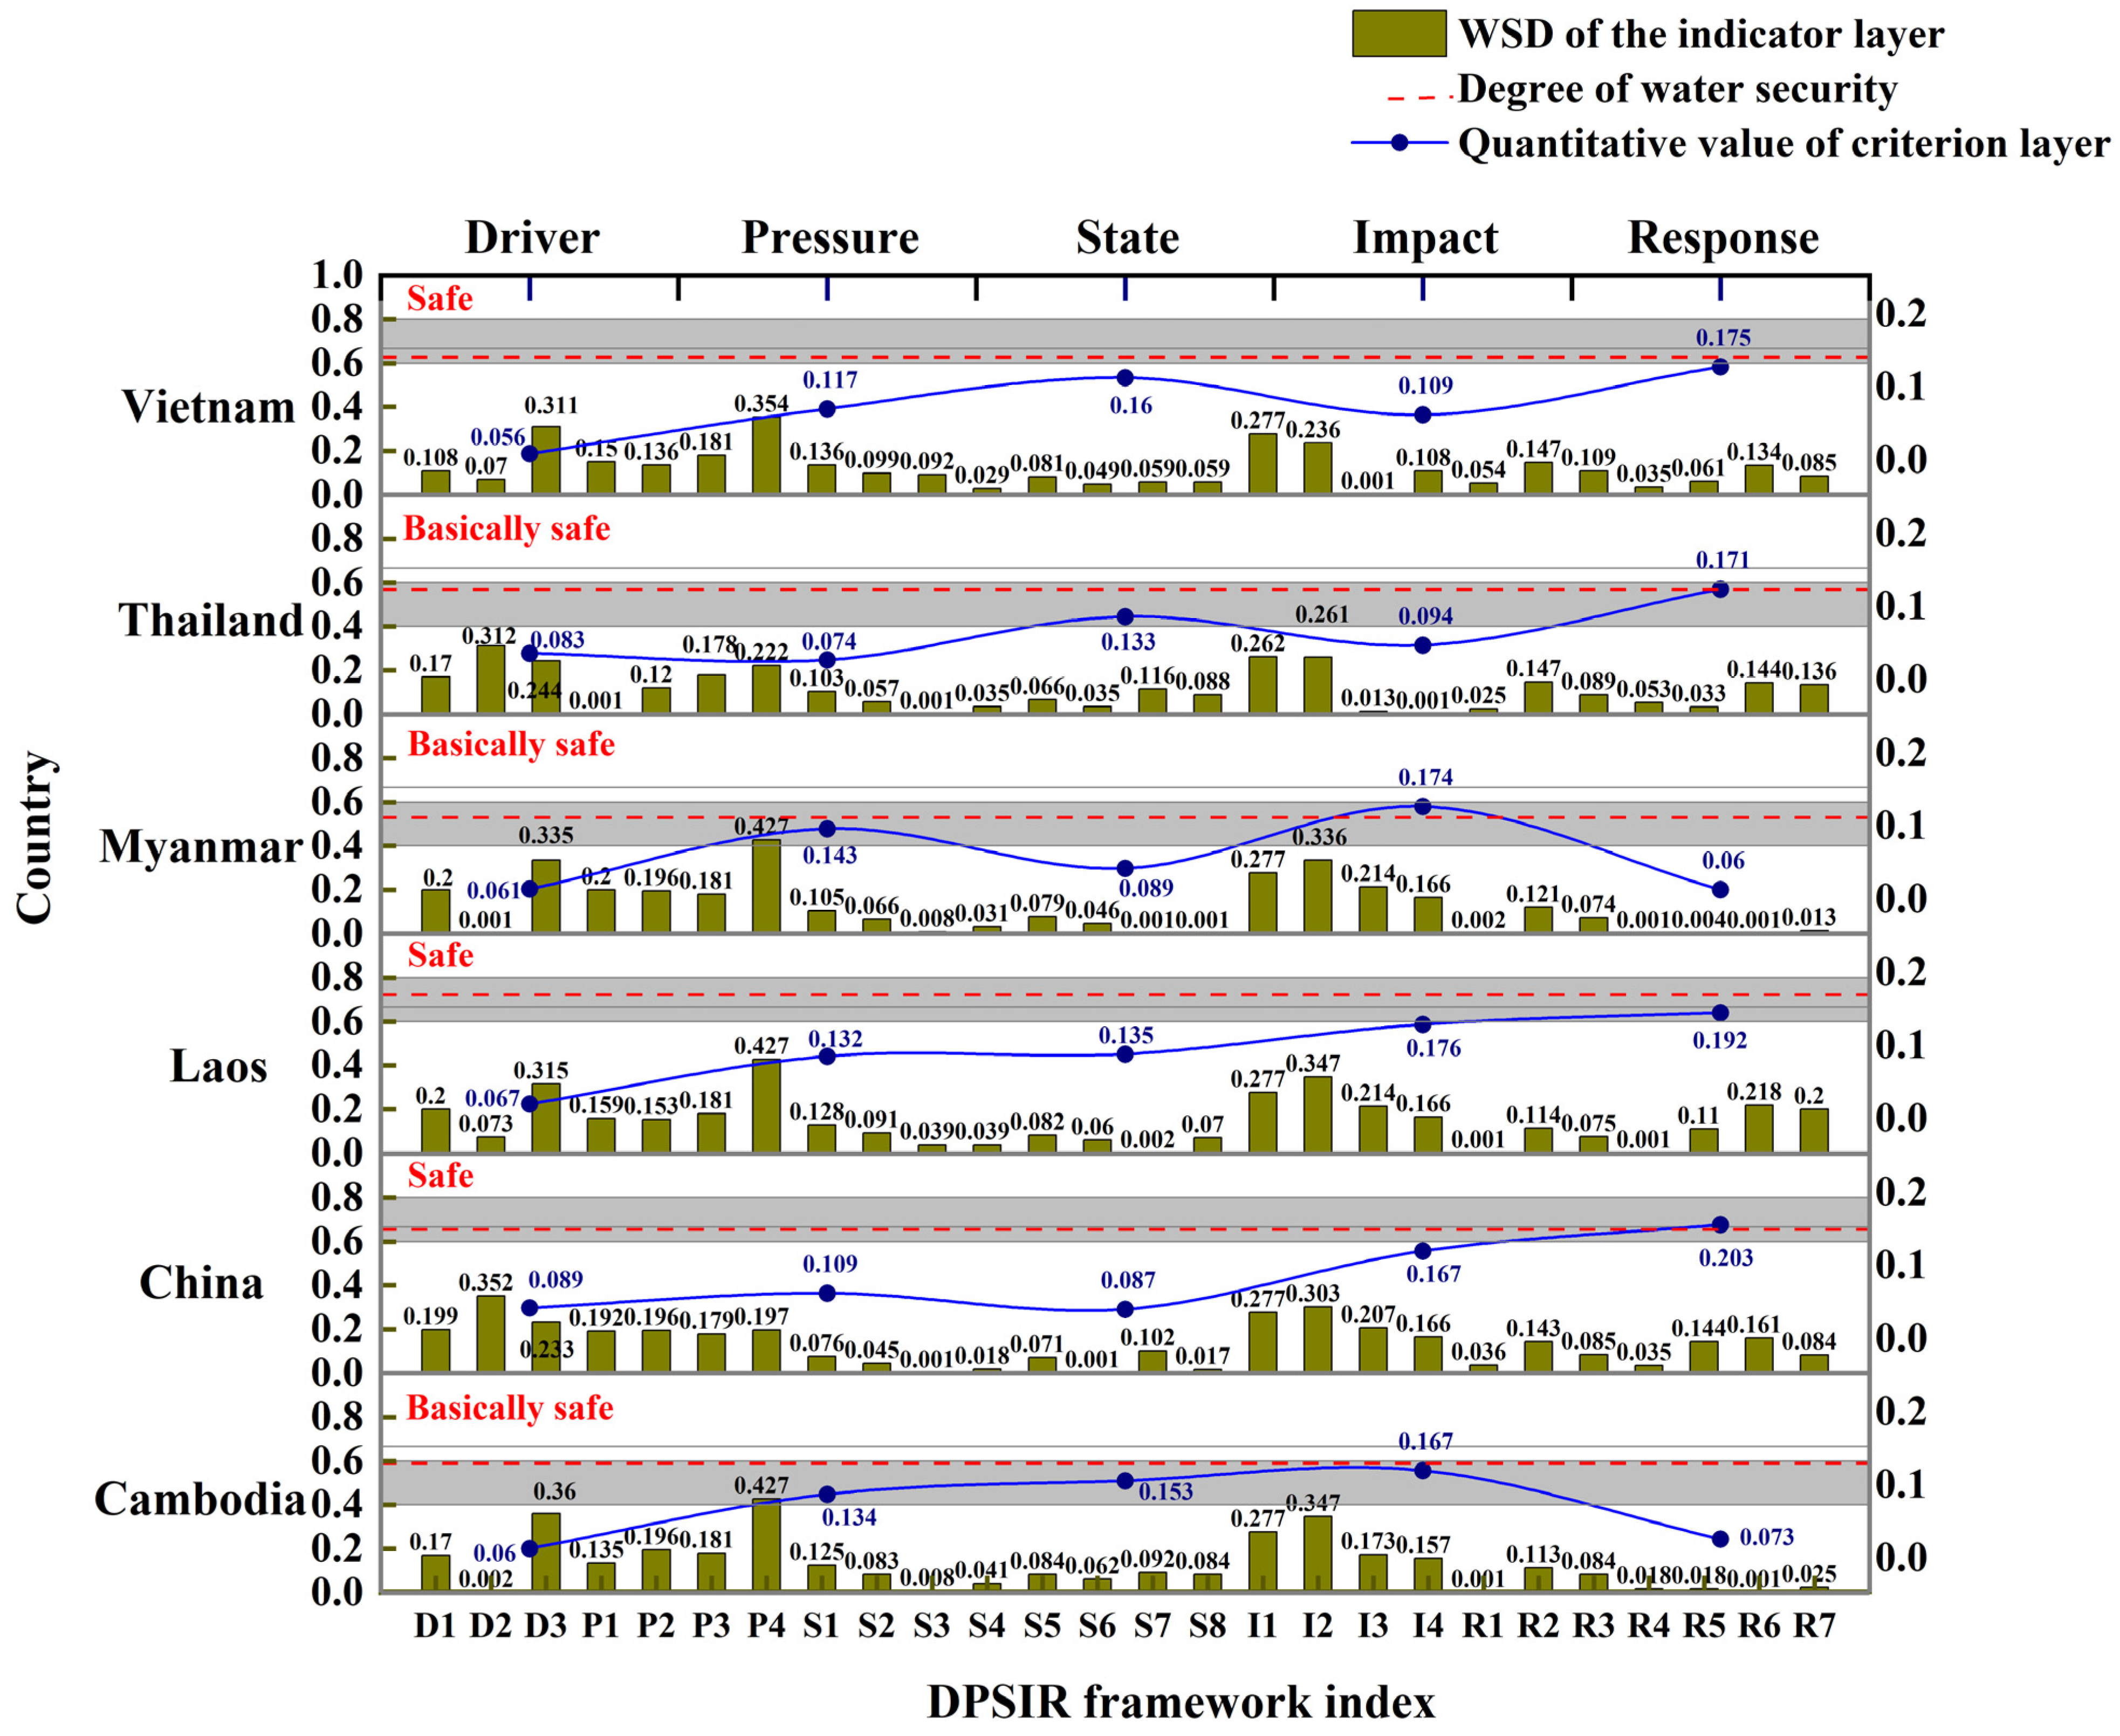
3.2. Comprehensive Assessment of Water Security in the Lancang–Mekong River Basin

Water security in the LMRB was assessed using the AHP and the EWM to obtain the combined subjective and objective weighting results. The Single-index Quantification-Multi-index Comprehensive-Multi-criteria Integration Partner (SMI-P) method was then employed to assess the water security level of each country in the basin. Overall, the water security in the basin is good and above the “safe” line, with Laos having the best water security, followed by China and Vietnam, which are rated as “safe”. Cambodia, Thailand, and Myanmar have a relatively low level of water security and are in a “basically safe” state, indicating a less optimistic water security situation. Due to differences in geographical location, economic development, degree of water resource development, and focus of the basin countries, each country’s water security presents a different state, with differences in the factors affecting water security issues. Figure 3 shows the results of the water security assessment for the Lancang–Mekong countries.
Specially, the water security level in Laos is considered “safe” at 0.702, with the Impact and Response criterion layers ranging from 0.15 to 0.20, indicating effective water security management and a relatively comprehensive water security system. However, the socio-economic development of Laos is exerting significant pressure on regional water resources, which is reflected in a low Driving criterion layer of 0.067. This leads to changes in the water environment, resulting in lower water security scores (0.132 and 0.135) in the Pressure and State criterion layers, respectively. China had an overall water security score of 0.655, also classified as ‘safe’, with a response criterion score of 0.203, the highest in the entire basin, suggesting that China’s water security capabilities and related capacity building are complete and meet the water security needs. However, the country’s socio-economic development resulted in increased water use pressure and changed water resource conditions, which has led to low water security scores of 0.109 and 0.087 in the Pressure and State criterion layers, respectively. Vietnam’s overall water security level was 0.617, with the Driver criterion layer having the lowest value in the entire basin (0.056), indicating that uncontrolled socio-economic development is a significant cause of regional water security issues. In addition, Vietnam’s water security Impact criterion layer was low, making regional water security vulnerable to water hazards. However, the country’s water security Response criterion level was high at 0.175, indicating a strong regional water security capacity. Cambodia, on the other hand, is rich in water resources, with numerous lakes, reservoirs, and wetlands, high forest cover, and good water retention and renewal capacity. Cambodia’s water quality and environment are in good condition, and the corresponding State criterion level for water security was therefore high (0.153). In addition, Cambodia has a low economic development level and low regional water stress, which resulted in a high water security level with a Pressure score of 0.134. However, Cambodia’s water infrastructure is poor, and its water management capacity is weak, leading to a Response criterion score of 0.073. Thailand’s water security level was classified as ‘basically safe’, with a score of 0.554, with the Pressure and Impact criteria scores being the lowest in the basin (0.074 and 0.094, respectively). This indicates that the country’s abundant economic and water resources have resulted in a water-dependent economy and intensive economic activity, leading to high water stress and greater negative impacts of water-related disasters. Finally, Myanmar had the lowest water security level in the basin, with a score of 0.528, also classified as “basically safe”. Although Myanmar’s low economic level resulted in low water pressure, with a level of 0.143, it was the highest in the basin. Due to economic constraints, Myanmar is still under pressure and faces water security challenges, with the lowest water security score in the basin (0.061), which is insufficient to meet the regional water security needs.

3.3. Analysis of the Coupling Coordination Degree between Water Security Subsystems in the Lancang–Mekong River Basin

Water security is essential for sustainable economic development, and achieving a coordinated development between water resources and socio-economics is crucial to ensure water security. In this study, we propose a coupled coordination model to explain the interrelationships between the subsystems of the DPSIR framework. This model quantitatively reflects the degree of coordination in the “socio-economics-water stress-water status-water disasters-water management” system, which can help to assess the rationality of the regional economic development model, water resources development and use, and water resources management capacity. The coupled coordination model consists of two main components: the degree of coupling between systems and the degree of coordination between systems. The coupling degree is calculated by measuring the distance between systems to determine the coupling situation. The degree of coordination is calculated by the relative deviation coefficient to determine the degree of coordination. Figure 4 shows the results of the degree of coordination analysis.
Overall, the Lancang–Mekong River Basin has a low level of coupling coordination, with a degree of coupling coordination between 0.3 and 0.4. This level corresponds to the moderate imbalance level of the assessment criterion system. Specifically, the coordination between “socio-economic-water stress-water condition-water disaster-water response” is unbalanced. Among the countries in the basin, Laos and China had the highest level of coupling and coordination, with a coupling and coordination degree of 0.364 and 0.361, respectively, followed by Vietnam and Cambodia with a coupling and coordination degree of 0.339 and 0.329, respectively. In contrast, Thailand and Myanmar had the lowest levels of coupling and coordination, with a coupling and coordination degree of 0.325 and 0.310, respectively.

4. Discussion

4.1. Constraints to Water Security in the Lancang–Mekong River Basin

The Lancang–Mekong Basin water security assessment analyzes the current state of water security in the basin countries and identifies the constraints affecting it. With economic development, population growth, and climate change affecting the region, water security issues are becoming increasingly serious. The water security assessment shows that the identified constraints are consistent with the actual water security issues in the basin countries, indicating that a water security assessment system based on the DPSIR framework is appropriate. By combining the AHP and the EWM for subjective and objective indicator weighting and using the comprehensive assessment method of single indicator quantification-multi-criteria synthesis-multi-criteria synthesis (SMI-P), the approach is both scientific and feasible. The assessment results are objective and valid, making the identification and analysis of water security constraints based on the assessment results a crucial step in the protection and regulation of regional water security.
Water security in the Lancang–Mekong Basin is mainly influenced by three factors: climate, economic development, and water infrastructure. Climate, which varies across the basin, is a critical element affecting water security. The highland mountain, subtropical monsoon, and tropical monsoon areas have high rainfall but an uneven intra-annual rainfall distribution, resulting in an indicator “intra-annual rainfall distribution” of less than 0.1. Climate is therefore a key factor affecting water security in the Mekong River Basin. Economic development is also an important component of water security in the Lancang–Mekong Basin. With increasing economic development, the level of government investment in water and sanitation, the proportion of the population with access to improved drinking water, and access to basic sanitation also increase. Although there is a positive correlation between economic development and regional water supply and sanitation, water quality indicators such as ‘biological oxygen demand’ and ‘electrical conductivity’ are negatively correlated with the level of economic development. The higher the level of economic development, the lower the quantified value of these indicators and, consequently, of the regional water quality. Water infrastructure is another critical component of water security in the Lancang–Mekong Basin. The better the ‘response’ to water security, the better the ability to maintain water security in the basin. Laos and China had higher water security scores of 0.528 and 0.389, respectively, than the other four countries in the basin, mainly because of their good water infrastructure and, as a result, higher water management capacity.
The Lancang–Mekong River Basin is home to a diverse range of countries, each facing unique water security constraints. For example, the Lancang River area in China, for instance, has a large undulating terrain, mostly high mountains and valleys, with a small area of lakes and wetlands. Due to this topography, the river has a weak natural water regulation capacity, as indicated by a score of only 0.017 for indicator S8 (Lake, reservoir, and wetland area) [73]. The rapid economic development of the region also had a negative impact on water quality, with indicators S4 (Water biological oxygen demand), S5 (Water conductivity), and S6 (Water nitrate–nitrite concentration) showing a relatively poor water quality, scoring only 0.018, 0.071, and 0.001, respectively [55,74]. Despite abundant precipitation, the Lancang River Basin is prone to droughts, particularly in the spring season. This is because of burning winds, which cause low precipitation levels and frequent droughts, resulting in considerable economic losses. Indicators I1 (Drought frequency) and I4 (Economic losses caused by water disasters) scored 0.277 and 0.166, respectively, suggesting a high frequency of droughts and economic losses in the region. The large agricultural area in the Lancang River Basin makes the economic losses from droughts even greater, particularly as drought-induced agricultural losses occur [75]. Lao PDR, on the other hand, has a low economic development level and a low population density, with most of its inhabitants living in rural areas. Unfortunately, the country also has low safety values of R2 (Proportion of population with access to improved drinking water) and R3 (Proportion of sanitation facilities receiving basic improvements), which characterize safe drinking water, scoring only 0.114 and 0.075, respectively. This makes the health issues of the population caused by drinking water more prominent [76]. Additionally, the wastewater treatment capacity in Laos is poor, with a quantitative indicator of only 0.001, the lowest in the entire basin. Based on previous studies, rural sanitation in Laos was only 36% in 2004, with only 0.1% of flushing toilets having septic tanks or sewerage systems [77,78].
Myanmar’s economy is dominated by the primary sector, and changes in land use have led to the conversion of a large proportion of former forested areas into arable and mining areas. This has inevitably led to the deterioration of the water environment and, thus, affected water quality. Furthermore, the construction of infrastructure, such as the sewerage network collection system, is lagging behind, with indicator R4 (Wastewater treatment capacity) scoring only 0.001, exacerbating the outstanding water quality issues in the Myanmar section [79,80]. The Lancang–Mekong section in Myanmar is relatively short and a border river, with only some small hydropower stations and indicators R5 (Installed capacity of hydropower dam), R6 (Reservoir capacity), and R7 (Hydropower dam density) scoring only 0.110, 0.218, and 0.200, respectively. The low water infrastructure development level has resulted in a weak response to changes in the water environment and water security conditions [81,82].
In Thailand, the combination of a high economic level, a growing population, and accelerated urbanization has led to high water stress, making the stress criterion layers P1 (Agricultural water consumption), P2 (Domestic water consumption), P3 (Industrial water consumption), and P4 (Water pressure) those with the lowest values in the basin, with 0.001, 0.120, 0.178, and 0.222, respectively, with high regional water demand. According to previous studies, Thailand faces a conflicting water supply and demand during its dry season due to a weak water regulation capacity and a high-water demand [83,84,85,86]. In addition, the frequent occurrence of water hazards in Thailand and their negative impacts are important constraints on the regional water security, with indicators I2 (Flood frequency) and I4 (Economic losses caused by water disasters) having the lowest values in the basin (0.261 and 0.001, respectively). This is mainly since Thailand’s precipitation is concentrated in the wet season, which receives 85–90% of the annual precipitation and 75–80% of the annual runoff, resulting in frequent flooding. The combination of a high economic activity intensity, a high population density, and large irrigated areas exacerbates the severity of the impacts of flooding, leading to severe economic losses and human fatalities [87,88,89].
Cambodia, on the other hand, is rich in water resources, but they are unevenly distributed throughout the year, with indicator S3 (Proportion of wet season precipitation to annual precipitation) having a value of only 0.008. Cambodia receives very little precipitation and annual runoff during the dry season (December to April) and therefore relies heavily on water storage projects for water extraction and use. However, the country only has a small number of water and hydropower plants, and indicators R5 (Installed capacity of hydropower dam), R6 (Reservoir capacity), and R7 (Hydropower dam density) had values of only 0.018, 0.001, and 0.025, respectively. Cambodia has a low level of economic development, and water is mainly used for agriculture, with an indicator P1 (Agricultural water consumption) value of only 0.135. However, poor irrigation technology leads to serious water wastage, indirectly leading to high pressure on regional agricultural water use [90]. Cambodia is severely affected by water disasters, with indicators I3 (Deaths caused by water disasters) and I4 (Economic losses caused by water disasters) having values of only 0.173 and 0.157, respectively. This is mainly due to the high number of floods in Cambodia due to the combination of incoming water from upstream and local precipitation. The weak flood protection capacity of built reservoirs and hydropower dams exacerbates the severity of the impacts of flooding, leading to huge losses to life and properties [91,92,93].
Vietnam has achieved significant economic and social development, reflected by indicators D1 (Population density) and D2 (GDP per capita) with values of 0.108 and 0.070, respectively. However, the country’s high population density and urbanization have led to increased water usage pressure, with negative impacts on the regional water security [94,95,96]. Water pollution is serious in Vietnam, with an S4 (Water biological oxygen demand) of 0.029, caused by the use of fertilizers in agriculture and industrial effluents in natural water bodies. The flat topography of the country, which is located in the lowermost reaches of the Lancang–Mekong River, mostly in the deltaic coastal areas, exacerbates pollution in natural water bodies [96]. Vietnam’s fast-growing economy and high-intensity human activities have also caused changes in substrate conditions, such as forest cover, vegetation, and soil, as reflected by indicators S7 (Forest coverage) and S8 (Lake, reservoir, and wetland area), with values of only 0.059. Forest cover and lake wetlands are essential for water resources renewal and green development, but Vietnam’s water environment is in poor condition [97]. Moreover, the country faces a significant threat from floods due to climate change and human activities, with indicators I2 (Flood frequency) and I3 (Deaths caused by water disasters) having values of only 0.236 and 0.001, respectively. The high frequency of floods due to a combination of intense precipitation, drainage from upstream reservoirs, and storm surges during high tides, combined with the facts that 70% of the country’s terrestrial area is located at or below 500 m above sea level and that most of the economic activities and agricultural land are in low-lying areas, can increase the economic losses and mortality caused by floods [98]

4.2. Differences in the Coupling and Coordination of Water Security Systems and Lagging Systems between Countries

As a whole, the Lancang–Mekong River Basin is in a state of moderate imbalance, but there are differences in the coupling and coordination of water security systems and lagging systems between countries. Specifically, the coupling between the Chinese response system (0.203) and the impact system (0.167) is good and at a high level, suggesting that the frequency of water hazards and their negative impacts in the Lancang River Basin can be controlled and mitigated via relevant response measures [99,100]. However, China’s state system (0.087) is lagging behind, suggesting that regional water quality and water environment are constraints to the coordinated development of water security in the Lancang River Basin [74,101,102]. The combined index of the Driver system (0.083), Pressure system (0.074), and Impact system (0.094) in Thailand is in a lagging state, indicating that the country’s intensive economic activities and the development of the industrial and agricultural economy have led to an increased water demand, resulting in high regional water stress [103,104]. Economic activity and population density indirectly lead to higher economic losses because of water disasters, such as in the Chao Phraya River Basin, which is home to approximately 20 million people, 30% of Thailand’s total population, and to most of the country’s manufacturing industry; the flat topography of the basin can have significant negative impacts in the event of flooding [105,106]. According to data regarding insured losses because of natural catastrophes, in 2011, Thailand’s economic losses because of flooding were among the highest in the world.
Laos’ response system (0.192) is well coupled with the impact system (0.176) and state system (0.135) and at a high level of coordination, indicating that water management in Laos has reduced regional water hazards and improved the water environment and quality. For example, the construction of hydropower dams and other projects has facilitated the regulation of the abundance and balance of the spatial and temporal distribution of water resources, improving the country´s water security capacity and promoting coordinated regional development [107]. In contrast, Myanmar’s response system (0.061) and driver system (0.061) lag behind. Due to the country´s low economic level, its water management capacity is limited, with a weak capacity to build hydropower dams and water storage facilities and a low level of integrated flood and water hazard management [108,109]. The Cambodian Driving force system (0.060) and Response system (0.073) also lag behind, and the country´s socio-economic factors are a major constraint to the coordinated development of the regional water security. Cambodia’s regional economic development and population density indirectly lead to higher economic losses from water hazards, combined with a limited response capacity [110]. In Vietnam, the Driving force system (0.056) and the Impact system (0.109) are constraints to the coordinated development of the regional water security. High precipitation and its concentration in the rainy season lead to frequent regional water hazards, which, combined with the current status of Vietnam’s agriculture-led economy, have enhanced the negative impacts of water hazards, representing a major obstacle to the coordinated development of regional coupling [93,109,110,111].

5. Conclusions

The Lancang–Mekong River is a significant transboundary river in Asia, but its development has been affected by differences in geography, economic development, and political systems of the riparian countries, leading to considerable disparities in water resource development. Additionally, climate change and human activities have exacerbated water security issues in the region. To evaluate water security in the LMRB, we used the DPSIR model to develop an assessment indicator system that takes into account various factors. The assessment found that while the overall water security in the LMRB is good and above the “safe” line, some issues require attention. Water pollution, water scarcity, and other issues have caused the water resources to be in a relatively low state, and seasonal water scarcity and water-related disasters are common. The riparian countries’ responsiveness is limited, and the water resource management capacity needs improvement.
At the country level, each country faces unique challenges that affect their water security status. China’s water status is safe, with drought-related water scarcity being the main concern, while Thailand’s water status is “basically safe”, facing factors such as climate-related flooding, uneven rainfall, and limited water storage capacity. Laos’s water status is safe, but irrigation and industrial activities’ pollution of natural water bodies and limited access to safe drinking water due to economic underdevelopment are challenging. Myanmar’s water status is “basically safe”, mainly because of the country’s weak capacity to develop water resources, poor water quality, and the threat of flooding. Cambodia’s water status is also “basically safe”, facing low water use efficiency, dry-season water scarcity, low levels of water management for hydropower, and serious water quality issues. Vietnam’s water status is safe, but the country faces frequent flooding and has a weak capacity to manage its water resources.
Finally, water security is crucial for sustainable economic development, and coordinated development between water resources and socio-economics is essential. However, the overall level of coupling coordination in the Lancang–Mekong River Basin is low, ranging from 0.3 to 0.4, corresponding to the moderate imbalance level of the scoring system. Laos and China have the highest levels of coupling and coordination, followed by Vietnam and Cambodia, while Thailand and Myanmar have a relatively lower level of coupling and coordination.
This study is subject to certain limitations. In the construction of water security indicators for the Mekong River Basin, our objective was to select indicators that authentically reflect the basin’s specific conditions, ensuring a comprehensive assessment of water security. Although the constructed indicator system may not have universal applicability, it can function as a valuable reference for similar regions. Geological conditions in both the upstream and downstream areas play a pivotal role in regional water security, necessitating flexible adjustments based on the specific geological characteristics of each location. Given the transboundary nature of the Lancang–Mekong River Basin, obtaining extensive time series data for indicators poses a significant challenge. Consequently, the water security level assessed in this paper pertains specifically to the current state of water security in the basin countries, focusing on existing issues and analyzing influencing factors. Additionally, the assessment of ‘water quality’ in this study represents the current basin-wide status, without accounting for variations in water quality between upstream and downstream areas or the propagation process. Future research endeavors will delve into this aspect should dynamic water quality data become available.
In envisioning the future of water security in the Lancang–Mekong River Basin, several key strategies and mechanisms emerge to enhance regional resilience. The Belt and Road Initiative (BRI) serves as a promising avenue for fostering collaboration and resource-sharing among the basin countries. By promoting infrastructural development and connectivity, the BRI can contribute to improved water resource management and disaster resilience. The Lancang–Mekong Mechanism, an existing cooperative framework, is poised to play a crucial role in facilitating dialogue and coordination among member countries. Emphasizing data sharing is imperative, enabling a comprehensive understanding of the basin’s dynamics and supporting evidence-based decision-making. Robust disaster monitoring systems should be established to enhance early warning capabilities, mitigating the impact of water-related disasters. Additionally, technological advancements and innovation in water resource monitoring can further bolster the region’s capacity to address emerging challenges. As these initiatives converge, a holistic and collaborative approach can pave the way for sustainable water security in the Lancang–Mekong River Basin.

Author Contributions

Author Contributions, Conceptualization, Y.Z. and A.L.; methodology, A.L.; software, J.H.; validation, J.H., A.L. and W.Z.; formal analysis, Y.Z. and J.H.; investigation, J.H.; resources, A.L.; data curation, J.H. and A.L.; writing—original draft preparation, Y.Z. and J.H.; writing—review and editing, Y.Z. and W.Z.; supervision, A.L. and W.Z.; project administration, A.L.; funding acquisition, A.L. All authors have read and agreed to the published version of the manuscript.

Funding

This research received funding from the National Natural Science Foundation of China (42371204) and the Strategic Priority Research Program of the Chinese Academy of Sciences (XDA20010201).

Institutional Review Board Statement

Not applicable.

Informed Consent Statement

Not applicable.

Data Availability Statement

This study’s data is publicly available in this article.

Acknowledgments

We thank the editor and anonymous reviewers for their very helpful comments and suggestions for improving the quality of the article.

Conflicts of Interest

The authors declare no conflict of interest.

References

  1. Cramer, W.; Guiot, J.; Fader, M.; Garrabou, J.; Gattuso, J.; Iglesias, A.; Lange, M.A.; Lionello, P.; Llasat, M.C.; Paz, S. Climate change and interconnected risks to sustainable development in the Mediterranean. Nat. Clim. Chang. 2018, 8, 972–980. [Google Scholar] [CrossRef]
  2. Shi, T.; Yang, S.; Zhang, W.; Zhou, Q. Coupling coordination degree measurement and spatiotemporal heterogeneity between economic development and ecological environment—Empirical evidence from tropical and subtropical regions of China. J. Clean Prod. 2020, 244, 118739. [Google Scholar] [CrossRef]
  3. Vörösmarty, C.J.; McIntyre, P.B.; Gessner, M.O.; Dudgeon, D.; Prusevich, A.; Green, P.; Glidden, S.; Bunn, S.E.; Sullivan, C.A.; Liermann, C.R. Global threats to human water security and river biodiversity. Nature 2010, 467, 555–561. [Google Scholar] [CrossRef] [PubMed]
  4. UN-Water. Water Security and the Global Water Agenda: A UN-Water Analytical Brief; United Nations University—Institute for Water, Environment and Health: Hamilton, ON, Canada, 2013; ISBN 92-808-6038-0. [Google Scholar]
  5. Nhamo, L.; Ndlela, B.; Nhemachena, C.; Mabhaudhi, T.; Mpandeli, S.; Matchaya, G. The water-energy-food nexus: Climate risks and opportunities in southern Africa. Water 2018, 10, 567. [Google Scholar] [CrossRef]
  6. Gain, A.K.; Giupponi, C.; Wada, Y. Measuring global water security towards sustainable development goals. Environ. Res. Lett. 2016, 11, 124015. [Google Scholar] [CrossRef]
  7. Molden, D. Water for Food Water for Life: A Comprehensive Assessment of Water Management in Agriculture; Routledg: London, UK, 2013. [Google Scholar]
  8. Biswas, A.K.; Tortajada, C. Water crisis and water wars: Myths and realities. Int. J. Water Resour. Dev. 2019, 35, 727–731. [Google Scholar] [CrossRef]
  9. Wada, Y.; Van Beek, L.; Bierkens, M.F. Modelling global water stress of the recent past: On the relative importance of trends in water demand and climate variability. Hydrol. Earth Syst. Sci. 2011, 15, 3785–3808. [Google Scholar] [CrossRef]
  10. Asadollah, S.B.H.S.; Sharafati, A.; Motta, D.; Yaseen, Z.M. River water quality index prediction and uncertainty analysis: A comparative study of machine learning models. J. Environ. Chem. Eng. 2021, 9, 104599. [Google Scholar] [CrossRef]
  11. Chen, Y.; He, L.; Lu, H.; Li, J.; Ren, L. Planning for regional water system sustainability through water resources security assessment under uncertainties. Water Resour. Manag. 2018, 32, 3135–3153. [Google Scholar] [CrossRef]
  12. Cheng, H.; Zhu, L.; Meng, J. Fuzzy evaluation of the ecological security of land resources in mainland China based on the Pressure-State-Response framework. Sci. Total Environ. 2022, 804, 150053. [Google Scholar] [CrossRef]
  13. Forouzani, M.; Karami, E. Agricultural water poverty index and sustainability. Agron. Sustain. Dev. 2011, 31, 415–431. [Google Scholar] [CrossRef]
  14. Sullivan, C. Calculating a water poverty index. World Dev. 2002, 30, 1195–1210. [Google Scholar] [CrossRef]
  15. Xia, J.; Zhu, Y.Z. The measurement of water resources security: A study and challenge on water resources carrying capacity. J. Nat. Resour. 2002, 17, 262–269. [Google Scholar] [CrossRef]
  16. Bank, A.D.; Forum, A.W. Asian Water Development Outlook 2013: Measuring Water Security in Asia and the Pacific; Asian Development Bank: Manila, Philippines, 2013. [Google Scholar]
  17. Jia, S.; Zhang, J.; Zhang, S. Regional water resources stress and water resources security appraisement indicators. Prog. Geogr. 2002, 21, 538–545. [Google Scholar]
  18. Rodrigues, D.B.; Gupta, H.V.; Mendiondo, E.M. A blue/green water-based accounting framework for assessment of water security. Water Resour. Res. 2014, 50, 7187–7205. [Google Scholar] [CrossRef]
  19. Dickson, S.E.; Schuster-Wallace, C.J.; Newton, J.J. Water security assessment indicators: The rural context. Water Resour. Manag. 2016, 30, 1567–1604. [Google Scholar] [CrossRef]
  20. Duan, T.; Feng, J.; Zhou, Y.; Chang, X.; Li, Y. Systematic evaluation of management measure effects on the water environment based on the DPSIR-Tapio decoupling model: A case study in the Chaohu Lake watershed, China. Sci. Total Environ. 2021, 801, 149528. [Google Scholar] [CrossRef]
  21. Sun, S.; Wang, Y.; Liu, J.; Cai, H.; Wu, P.; Geng, Q.; Xu, L. Sustainability assessment of regional water resources under the DPSIR framework. J. Hydrol. 2016, 532, 140–148. [Google Scholar] [CrossRef]
  22. Zare, F.; Elsawah, S.; Bagheri, A.; Nabavi, E.; Jakeman, A.J. Improved integrated water resource modelling by combining DPSIR and system dynamics conceptual modelling techniques. J. Environ. Manag. 2019, 246, 27–41. [Google Scholar] [CrossRef] [PubMed]
  23. Jensen, O.; Wu, H. Urban water security indicators: Development and pilot. Environ. Sci Policy 2018, 83, 33–45. [Google Scholar] [CrossRef]
  24. Yang, Y.; Cheng, Y. Evaluating the ability of transformed urban agglomerations to achieve Sustainable Development Goal 6 from the perspective of the water planetary boundary: Evidence from Guanzhong in China. J. Clean. Prod. 2021, 314, 128038. [Google Scholar] [CrossRef]
  25. Lee, S.; Ryu, J.; Won, J.; Park, H. Determination and application of the weights for landslide susceptibility mapping using an artificial neural network. Eng. Geol. 2004, 71, 289–302. [Google Scholar] [CrossRef]
  26. Qi, Y.; Wen, F.; Wang, K.; Li, L.; Singh, S. A fuzzy comprehensive evaluation and entropy weight decision-making based method for power network structure assessment. Int. J. Eng. Sci. Technol. 2010, 2, 92–99. [Google Scholar] [CrossRef]
  27. Dou, P.; Zuo, S.; Ren, Y.; Rodriguez, M.J.; Dai, S. Refined water security assessment for sustainable water management: A case study of 15 key cities in the Yangtze River Delta, China. J. Environ. Manag. 2021, 290, 112588. [Google Scholar] [CrossRef]
  28. Mishra, A.P.; Singh, S.; Jani, M.; Singh, K.A.; Pande, C.B.; Varade, A.M. Assessment of water quality index using Analytic Hierarchy Process (AHP) and GIS: A case study of a struggling Asan River. Int. J. Environ. Anal. Chem. 2022, 1–13. [Google Scholar] [CrossRef]
  29. Ramanathan, R. A note on the use of the analytic hierarchy process for environmental impact assessment. J. Environ. Manag. 2001, 63, 27–35. [Google Scholar] [CrossRef] [PubMed]
  30. Gan, X.; Fernandez, I.C.; Guo, J.; Wilson, M.; Zhao, Y.; Zhou, B.; Wu, J. When to use what: Methods for weighting and aggregating sustainability indicators. Ecol. Indic. 2017, 81, 491–502. [Google Scholar] [CrossRef]
  31. Xu, H.; Ma, C.; Lian, J.; Xu, K.; Chaima, E. Urban flooding risk assessment based on an integrated k-means cluster algorithm and improved entropy weight method in the region of Haikou, China. J. Hydrol. 2018, 563, 975–986. [Google Scholar] [CrossRef]
  32. Zhong, C.; Yang, Q.; Liang, J.; Ma, H. Fuzzy comprehensive evaluation with AHP and entropy methods and health risk assessment of groundwater in Yinchuan Basin, northwest China. Environ. Res. 2022, 204, 111956. [Google Scholar] [CrossRef]
  33. Yang, T.; Zhang, Q.; Wan, X.; Li, X.; Wang, Y.; Wang, W. Comprehensive ecological risk assessment for semi-arid basin based on conceptual model of risk response and improved TOPSIS model—A case study of Wei River Basin, China. Sci. Total Environ. 2020, 719, 137502. [Google Scholar] [CrossRef]
  34. Sun, C.; Wu, Y.; Zou, W.; Zhao, L.; Liu, W. A Rural Water Poverty Analysis in China Using the DPSIR-PLS Model. Water Resour. Manag. 2018, 32, 1933–1951. [Google Scholar] [CrossRef]
  35. Lu, M.; Wang, S.; Wang, X.; Liao, W.; Wang, C.; Lei, X.; Wang, H. An Assessment of Temporal and Spatial Dynamics of Regional Water Resources Security in the DPSIR Framework in Jiangxi Province, China. Int. J. Environ. Res. Public Health 2022, 19, 3650. [Google Scholar] [CrossRef] [PubMed]
  36. Vörösmarty, C.J.; Osuna, V.R.; Cak, A.D.; Bhaduri, A.; Bunn, S.E.; Corsi, F.; Gastelumendi, J.; Green, P.; Harrison, I.; Lawford, R. Ecosystem-based water security and the Sustainable Development Goals (SDGs). Ecohydrol. Hydrobiol. 2018, 18, 317–333. [Google Scholar] [CrossRef]
  37. Ghisellini, P.; Cialani, C.; Ulgiati, S. A review on circular economy: The expected transition to a balanced interplay of environmental and economic systems. J. Clean. Prod. 2016, 114, 11–32. [Google Scholar] [CrossRef]
  38. Omer, A.M. Energy, environment and sustainable development. Renew. Sustain. Energy Rev. 2008, 12, 2265–2300. [Google Scholar] [CrossRef]
  39. Wang, Z.; Fang, C.; Cheng, S.; Wang, J. Evolution of coordination degree of eco-economic system and early-warning in the Yangtze River Delta. J. Geogr. Sci. 2013, 23, 147–162. [Google Scholar] [CrossRef]
  40. Fan, Y.; Fang, C.; Zhang, Q. Coupling coordinated development between social economy and ecological environment in Chinese provincial capital cities-assessment and policy implications. J. Clean. Prod. 2019, 229, 289–298. [Google Scholar] [CrossRef]
  41. Li, Y.; Li, Y.; Zhou, Y.; Shi, Y.; Zhu, X. Investigation of a coupling model of coordination between urbanization and the environment. J. Environ. Manag. 2012, 98, 127–133. [Google Scholar] [CrossRef]
  42. Li, J.; Sun, W.; Li, M.; Linlin, M. Coupling coordination degree of production, living and ecological spaces and its influencing factors in the Yellow River Basin. J. Clean. Prod. 2021, 298, 126803. [Google Scholar] [CrossRef]
  43. Fan, H.; He, D.; Wang, H. Environmental consequences of damming the mainstream Lancang-Mekong River: A review. Earth-Sci. Rev. 2015, 146, 77–91. [Google Scholar] [CrossRef]
  44. Kuenzer, C.; Campbell, I.; Roch, M.; Leinenkugel, P.; Tuan, V.Q.; Dech, S. Understanding the impact of hydropower developments in the context of upstream–downstream relations in the Mekong river basin. Sustain. Sci. 2013, 8, 565–584. [Google Scholar] [CrossRef]
  45. Kummu, M.; Varis, O. Sediment-related impacts due to upstream reservoir trapping, the Lower Mekong River. Geomorphology 2007, 85, 275–293. [Google Scholar] [CrossRef]
  46. Pech, S.; Sunada, K. Population growth and natural-resources pressures in the Mekong River Basin. AMBIO A J. Hum. Environ. 2008, 37, 219–224. [Google Scholar] [CrossRef]
  47. Anthony, E.J.; Brunier, G.; Besset, M.; Goichot, M.; Dussouillez, P.; Nguyen, V.L. Linking rapid erosion of the Mekong River delta to human activities. Sci. Rep. 2015, 5, 14745. [Google Scholar] [CrossRef]
  48. Irannezhad, M.; Liu, J.; Chen, D. Influential climate teleconnections for spatiotemporal precipitation variability in the Lancang-Mekong River basin from 1952 to 2015. J. Geophys. Res. Atmos. 2020, 125, e2020J–e33331J. [Google Scholar] [CrossRef]
  49. Hoang, L.P.; Lauri, H.; Kummu, M.; Koponen, J.; Van Vliet, M.T.; Supit, I.; Leemans, R.; Kabat, P.; Ludwig, F. Mekong River flow and hydrological extremes under climate change. Hydrol. Earth Syst. Sci. 2016, 20, 3027–3041. [Google Scholar] [CrossRef]
  50. Ul Hasson, S.; Pascale, S.; Lucarini, V.; Böhner, J. Seasonal cycle of precipitation over major river basins in South and Southeast Asia: A review of the CMIP5 climate models data for present climate and future climate projections. Atmospheric. Res. 2016, 180, 42–63. [Google Scholar] [CrossRef]
  51. Campbell, I.C. Integrated management in the Mekong River Basin. Ecohydrol. Hydrobiol. 2016, 16, 255–262. [Google Scholar] [CrossRef]
  52. Weatherbee, D.E. Cooperation and conflict in the Mekong River Basin. Stud. Confl. Terror. 1997, 20, 167–184. [Google Scholar] [CrossRef]
  53. Dore, J.; Lebel, L. Deliberation and scale in Mekong region water governance. Environ. Manag. 2010, 46, 60–80. [Google Scholar] [CrossRef]
  54. Dugan, P.J.; Barlow, C.; Agostinho, A.A.; Baran, E.; Cada, G.F.; Chen, D.; Cowx, I.G.; Ferguson, J.W.; Jutagate, T.; Mallen-Cooper, M. Fish migration, dams, and loss of ecosystem services in the Mekong basin. AMBIO 2010, 39, 344–348. [Google Scholar] [CrossRef]
  55. Wei, G.; Yang, Z.; Cui, B.; Li, B.; Chen, H.; Bai, J.; Dong, S. Impact of dam construction on water quality and water self-purification capacity of the Lancang River, China. Water Resour. Manag. 2009, 23, 1763–1780. [Google Scholar] [CrossRef]
  56. Zhang, X. Impacts of Water Resources Management on Land Water Storage in the Lower Lancang River Basin: Insights from Multi-Mission Earth Observations. Remote Sens. 2023, 15, 1747. [Google Scholar] [CrossRef]
  57. Zhang, X.; Jiang, L.; Liu, Z.; Kittel, C.M.; Yao, Z.; Druce, D.; Wang, R.; Tøttrup, C.; Liu, J.; Jiang, H.; et al. Flow regime changes in the Lancang River, revealed by integrated modeling with multiple Earth observation datasets. Sci. Total Environ. 2023, 862, 160656. [Google Scholar] [CrossRef] [PubMed]
  58. Xue, Z.; Liu, J.P.; Ge, Q. Changes in hydrology and sediment delivery of the Mekong River in the last 50 years: Connection to damming, monsoon, and ENSO. Earth Surf. Process. Landforms 2011, 36, 296–308. [Google Scholar] [CrossRef]
  59. Yang, B.; Chen, X.; He, Y.; Wang, J.; Lai, C. Reconstruction of annual runoff since CE 1557 using tree-ring chronologies in the upper Lancang-Mekong River basin. J. Hydrol. 2019, 569, 771–781. [Google Scholar] [CrossRef]
  60. Kang, H.; Sridhar, V.; Mainuddin, M.; Trung, L.D. Future rice farming threatened by drought in the Lower Mekong Basin. Sci. Rep. 2021, 11, 9383. [Google Scholar] [CrossRef] [PubMed]
  61. Kang, H.; Sridhar, V. A near-term drought assessment using hydrological and climate forecasting in the Mekong River Basin. Int. J. Climatol. 2021, 41, E2497–E2516. [Google Scholar] [CrossRef]
  62. Do, P.; Tian, F.; Zhu, T.; Zohidov, B.; Ni, G.; Lu, H.; Liu, H. Exploring synergies in the water-food-energy nexus by using an integrated hydro-economic optimization model for the Lancang-Mekong River basin. Sci. Total Environ. 2020, 728, 137996. [Google Scholar] [CrossRef] [PubMed]
  63. Smajgl, A.; Ward, J.; Pluschke, L. The water–food–energy Nexus–Realising a new paradigm. J. Hydrol. 2016, 533, 533–540. [Google Scholar] [CrossRef]
  64. Babel, M.S.; Shinde, V.R.; Sharma, D.; Dang, N.M. Measuring water security: A vital step for climate change adaptation. Environ. Res. 2020, 185, 109400. [Google Scholar] [CrossRef]
  65. He, G.; Fu, Y.; Zhao, S. Evaluation of water ecological security in Huaihe River Basin based on the DPSIR-EES-SMI-P model. Water Supply 2023, 23, 1127–1143. [Google Scholar] [CrossRef]
  66. Zhang, Y.; Ren, J.; Liu, K.; Cheng, Y. Ecological Security Warning Degree and Spatiotemporal Pattern in Shandong Province. Econ. Geogr. 2015, 35, 166–171+189. [Google Scholar] [CrossRef]
  67. Xu, C.; Cheng, Y.; Ren, J. Ecological security early warning degree and spatiotemporal pattern in the Yellow River Delta region. Econ. Geogr. 2014, 34, 149–155. [Google Scholar] [CrossRef]
  68. Dong, S.; Zheng, J.; Li, Y.; Li, Z.; Li, F.; Jin, L.; Yang, Y.; Bilgaev, A. Quantitative analysis of the coupling coordination degree between urbanization and eco-environment in Mongolia. Chin. Geogr. Sci. 2019, 29, 861–871. [Google Scholar] [CrossRef]
  69. Tang, Z. An integrated approach to evaluating the coupling coordination between tourism and the environment. Tour. Manag. 2015, 46, 11–19. [Google Scholar] [CrossRef]
  70. Yang, Y.; Bao, W.; Liu, Y. Coupling coordination analysis of rural production-living-ecological space in the Beijing-Tianjin-Hebei region. Ecol. Indic. 2020, 117, 106512. [Google Scholar] [CrossRef]
  71. Wu, Y.; Zhang, Y. Research on the Coupling and Coordinated Development of Regional Economic Growth and Environment in China. Resour. Sci. 2008, 1, 25–30. [Google Scholar]
  72. Xing, L.; Xue, M.; Hu, M. Dynamic simulation and assessment of the coupling coordination degree of the economy–resource–environment system: Case of Wuhan City in China. J. Environ. Manag. 2019, 230, 474–487. [Google Scholar] [CrossRef] [PubMed]
  73. Bo, H.; Baoshan, C.; Shikui, D.; Hongjuan, Z.; Zhaoyang, L. Ecological water requirement (EWR) analysis of High Mountain and Steep Gorge (HMSG) river—Application to Upper Lancang–Mekong river. Water Resour. Manag. 2009, 23, 341–366. [Google Scholar] [CrossRef]
  74. Gui, Z.; Chen, X.; He, Y. Spatiotemporal analysis of water resources system vulnerability in the Lancang River Basin, China. J. Hydrol. 2021, 601, 126614. [Google Scholar] [CrossRef]
  75. Li, Y.; Wang, Z.; Zhang, Y.; Li, X.; Huang, W. Drought variability at various timescales over Yunnan Province, China: 1961–2015. Theor. Appl. Clim. 2019, 138, 743–757. [Google Scholar] [CrossRef]
  76. Boithias, L.; Choisy, M.; Souliyaseng, N.; Jourdren, M.; Quet, F.; Buisson, Y.; Thammahacksa, C.; Silvera, N.; Latsachack, K.; Sengtaheuanghoung, O. Hydrological regime and water shortage as drivers of the seasonal incidence of diarrheal diseases in a tropical montane environment. PLoS Neglected Trop. Dis. 2016, 10, e5195. [Google Scholar] [CrossRef] [PubMed]
  77. Giri, S. Water quality prospective in Twenty First Century: Status of water quality in major river basins, contemporary strategies and impediments: A review. Environ. Pollut. 2021, 271, 116332. [Google Scholar] [CrossRef]
  78. Ribolzi, O.; Cuny, J.; Sengsoulichanh, P.; Mousquès, C.; Soulileuth, B.; Pierret, A.; Huon, S.; Sengtaheuanghoung, O. Land use and water quality along a Mekong tributary in Northern Lao PDR. Environ. Manag. 2011, 47, 291–302. [Google Scholar] [CrossRef] [PubMed]
  79. Aung, T.S.; Saboori, B.; Rasoulinezhad, E. Economic growth and environmental pollution in Myanmar: An analysis of environmental Kuznets curve. Environ. Sci. Pollut. Res. 2017, 24, 20487–20501. [Google Scholar] [CrossRef] [PubMed]
  80. Soe, P.S.; Kyaw, W.T.; Arizono, K.; Ishibashi, Y.; Agusa, T. Mercury pollution from artisanal and small-scale gold mining in Myanmar and other southeast asian countries. Int. J. Environ. Res. Public Health 2022, 19, 6290. [Google Scholar] [CrossRef] [PubMed]
  81. Kawasaki, A.; Kawamura, G.; Zin, W.W. A local level relationship between floods and poverty: A case in Myanmar. Int. J. Disaster Risk Reduct. 2020, 42, 101348. [Google Scholar] [CrossRef]
  82. Shrestha, B.B.; Kawasaki, A. Quantitative assessment of flood risk with evaluation of the effectiveness of dam operation for flood control: A case of the Bago River Basin of Myanmar. Int. J. Disaster Risk Reduct. 2020, 50, 101707. [Google Scholar] [CrossRef]
  83. Gheewala, S.H.; Silalertruksa, T.; Nilsalab, P.; Mungkung, R.; Perret, S.R.; Chaiyawannakarn, N. Water footprint and impact of water consumption for food, feed, fuel crops production in Thailand. Water 2014, 6, 1698–1718. [Google Scholar] [CrossRef]
  84. Gheewala, S.H.; Silalertruksa, T.; Nilsalab, P.; Lecksiwilai, N.; Sawaengsak, W.; Mungkung, R.; Ganasut, J. Water stress index and its implication for agricultural land-use policy in Thailand. Int. J. Environ. Sci. Technol. 2018, 15, 833–846. [Google Scholar] [CrossRef]
  85. Takeda, M.; Laphimsing, A.; Putthividhya, A. Dry season water allocation in the Chao Phraya River basin, Thailand. Int. J. Water Resour. Dev. 2016, 32, 321–338. [Google Scholar] [CrossRef]
  86. Walker, A. Agricultural transformation and the politics of hydrology in northern Thailand. Dev. Chang. 2003, 34, 941–964. [Google Scholar] [CrossRef]
  87. Marks, D. Climate change and Thailand: Impact and response. Contemp. Southeast Asia 2011, 33, 229–258. [Google Scholar] [CrossRef]
  88. Promchote, P.; Wang, S.S.; Johnson, P.G. The 2011 great flood in Thailand: Climate diagnostics and implications from climate change. J. Clim. 2016, 29, 367–379. [Google Scholar] [CrossRef]
  89. Thanvisitthpon, N.; Shrestha, S.; Pal, I. Urban flooding and climate change: A case study of Bangkok, Thailand. Environ. Urban. ASIA 2018, 9, 86–100. [Google Scholar] [CrossRef]
  90. Erban, L.E.; Gorelick, S.M. Closing the irrigation deficit in Cambodia: Implications for transboundary impacts on groundwater and Mekong River flow. J. Hydrol. 2016, 535, 85–92. [Google Scholar] [CrossRef]
  91. Murphy, T.; Irvine, K.; Sampson, M. The stress of climate change on water management in Cambodia with a focus on rice production. Clim. Dev. 2013, 5, 77–92. [Google Scholar] [CrossRef]
  92. Venkatappa, M.; Sasaki, N.; Han, P.; Abe, I. Impacts of droughts and floods on croplands and crop production in Southeast Asia—An application of Google Earth Engine. Sci. Total Environ. 2021, 795, 148829. [Google Scholar] [CrossRef]
  93. Wassmann, R.; Hien, N.X.; Hoanh, C.T.; Tuong, T.P. Sea level rise affecting the Vietnamese Mekong Delta: Water elevation in the flood season and implications for rice production. Clim. Chang. 2004, 66, 89–107. [Google Scholar] [CrossRef]
  94. Nguyen, H.T.; Aviso, K.B.; Kojima, N.; Tokai, A. Structural analysis of the interrelationship between economic activities and water pollution in Vietnam in the period of 2000–2011. Clean Technol. Environ. Policy 2018, 20, 621–638. [Google Scholar] [CrossRef]
  95. Thi Minh Hanh, P.; Sthiannopkao, S.; The Ba, D.; Kim, K. Development of water quality indexes to identify pollutants in Vietnam’s surface water. J. Environ. Eng. 2011, 137, 273–283. [Google Scholar] [CrossRef]
  96. Vo, P.L. Urbanization and water management in Ho Chi Minh City, Vietnam-issues, challenges and perspectives. GeoJournal 2007, 70, 75–89. [Google Scholar] [CrossRef]
  97. Hoang, T.C.; Black, M.C.; Knuteson, S.L.; Roberts, A.P. Environmental Pollution, Management, and Sustainable Development: Strategies for Vietnam and Other Developing Countries. Environ. Manag. 2019, 63, 433–436. [Google Scholar] [CrossRef] [PubMed]
  98. Scussolini, P.; Tran, T.V.T.; Koks, E.; Diaz Loaiza, A.; Ho, P.L.; Lasage, R. Adaptation to sea level rise: A multidisciplinary analysis for Ho Chi Minh City, Vietnam. Water Resour. Res. 2017, 53, 10841–10857. [Google Scholar] [CrossRef]
  99. Yun, X.; Tang, Q.; Wang, J.; Liu, X.; Zhang, Y.; Lu, H.; Wang, Y.; Zhang, L.; Chen, D. Impacts of climate change and reservoir operation on streamflow and flood characteristics in the Lancang-Mekong River Basin. J. Hydrol. 2020, 590, 125472. [Google Scholar] [CrossRef]
  100. Zhong, R.; Zhao, T.; He, Y.; Chen, X. Hydropower change of the water tower of Asia in 21st century: A case of the Lancang River hydropower base, upper Mekong. Energy 2019, 179, 685–696. [Google Scholar] [CrossRef]
  101. Guo, X.; Tang, Y.; Xu, Y.; Zhang, S.; Ma, J.; Xiao, S.; Ji, D.; Yang, Z.; Liu, D. Using stable nitrogen and oxygen isotopes to identify nitrate sources in the Lancang River, upper Mekong. J. Environ. Manag. 2020, 274, 111197. [Google Scholar] [CrossRef]
  102. Liu, Z.; Wang, R.; Yao, Z. Climate change and its impact on water availability of large international rivers over the mainland Southeast Asia. Hydrol. Process. 2018, 32, 3966–3977. [Google Scholar] [CrossRef]
  103. Chuchird, R.; Sasaki, N.; Abe, I. Influencing factors of the adoption of agricultural irrigation technologies and the economic returns: A case study in Chaiyaphum Province, Thailand. Sustainability 2017, 9, 1524. [Google Scholar] [CrossRef]
  104. Praneetvatakul, S.; Janekarnkij, P.; Potchanasin, C.; Prayoonwong, K. Assessing the sustainability of agriculture: A case of Mae Chaem Catchment, northern Thailand. Environ. Int. 2001, 27, 103–109. [Google Scholar] [CrossRef] [PubMed]
  105. Gale, E.L.; Saunders, M.A. The 2011 Thailand flood: Climate causes and return periods. Weather 2013, 68, 233–237. [Google Scholar] [CrossRef]
  106. Singkran, N. Flood risk management in Thailand: Shifting from a passive to a progressive paradigm. Int. J. Disaster Risk Reduct. 2017, 25, 92–100. [Google Scholar] [CrossRef]
  107. Guerrier, G.; Paul, R.; Sananikhom, P.; Kaul, S.; Luthi, R.; Katz, J.; Robino, M.; Khammanithong, P.; Brey, P.T. Strategic success for hydropower in Laos. Science 2011, 334, 38. [Google Scholar] [CrossRef] [PubMed]
  108. Brakenridge, G.R.; Syvitski, J.; Niebuhr, E.; Overeem, I.; Higgins, S.A.; Kettner, A.J.; Prades, L. Design with nature: Causation and avoidance of catastrophic flooding, Myanmar. Earth-Sci. Rev. 2017, 165, 81–109. [Google Scholar] [CrossRef]
  109. Kawasaki, A.; Ichihara, N.; Ochii, Y.; Acierto, R.A.; Kodaka, A.; Zin, W.W. Disaster response and river infrastructure management during the 2015 Myanmar floods: A case in the Bago River Basin. Int. J. Disaster Risk Reduct. 2017, 24, 151–159. [Google Scholar] [CrossRef]
  110. Nguyen, T.; Nguyen, T.T.; Grote, U. Multiple shocks and households’ choice of coping strategies in rural Cambodia. Ecol. Econ. 2020, 167, 106442. [Google Scholar] [CrossRef]
  111. Chau, V.N.; Cassells, S.; Holland, J. Economic impact upon agricultural production from extreme flood events in Quang Nam, central Vietnam. Nat. Hazards 2015, 75, 1747–1765. [Google Scholar] [CrossRef]
Figure 1. DPSIR (Driver-Pressure-State-Impact-Response) framework.
Sustainability 15 16880 g001
Figure 2. Calculation results for the weights of each indicator under the DPSIR model. DPSIR = Driver-Pressure-State-Impact-Response.
Sustainability 15 16880 g002
Figure 3. Results of water security assessment of Lancang–Mekong countries. DPSIR = Driver-Pressure-State-Impact-Response, WSD = Water security Degree.
Sustainability 15 16880 g003
Figure 4. Coupling coordination and development stages of each country in the Lancang–Mekong River Basin.
Sustainability 15 16880 g004
Table 1. Water security assessment indicator system of the LMRB and its data sources based on the DPSIR framework.
TargetCriterionIndicatorData Source
Water security DegreeDriver (D)Population density (D1)Gridded Population of the World Version 4 (GPWv4) (https://sedac.ciesin.columbia.edu/ accessed on 4 March 2022)
GDP per capita (D2)World Bank (https://data.worldbank.org.cn/, accessed on 6 March 2022)
Urbanization rate (D3)United Nations Population Division (https://www.un.org/, accessed on 22 April 2022)
Pressures (P)Agricultural water consumption (P1)Report <Research on the capacity building of water quality improvement in Lancang–Mekong River countries>
Domestic water consumption (P2)
Industrial water consumption (P3)
Water pressure (P4)Water Environment Partnership in Asia (WEPA) (https://wepa-db.net/, accessed on 19 March 2022)
State (S)Average annual precipitation (S1)Climatic Research Unit gridded Time Series (CRU TS) (https://crudata.uea.ac.uk/cru/data/hrg/, accessed on 11 March 2022)
Average annual runoff (S2)Transboundary Waters Assessment Plan (TWAP) (http://www.geftwap.org/, accessed on 27 March 2022)
Proportion of wet season precipitation to annual precipitation (S3)Climatic Research Unit gridded Time Series (CRU TS) (https://crudata.uea.ac.uk/cru/data/hrg/, accessed on 11 March 2022)
Water biological oxygen demand (S4)World Bank (https://data.worldbank.org.cn/, accessed on 14 April 2022)
Water conductivity (S5)
Water nitrate–nitrite concentration (S6)
Forest coverage (S7)Global Forest Cover Map (GFCM)
Lake, reservoir, and wetland area (S8)Global Lakes and Wetlands Database (GWLP) (https://www.worldwildlife.org/pages/global-lakes-and wetlands-database, accessed on 19 March 2022)
Impact (I)Drought frequency (I1)Emergency Events Database (EM-DAT) (https://www.emdat.be/, accessed on 27 March 2022)
Flood frequency (I2)
Deaths caused by water disasters (I3)
Economic losses caused by water disasters (I4)
Response (R)Government funding for water sanitation (R1)Organization for Economic Cooperation and Development (OECD) (https://www.oecd.org/, accessed on 15 March 2022)
Proportion of population with access to improved drinking water (R2)Joint Monitoring Programme (JMP) (https://washdata.org/, accessed on 6 April 2022)
Proportion of sanitation facilities receiving basic improvements (3)
Wastewater treatment capacity (4)HydroSHEDS database (https://www.hydrosheds.org/, accessed on 13 April 2022)
Installed capacity of hydropower dam (R5)Mekong River Commission (https://www.mrcmekong.org/, accessed on 23 April 2022)
Reservoir capacity (R6)
Hydropower dam density (R7)
DPSIR = Driver-Pressure-State-Impact-Response.
Table 2. Range of values of the total regional water security.
Water Security LevelValue Range of the WSD
Very safe0.81–1.00
Safe0.61–0.80
Basically safe0.41–0.60
Unsafe0.21–0.40
Seriously unsafe0.00–0.20
WSD: Water security Degree.
Table 3. Classifications of coupling coordination degrees.
Coupling Coordination DegreeTypeDevelopment Stage
D [ 0.0 ,   0.2 ] Serious imbalanceUnbalanced development stage
D [ 0.2 ,   0.4 ) Moderate imbalance
D [ 0.4 ,   0.5 ) Basic coordination
D [ 0.5 ,   0.8 ) Moderate coordinationTransitional development stage
D [ 0.8 ,   1.0 ] Good coordinationBalanced development stage
Disclaimer/Publisher’s Note: The statements, opinions and data contained in all publications are solely those of the individual author(s) and contributor(s) and not of MDPI and/or the editor(s). MDPI and/or the editor(s) disclaim responsibility for any injury to people or property resulting from any ideas, methods, instructions or products referred to in the content.

