Abstract
In order to better understand the failure process of water-bearing rocks, samples of water-bearing sandstone were tested uniaxially. The failure process and the development of internal cracks were studied through the evolution characteristics of dissipated strain energy and particle flow simulation. In this study, we found that: (1) The presence of water in sandstone results in a reduction in energy storage capacity as well as strength. (2) The dissipated energy ratio curve of sandstone samples and simulated samples’ internal fracture development curve has obvious stages. The dissipated energy ratio turning point and the rapid fracture development point are defined as the failure precursor points of sandstone samples and simulated samples, respectively. In both sandstone samples and simulated samples, the ratio between failure precursor stress and peak strength remains almost unchanged under various water conditions. (3) The ratio of fracture to dissipated energy (RFDE) of sandstone is proposed, and interpreted as the increased number of cracks in the rock under the unit dissipated. On this basis, the fracture initiation dissipated energy (FIDE) of sandstone under different water cut conditions is determined, that is, the dissipation threshold corresponding to the start of the development of sandstone internal cracks. (4) The analysis shows that RFDE increases exponentially and FIDE decreases negatively with the scale-up in moisture content. Further, high moisture content sandstone consumes the same dissipative strain energy, which will lead to more fractures in its interior. The research in this paper can lay a theoretical and experimental foundation for monitoring and early warning of rock engineering disasters such as coal mining, tunnel excavation, slope sliding, and instability.
1. Introduction
During deep rock engineering construction, such as coal mining or roadway excavation, high ground stresses are often experienced [1,2,3,4,5]. The disturbance caused by excavation, blasting, and other behaviors during construction is easy to cause the crack expansion of the rock stratum [6,7,8,9,10]. The groundwater extended suddenly due to the loss of water resistance in the overlying strata and the connection of the diversion channel [11,12,13,14,15,16]. The situation can easily lead to damage to the project, thereby posing a threat to the safety of the on-site staff and equipment [17,18,19,20]. In addition to bearing overburden, the surrounding rock of the deep working face is also affected by water immersion. Consequently, it is difficult to predict the overall failure behavior of water bearing rock based on existing strength theories and failure criteria. However, researchers have previously demonstrated that fractures occur as a result of fracture development and energy release caused by the internal dissipation of energy in the rock [21,22]. Further, by analyzing the fracture process of water-bearing rock under stress from the perspective of energy change and fracture development, failure behavior can be predicted more accurately.
Several scholars believe that the existence of water will undoubtedly lead to the weakening of rock masses [23,24,25,26,27,28]. Yu et al. [9] studied the influence of hydraulic pressure on coal samples in a saturated water state and found that the moisture content in coal samples increases exponentially and that their Poisson’s ratio, elastic modulus, peak, and residual strength decrease linearly or exponentially with the hydraulic pressure. Yao et al. [29] believed that the change in mineral composition and microstructure decreased sandstone strength. In addition, at the same moisture content, water with different components has different deterioration effects on sandstone; distilled water, river water, and ionic water have increased their degradation influence on sandstone. Noe et al. [30] showed that the reduction of sandstone fracture toughness and static friction coefficient caused the weakening of water-bearing sandstone. Lin et al. [31] showed that the durability of rock weakened because of the increase in rock moisture. The softening mechanism of argillaceous siltstone is different under different moisture contents. The softening mechanism of rock depends upon its moisture content. A primary softening mechanism occurs when the moisture content of the bonding water film is less than 1.14%. When the moisture content exceeds 1.14%, the softening mechanism is primarily affected by the pressure of pore water and the rebinding effect. Research by Zhou et al. shows that in addition to the moisture content of a rock deteriorating its strength characteristics, the strength is also affected by microporous saturation and porosity, and damage in sandstone is generally found around larger pores [32].
Water plays a significant role in fracture development when studying rock mass failures [33,34,35,36,37,38,39]. Liang et al. [40] conducted triaxial compression tests on water-bearing sandstone, and results show that the uneven water distribution in sandstone promotes the development of tensile fractures, and the increase in confining pressure increases shear fractures. The research of Yao et al. [41] demonstrated that as the coal samples’ water content increased, more shear cracks occurred, and the increase in shear failure surfaces made coal and rock more susceptible to shear failure. Chen et al. [42] found that sandstone completely immersed in the water had mixed splitting shear failure under uniaxial compression, while partially immersed rock samples were mainly splitting failure. Liu et al. [43] quantified the evolution of water diffusion degree in sandstone with immersion time. Additionally, Ai et al. [44] found that with the prolongation of immersion time, the mean pore diameter of coal samples expanded, new pores were generated, the pore connectivity and permeability of coal samples were enhanced, and the internal mineral composition and structural characteristics underwent transformation.
The fracture in the rock material is mainly caused by internally dissipated energy and is irreversible. Several scholars have studied and predicted the failure of coal and rock mass through energy [8,19,45,46,47,48,49,50,51,52]. Xie et al. [53,54] studied the relevance between the dissipated and released energy and the strength and failure of rock in the course of fracture, established the rock strength loss criterion and damage development equation according to energy dissipated and releasable strain energy, and established the overall failure criterion of a rock element. Hu et al. [55] found that in the case of cyclic disturbance, most of the external energy is converted into dissipative energy. The cyclic disturbance significantly stimulated and promoted rock damage, and reduced the bearing and energy storage ability of rocks because energy dissipated led to rock degradation. Luo song et al. [21] conducted shear tests on red sandstone and granite under different unloading levels for energy characteristics during rock shear failure. The results show that the total input, elastic, and dissipative strain energy increased nonlinearly with the increased unloading level. Meng et al. [22] analyzed the variation characteristics of the internal energy of rock under different confining pressures at high temperatures, and found that the energy density inside the rock increases with the increase in confining pressure and decreases with the increase of temperature. Luo Yong et al. [56] found that water in rock mass can prevent the occurrence of stress concentration, thus preventing rock burst, because water reduces the residual elastic strain energy in rock. Ding et al. [57] carried out uniaxial compression and cyclic loading-unloading experiments on natural coal blocks under various stress levels. They obtained the critical value of its damage variable under various stress levels through research. Li et al. [58] conducted cyclic load tests on sandstone, analyzed its energy evolution, and investigated that the internal energy of sandstone changes sharply in the early and late stages of failure and is relatively stable in the middle stage of failure.
In recent years, numerous advances have been made to investigate water-rock interaction, the effect of water on mechanical characteristics, and the influence on crack propagation. Furthermore, there have also been a number of studies that have been conducted on the energy evolution of rocks in order to gain a better understanding of how rock failure occurs. However, for water-bearing rocks, the characteristics of energy evolution and the relationship between dissipated energy and fracture development have not been investigated. The increase in dissipated energy promotes rock failure, and the accumulation of damage causes the appearance and unstable development of rock cracks. Therefore, it’s necessary to determine the relationship between dissipated strain energy and crack development. This paper studies sandstone’s strength deterioration and fracture process under various water conditions through the dissipated strain energy of sandstone simulates the loading process of sandstone with various moisture contents using particle flow software and analyzes the quantitative relationship between the internal crack growth and the dissipative strain energy. In order to ensure safety, these results can be applied in mining, tunneling, and other deep rock engineering research.
2. Experimental Project
2.1. Sample Preparation
The experiment is being conducted on samples of sandstone obtained from the working face of a mine in the Shandong Province of China. As water is often seeping into the surrounding rock of the mining face, the surrounding rock contains a certain amount of water, and the amount of water varies from region to region. The sandstone has a density of 2.18 g per cubic centimeter and is coarse-grained. It is necessary to polish both ends of the rock sample to ensure their parallelism does not exceed 0.2 mm, and the sample size is 70 mm by 70 mm by 140 mm.
During the preparation of the water-containing sample, the rock samples were placed in a furnace for 48 h to make the rock sample completely dry, and then immerse the sample in distilled water. In order to measure the moisture content of the samples, the rock samples were taken out and weighed regularly. Figure 1 shows that the moisture content of sandstone increased with immersion time, and the moisture content of sandstone increased rapidly during the early stages of immersion and then the speed of growth slowed down. The sandstone’s water content stabilized and became essentially saturated after approximately 90 h; at this point, the water content was 3.113%.
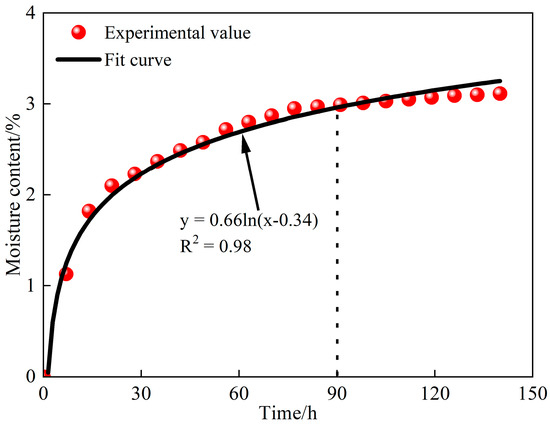
Figure 1.
Moisture content of the sample changes with time.
2.2. Experimental Scheme
The uniaxial compression test was conducted with the Model C64.106 hydraulic machine of the China University of Mining and Technology (CUMT). The machine has the following feature: displacement control, or strain control, from 300 kN to 1000 kN, as shown in Figure 2. Prior to the test, plastic films were laid on and under the sandstone samples to reduce the impact of end effects on the test. In order to eliminate specimen end effects and heat conduction, the ends of the rock samples were wrapped with plastic before being placed in the loading unit. The loading rate was set during the testing to 0.1 mm/min.
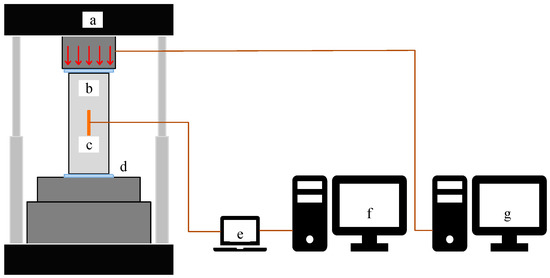
Figure 2.
Experimental equipment. (a) Hydraulic machine; (b) Sandstone sample; (c) Strain gauge; (d) Plastic film; (e) Strain instrument; (f) Strain data acquisition system; (g) Control system.
In this experiment, 20 sandstone samples were processed. However, to fully reflect the stress-strain characteristics of moisture sandstone samples, four samples of moisture sandstone were set in the dry state, the saturated state, and two different moisture contents.
3. Experimental Result
3.1. Mechanical Parameters
In order to ensure the reliability of the experimental results, a maximum value and a minimum value are removed from each group of experimental results. Table 1 shows the statistics of peak strength and elastic modulus of all sandstone samples and their corresponding moisture contents. Table 1 shows the strength parameters of sandstone with different moisture contents plotted, as shown in Figure 3 and Figure 4.

Table 1.
Moisture content and strength parameters of the samples.
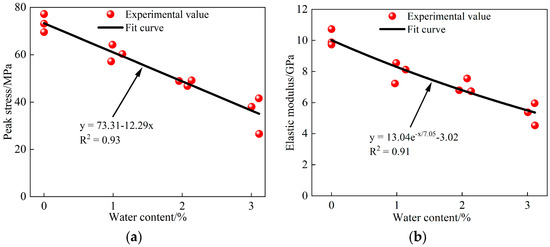
Figure 3.
Strength parameters of the samples with different moisture contents. (a) σmax; (b) E.
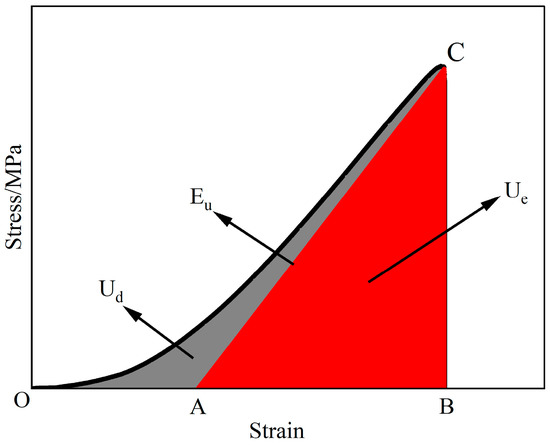
Figure 4.
Relationship between Ue and Ud in a rock unit.
Furthermore, it is evident from the figures that sandstone samples’ peak strength and elastic modulus reduce linearly and negatively with the increase in moisture content. The average peak stress of the dry rock sample is 73.70 MPa, while the equally compressive strength of saturated rock is 35.52 MPa. This revealed that the strength decreases by 51.8% after water saturation and softening. The equally elastic modulus of the dry sample is 10.11 GPa, while after water saturation and softening the average elastic modulus is 5.29 GPa, which decreases by 47.7%. The presence of water in the sandstone sample will therefore weaken its peak strength and elastic modulus.
3.2. Energy Characteristics
The assumption that the experiment with the sandstone sample under the load is done in an ideal environment implies that energy is conserved throughout the experiment. According to the thermodynamic content, the following formula can be obtained:
where U is the total energy input by the press, Ud is the dissipated strain energy, and Ue is the elastic strain energy.
According to Xie et al. [53,54], the calculation formula of Ue can be obtained:
where Eu is the unloading elastic modulus, which can be replaced by E of the sample [59].
The Ud and Ue of rock under loading are shown in Figure 4. The total energy U input by the press is the integral of the stress-strain curve OC, the area of triangle ABC is Ue, and the remaining gray part is Ud. Where the slope of AC is Eu.
Figure 5 shows the energy change curve of four groups of sandstone samples with different moisture contents during uniaxial compression.
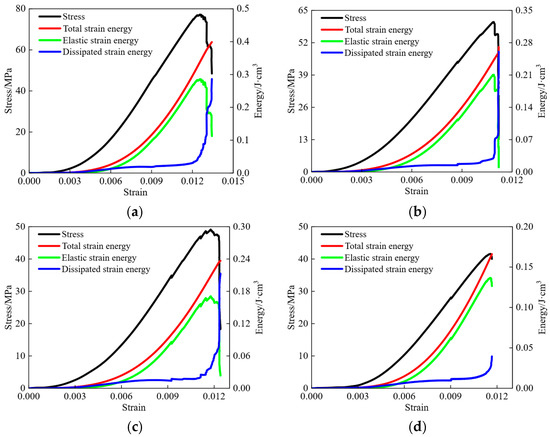
Figure 5.
Samples energy evolution curve under different water-bearing conditions. (a) A1; (b) B2; (c) C2; (d) D1.
As shown in Figure 5, dissipated energy is higher than elastic strain energy in the compaction stage. The primary pores and microfractures in the sandstone gradually compress and close, and most of the total energy is dissipated in the compacted fractures. In the elastic stage, the fractures in the sandstone sample have been compacted, at this time, the structural properties of the rock sample are basically reversible, which can be assumed to be isotropic materials, and most of the energy is stored in the sandstone as elastic strain energy. In the plastic stage, the sandstone sample begins to show plastic deformation, and most of the energy of the press is still transformed into the form of elastic strain energy, but dissipated energy has increased, indicating that cracks have started to grow in the rock when approaching the compressive limit. The elastic strain energy is close to the energy storage limit of the sandstone sample, the internal cracks develop rapidly, the cracks further expand and grow, and most of the energy of the press aggravates the internal damage of the sandstone sample in the form of dissipated energy. After the peak stress, because of the degradation of dissipated energy, elastic strain energy in the rock is released rapidly, resulting in the overall failure of the sandstone sample.
Figure 6 shows total energy, elastic strain energy, and dissipated energy at the peak stress of sandstone with four moisture contents.
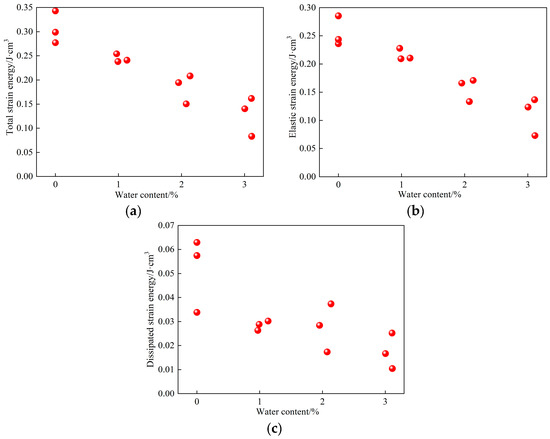
Figure 6.
Variation of different types of strain energy with moisture content. (a) U; (b) Ue; (c) Ud.
The internal energy change of sandstone samples under the four water conditions is generally similar, as shown in Figure 6. It revealed that the water condition affects the specific energy values. The total energy and elastic strain energy of the rock peak stress point decrease linearly as water content increases, while the dissipated energy decreases nearly exponentially. In conclusion, increasing water content reduces sandstone’s ability to store energy.
4. Precursory Damage
The dynamic transformation occurs when rock energy changes during loading from initial compaction to eventual complete failure. The press converts the energy it applies into irreversible dissipated energy and reversible elastic strain energy. The dissipation can accelerate the closure and growth of sandstone fractures, deteriorate internal damage, and ultimately cause sandstone to deteriorate and lose its strength. In addition, the sandstone’s elastic deformation stores elastic strain energy. When the sandstone’s energy storage limit is reached, a sudden release of energy causes the rock to fracture completely. The dissipated energy leads to the internal fracture and deterioration of the sandstone, and elastic strain energy causes the final fracture. It is inferred that the failure of sandstone is comprehensively affected by dissipated energy and elastic strain energy. These two parts of energy are transformed from the total energy input from the outside, and their proportions differ in different rock loading stages. Therefore, studying the proportion of dissipated energy in the total energy can more accurately reflect the damaged characteristics of rock in the loading process, and then more accurately predict the fracture of sandstone. Figure 7 shows the change in the proportion of dissipated energy of four sandstone samples with different water cut states during loading.
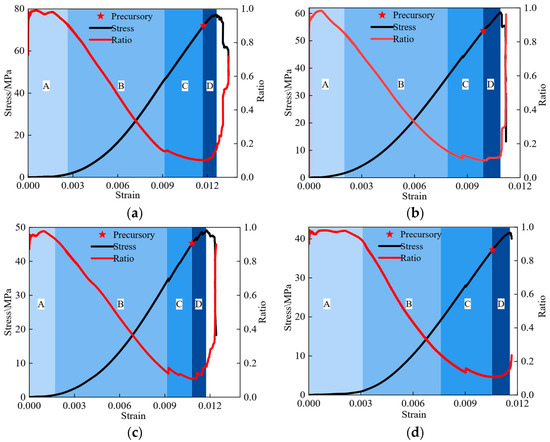
Figure 7.
Curve of Ud/U Ratio Changing with Strain. (a) A1; (b) B2; (c) C2; (d) D1.
As shown in the figure, the proportion of dissipated energy of sandstone samples in four moisture-bearing states has experienced the “descending ascending” process. In addition, combined with the study of the energy dissipation proportional curve and the literature, the loading process of each moisture content sample can be divided into four stages before the peak stress [60]. Further, the nonlinear part A in the front of the dissipative energy ratio curve is set as the compaction closing stage, the linear phase B in the middle is set as the elastic deformation stage, the descending section C in the nonlinear rear part is set as the stable crack growth stage, and the ascending section D in the nonlinear rear part is set as the unstable crack growth stage.
When the sandstone sample reaches the stage of unstable crack propagation, the further propagation of its internal cracks does not need to increase the stress drive, and the cracks will expand uncontrollably until the sandstone is finally destroyed. As a result, the point at which the energy dissipation ratio curve turns from falling to rising may be considered the failure precursor point of the water-bearing sandstone sample.
Furthermore, when the rock sample has not yet reached the peak stress point but has reached the stress of the precursor (σpre) point, the internal fractures of the rock have been highly developed, and its instability and failure are inevitable.
Table 2 shows the σpre and σmax of all sandstone samples and their ratios. Figure 8 shows the comparison of σpre/σmax of group A, B, C, and D sandstone samples, and Figure 9 shows the straight-line fitting results of these ratios.

Table 2.
σpre, σmax, and their ratio of sandstone samples.
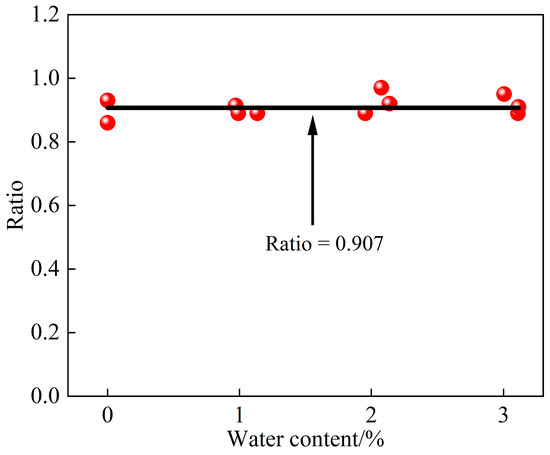
Figure 8.
Fitting results of σpre/σmax.
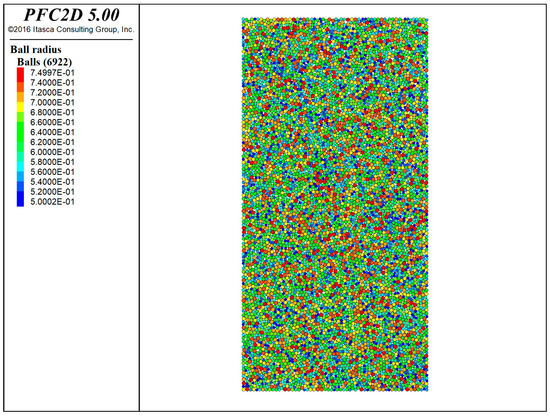
Figure 9.
Simulated samples.
Table 2 shows that the average value of σpre/σmax for 12 sandstone samples is 0.90722, and the sample variance is 0.00114. In addition, Figure 8 illustrates that σpre/σmax of sandstone samples with different moisture contents is very close, and there is no obvious change with the scale-up of moisture content. As a result, water-bearing sandstone under load exhibits a stress threshold in the course of deformation and incomplete failure. The sandstone samples reach the threshold of strength when their stress level reaches the threshold. Although they have not yet reached their peak strength, their internal fractures have been substantially developed at this point. It is likely that rock will continue to develop rapidly, resulting in rock failure. The strength of this threshold value decreases with the rock’s moisture content. Still, the ratio of this threshold value to the peak strength σpre/σmax does not obviously increase or decrease with the change of moisture content, approaching a certain value. During this experimental study, it was determined that the threshold value of sandstone failure precursors at different water-moisture content states is approximately 0.907 of the peak strength of the rock.
5. Fissure Development
The dissipative strain energy drives the development of fractures in sandstone under uniaxial loading, while the rapid development of fractures promotes the instability and failure of sandstone samples. It is difficult to study the distribution and quantity of fractures in rock directly at the mesoscale by using actual experimental methods. Currently, computer performance and numerical simulation methods have made great progress, and numerical simulation has become a cost-effective research resource. The numerical simulation methods are divided into continuous and discrete elements. The discrete element can better simulate the nonlinear mechanical properties of rock. The model consists of balls, walls, and contacts in the particle flow dispersion element simulation software (PFC2D). Rigid spherical particles of different sizes are combined by bonding to form a simulated rock mass. Their mechanical properties depend on the geometric and mechanical properties of particles and bonding, which better reflect the geometric characteristics of discrete materials in discontinuous media and explain the nonlinear deformation and failure of the rock mass. Therefore, PFC simulation software is widely used in research related to coal and rock mass fragmentation [38,48,61,62,63]. The particle flow dispersion element method is adopted in this research to establish a numerical model of sandstone and analyze the internal fracture development law of sandstone samples under different moisture contents in the loading process from the meso level.
The size of the numerical simulation sample in PFC2D is 70 mm × 140 mm, the particle size is 0.5–0.75 mm, and the number of particles is 6922.
The fitting functions of strength parameters of sandstone samples with different moisture contents are obtained through experiments. The simulated sandstone samples can be simulated through these fitting functions. The E and σmax can be calculated using Equations (3) and (4), respectively. The fitting functions are shown in Figure 3.
where w is the water contents
The elastic modulus fitting function is similar to the research results in reference, which further confirms that the E of sandstone samples decreases exponentially negatively under the action of water.
According to the Mohr-Coulomb criterion:
Further, uniaxial compressive strength and uniaxial tensile strength can be calculated by using Equations (6) and (7).
Cohesion and tensile strength of water-bearing rock samples can be obtained from Equation (5) and fitting Formula (4):
Several researchers have demonstrated that the change in cohesive force of rock in a water-bearing state is more obvious than the change in internal friction angle, and it has been noticed that the selection of friction angle has less of an impact on simulation results when they are being run [31]. Therefore, it is presumptively true that the internal fracture angle (F) of simulated sandstone samples in each water content is the same in simulation and that its value has been established to be 26° through repeated tests. Four groups of moisture contents of 0%, 1%, 2%, and 3% are also set in the simulation in accordance with the actual test protocol. Four groups of simulated sandstone samples are shown in Table 3 along with their strength parameters.

Table 3.
Strength parameters.
The four groups of simulated sandstone samples and actual experimental rock samples are compared for stress and strain results in Figure 10. According to the comparison shown in Figure 10, it is possible to simulate the uniaxial compression process and strength characteristics of sandstone in various water-bearing states using PFC2D software. However, the numerical simulation is unable to accurately represent the first stage of compression in sandstone, which means that the strain at peak stress of the simulated sample cannot accurately match the actual experimental value.
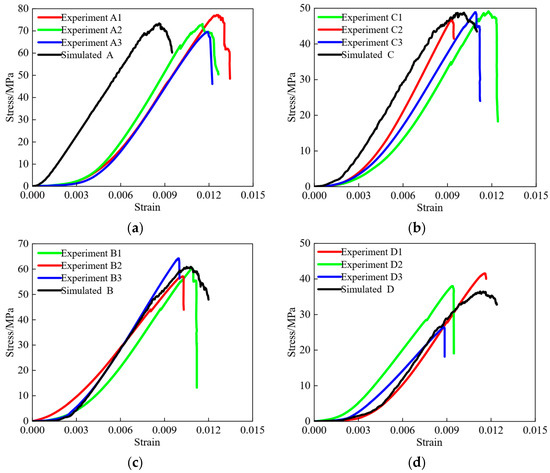
Figure 10.
Comparison of simulation and experimental results. (a) A; (b) B; (c) C; (d) D.
In studying the development of cracks and fissures in sandstone at different stages during loading, the fish language in PFC is used to obtain the change in the number of cracks in the simulated sample. Figure 11 shows the development of cracks in the simulated sample under uniaxial compression under four moisture contents.
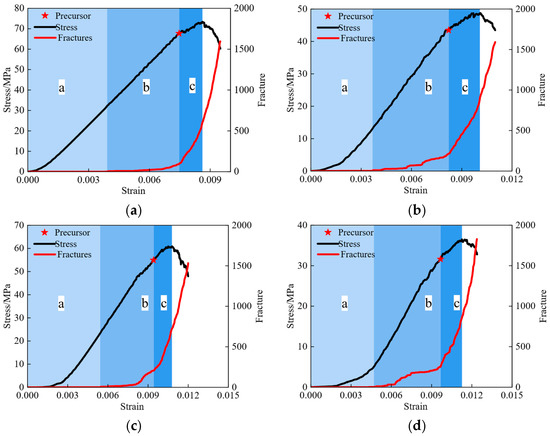
Figure 11.
Fracture development of simulated samples. (a) A; (b) B; (c) C; (d) D.
Figure 11 shows that the simulated sample’s fracture development has distinct stages, which is very similar to the changing characteristics of the dissipated energy in Figure 7. As a result, the loading process of the simulated sample is divided into three stages: undeveloped fracture stage a; slowly developed fracture stage b; and rapidly developed fracture stage c, according to the fracture development curves of the four groups of simulated samples. Figure 12 shows a sandstone simulation sample A as an example. This revealed the sample’s fracture development during the slow and rapid development stages and after complete failure.
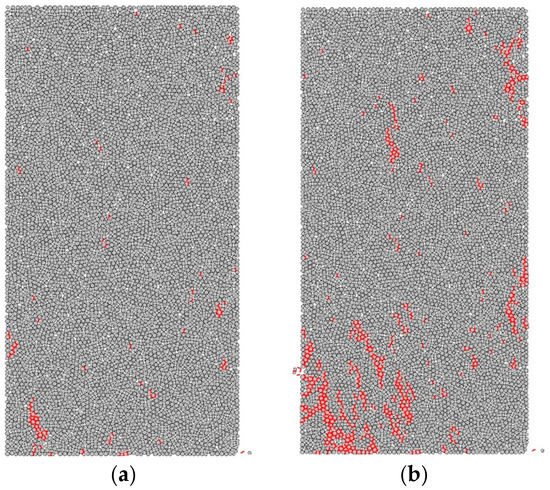
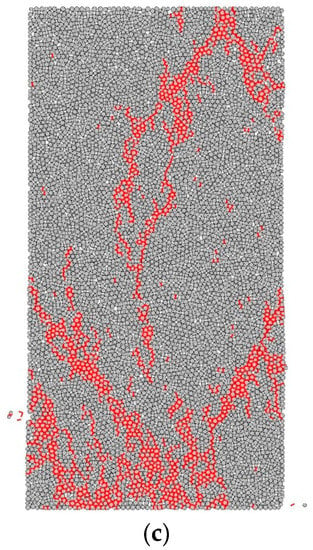
Figure 12.
Fracture development of rock samples at different stages. (a) Slow development stage; (b) rapid development stage; (c) post-destruction stage.
The internal cracks of the sandstone sample are highly developed, and the number of cracks increases quickly until the sample is destroyed, according to the cloud diagram of crack development, which is very similar to the unstable growth stage divided in accordance with the dissipative energy proportion curve in Section 4. As a result, the simulation sample’s failure precursor is determined to be the beginning of the rapid crack development stage. Table 4 shows σpre/σmax of four groups of simulation sandstone samples A, B, C, and D.

Table 4.
σpre, σmax, and σpre/σmax of simulated sandstone samples.
It can be seen that the σpre/σmax of the simulated sandstone samples under different moisture contents is very close to that in Table 4, which is consistent with the conclusion of the experimental analysis. However, the σpre/σmax of the simulated sample is 0.89565, which is lower than the result of the actual experiment. This difference may be because the simulated sample cannot simulate the compaction stage in the loading process of the sandstone well.
In general, the actual sandstone experiment and the simulated sandstone experiment are consistent in characterizing the failure of sandstone samples from the perspectives of dissipated energy and fracture development, respectively. This can be verified from the change in dissipated energy in the peak and fracture development of the simulated sample during loading, as shown in Figure 13.
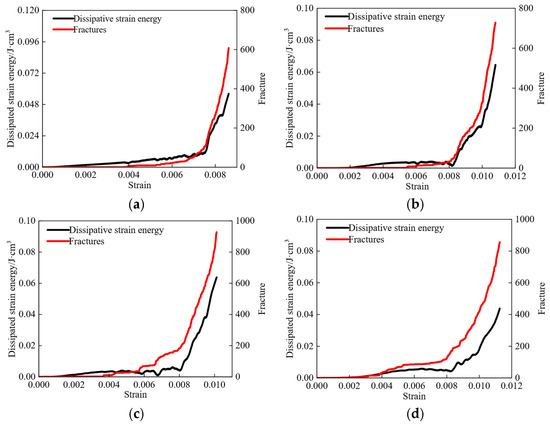
Figure 13.
Dissipated energy and Fracture development of simulated samples. (a) A; (b) B; (c) C; (d) D.
As shown in Figure 14, the fracture development is closely related to the dissipated energy. A linear fit is used to determine the relationship between fracture development in rock samples caused by dissipated energy under varying moisture content conditions. Figure 15 illustrates the relationship between the number of fractures before the peak and the dissipated energy of four different moisture content simulated rock samples during loading.
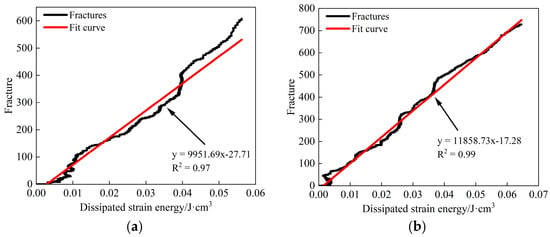
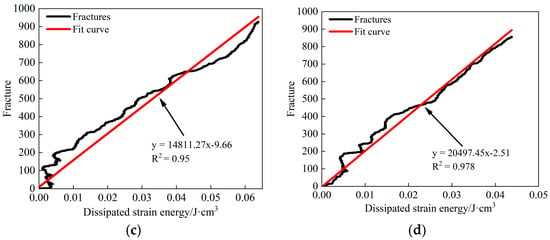
Figure 14.
Fracture development with dissipated energy of Simulated samples. (a) A; (b) B; (c) C; (d) D.
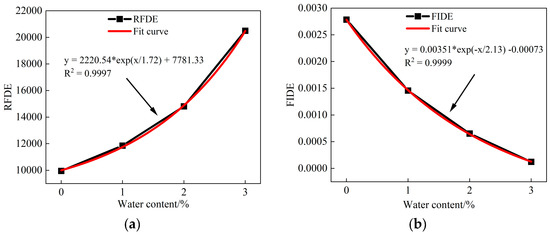
Figure 15.
RFDE and FIDE change curves of simulated samples under different moisture contents. (a) RFDE; (b) FIDE.
There is a strong linear correlation between the amount of crack development and the rise in dissipated energy, as shown by the fact that R2 does not fall below 0.95 in any of the four groups of simulation samples. The Equations (10)–(14) revealed the four groups of simulation sample data that fit function relationships.
The relationship between the quantity of fracture development and the dissipated energy of simulated sample A is as follows:
The relationship between the quantity of fracture development and the dissipated energy of simulated sample B is as follows:
The relationship between the quantity of fracture development and the dissipated energy of simulated sample C is as follows:
The relationship between the quantity of fracture development and the dissipated energy of simulated sample D is as follows:
It can be seen that the relationship between the number of fractures developed and the change in their dissipated energy in the simulated samples with different moisture contents is a function of:
where a and b represent the slope and intercept of the fitting curve, respectively.
When there are no fractures, the dissipated energy equals b/a, where a is the fracture to dissipated energy ratio (RFDE), and b/a is the fracture initiation dissipated energy ratio (FIDE). The RFDE denotes the number of cracks in the specimen caused by dissipation. Only when the dissipated energy reaches this value will the simulated sample begin to crack. Figure 15 depicts the RFDE and FIDE change curves of simulated samples with varying water contents.
According to Figure 15, the RFDE and FIDE both grow and change adversely with water content. It means that as rock water content rises, the same energy that was dissipated can result in the development of more fractures in sandstone. The amount of energy that must be dissipated for fracture development to occur decreases with increased water content. In conclusion, internal fractures in sandstone are easier to develop when they have a higher water content than when they are dry.
6. Conclusions
- (1)
- The peak stress, total strain energy, and elastic strain energy at the peak strength of sandstone decrease linearly with an increase in moisture, while elastic modulus and dissipated energy decrease negatively.
- (2)
- According to the ratio curve of dissipated energy, the starting point of the unstable crack development stage is taken as the precursor point of rock failure. The σpre/σmax of sandstone samples under four moisture contents is very close, about 0.907 of the peak stress.
- (3)
- The strength parameters obtained from the fitting function of uniaxial σmax and E of sandstone samples can be used to simulate the strength characteristics and fracture characteristics of sandstone under various water-bearing conditions in the particle flow simulation software PFC. According to the simulated fracture development curve, the starting point of the rapid fracture development stage is taken as the failure precursor point of the simulated sandstone sample. The σpre/σmax of the simulated rock samples with different moisture contents is nearly identical, about 0.896 of the peak strength.
- (4)
- There are four types of water content simulation. Rock samples are used to determine the relationship between the number of fractures and the change in their dissipated energy. The increased number of internal fractures in rock under the action of unit dissipated strain energy (RFDE) is proposed to be used to calculate the fracture energy consumption ratio of sandstone. On this basis, the dissipative energy of fracture initiation (FIDE) is defined as the dissipative energy associated with the initiation of fractures in sandstone.
- (5)
- The RFDE of sandstone increases exponentially, and FIDE decreases negatively. Water promotes fracturing. High-water-content sandstone can generate more fractures with the same dissipated energy, but it needs less energy to start fracture formation.
Author Contributions
L.H.—Conceptualization, writing-original draft and experiments; K.C.—Conceptualization, supervision, and project administration; N.M.K.—software and data curation; D.J.A.—methodology; S.S.A.—visualization; S.H.—investigation and data curation; M.A.—Experiments. All authors have read and agreed to the published version of the manuscript.
Funding
This research was supported by Anhui Provincial Scientific Research Preparation Plan Project (2022AH050596), and also the Researchers Supporting Project number (RSP2022R496), King Saud University, Riyadh, Saudi Arabia.
Institutional Review Board Statement
Not applicable.
Informed Consent Statement
Not applicable.
Data Availability Statement
The data that supports the findings of this study is available from the corresponding author upon reasonable request.
Acknowledgments
This research was supported by Anhui Provincial Scientific Research Preparation Plan Project (2022AH050596), and also acknowledge the Researchers Supporting Project number (RSP2022R496), King Saud University, Riyadh, Saudi Arabia.
Conflicts of Interest
The authors declare no conflict of interest.
References
- Chi, X.; Yang, K.; Wei, Z. Breaking and mining-induced stress evolution of overlying strata in the working face of a steeply dipping coal seam. Int. J. Coal Sci. Technol. 2021, 8, 614–625. [Google Scholar] [CrossRef]
- Lou, J.; Gao, F.; Yang, J.; Ren, Y.; Li, J.; Wang, X.; Yang, L. Characteristics of evolution of mining-induced stress field in the longwall panel: Insights from physical modeling. Int. J. Coal Sci. Technol. 2021, 8, 938–955. [Google Scholar] [CrossRef]
- Vervoort, A. Various phases in surface movements linked to deep coal longwall mining: From start-up till the period after closure. Int. J. Coal Sci. Technol. 2021, 8, 412–426. [Google Scholar] [CrossRef]
- Wang, J.; Yang, S.; Wei, W.; Zhang, J.; Song, Z. Drawing mechanisms for top coal in longwall top coal caving (LTCC): A review of two decades of literature. Int. J. Coal Sci. Technol. 2021, 8, 1171–1196. [Google Scholar] [CrossRef]
- Yang, D.; Ning, Z.; Li, Y.; Lv, Z.; Qiao, Y. In situ stress measurement and analysis of the stress accumulation levels in coal mines in the northern Ordos Basin, China. Int. J. Coal Sci. Technol. 2021, 8, 1316–1335. [Google Scholar] [CrossRef]
- Chen, B.; Zuo, Y.; Zheng, L.; Zheng, L.; Lin, J.; Pan, C.; Sun, W. Deformation failure mechanism and concrete-filled steel tubular support control technology of deep high-stress fractured roadway. Tunn. Undergr. Space Technol. 2022, 129, 104684. [Google Scholar] [CrossRef]
- Feng, F.; Chen, S.; Zhao, X.; Li, D.; Wang, X.; Cui, J. Effects of external dynamic disturbances and structural plane on rock fracturing around deep underground cavern. Int. J. Coal Sci. Technol. 2022, 9, 15. [Google Scholar] [CrossRef]
- He, S.; Qin, M.; Qiu, L.; Song, D.; Zhang, X. Early warning of coal dynamic disaster by precursor of AE and EMR “quiet period”. Int. J. Coal Sci. Technol. 2022, 9, 46. [Google Scholar] [CrossRef]
- Yu, L.; Yao, Q.; Chong, Z.; Li, Y.; Xu, Q.; Liu, Z. Experimental study on the moisture migration and triaxial mechanical damage mechanisms of water-bearing coal samples. Int. J. Rock Mech. Min. Sci. 2022, 160, 105263. [Google Scholar] [CrossRef]
- Zhang, L.; Kan, Z.; Zhang, C.; Tang, J. Experimental study of coal flow characteristics under mining disturbance in China. Int. J. Coal Sci. Technol. 2022, 9, 66. [Google Scholar] [CrossRef]
- Du, W.; Chai, J.; Zhang, D.; Lei, W. The study of water-resistant key strata stability detected by optic fiber sensing in shallow-buried coal seam. Int. J. Rock Mech. Min. Sci. 2021, 141, 104604. [Google Scholar] [CrossRef]
- Jiang, H.-m.; Li, L.; Rong, X.-l.; Wang, M.-y.; Xia, Y.-p.; Zhang, Z.-c. Model test to investigate waterproof-resistant slab minimum safety thickness for water inrush geohazards. Tunn. Undergr. Space Technol. 2017, 62, 35–42. [Google Scholar] [CrossRef]
- Langford, J.; Holmøy, K.H.; Hansen, T.F.; Holter, K.G.; Stein, E. Analysis of water ingress, grouting effort, and pore pressure reduction caused by hard rock tunnels in the Oslo region. Tunn. Undergr. Space Technol. 2022, 130, 104762. [Google Scholar] [CrossRef]
- Liu, N.; Pei, J.; Cao, C.; Liu, X.; Huang, Y.; Mei, G. Geological investigation and treatment measures against water inrush hazard in karst tunnels: A case study in Guiyang, southwest China. Tunn. Undergr. Space Technol. 2022, 124, 104491. [Google Scholar] [CrossRef]
- Ma, L.; Xu, Y.; Ngo, I.; Wang, Y.; Zhai, J.; Hou, L. Prediction of Water-Blocking Capability of Water-Seepage-Resistance Strata Based on AHP-Fuzzy Comprehensive Evaluation Method—A Case Study. Water 2021, 14, 2517. [Google Scholar] [CrossRef]
- Rudakov, D.; Westermann, S. Analytical modeling of mine water rebound: Three case studies in closed hard-coal mines in Germany. Dnipro Univ. Technol. 2021, 15, 22–30. [Google Scholar] [CrossRef]
- Ma, D.; Duan, H.; Zhang, J.; Bai, H. A state-of-the-art review on rock seepage mechanism of water inrush disaster in coal mines. Int. J. Coal Sci. Technol. 2022, 9, 50. [Google Scholar] [CrossRef]
- Khan, N.M.; Ma, L.; Cao, K.; Hussain, S.; Liu, W.; Xu, Y.; Yuan, Q.; Gu, J. Prediction of an early failure point using infrared radiation characteristics and energy evolution for sandstone with different water contents. Bull. Eng. Geol. Environ. 2021, 80, 6913–6936. [Google Scholar] [CrossRef]
- Gao, R.; Kuang, T.; Zhang, Y.; Zhang, W.; Quan, C. Controlling mine pressure by subjecting high-level hard rock strata to ground fracturing. Int. J. Coal Sci. Technol. 2021, 8, 1336–1350. [Google Scholar] [CrossRef]
- Qi, T.; Zhang, F.; Pei, X.; Feng, G.; Wei, H. Simulation research and application on response characteristics of detecting water-filled goaf by transient electromagnetic method. Int. J. Coal Sci. Technol. 2022, 9, 17. [Google Scholar] [CrossRef]
- Luo, S.; Gong, F. Linear Energy Storage and Dissipation Laws of Rocks Under Preset Angle Shear Conditions. Rock Mech. Rock Eng. 2020, 53, 3303–3323. [Google Scholar] [CrossRef]
- Meng, Q.-b.; Liu, J.-f.; Huang, B.-x.; Pu, H.; Wu, J.-y.; Zhang, Z.-z. Effects of Confining Pressure and Temperature on the Energy Evolution of Rocks Under Triaxial Cyclic Loading and Unloading Conditions. Rock Mech. Rock Eng. 2021, 55, 773–798. [Google Scholar] [CrossRef]
- Zhao, J.; Tan, Z.; Wang, X.; Zhou, Z.; Li, G. Engineering characteristics of water-bearing weakly cemented sandstone and dewatering technology in tunnel excavation. Tunn. Undergr. Space Technol. 2022, 121, 104316. [Google Scholar] [CrossRef]
- Zhao, K.; Yang, D.; Zeng, P.; Huang, Z.; Wu, W.; Li, B.; Teng, T. Effect of water content on the failure pattern and acoustic emission characteristics of red sandstone. Int. J. Rock Mech. Min. Sci. 2021, 142, 104709. [Google Scholar] [CrossRef]
- Liu, Z.; Wang, G.; Li, J.; Li, H.; Zhao, H.; Shi, H.; Lan, J. Water-immersion softening mechanism of coal rock mass based on split Hopkinson pressure bar experiment. Int. J. Coal Sci. Technol. 2022, 9, 61. [Google Scholar] [CrossRef]
- Guo, P.; Gu, J.; Su, Y.; Wang, J.; Ding, Z. Effect of cyclic wetting–drying on tensile mechanical behavior and microstructure of clay-bearing sandstone. Int. J. Coal Sci. Technol. 2021, 8, 956–968. [Google Scholar] [CrossRef]
- Liu, A.; Liu, S.; Liu, P.; Wang, K. Water sorption on coal: Effects of oxygen-containing function groups and pore structure. Int. J. Coal Sci. Technol. 2021, 8, 983–1002. [Google Scholar] [CrossRef]
- Wiatowski, M.; Kapusta, K.; Nowak, J.; Szyja, M.; Basa, W. An exsitu underground coal gasification experiment with a siderite interlayer: Course of the process, production gas, temperatures and energy efficiency. Int. J. Coal Sci. Technol. 2021, 8, 1447–1460. [Google Scholar] [CrossRef]
- Yao, W.; Li, C.; Zhan, H.; Zhou, J.-Q.; Criss, R.E.; Xiong, S.; Jiang, X. Multiscale Study of Physical and Mechanical Properties of Sandstone in Three Gorges Reservoir Region Subjected to Cyclic Wetting–Drying of Yangtze River Water. Rock Mech. Rock Eng. 2020, 53, 2215–2231. [Google Scholar] [CrossRef]
- Noël, C.; Baud, P.; Violay, M. Effect of water on sandstone’s fracture toughness and frictional parameters: Brittle strength constraints. Int. J. Rock Mech. Min. Sci. 2021, 147, 104916. [Google Scholar] [CrossRef]
- Lin, H.; Zhang, Q.; Zhang, L.; Duan, K.; Xue, T.; Fan, Q. The Influence of Water Content on the Time-Dependent Mechanical Behavior of Argillaceous Siltstone. Rock Mech. Rock Eng. 2022, 55, 3939–3957. [Google Scholar] [CrossRef]
- Zhou, X.-P.; Jiang, D.-C.; Zhao, Z. Digital Evaluation of Micro-Pore Water Effects on Mechanical and Damage Characteristics of Sandstone Subjected to Uniaxial, Cyclic Loading–Unloading Compression by 3D Reconstruction Technique. Rock Mech. Rock Eng. 2021, 55, 147–167. [Google Scholar] [CrossRef]
- Wu, H.; Ju, Y.; Han, X.; Ren, Z.; Sun, Y.; Zhang, Y.; Han, T. Size effects in the uniaxial compressive properties of 3D printed models of rocks: An experimental investigation. Int. J. Coal Sci. Technol. 2022, 9, 83. [Google Scholar] [CrossRef]
- Yi, M.; Wang, L.; Hao, C.; Liu, Q.; Wang, Z. Method for designing the optimal sealing depth in methane drainage boreholes to realize efficient drainage. Int. J. Coal Sci. Technol. 2021, 8, 1400–1410. [Google Scholar] [CrossRef]
- Tang, J.; Zhang, X.; Sun, S.; Pan, Y.; Li, L. Evolution characteristics of precursor information of coal and gas outburst in deep rock cross-cut coal uncovering. Int. J. Coal Sci. Technol. 2022, 9, 5. [Google Scholar] [CrossRef]
- Wu, R.; Zhang, P.; Kulatilake, P.H.S.W.; Luo, H.; He, Q. Stress and deformation analysis of gob-side pre-backfill driving procedure of longwall mining: A case study. Int. J. Coal Sci. Technol. 2021, 8, 1351–1370. [Google Scholar] [CrossRef]
- Li, Y.; Song, L.; Tang, Y.; Zuo, J.; Xue, D. Evaluating the mechanical properties of anisotropic shale containing bedding and natural fractures with discrete element modeling. Int. J. Coal Sci. Technol. 2022, 9, 18. [Google Scholar] [CrossRef]
- Wang, K.; Zhang, G.; Wang, Y.; Zhang, X.; Li, K.; Guo, W.; Du, F. A numerical investigation of hydraulic fracturing on coal seam permeability based on PFC-COMSOL coupling method. Int. J. Coal Sci. Technol. 2022, 9, 10. [Google Scholar] [CrossRef]
- Ma, L.; Khan, N.M.; Cao, K.; Rehman, H.; Salman, S.; Rehman, F.U.; Xiong, H. Prediction of Sandstone Dilatancy Point in Different Water Contents Using Infrared Radiation Characteristic: Experimental and Machine Learning Approaches. Lithosphere 2021, 2021, 3243070. [Google Scholar] [CrossRef]
- Liang, X.; Tang, S.; Tang, C.a.; Hu, L.; Chen, F. Influence of Water on the Mechanical Properties and Failure Behaviors of Sandstone Under Triaxial Compression. Rock Mech. Rock Eng. 2022, 2, 1–32. [Google Scholar] [CrossRef]
- Yao, Q.; Chen, T.; Tang, C.; Sedighi, M.; Wang, S.; Huang, Q. Influence of moisture on crack propagation in coal and its failure modes. Eng. Geol. 2019, 258, 105156. [Google Scholar] [CrossRef]
- Chen, P.; Tang, S.; Liang, X.; Zhang, Y.; Tang, C. The influence of immersed water level on the short- and long-term mechanical behavior of sandstone. Int. J. Rock Mech. Min. Sci. 2021, 138, 104631. [Google Scholar] [CrossRef]
- Liu, H.; Zhu, W.; Yu, Y.; Xu, T.; Li, R.; Liu, X. Effect of water imbibition on uniaxial compression strength of sandstone. Int. J. Rock Mech. Min. Sci. 2020, 127, 104200. [Google Scholar] [CrossRef]
- Ai, T.; Wu, S.; Zhang, R.; Gao, M.; Zhou, J.; Xie, J.; Ren, L.; Zhang, Z. Changes in the structure and mechanical properties of a typical coal induced by water immersion. Int. J. Rock Mech. Min. Sci. 2021, 138, 104597. [Google Scholar] [CrossRef]
- Chen, Y.; Zuo, J.; Liu, D.; Li, Y.; Wang, Z. Experimental and numerical study of coal-rock bimaterial composite bodies under triaxial compression. Int. J. Coal Sci. Technol. 2021, 8, 908–924. [Google Scholar] [CrossRef]
- Liu, B.; Zhao, Y.; Zhang, C.; Zhou, J.; Li, Y.; Sun, Z. Characteristic strength and acoustic emission properties of weakly cemented sandstone at different depths under uniaxial compression. Int. J. Coal Sci. Technol. 2021, 8, 1288–1301. [Google Scholar] [CrossRef]
- Wei, C.; Zhang, C.; Canbulat, I.; Song, Z.; Dai, L. A review of investigations on ground support requirements in coal burst-prone mines. Int. J. Coal Sci. Technol. 2022, 9, 13. [Google Scholar] [CrossRef]
- He, M.; Zhao, J.; Deng, B.; Zhang, Z. Effect of layered joints on rockburst in deep tunnels. Int. J. Coal Sci. Technol. 2022, 9, 21. [Google Scholar] [CrossRef]
- Li, L.; Zhang, H.; Pan, Y.; Ju, X.; Tang, L.; Li, M. Influence of stress wave-induced disturbance on ultra-low friction in broken blocks. Int. J. Coal Sci. Technol. 2022, 9, 22. [Google Scholar] [CrossRef]
- Du, F.; Ma, J.; Guo, X.; Wang, T.; Dong, X.; Li, J.; He, S.; Nuerjuma, D. Rockburst mechanism and the law of energy accumulation and release in mining roadway: A case study. Int. J. Coal Sci. Technol. 2022, 9, 67. [Google Scholar] [CrossRef]
- Zhou, Z.; Cai, X.; Li, X.; Cao, W.; Du, X. Dynamic Response and Energy Evolution of Sandstone Under Coupled Static–Dynamic Compression: Insights from Experimental Study into Deep Rock Engineering Applications. Rock Mech. Rock Eng. 2019, 53, 1305–1331. [Google Scholar] [CrossRef]
- Dou, L.; Yang, K.; Chi, X. Fracture behavior and acoustic emission characteristics of sandstone samples with inclined precracks. Int. J. Coal Sci. Technol. 2021, 8, 77–87. [Google Scholar] [CrossRef]
- Xie, H.P.; Yang, J.U.; Li-Yun, L.I. Criteria for strength and structural failure of rocks based on energy dissipation and energy release principles. Chin. J. Rock Mech. Eng. 2005, 24, 3003–3010. [Google Scholar]
- Xie, H.P.; Ju, Y.; Li, L.Y.; Peng, R.D. Energy Mechanism of Deformation and Failure of Rock Masses. Chin. J. Rock Mech. Eng. 2008, 27, 1729–1740. [Google Scholar]
- Hu, L.; Li, Y.; Liang, X.; Tang, C.a.; Yan, L. Rock Damage and Energy Balance of Strainbursts Induced by Low Frequency Seismic Disturbance at High Static Stress. Rock Mech. Rock Eng. 2020, 53, 4857–4872. [Google Scholar] [CrossRef]
- Luo, Y. Influence of water on mechanical behavior of surrounding rock in hard-rock tunnels: An experimental simulation. Eng. Geol. 2020, 277, 105816. [Google Scholar] [CrossRef]
- Ding, Z.W.; Jia, J.D.; Tang, Q.B.; Li, X.F. Mechanical Properties and Energy Damage Evolution Characteristics of Coal Under Cyclic Loading and Unloading. Rock Mech. Rock Eng. 2022, 55, 4765–4781. [Google Scholar] [CrossRef]
- Li, T.; Pei, X.; Guo, J.; Meng, M.; Huang, R. An Energy-Based Fatigue Damage Model for Sandstone Subjected to Cyclic Loading. Rock Mech. Rock Eng. 2020, 53, 5069–5079. [Google Scholar] [CrossRef]
- Liang, C.; Li, X.; Wang, S.; Li, S.; Ma, C. Experimental investigations on rate-dependent stress-strain characteristics and energy mechanism of rock under uniaixal compression. Yanshilixue Yu Gongcheng Xuebao/Chin. J. Rock Mech. Eng. 2012, 31, 1830–1838. [Google Scholar]
- Sun, H. Infrared Radiation Response Mechanism and Quantitative Characterization during Damage Evolution of Bearing Coal and Rock; China University of Mining and Technology (Jiangsu): Xuzhou, China, 2019. [Google Scholar]
- Ajamzadeh, M.; Sarfarazi, V.; Dehghani, H. Evaluation of plow system performance in long-wall mining method using particle flow code. Int. J. Coal Sci. Technol. 2019, 6, 518–535. [Google Scholar] [CrossRef]
- Wang, X.; Gao, F. Triaxial compression behavior of large-scale jointed coal: A numerical study. Int. J. Coal Sci. Technol. 2022, 9, 76. [Google Scholar] [CrossRef]
- Zhang, J.; Cheng, D.; Yang, Y.; Wei, W.; Li, Z.; Song, Z. Numerical and theoretical investigations of the effect of the gangue-coal density ratio on the drawing mechanism in longwall top-coal caving. Int. J. Coal Sci. Technol. 2022, 9, 31. [Google Scholar] [CrossRef]
Disclaimer/Publisher’s Note: The statements, opinions and data contained in all publications are solely those of the individual author(s) and contributor(s) and not of MDPI and/or the editor(s). MDPI and/or the editor(s) disclaim responsibility for any injury to people or property resulting from any ideas, methods, instructions or products referred to in the content. |
© 2023 by the authors. Licensee MDPI, Basel, Switzerland. This article is an open access article distributed under the terms and conditions of the Creative Commons Attribution (CC BY) license (https://creativecommons.org/licenses/by/4.0/).