Abstract
With the vigorous development of industrialization and urbanization, rural space faces many difficulties in achieving sustainable development, such as the spatial structure being unbalanced. To explore the sustainable development of rural space, this study evaluates the spatial evolution and multi-scenario simulation of rural space with reference to the three dominant functions of land use, namely “production–ecological–living” (PEL), based on the interpretation of land use remote sensing data in 2000, 2010, and 2020. The change characteristics and the formation mechanism of the territorial spatial pattern were quantitatively analyzed by gravity center transfer, territorial spatial transfer matrix, standard deviational ellipse, geo-detector, and artificial neural network CA simulation. The results showed that (1) from 2000 to 2020, the rural production space in Beijing continued to decrease, the rural living space continued to increase and then gradually contracted, and the rural ecological space as a whole also showed a downward trend. (2) During the study period, the formation and evolution of the ecological spatial pattern of rural production and living in Beijing were affected by both regional physical geographical factors and human, social, and economic factors, with significant differences; the interaction between two driving factors is stronger than that within a single factor, and the main mode of action is double factor enhancement and nonlinear enhancement. (3) Compared with the other three scenarios, the performance of Beijing’s rural space in 2030 under the harmonious development scenario is more compact and stable, the rural production space is basically guaranteed, the intensity of rural living space is enhanced, and the overall situation of rural ecological space is stable. Our results show that in the future decision-making of rural land and space development around a metropolis, we should fully consider the evolution law of rural spatial pattern, as well as the driving force of natural geographical factors and economic activity factors and discuss the optimization and overall management of rural production and living ecological space through multi-scenario spatial simulation.
1. Introduction
Influenced by globalization, the transformation of rural space in developed countries has gone through the process of production, post-production, and multi-functional development. The orderly development of human and natural ecosystems has an increasingly obvious impact on production and life. Improving the quality of production and life while maintaining a stable supply of ecosystem services has become the core challenge of global sustainable development. In contrast, rural space in most developing countries is still in the initial stage of transformation and development with rapid urbanization. As the largest developing country in the world, China has experienced profound development since its reform and opening up. After decades of industrialization and urbanization, the rural space in rural areas around some big cities has intensified the conflict between rural production, living, and ecological space, leading to a decline in the quantity and quality of production space, disorder, and chaos of living space, and erosion and pollution of ecological space. Therefore, the sustainable development of rural space is facing severe challenges and crises [1]. How to optimize the rural spatial structure and resource allocation is not only a need for agricultural development and rural modernization but also one of the key problems that China and the world need to solve urgently for sustainable development.
With the deepening of anti-urbanization, globalization, and post-industrialization, the multi-function and global transformation of rural space have become the research focus of rural geography [2]. The research content of rural space mainly includes the use of social network analysis [3], spatial field theory [4], actor–network theory [5], and other methods to analyze the evolution process [6] and driving force of rural space in the shaping process of the new urban–rural relationship of urban–rural integration [7], externally driven spatial reconstruction of rural society [8] and spatial polarization process [9], evolution process and optimization model of rural settlement space [10,11], multi-governance of rural space [12], etc. Long [13] believes that land use transformation and rural transformation and development are important features of the evolution of the rural regional system. Liu [14] and others improved the concept of rural transformation and development, proposed a new concept of “village community”, and believed that rural transformation and spatial reconstruction can be summarized as three processes, namely slow development–rapid expansion–accelerated reconstruction; Ge junior college [15] and others deeply studied the logical relationship between solving the rural space conflict problem and ensuring food security and believed that the traditional agricultural areas should carry out the “material ownership organization” governance of rural space. Gao [16] and others used ethnographic methods to explore the transformation and development of border villages driven by tourism; Tu [17] and other TOPSIS models based on the entropy method comprehensively measure the rural development level index and rural reconstruction intensity index; among them, Chinese scholars’ research on the spatial pattern and regional type of rural transformation and development has made great achievements in identifying problem regions and dividing different regional development types. The mutual promotion mechanism between rural spatial governance and rural construction actions, as well as the power mechanism of rural transformation and reconstruction, need to be further studied.
The functional classification of PEL space is a further refinement and exploration of the theoretical connotation of PEL space [18]. Only when the production, ecological, and living functions are refined at different levels, can specific measures for the protection, development, utilization, and governance of PEL space be explored according to local conditions [19]. Wu [20] and others carried out the classified evaluation of the PEL space of Beijing–Tianjin–Hebei urban agglomeration by establishing the land PEL function scoring matrix from the scale of urban agglomeration; Chen [21] and others carried out a more systematic research on the evaluation indicators of the PEL spatial classification system from the provincial scale based on the principle of land multi-function and the connotation of the PEL spatial theory; Sun [22] and others evaluated the classification and function of rural PEL space by using the direct measurement algorithm of biophysical process from the municipal scale and integrating the dominant function of land use status [23]. In the existing research, the problem of identifying the dominant function of land space type has attracted the attention of a large number of scholars. For example, Wang [24], by analyzing the internal causes of the differentiation of rural regional spatial functions, judged the dominant functions and put forward constraint assumptions. Zou [25] and others drew on Spearman’s method of quantitative analysis of the interaction between functions and determined the leading function of the rural status quo at the county level. Fang [26] and others built a classification system of urban ecological, production, and living functions by using the spatial function value accounting function group, integrating the vertical and horizontal comparison method and ecosystem service value assessment. Zhao [27] and others expanded the application of the emerging machine learning algorithm in the identification of the dominant function of the “production life ecological” space in the city by using the random forest model and the quadrat proportion method. The optimization of PEL functional space is based on the extension of the connotation of PEL spatial theory and the identification method of functional space [28], and the process of constantly maximizing the comprehensive benefits of different land spatial configurations through models and other methods, so as to build an adjustment scheme for the comprehensive optimization of the regional system of human land relations [29]. In terms of research methodology, Xie [30] and others think that the existing spatial optimization methods are mainly 3S space technology, quantitative statistical models, and index model analysis methods in ecology, but it is difficult to achieve effective unification of land quantitative structure and spatial structure using these methods. At present, there are few kinds of research on the internal and external factors, driving mechanism, development mode, and realization path of the spatial evolution of PEL space [31].
Multi-scenario land-use change simulation can be predicted and analyzed through various models, and many models have been applied to future land-use change. Relevant scholars have conducted a lot of research on the optimization of land use structure and layout from the aspects of method innovation [32], constraint control [33], scale adjustment [34], target coupling [35], etc. Gao [36] and others combined the PLUS model and comprehensive indicator system to assess the ecological risk of land use under multiple scenarios and made progress in the research of ensuring urban sustainable development; Huo [37] and others carried multi-scene simulation and optimization of land use through the Markov FLUS coupling model, providing a new strategy for controlling population growth, permanently protecting basic farmland and limiting urban development; Tong [38] and others consider three scenarios and systematically explores the CO2 emissions from future industrial processes as well as relevant cumulative emissions, emission sources, mitigation potentials, and mitigation sources in China. At present, multi-scenario land-use change simulation is mostly used in the research of urban space, but less used in rural space.
The rural areas around big cities are the areas where the agricultural population is rapidly transferred to the non-agricultural population. The gradient of urban and rural landscape changes is large, and the industrial structure is extensive and diverse. The non-agricultural industry is the main body, which is highly dependent on cities. It is the leading edge of urbanization, the pilot area of agricultural modernization, the coordination area of urban and rural relations, and the huge barrier to the ecological environment [39,40]. As a typical mega-city, Beijing has a large realistic disturbance and potential pressure on the ecological environment caused by its dense population and frequent social and economic activities. Facing the dual pressures and challenges of ecological civilization construction and high-quality regional economic development, they put forward higher requirements for the PEL space in the region. Monitoring the change of rural space in Beijing and analyzing the evolution characteristics and existing problems of rural production, life, and ecological space in the process of the two-way flow of urban and rural factors are of great significance for the path and strategy of sustainable development of the surrounding villages of big cities. In the overall optimization method of rural space, traditional qualitative analysis methods are often used to carry out village-scale research. In the research of large-scale rural space, there is a lack of sufficient scientific evidence and reliable quantitative analysis. This research breaks through the administrative constraints of a single village scale studies the rural PEL space from the perspective of regional geography as a whole, and combines with emerging artificial intelligence analysis methods, analyzing the evolution and transformation of rural space from the perspective of the flow of urban–rural integration factors. The main objectives of this study are as follows: (1) analyze the spatial type transformation and pattern evolution of rural production and living ecological space in Beijing from 2000 to 2020; (2) quantify the differentiation and driving factors of rural space; (3) the geographic simulation optimization system is used to simulate the land spatial pattern of Beijing in 2030 under multiple scenarios.
2. Materials and Methods
2.1. Study Area
Beijing is located at 115.7°–117.4° east longitude, 39.4°–41.6° north latitude, 39°54′20″ north latitude, and 116°25′29″ east longitude, with a land space scale of 16,410 square kilometers, as shown in Figure 1. The terrain is high in the northwest and low in the southeast. Beijing is located in the themed zone, with a typical warm temperate semi-humid, and semi-arid monsoon climate. Beijing’s urbanization has brought opportunities as well as challenges to rural development. The countryside cannot use the rhythm of urban production for a short time, which has caused negative problems such as the flow disorder of rural elements and the imbalance of rural spatial order.
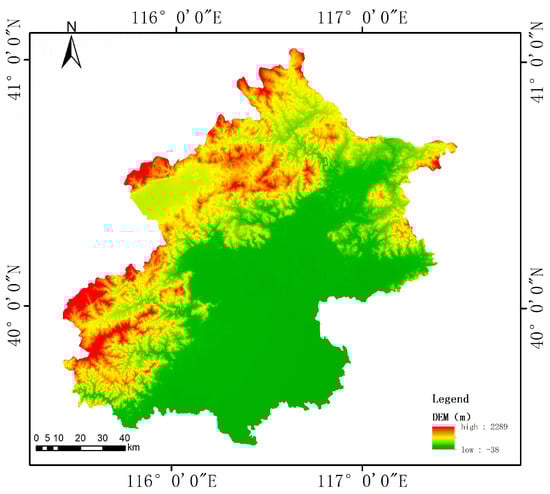
Figure 1.
Topographic map of Beijing.
2.2. Data Source and Description
2.2.1. Data Source
The data used in this study are divided into spatial data and statistical data:
Given the accessibility and continuity of the data, we selected land use data for 2000, 2010, and 2020 after the implementation of the Grain for Green policy. The data were obtained from the resource and environmental science data center of the Chinese Academy of Sciences with an accuracy of more than 90% (land use data were selected for the years 2000, 2010, and 2020. http://www.resdc.cn (accessed on 1 September 2021), resolution 30 m × 30 m).
The social and economic statistics mainly come from the Beijing Statistical Yearbook in 2001, 2011, and 2021, and the Beijing Regional Statistical Yearbook in 2011 and 2021.
2.2.2. Classification of PEL Space Based on Land Use Types
At present, most of the existing scholars’ methods of the PEL spatial classification system recognize and divide the space by using the land function attributes. This study comprehensively considers the characteristics and research objectives of its own research area. When classifying PEL land, it mainly adopts the bottom-up classification method, which combines and summarizes the land use types. Under the premise of existing land use versatility, it highlights the main needs of space, and realizes it through the identification of dominant functions. We built a classification system to divide the functions of land into principal functions and secondary functions. The realization of secondary functions depends on the principal functions. The protection of principal functions is the premise of the embodiment of secondary functions. For example, grassland and water have both ecological functions and production functions; the deterioration of the environment will inevitably lead to the value of the production function, so its main function is an ecological function, referring to the research of Yang Qingke et al. [41] and Zou Lilin et al. [42] as shown in Table 1.

Table 1.
PEL Space Classification.
2.3. Research Methods
2.3.1. Dynamic Degree of Land Use
Land use dynamic degree is an index used to reflect the interannual speed of land use change in the study period. The calculation formula is [43]:
where is the dynamic degree of land use, are the years at the beginning and the end of the study period respectively, are the area of a certain type of land use at the beginning and end of the study period, respectively.
2.3.2. Land Use Transfer Matrix
Use the map algebra method in the ArcGIS platform to extract the land use transfer matrix from 2000 to 2020. The formula is [44]:
where is the value of the new pixel in row and column of the land-use change map from period to period ; is the pixel value in row and column of the land cover map in and periods, respectively.
2.3.3. Standard Deviation Ellipse
The spatial statistical method of standard deviation ellipse (SDE) is based on measuring the spatial distribution and global characteristics of geographical elements from multiple perspectives. Its elements include the center, azimuth, major axis, and minor axis. The calculation formula is [45]:
where () is the weighted average center; () is the geometric center coordinate; is the weight; is the azimuth of the ellipse; is arctangent; and represent sine and cosine respectively; and is the coordinate deviation from the administrative center to the average center; and is the standard deviation along the and axes, respectively.
2.3.4. Geo-Detector Model
Geo-detector model is a new statistical method to detect spatial differentiation and explain its driving factors. The value q of the determining force is used to explain the spatial differentiation of the independent variable to the dependent variable. The value range is 0 to 1. The larger the value is, the stronger the explanatory power is [46].
where, = 1,…, is the classification of factor X; and are the numbers of units in layer and the whole area, respectively; and are, respectively, the sum of variance within the layer and the total variance of the whole region. The value range of is (0,1). The larger the value, the greater the influence of the factor.
Geo-detector is an important tool to detect and use spatial differentiation to reveal the spatial evolution mechanism of the PEL space in rural areas of Beijing. In general, regional spatial evolution is mainly affected by natural conditions, traffic location conditions, social and economic conditions, policy and institutional environment, and other factors. Based on previous scholars’ analysis of spatial evolution methods and the study of regional characteristics, this study selected four dimensions, a total of 14 indicators, to analyze the evolution mechanism of Beijing’s rural PEL space, including different driving factors of the natural environment and social economy, as shown in Table 2.
Table 2.
Index system of geo-detector model.
2.3.5. Artificial Neural Network CA Simulation
The ANN-CA model uses an artificial neural network to automatically mine CA conversion rules. This model does not require users to provide an exact model structure and can effectively reflect the complex relationship between spatial variables, which is very suitable for dealing with the mutual conversion between multiple land use types. Calculation formula [47]:
Conversion probability of the first land use type at time t of cell k P = random factor × artificial neural network
Calculation probability × Neighborhood development density × Conversion suitability.
is a random factor; is the conversion probability of a certain land use type calculated by using the trained artificial neural network; is the density of urban land in the defined neighborhood window, that is, the total number of urban land cells/the total number of grids in the neighborhood window; is the conversion suitability between two land use types.
The research on spatial evolution simulation is mainly based on the GeoSOS software, a geographic simulation optimization system proposed by Professor Li Xia’s team, which is specifically implemented in the ArcMap10.7 expansion toolbar. The ANN-CA model is used to build the spatial evolution model of Beijing’s rural PEL space, and the CA simulation process based on the artificial God network method is carried out. The main working principle is to use the artificial neural network method to extract the change rules of different types of land space in Beijing under the background of urban–rural integration, and then apply the rules to the subsequent simulation and prediction of the spatial evolution of rural PEL space. The whole process is divided into two stages: ANN-CA training and ANN-CA simulation. The various factors that affect the spatial change of national territory input in the ANN-CA training stage mainly include digital elevation, temperature, precipitation, roads, population, public financial expenditure, urbanization rate, and regional gross product.
By setting up three different development scenarios, this study explores the possible spatial and quantitative changes of rural PEL spaces in Beijing under the mutual flow of urban and rural elements. Considering the high cost and difficulty of transforming urban built-up space into other space types, and the fact that it rarely happens in the evolution of actual land space, urban construction space in all development scenarios in the study is set to not be transformed into other space types. Use the values of 0 and 1 to define the space conversion rules. Zero means that spaces cannot be converted, and 1 means that they can be converted to each other. The scenario simulation cost matrix for three different development scenarios is shown in Table 3.
Table 3.
Scenario simulation cost matrix (note: A, B, C, D, E, F, G, respectively, represent rural production space, green ecological space, blue ecological space, urban living space, rural living space, other construction space, and potential ecological space).
The first scenario is the inertial development scenario, which is mainly based on the reference scenario set by extracting the rules for the evolution of land and space in Beijing from 2010 to 2020. The premise of this scenario assumption is that the changes in external disturbance factors are small, and there is no obvious external driving force such as institutional change or policy change. The supply and demand of different types of land and space in Beijing in the next decade will continue the past balanced situation.
The second scenario is the food security scenario, which mainly considers the importance of rural production space for the national strategy of storing grain on the land and protects the rural production space within the regional scope of Beijing. Specifically, by limiting the rural production space to other types of land space in the scenario simulation cost matrix, the spatial evolution of Beijing’s land is simulated under the premise of giving priority to the development of rural production space.
The third scenario is the harmonious development scenario, which mainly considers that the Beijing Municipal Government has attached great importance to ecological protection in recent years’ complex urban planning. In particular, the delimitation of ecological conservation areas in Beijing will have a great impact on the evolution of urban land space. By limiting the rural ecological space in the scenario simulation cost matrix, it cannot be transformed into other types of land space, the spatial evolution of Beijing’s land under the premise of simulating the priority development of rural ecological space.
3. Results
3.1. Spatial Evolution of Rural PLE Space in Beijing
3.1.1. Changes in the Spatial Quantitative Structure of Rural PLE Space
From 2000 to 2020, the rural production space in Beijing continued to decrease, from 4910.83 km2 in 2000 it reduced to 3797.08 km2 in 2020, reduced by 1113.75 km2; the rural living space in Beijing continued to increase first and then gradually contracted, with the area first increasing from 999.32 km2 in 2000 to 1890.02 km2 in 2010, an 890.70 km2 increase. By 2020, it will show a downward trend. The overall rural ecological space in Beijing also shows a downward trend, from 9238.37 km2 in 2000, shrinking to 8756.52 km2 in 2020, a 481.85 km2 reduction. From 2000 to 2020, the annual change rates of rural production space, rural living space, and rural ecological space in Beijing were −1.07%, 0.60%, and −0.25%, respectively. Among them, the change rate of continuous reduction in rural production space in Beijing from 2000 to 2010 was as fast as −2.17%, and the land area decreased sharply by 1173.58 km2. The change rate from 2010 to 2020 was 0.15%, and the land area increased slightly. The land growth and change rate of rural living space reached 8.10% from 2000 to 2010, and the land area increased significantly, but the change rate decreased to −3.67% from 2010 to 2020, and the space area has a shrinking trend. The interannual change rate of rural ecological space decreased as a whole, and the change rate from 2000 to 2020 reached −0.25%, of which the main changes were concentrated in the period from 2010 to 2020, and the change rate was −0.48%, as shown in Table 4.
Table 4.
Dynamic Change of Land Use of Rural PEL Space in Beijing.
3.1.2. Mutual Transformation of Rural PLE Space Types
As shown in Figure 2, from 2000 to 2020, Beijing’s rural production space transferred out 1755.72 km2 in total. It has the largest number of land transferred out of all space types, most of which is transformed into rural living space, green ecological space, and urban living space. The most transferred space type is 275.84 km2 of green ecological space. The second is rural living space and rural production space, 284.12 km2 of rural living space transferred out. The main destinations are rural living space, green ecological space, and urban living space. Rural living space is mainly the transformation of rural ecological space and rural production space. During 2000–2020, blue ecological space in the rural ecological space transferred out 230.57 km2 in total. The main destination is rural production space and green ecological space; the main destination of green ecological space is rural living space and rural production space, with a total of 535.57 km2 transferred out. The transformation is mainly realized through rural production space; potential ecological space is mainly expanded through rural production space, green ecological space, and blue ecological space.
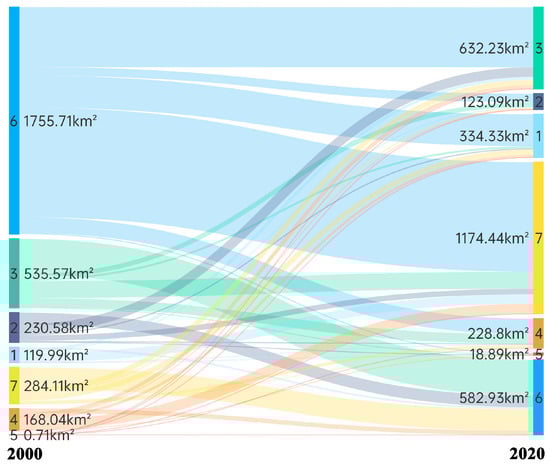
Figure 2.
Change process of PEL space in Beijing from 2000 to 2020. (Note: taking an example, codes 1–7 represent urban living space to rural living space. The number on the left side of the figure represents the total area transferred from a certain land type to another).
The number on the right represents the total area of this land transferred from other land types.
3.1.3. Spatial Pattern and Expansion Direction of Rural PLE Space
From 2000 to 2020, the land space evolution of Beijing has formed an overall pattern of urban living space occupying the core of Beijing. Other types of space are distributed in circles, showing the spatial pattern characteristics of “core zone buffer zone edge layer”, as shown in Figure 3. The rural ecological space is mainly distributed in the west and north of Beijing’s urban built-up areas, forming an ecological conservation area in Beijing; The rural production space is mainly distributed in the buffer zone from the flat area to the mountainous area outside the urban built-up area, as well as the mountainous gully area, which is denser in the southeast than in the northwest; the rural living space tends to be the same as the rural production space as a whole. The main urban area of Beijing is also separated from the suburban counties by the rural living space and the rural production space. The urban space is scattered in the regional administrative centers, bearing the regional urban construction and the development of the regional economy as the leading region. The periphery of the urban built-up area is mainly composed of rural living space, rural production space and rural ecological space.
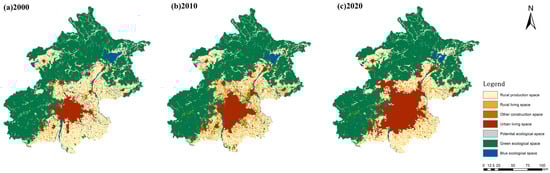
Figure 3.
Spatial Distribution of PEL space in Beijing from 2000 to 2020.
This paper analyzes the spatial expansion direction of the rural PEL space in Beijing in the past 20 years by using the standard elliptic difference, as shown in Figure 4. From the overall characteristics of the spatial distribution of the PEL space in Beijing and the changes in its spatial movement direction, the overall change of the rural production spatial pattern is not large, and the spatial distribution shows the characteristics of northeast-southwest. From 2000 to 2020, the overall pattern of rural production space changed greatly, forming a northeast–southwest extension distribution pattern from Miyun District and Huairou District in the northeast to Fangshan District in the southwest. The deviation of the standard deviation ellipse in the X-axis direction is less than the Y-axis direction. It can be seen that the rural production space expanded significantly along the Y-axis direction, that is, east by south. Pinggu District in the east of Beijing and Daxing District in the south are key areas for agricultural development in Beijing. During the study period, the overall standard deviation ellipse of rural ecological space in Beijing showed a significant shift to the west and north, and the standard deviation of the Y-axis was significantly higher than the standard deviation of the X-axis, indicating that rural ecological space was increasingly concentrated, the concentration of ecological space in the region was enhanced, and the change trajectory was moving from southeast to northwest; During the study period, the standard deviation of the Y-axis of rural living space in Beijing was lower than the standard deviation of the X-axis for a long time, but the standard deviation of the X-axis and the Y-axis increased, indicating that the trend of rural living space agglomeration was not obvious, the degree of land intensive use was not high, and the rural living space showed a track of moving towards the northwest.
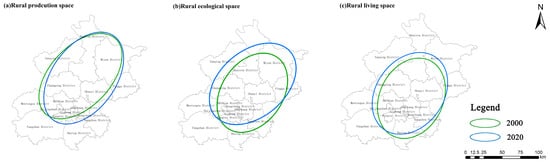
Figure 4.
Elliptical changes of the spatial standard deviation of rural PEL space in Beijing from 2000 to 2020.
3.2. Analysis of Spatial Evolution Mechanism of Rural PEL Space in Beijing
3.2.1. Factor Detection Analysis
The factor detection results (q value) reflect the explanatory power of different influence factors on the spatial evolution of rural PEL space in Beijing. The formation and evolution of the spatial pattern of PEL space in Beijing’s rural areas are influenced by the regional physical geographical basis and the level of human, social and economic development, with significant differences.
In terms of rural production space, the top five drivers of the average q value leading to spatial differentiation from 2000 to 2020 are X6 (urbanization rate), X7 (rural per capita income), X11 (total population), X14 (public financial expenditure), and X10 (primary industry output value), as shown in Figure 5. The rural production space in Beijing continues to decrease, especially in the 2000–2010 period, from 4910.83 km2 sharply reduced to 3796.72 km2.With the increase in rural population and rural per capita income, rural housing construction takes up more arable land. From the perspective of time series, the contribution value of public financial expenditure gradually rose from 12th place to 1st place from 2000 to 2020, and the regional GDP rose to 2nd place, indicating that the development of rural production space is mainly affected by the increasing financial transfer payments, and the rural production space has also begun to recover gradually, and the area has rebounded to 3736.71 km2 by 2020.
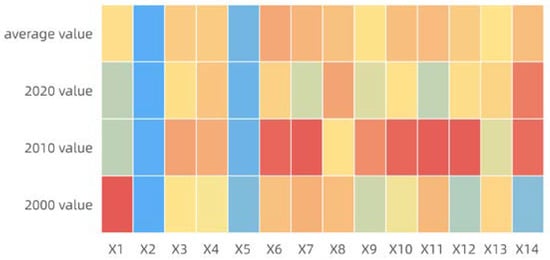
Figure 5.
Thermal diagram of q value contribution of spatial evolution of rural production space in Beijing from 2000 to 2020. (The darker the color of the square in the figure, the higher the explanatory power of the influence factor q value).
In terms of rural living space, the top five driving factors of the average q value from 2000 to 2020 were X13 (fixed asset investment), X6 (urbanization rate), X8 (gross regional product), X11 (total population), and X12 (number of rural employees), as shown in Figure 6. The evolution of rural living space in Beijing is mainly caused by urbanization and population factors. From 2000 to 2020, the q value of the total population driving factor increased from 0.082 to 0.189, indicating that the constraint of population factors on the spatial pattern of rural life has been strengthened, which has a certain relationship with the policy of “demolishing villages and living together”. The more sparsely populated areas are, the lower the degree of infrastructure improvement is, and the more coercive the rural living space is.
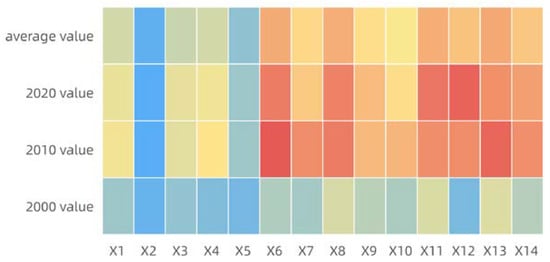
Figure 6.
Thermal diagram of q value contribution of spatial evolution of rural living space in Beijing from 2000 to 2020. (The darker the color of the square in the figure, the higher the explanatory power of the influence factor q value).
In terms of rural ecological space, among the average q values of rural ecological space differentiation in Beijing from 2000 to 2020, the top driving factors were X1 (DEM), X4 (temperature), X11 (total population), X14 (public financial expenditure), X12 (rural employees), as shown in Figure 7. As the natural background of rural ecological space, natural environmental factors ranked in the top three of the contribution values of digital elevation drivers from 2000 to 2020, highlighting the leading role of rural ecological space differentiation. In addition, the role of public financial expenditure drivers in the evolution of rural ecological space in Beijing has been strengthened, and the contribution value ranked second in 2020. It can be seen that the policy institutional environment has gradually become an important factor, leading to the evolution of rural ecological space along with high-quality economic development.
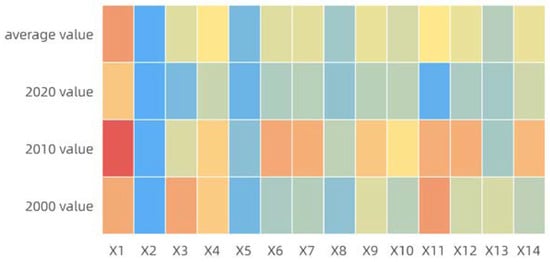
Figure 7.
Thermal diagram of q value contribution of spatial evolution of rural ecological space in Beijing from 2000 to 2020. (The darker the color of the square in the figure, the higher the explanatory power of the influence factor q value).
3.2.2. Interaction Analysis
From 2000 to 2020, the interaction between the driving factors of the rural PEL space in Beijing was stronger than the interaction within the single factor, and the mode of action was double factor enhancement and nonlinear enhancement. The interaction between natural factors and social and economic factors in Beijing is the key driving force for the formation of the spatial evolution mechanism of rural PEL space. As shown in Table 5, the population distribution and digital elevation, annual average precipitation and urbanization level, public financial expenditure, and the overall driving force of agricultural mechanization has a relatively strong impact on rural production space, which indicates that population factors, natural environmental factors, and urbanization level have a synergistic effect on the spatial pattern of rural production in Beijing, which is reflected in the government’s policy preference and financial transfer payment for rural production space. The interactive factors that have strong explanatory power for the formation of rural living space include the level of urbanization and terrain slope, the number of traffic roads, and rural employees, indicating that the continuous improvement of transportation infrastructure such as roads has enhanced the mobility of means of production and factors between urban and rural areas in the region, and improved the concentration of rural living space. The interaction between digital elevation and population distribution, annual average precipitation and digital elevation in rural ecological space is relatively profound, which shows that the interaction between population factors, policy and institutional environment, public financial expenditure of the whole society, topography, precipitation, and other natural factors has significantly enhanced the synergy of rural ecological space. The construction of sustainable civilization in Beijing has accelerated the regional carbon water cycle with the change in precipitation, temperature, and other natural factors. It has a significant impact on the transformation of rural ecological spatial patterns.
Table 5.
Interaction results of spatial drivers of rural PEL space in Beijing.
3.3. Multi-Scenario Simulation Results
3.3.1. Model Parameter Optimization and Simulation Experiment
To improve the simulation accuracy, different diffusion parameters are set in this study; α: Carry out comparative tests with the conversion threshold T, compare the ANN-CA simulation results under different parameters, and select the one with the highest accuracy as the model parameter for the next step of 2030 Beijing rural PEL spatial evolution simulation. As shown in Table 6, the specific experimental results are shown in the table. Through test comparison, when diffusion parameters α, set it to 1, and the conversion threshold T is set to 0.7. The Kappa coefficient is the highest and the simulation effect is the most ideal. In 2020, the overall simulation accuracy of all kinds of land and space simulation data in Beijing will reach 87.36%, the Kappa coefficient will be 80.60%, and Kappa > 0.75 indicates that the simulation data is consistent with the actual data, the simulation effect is ideal, and the reliability is high. Compared with the actual data of Beijing in 2020, the overall changes are similar as shown in Table 7.
Table 6.
Comparison of experimental results of ANN-CA model parameter optimization.
Table 7.
Simulation and actual comparison of the number of land spatial cells in Beijing in 2020.
3.3.2. Analysis of Simulation Results in Multiple Scenarios
Based on the spatial evolution rules of Beijing’s land extracted from the model, restrictions such as food security and ecological priority were added to the urban and rural spatial simulation of Beijing in 2030, and the corresponding land spatial area data of three spatial development simulation scenarios were obtained, as shown in Table 8 and Figure 8. Under the inertial development scenario, the scale area of rural production space in Beijing will be 2980.80 km2 in 2030, the scale of rural living space is 833.61 km2, and the scale of rural ecological space is 8564.24 km2. Among them, green ecological space, blue ecological space, and potential ecological space account for 96%, 3%, and 1%, respectively. Compared with 2020, the area of rural production space and rural living space decreased significantly by 21.50% and 25.97%, respectively. The change in rural ecological space was small but also decreased by 2.20%. Under the scenario of food security, the scale of rural production space in Beijing will be 3798.04 km2 in 2030, the scale of rural living space is 827.87 km2 and the scale of rural ecological space is 7791.83 km2. Among them, green ecological space, blue ecological space, and potential ecological space account for 97%, 2%, and 1%, respectively. Compared with 2020, the rural production space basically maintains its volume, with a small increase of 0.96 km2. The goal of protecting arable land and ensuring food security has been achieved. Compared with the area of rural ecological space in 2020, the area of rural living space has decreased to a certain extent by 26.48% and 11.01%, respectively. Under the scenario of harmonious development, the scale area of rural production space in Beijing will be 3798.13 km2 in 2030, the scale of rural living space is 1008.67 km2 and the scale of rural ecological space is 8756.72 km2. Among them, green ecological space, blue ecological space, and potential ecological space account for 96%, 3%, and 1%, respectively. Compared with 2020, the rural production space basically maintains its volume, with a small increase of 1.05 km2. The area of rural living space has decreased by 117.41 km2 compared with 2020. The overall amount of rural ecological space remained stable, with a small increase of 0.2 km2. To sum up, the simulated urban and rural PEL space size and area in Beijing under different scenarios basically meet the target setting conditions, and the simulation effect is relatively ideal.
Table 8.
Spatial simulation area of rural PEL space in Beijing under multiple scenarios.
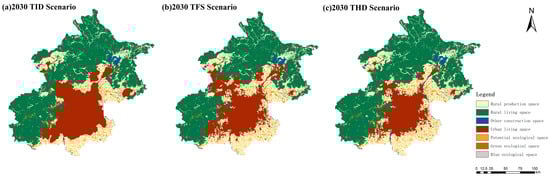
Figure 8.
TID, TFS, and THD scenario simulation results.
4. Discussion
It is very important for regional environment production and land space optimization to accurately grasp the evolution and spatial differentiation mechanism of land use transformation. In this study, the land use dynamic degree and land use transfer matrix method were used to measure and found that the rural production space in Beijing continued to decrease from 2000 to 2020, the rural living space continued to increase first and then gradually contracted, and the overall rural ecological space also showed a downward trend. In terms of mutual transformation of spatial types, the total length of rural production space transferred out in Beijing from 2000 to 2020 was 1755.72 km2, the largest number of land transferred out of all space types. The main destinations are rural living space, green ecological space, and urban living space. The expansion of rural production space is mainly realized through rural ecological space and rural living space; 284.12 km2 of rural living space transferred out. Most of them are transformed into rural living space, green ecological space, and urban living space. The expansion of rural living space is mainly realized through rural ecological space and rural production space; the total transfer out of blue ecological space in rural ecological space is 230.57 km2; the main destination is rural production space and green ecological space. The main destination of green ecological space is rural living space and rural production space; the main power sources of potential ecological space expansion are rural production space, green ecological space, and blue ecological space. In terms of spatial pattern and expansion direction, the evolution of land space in Beijing from 2000 to 2020 was affected by such factors as the natural environment, social and economic development, and location conditions. As a whole, urban living space occupied the core of Beijing, while other types of space were distributed in circles, showing the spatial pattern characteristics of the “core zone buffer zone edge layer”. From the perspective of the overall characteristics of the spatial distribution of rural PEL space in Beijing and the change of its spatial movement direction, the overall change of the spatial pattern of rural production is not significant, and the spatial distribution is characterized by northeast–southwest, and it is significantly expanded along the Y axis, that is, east by south. The overall standard deviation ellipse of rural ecological space shows a significant trend of shifting to the west and north, and the standard deviation of the Y axis is significantly higher than the standard deviation of the X axis, indicating that rural ecological space is increasingly concentrated, the concentration of ecological space in the region is enhanced, and the change track moves from southeast to northwest; the concentration trend of rural living space is not obvious, the intensive use of land is not high, and the rural living space is moving towards the northwest.
Different studies show that human activities are the main driving factors leading to changes in rural spatial functions, which are mainly determined by correlation analysis or qualitative and semi-quantitative methods. Therefore, the research on the driving mechanism of rural spatial evolution using quantitative methods is relatively limited. This study quantitatively analyzed the formation and evolution of the spatial pattern of rural PEL space in Beijing by using geographical detectors and found that the spatial pattern was significantly different due to the influence of the regional physical geographical basis and the development of human society and economy. The main driving factors of rural production space include urbanization rate, rural per capita income, total population, public financial expenditure, and primary industry output value. In the second stage of development, the rural production space is accompanied by the growth of the regional GDP. The deep drive is that the country has improved the situation that the rural production space is relatively weak in the competition with the urban and rural construction land market through fiscal transfer payment. The influence of spatial differentiation of rural living space evolution is dominated by socioeconomic factors, mainly the spatial evolution brought by urbanization and population factors, which have far-reaching radiation and greater impact on rural living space. Natural factors, such as geomorphic factors and climate factors, have outstanding contributions to rural ecological space. The policy institutional environment, accompanied by high-quality economic development, has gradually become an important factor leading to the evolution of rural ecological space. From 2000 to 2020, the interaction between two driving factors of the rural PEL space in Beijing was stronger than the interaction within a single factor, and the main mode of action was dual factor enhancement and nonlinear enhancement.
Traditional qualitative analysis methods are often used in rural space research methods to carry out village-scale research, while research combining emerging artificial intelligence analysis methods in rural large-scale space research is relatively weak. This study attempts to explore the application of theories and methods related to land use conflict and scenario simulation in rural space optimization research, intending to strengthen the systematic understanding of the importance of interaction between different rural space elements. The research adopts the geographic simulation optimization system GeoSOS software proposed by Professor Li Xia’s team and uses the ANN-CA model to build the spatial evolution model of Beijing’s rural PEL space, and carries out the CA simulation process based on the artificial neural network method. The 2020 simulation data output from the land use change rules in the study area based on the actual data extraction from 2000 to 2010 are consistent with the actual data, and the Kappa coefficient precision is high, which indicates that it is feasible to use the artificial neural network method to extract the change rules of different types of land and space in Beijing under the background of urban–rural integration, and apply the proposed rules to the subsequent simulation and prediction of the spatial evolution of rural PEL space. The ANN-CA model in the GeoSOS software of the geographical simulation and optimization system can be better used for the spatial evolution simulation and reconstruction prediction of rural PEL space; under the scenarios of inertial development, food security, and harmonious development, the spatial distribution pattern of land in 2030 is different when using the cost matrix of scenario simulation to limit the space conversion rules. The simulated urban and rural PEL spatial scale area in Beijing under different scenarios conforms to the target setting, and the simulation effect is relatively ideal.
Although this article uses 25 land use attribute classifications with a spatial resolution of 30 m × 30 m, the data have made a consistent discussion on the evolution characteristics, evolution mechanism, spatial simulation, and scenario optimization of the spatial pattern, which has greatly improved the accuracy of the current rural space research in a large space range. However, based on deepening the theory of multi-function of land use, the division of spatial leading functions mainly refers to the hierarchical discrimination of functional zoning and the induction and merger of land use types. There is a lack of a technical system to implement quantitative identification of space. Future research can strengthen the combination of qualitative and quantitative identification of rural spatial leading functions and build a more scientific spatial classification system. In addition, the ANN-CA model in the geographic simulation optimization system GeoSOS software is used in this study. Compared with the traditional natural recursive rules, the accuracy of the simulation of land spatial evolution is improved to a certain extent, but the model operation is still based on static conversion rules. Future research can explore the realization of dynamic conversion rules, and directly modify relevant parameters using system dynamics, such as combining the population growth rate, GDP growth rate, and other parameters to infer the land demand, and then set the population growth rate in different scenarios to improve the simulation accuracy.
5. Conclusions
Based on the remote sensing monitoring data of land use in Beijing in 2000, 2010, and 2020, DEM elevation, regional social and economic data, and other data, the spatial evolution, and multi-scenario simulation of the rural PEL space in Beijing were studied. The main conclusions are as follows:
- (1)
- In terms of the total space scale and area, the rural production space in Beijing continued to decrease from 2000 to 2020, the rural living space continued to increase first and then gradually contracted, and the overall rural ecological space also showed a downward trend.
- (2)
- In terms of spatial pattern and expansion direction, the overall evolution of Beijing’s land space from 2000 to 2020 shows the spatial pattern characteristics of the “core zone buffer zone edge layer”. The periphery of the urban built-up area is mainly composed of rural living space, rural production space, and rural ecological space. The spatial pattern of rural production has not changed much in general, and its spatial distribution is characterized by a northeast–southwest trend; the rural ecological space is gathering day by day, the regional ecological space concentration is enhanced, and the changing track is moving from southeast to northwest; the concentration trend of rural living space is not obvious, the intensive use of land is not high, and the rural living space is moving towards the northwest.
- (3)
- The formation and evolution of the spatial pattern of PEL space in Beijing’s rural areas are influenced by the regional physical geographical basis and the development of human society and economy. The main driving factors of rural production space are urbanization rate, rural per capita income, total population, public financial expenditure, and primary industry output value. The spatial differentiation of village living space evolution is mainly caused by urbanization and population factors. The policy institutional environment, accompanied by high-quality economic development, has gradually become an important factor leading to the evolution of rural ecological space.
- (4)
- The 2020 simulation data output from the land-use change rules in the study area based on the actual data extracted from 2000–2010 is consistent with the actual data, which indicates that it has strong applicability in this area and can predict the future spatial pattern of land use in all districts and counties in Beijing. Under the inertial development scenario, food security scenario, and harmonious development scenario, the spatial distribution pattern of land in 2030 is significantly different. The spatial performance under the harmonious development scenario is more compact, and the simulated spatial scenario is more relevant to the development goals under the background of Beijing’s ecological civilization construction and rural revitalization strategy.
Author Contributions
Conceptualization, H.Y. and S.D.; methodology, H.Y.; software, H.Y.; investigation, H.Y.; resources, J.C.; data curation, J.C.; writing—original draft preparation, H.Y.; writing—review and editing, H.Y.; visualization, H.Y. and J.C.; supervision, J.Z.; project administration, S.D.; Article modification, J.Z.; funding acquisition, J.Z. All authors have read and agreed to the published version of the manuscript.
Funding
This research was funded by NSFC, grant number 41771187.
Institutional Review Board Statement
Not applicable.
Informed Consent Statement
Not applicable.
Data Availability Statement
Not applicable.
Conflicts of Interest
The authors declare no conflict of interest.
References
- Han, D.; Qiao, J.; Zhu, Q. Rural-Spatial Restructuring Promoted by Land-Use Transitions: A Case Study of Zhulin Town in Central China. Land 2021, 10, 234. [Google Scholar] [CrossRef]
- Jin, L.; Wen, Z.; Fan, J.; Du, Z. Theoretical research progress and theoretical framework construction of rural spatial reconstruction. Trop. Geogr. 2020, 40, 765–774. [Google Scholar]
- Tao, Y. Research on the Reconstruction of Rural Social Space in Tourist Destinations Based on Social Network Analysis—Taking the “Beautiful Village” in Shi’ao, Nanjing as an Example. Geogr. Sci. 2020, 40, 1522–1531. [Google Scholar]
- Qiao, J.; Crang, M.; Hong, L.; Li, X. Exploring the Benefits of Small Catchments on Rural Spatial Governance in Wuling Mountain Area, China. Sustainability 2021, 13, 760. [Google Scholar] [CrossRef]
- Yang, R.; Xu, Q.; Zhou, J.; Chen, Y. Analysis of the spatial transformation mechanism of Fengjian Village based on the actor network theory. Geogr. Sci. 2018, 38, 1817–1827. [Google Scholar]
- Yang, J.; Ma, H.; Weng, L. Transformation of Rural Space under the Impact of Tourism: The Case of Xiamen, China. Land 2022, 11, 928. [Google Scholar] [CrossRef]
- Zhang, X.; Pan, M. Emerging rural spatial restructuring regimes in China: A tale of three transitional villages in the urban fringe. J. Rural. Stud. 2020, 93, 287–300. [Google Scholar] [CrossRef]
- Yang, X.; Yang, Z.; Zhu, Y. Functional transformation and spatial reconstruction of rural settlements in world heritage sites—Taking Tangkou, Zhaixi and Shancha as examples. Geogr. Res. 2020, 39, 2214–2232. [Google Scholar]
- Deng, H.; Li, J.; Meng, Q.; Wei, C. Research on the Reconstruction of Rural Space in Metropolitan Fringe Areas under the Turn of Tourism. Planner 2018, 34, 95–99. [Google Scholar]
- Liu, J.; Xi, R.; Liu, D.; Zhao, L.; Wang, W. Research on spatial distribution characteristics and optimization model of rural settlements based on GIS—Taking Nong’an County, Jilin Province as an example. Soil Bull. 2020, 51, 816–823. [Google Scholar]
- Qu, L.; Li, Y.; Liu, Y. Research on the optimization of rural settlement layout based on the “object field” model of village space. Econ. Geogr. 2019, 39, 174–181. [Google Scholar]
- Yao, J.; Ma, X. Research on the Reconstruction of the Multi value Space of Post Productive Countryside—Empirical Analysis Based on Mashan Town, Wuxi. Hum. Geogr. 2019, 34, 135–142. [Google Scholar]
- Long, H.; Ge, J.; Wang, J. Research progress and prospect on the coupling of land use transformation and rural transformation development. J. Geogr. 2019, 74, 2547–2559. [Google Scholar]
- Li, Z.; Liu, J. Transformation Characteristics and Growth Mechanism of Typical Agricultural Villages in the South Hebei Plain. J. Geogr. 2021, 76, 939–954. [Google Scholar]
- Ge, J.; Sun, P.; Zhou, G.; Lu, X. Grain production transformation mechanism and its security effect in traditional agricultural areas—Based on the perspective of rural spatial governance. J. Nat. Resour. 2021, 36, 1588–1601. [Google Scholar]
- Gao, J.; Wang, L.; Huang, Q. Rural Transformation and Sustainable Development Path of Border Tourist Destinations—Ethnographic Study of Daluo Port Area in Yunnan. Geogr. Res. 2020, 39, 2233–2248. [Google Scholar]
- Tu, S.; Zheng, Y.; Long, H.; Wan, S.; Liang, X.; Wang, W. Rural Development and Reconstruction Pattern Characteristics and Revitalization Path—Taking Guangxi as an Example. J. Geogr. 2020, 75, 365–381. [Google Scholar]
- Wang, Y.; Zhao, X.; Zuo, L.; Zhang, Z.; Wang, X.; Yi, L.; Liu, F.; Xu, J. Spatial Differentiation of Land Use and Landscape Pattern Changes in the Beijing–Tianjin–Hebei Area. Sustainability 2020, 12, 3040. [Google Scholar] [CrossRef]
- Xu, Y.; Li, P.; Pan, J.; Zhang, Y.; Dang, X.; Cao, X.; Cui, J.; Yang, Z. Eco-Environmental Effects and Spatial Heterogeneity of “Production-Ecology-Living” Land Use Transformation: A Case Study for Ningxia, China. Sustainability 2022, 14, 9659. [Google Scholar] [CrossRef]
- Wu, A. Classification evaluation and pattern evolution of the “three living spaces” in Beijing Tianjin Hebei region. China’s Agric. Resour. Reg. 2019, 40, 237–242. [Google Scholar]
- Li, M.; Yun, Y.; Chen, W.; Ma, Y.; Guo, R. Analysis of the Classification and Spatial and Temporal Pattern of the “Three Life Space” in Henan Province. China Agric. Resour. Zoning 2018, 39, 13–20. [Google Scholar]
- Sun, L.; Wang, J. Research on the classification and function evaluation of rural “three living spaces” in Wuhan from the perspective of spatial planning. Mod. City Res. 2020, 7, 9–16. [Google Scholar]
- Liao, G.; He, P.; Gao, X.; Lin, Z.; Huang, C.; Zhou, W.; Deng, O.; Xu, C.; Deng, L. Land use optimization of rural production–living–ecological space at different scales based on the BP–ANN and CLUE–S models. Ecol. Indic. 2022, 137, 108710. [Google Scholar] [CrossRef]
- Wang, Y.; Wang, L.; Qi, P.; Liu, Z. The dominant factors in the identification of Chongqing’s main functional areas and the constraint mechanism of spatial stability. J. Geogr. 2019, 74, 44–62. [Google Scholar]
- Xiong, Y.; Huang, L.; Zou, F.; Zhao, D.; Tang, Y. Multi functional spatial differentiation characteristics and types of rural areas based on the county scale-taking Hunan Province as an example. Econ. Geogr. 2021, 41, 162–170. [Google Scholar]
- Li, G.; Fang, C. Quantitative identification and analysis of urban ecological production living space functions. J. Geogr. 2016, 71, 49–65. [Google Scholar]
- Zhao, H.; Wei, J.; Sun, D.; Liu, Y.; Wang, S.; Tan, J.; Miao, C. Spatial identification and spatio-temporal evolution analysis of “production life ecology” based on random forest model—Taking Zhengzhou City as an example. Geogr. Res. 2021, 40, 945–957. [Google Scholar]
- Zhao, T.; Cheng, Y.; Fan, Y.; Fan, X. Functional Tradeoffs and Feature Recognition of Rural Production–Living–Ecological Spaces. Land 2022, 11, 1103. [Google Scholar] [CrossRef]
- Zeng, P.; Wu, S.; Sun, Z.; Zhu, Y.; Chen, Y.; Qiao, Z.; Cai, L. Does Rural Production–Living–Ecological Spaces Have a Preference for Regional Endowments? A Case of Beijing-Tianjin-Hebei, China. Land 2021, 10, 1265. [Google Scholar] [CrossRef]
- Xie, Z.; Dong, Y. Evolution and prospect of research on optimal allocation of urban land in China. Econ. Geogr. 2011, 31, 1364–1369. [Google Scholar]
- Zhao, R.; Liu, X. Study on the Spatial and Temporal Pattern Evolution of “Three Lives” in Beijing Tianjin Hebei Metropolitan Circle and Its Driving Forces. Ecol. Econ. 2021, 37, 201–208. [Google Scholar]
- Nie, W.; Xu, B.; Ma, S.; Yang, F.; Shi, Y.; Liu, B.; Hao, N.; Wu, R.; Lin, W.; Bao, Z. Coupling an Ecological Network with Multi-Scenario Land Use Simulation: An Ecological Spatial Constraint Approach. Remote Sens. 2022, 14, 6099. [Google Scholar] [CrossRef]
- Lai, Z.; Chen, C.; Chen, J.; Wu, Z.; Wang, F.; Li, S. Multi-Scenario Simulation of Land-Use Change and Delineation of Urban Growth Boundaries in County Area: A Case Study of Xinxing County, Guangdong Province. Land 2022, 11, 1598. [Google Scholar] [CrossRef]
- Liao, J.; Tang, L.; Shao, G. Multi-Scenario Simulation to Predict Ecological Risk Posed by Urban Sprawl with Spontaneous Growth: A Case Study of Quanzhou. Int. J. Environ. Res. Public Health 2022, 19, 15358. [Google Scholar] [CrossRef]
- Wen, Z.; Yang, G.; Han, Z.; Lu, L. Optimization of the land use pattern in Horqin Sandy Land by using the CLUMondo model and Bayesian belief network. Sci. Total Environ. 2020, 739, 139929. [Google Scholar]
- Gao, L.; Tao, F.; Liu, R.; Wang, Z.; Leng, H.; Zhou, T. Multi-scenario simulation and ecological risk analysis of land use based on the PLUS model: A case study of Nanjing. Sustain. Cities Soc. 2022, 85, 104055. [Google Scholar] [CrossRef]
- Huo, J.; Shi, Z.; Zhu, W.; Xue, H.; Chen, X. A Multi-Scenario Simulation and Optimization of Land Use with a Markov–FLUS Coupling Model: A Case Study in Xiong’an New Area, China. Sustainability 2022, 14, 2425. [Google Scholar] [CrossRef]
- Zhou, S.; Gu, A.; Tong, Q.; Guo, Y.; Wei, X. Multi-scenario simulation on reducing CO2 emissions from China’s major manufacturing industries targeting 2060. J. Ind. Ecol. 2021, 26, 850–861. [Google Scholar] [CrossRef]
- Chen, Y. On the urban-rural ecotone and its characteristics and functions. Econ. Geogr. 1996, 16, 27–31. [Google Scholar]
- Luo, Y.; Zhou, C. Review and prospect of research on urban and rural fringe areas in China. Res. Urban Dev. 2005, 1, 25–30. [Google Scholar]
- Yang, Q.; Duan, X.; Wang, L.; Jin, Z. Land use transformation and ecological environment effect based on “three living spaces”—Taking the core area of the Yangtze River Delta as an example. Geogr. Sci. 2018, 38, 97–106. [Google Scholar]
- Zou, L.; Wang, J.; Hu, X. Theoretical construction and empirical analysis of China’s county-level “three generation land” classification system. China Land Sci. 2018, 32, 59–66. [Google Scholar]
- Liu, J.; Liu, W.; Kuang, W.; Ning, J. Remote sensing analysis of the spatio-temporal characteristics of China’s urban and rural construction land expansion based on the planning of main functional areas. J. Geogr. 2016, 71, 355–369. [Google Scholar]
- Ma, X.; Han, S.; Wang, L.; Wang, J.; Xu, X. Spatial and temporal evolution analysis of land use types in Xi’an region. Geogr. Arid. Areas 2020, 43, 499–507. [Google Scholar]
- Wei, S.; Lu, R.; Lin, X.; Pang, X.; Qin, Q. Study on the Evolution and Mechanism of the Territorial Spatial Pattern of Guangxi Land Border Zone. China Land Sci. 2021, 35, 98–108. [Google Scholar]
- Wang, J.; Xu, C. Geographic detector: Principles and prospects. J. Geogr. 2017, 72, 116–134. [Google Scholar]
- Chen, Y.; Li, X.; Liu, X.; Li, S. Early warning of farmland reserves based on the coupled geographic simulation optimization system GeoSOS. J. Geogr. 2010, 65, 1137–1145. [Google Scholar]


Disclaimer/Publisher’s Note: The statements, opinions and data contained in all publications are solely those of the individual author(s) and contributor(s) and not of MDPI and/or the editor(s). MDPI and/or the editor(s) disclaim responsibility for any injury to people or property resulting from any ideas, methods, instructions or products referred to in the content. |
© 2023 by the authors. Licensee MDPI, Basel, Switzerland. This article is an open access article distributed under the terms and conditions of the Creative Commons Attribution (CC BY) license (https://creativecommons.org/licenses/by/4.0/).