Article

Smart and Automated Infrastructure Management: A Deep Learning Approach for Crack Detection in Bridge Images

1
College of Electrical and Mechanical Engineering, National University of Sciences and Technology, Rawalpindi 44000, Pakistan
2
School of Surveying and Built Environment, University of Southern Queensland, Springfield, QLD 4300, Australia
*
Authors to whom correspondence should be addressed.
Sustainability 2023, 15(3), 1866; https://doi.org/10.3390/su15031866
Submission received: 26 October 2022 / Revised: 11 January 2023 / Accepted: 13 January 2023 / Published: 18 January 2023

Abstract

:
Artificial Intelligence (AI) and allied disruptive technologies have revolutionized the scientific world. However, civil engineering, in general, and infrastructure management, in particular, are lagging behind the technology adoption curves. Crack identification and assessment are important indicators to assess and evaluate the structural health of critical city infrastructures such as bridges. Historically, such critical infrastructure has been monitored through manual visual inspection. This process is costly, time-consuming, and prone to errors as it relies on the inspector’s knowledge and the gadgets’ precision. To save time and cost, automatic crack and damage detection in bridges and similar infrastructure is required to ensure its efficacy and reliability. However, an automated and reliable system does not exist, particularly in developing countries, presenting a gap targeted in this study. Accordingly, we proposed a two-phased deep learning-based framework for smart infrastructure management to assess the conditions of bridges in developing countries. In the first part of the study, we detected cracks in bridges using the dataset from Pakistan and the online-accessible SDNET2018 dataset. You only look once version 5 (YOLOv5) has been used to locate and classify cracks in the dataset images. To determine the main indicators (precision, recall, and mAP (0.5)), we applied each of the YOLOv5 s, m, and l models to the dataset using a ratio of 7:2:1 for training, validation, and testing, respectively. The mAP (Mean average precision) values of all the models were compared to evaluate their performance. The results show mAP values for the test set of the YOLOv5 s, m, and l as 97.8%, 99.3%, and 99.1%, respectively, indicating the superior performance of the YOLOv5 m model compared to the two counterparts. In the second portion of the study, segmentation of the crack is carried out using the U-Net model to acquire their exact pixels. Using the segmentation mask allocated to the attribute extractor, the pixel’s width, height, and area are measured and visualized on scatter plots and Boxplots to segregate different cracks. Furthermore, the segmentation part validated the output of the proposed YOLOv5 models. This study not only located and classified the cracks based on their severity level, but also segmented the crack pixels and measured their width, height, and area per pixel under different lighting conditions. It is one of the few studies targeting low-cost health assessment and damage detection in bridges of developing countries that otherwise struggle with regular maintenance and rehabilitation of such critical infrastructure. The proposed model can be used by local infrastructure monitoring and rehabilitation authorities for regular condition and health assessment of the bridges and similar infrastructure to move towards a smarter and automated damage assessment system.

1. Introduction

In this modern era of transportation, where flyovers, bridges, and underpasses are common features of almost all cities, there is a need for a compelling monitoring and management system to assess the health of critical city infrastructure. Any damage to these structures, particularly bridges, may reduce their lives and induce the risk of collapse that can cause economic and physical damage [1]. Therefore, it is imperative to have stronger and safer bridges to minimize the financial losses in associated rehabilitations and save human lives that may be lost to pertinent disasters. Over time, these bridges can develop cracks due to aging, weathering, and improper loading. Identification of such cracks is crucial for determining the health of the bridges.
Millions of dollars are spent annually on special equipment and hiring human visual inspectors to discover cracks in civil infrastructures such as roads, bridges, and buildings [2]. However, these methods are costly, time-consuming, and prone to errors. Many researchers have tried to automate these manual, time-consuming methods to ensure accurate and reliable damage assessment and evaluation. Techniques such as image processing [3], computer vision [4], and classical machine learning [5] have been tested and leveraged; however, these methods have their limitations [2,6]. Further, most, if not all, of these studies have been conducted in developed countries that do not have budget constraints. Such studies have rarely been conducted in developing countries that constantly struggle with meeting their economic needs.
Recently AI-powered disruptive technologies [7], deep learning-based convolutional neural networks (CNN) [8,9], and other object detection techniques have been used for crack detection [10]. For example, Chen et al. [11] used CNNs for multi-category damage detection and recognition of reinforced concrete bridges using test images in China. Similarly, Li et al. [12] used drones and Faster regions with CNNs (Faster-RCNN) to detect cracks in bridges. Some common issues with CNN-based crack detection techniques include high training parameters and complicated network architectures [13]. Object detection methods are investigated to solve these issues [14]. One-stage and two-stage are the two common types of object detection models. The one-stage models have a single-shot multibox detector (SSD) [15] and a series of You only look once (YOLO) [16]. Two-stage models include Faster-RCNN [17] and spatial pyramid pooling network (SPP-NET) [18]. The object regions detection network is trained following the region proposal network (RPN) training in a two-stage model training procedure [19]. The two-stage model has a high degree of precision but a lower speed.
In comparison, initial anchors are utilized in a one-stage model to predict the class and locate the object’s area to complete the detection process without employing RPN and achieve end-to-end object detection. These one-stage models offer high speed but low precision. Overall, the main issues with object detection are the algorithms’ accuracy and speed [20]. A critical technical challenge in this context is balancing the detection’s efficiency and accuracy.
With the recent introduction of the YOLOv5, a sophisticated architecture, object detection challenges are minimized due to its high detection accuracy and inference speed [21]. Accordingly, in this research, we used the YOLOv5. The corresponding architecture comprises the backbone, the neck, and the head. The model uses Cross Stage Partial Networks (CSPNET) as the backbone to extract the vital feature from an input image. Next, a path aggregation network (PANet) generates the feature pyramids. Feature pyramids help the models to generalize unseen data with more precision. The final detecting step is carried out using the model head. It uses anchor boxes on the features and produces final output vectors that include bounding boxes, objectness scores, and class probabilities. YOLOv5 has four models or variants: YOLOv5s, YOLOv5m, YOLOv5l, and YOLOv5x.

1.1. Motivation and Research Gap

Historically, critical city infrastructures such as bridges have been monitored through manual visual inspection, which needs human access to these areas and costly high-tech gadgets. Access may be restricted due to poor weather, congested traffic, lack of skilled human resources, special equipment, hard terrains, and other physical constraints [22]. Further, this manual assessment method relies on the knowledge of human experts, so it is prone to errors and manipulation. This process is costly, time-consuming, and inconsistent due to the involvement of multiple parameters [23]. Furthermore, during the inspection, traffic is blocked for many hours, causing disruptions to travel plans, emergency responses, and other service providers. Therefore, civil infrastructure monitoring and assessment must be automated to ensure swift, accurate, and reliable service provision capable of detecting structural damage and avoiding potential disasters. However, such systems rarely exist, and their absence is particularly evident in developing countries. The lack of such automated systems results in undetected cracks and damage to critical city infrastructure, which are only uncovered after tragic incidents with financial and health implications.
Another key reason for selecting the current study topic is the lack of such research in developing countries. For example, a key concern in developing countries, such as Pakistan, is the deteriorating condition of its critical city infrastructure, such as bridges [24]. The poor bridge conditions lead to financial and economic problems and loss of human lives, in addition to traffic problems and accidents. This is evident from multiple critical bridges collapsing in the last two decades, resulting in several casualties and putting a financial burden on the country’s strained economy. Accordingly, a research gap is presented whereby such a system should be developed for developing economies. This gap is humbly targeted in the current study, where a developing country (Pakistan) is used as a case study for developing a smart and automated system for infrastructure management.
It is imperative to have stronger and safer bridges to avoid the loss of finances in associated rehabilitations and human lives that may be lost to collapse-related disasters. These aims align with modern smart city initiatives where more smart, sustainable, and resilient infrastructure is at the forefront of such smart cities.

1.2. Reasons for Selecting Pakistan as a Case Study

Pakistan has seen regular disasters in the form of bridge collapses due to poor construction quality and monitoring, and irregular maintenance schedules. Such collapses have burdened the struggling economy and resulted in the loss of human lives. Many bridges have collapsed over the last two decades in Pakistan, causing many casualties [25]. Table 1 shows the location, year, and casualties caused by bridge collapses in Pakistan in the last two decades.
As evident from Table 1, Pakistan has seen regular bridge collapse-related disasters and must move towards an automated monitoring system that helps minimize, if not eliminate, such deadly disasters. Accordingly, the current study is a humble effort to develop a smart, automated bridge crack monitoring system for developing countries like Pakistan. It will help local disaster prevention and infrastructure monitoring authorities take proactive actions and avoid potential disasters based on an accurate assessment of bridge structures.

1.3. Research Questions and Objectives

This study humbly investigated the following research questions:
  • What types of cracks are present in bridges and similar infrastructure in developing countries?
  • How can bridge cracks be differentiated from images based on their severity and segmented to calculate their width, height, and area?
  • How to develop and test a deep learning system to determine cracks in bridge images for developing countries?
Based on the research question, this study has the following objectives:
  • To detect and differentiate between bridge cracks from images with higher accuracy.
  • To locate, classify, and differentiate cracks based on their severity and segment them to calculate the width, height, and area.
  • To develop a deep learning-based approach for determining cracks in the images of bridges and infrastructure projects of developing countries.
The current study addresses the research gap by developing a holistic deep learning-based system that automates the process of crack and damage detection in bridges using images collected from developing countries. In line with the research questions and objectives, first, the types of cracks in bridge images of Pakistan (a developing country) are detected, identified, and differentiated based on their severity. Then, the cracks are segmented to calculate their width, height, and area. Finally, a holistic deep learning-based (using YOLOv5 models) model for determining cracks in the images of bridges and infrastructure projects of developing countries is proposed, tested, and validated using images of two case study bridges from Pakistan and the SDNET2018 dataset.

1.4. Novelty and Potential Contribution

There is a twofold novelty in this study. First is the lack of research on bridge crack detection in developing countries, and second is innovation in the study method. YOLOv5 is used in this study for crack detection, and U-Net is used for crack segmentation. Such a combination has not been reported so far for the same purposes in the reviewed literature. Accordingly, this study presents a novel approach to investigating the cracks in civil infrastructure, particularly bridges, based on a recently introduced deep learning model (YOLOv5). Such a holistic study has not been reported in the context of developing countries (especially Pakistan). Further, the technique (YOLOv5 s, m, l) adopted in this study, the sample size, and the types of cracks in case study areas are exclusive to this study, making it a nascent and novel approach for the holistic determination and assessment of cracks in bridge and infrastructure projects of developing countries.
This study is relevant to the national needs of Pakistan and other developing countries and humbly contributes to local development. It will help boost tourism by monitoring and improving the conditions of bridges in remote areas, where calling in a specialist inspector can be very expensive. The collected images can be remotely assessed, and corrective measures can be recommended. Similarly, in urban areas, it can help monitor the health of critical infrastructure such as bridges to avoid collapses, control associated economic losses, and save human lives. Further, it will help deal with emergencies, outline local bridges and road maps for victim evacuation, and prepare for natural disasters. Overall, this study humbly contributes to knowledge of critical city infrastructure such as bridges, city and regional planning, and structural health monitoring.

1.5. Organization of the Paper

The rest of the paper is organized as follows. Section 2 presents the pertinent literature on the topic under investigation. It explains different types of bridge cracks and image-processing methods for crack detection and segmentation, including classical and modern deep learning and machine learning methods. Section 3 presents the holistic method and associated steps adopted in this study. Section 4 presents the experiment design, associated measures, results of the study, and comparison of the results with existing methods. Finally, Section 5 concludes the study, presents the key takeaways, and outlines the limitations and future direction for expanding the current study.

2. Related Literature

Bridges are critical city infrastructures that play a significant role in society and a country’s economy [2]. They are constructed over rivers, valley roads, etc. Raw materials, everyday consumables, and manufactured items can be shipped to factories, suppliers, warehouses, distributors, retailers, and customers using bridges. Bridges also facilitate travel, allowing people to shop for goods and services within and outside their towns [22]. When a bridge is closed, the local economy either sputters to a standstill or slows significantly due to longer traveling routes and times, all adding to the end prices of the goods/services. Thus, bridges are important structures that need regular monitoring, maintenance, and rehabilitation to be serviceable and minimize damage to the economy and human lives (in case of collapse).

2.1. Types of Cracks in Bridges

Over time, different types of damage occur in bridges. The scope of this study is limited to cracks (as a type of damage) in bridges. Accordingly, the most common types of cracks are discussed below:
  • Load-induced cracks [32]: These are produced in concrete bridges when subjected to standard static, dynamic, and secondary pressures. There are two main types of load cracks: secondary stress cracks and direct stress cracks.
  • Temperature change-induced cracks [33]: Concrete exhibits thermal expansion and contraction in response to temperature changes. Temperature changes are generally a result of annual temperature variations, sunshine, sudden cool-off, heat hydration, etc. The concrete will deform when the structure’s internal or external temperature changes. The structures experience stress if the deformation is constrained. A temperature crack in concrete will appear when the applied stress exceeds its tensile strength. Temperature stress in some long-span bridges may approach or surpass the live load stress. Such temperature cracks are distinguished from other cracks primarily by their ability to grow or contract in response to changes in temperature.
  • Shrinkage-induced cracks [34]: These cracks are caused by concrete shrinkage. The two most common types of concrete shrinkage are plastic and dry. Other types include spontaneous and carbonization shrinkage.
  • Ground deformation-induced cracks [35]: A structure can experience additional stress due to the foundation’s unequal vertical settlement or horizontal displacement, which exceeds the tensile strength of the concrete and causes structural cracking. Some common causes of such uneven settlement include greater variations in soil/ground quality, enormous structural load variation or unequal distribution, varying types of foundations, melting or freezing of foundation/footings, varying foundation factors after bridge construction, etc. These reasons cause ground deformation that leads to cracks in bridges.
  • Steel corrosion-induced cracks [36]: Steel bars can be corroded due to oxidation. Carbon dioxide can carbonize the concrete’s protective layer on the steel bar’s surface because of the concrete’s poor quality or the inadequate thickness of the protective layer, reducing the concrete’s alkalinity around the steel bar. Another reason can be that the steel bars are surrounded by a high concentration of chloride ions due to chloride’s intervention. The rust and corrosion reactions are amplified by membrane damage, the iron ions in the steel bar, oxygen, and water entering the concrete. The volume of the rusted iron hydroxide is then about two to four times greater than the original, causing expansion stress on the surrounding concrete. This leads to the cracking and peeling of the concrete’s protective layer. As a result, the steel bars develop cracks along their longitudinal axis, and the concrete surface is gradually corroded.
  • Material quality-induced cracks [37]: Such cracks are caused due to the lower quality of construction materials such as cement, sand, aggregate, mixing of water, and admixtures.
  • Construction process-induced cracks [38]: A lower-quality construction, transportation, pouring, or hoisting process, inexperienced workforce, and poor on-site quality management can lead to vertical, horizontal, oblique, and other geometric distortions leading to the development of surface, deep, or penetrating cracks of variable width.

2.2. Image Processing Models for Detecting Cracks

Different optimization and deep learning models have been developed to address construction engineering problems such as crack detection and earth moving [39]. Researchers have utilized different methods of crack detection based on image processing techniques. Techniques such as extreme gradient boosting (XGBOOST), deep neural networks, and random forests have been used by various researchers in relevant studies [40]. Table 2 presents some of the relevant image processing models, data acquisition sources, and datasets, and their advantages and limitations are subsequently explained.

2.2.1. Image Filtering Techniques

The challenge of crack detection is further exacerbated by the highly textured surfaces of certain concrete materials. To address this problem, Salman et al. [41] presented an image processing-based method to identify multidirectional pavement cracks using a Gabor filter and attained 95% detection precision. A Gabor filter is a type of linear filter that examines the texture of a region to identify the existence of content with a particular frequency that is oriented in a specific direction. This method works very well to identify cracks in pavements with rich textures.
To detect the cracks in images, statistical techniques have also been used. Lins and Givigi [42] employed statistical filtering to detect cracks and determined their width and length using the particle filter as an image processing method. This filter is designed to monitor the objects in clutter. A vector represents the position of every object at a given time t. This approach records errors ranging from 7.51 to 8.59 percent. The total number of crack pixels identified is multiplied by the pixel’s resolution to calculate each crack’s length and width. The angle of the crack is determined by drawing a line between any of the two locations on the crack and applying rules of trigonometry.
Similarly, other image filtering techniques include a line filter developed by Fujita and Hamamoto [46]. A line filter is a multi-scale filter that uses a Hessian matrix and is applied to images to make cracks more noticeable. Multi-scale Hessian filtering is helpful for the improvement and segmentation of small cracks in 3D image data. A probabilistic relaxation approach is applied to the resulting image to find its cracks. Adaptive thresholds are used to increase crack detection’s precision. This system depicted an accuracy of 99.03% in the relevant study by Fujita and Hamamoto [46]. Likewise, Yeum and Dyke [47] used the Frangi filter along with an added median filter, the canny edge detector, and dilate operators to detect cracks in bridges. The system has a detection rate of 98.7%, demonstrating its effectiveness.

2.2.2. Beamlet Transform

Ying and Salari [44] proposed the Beamlet transform technique to identify and classify cracks in pavement images. A Beamlet is an arrangement of line segments at various scales, angles, and places. Using this technique, it is possible to extract linear features such as edges and lines from the images. It effectively identifies cracks, curvilinear features in the textured surface, and noisy images of pavements. The extracted parts of the crack are connected to create complete cracks that are classified into one of four categories: horizontal, vertical, transversal, and block cracks.

2.2.3. Shi-Tomasi Algorithm

Kong and Li [48] recorded videos of steel bridges and used the Shi-Tomasi algorithm for crack detection. In every frame of the video, different features caused by cracks opening and closing are observed. To detect cracks, the gaps in the surface movement of the parts of the bridge were identified in the video. The results demonstrated the robustness and effectiveness of this technique in different lighting conditions. A key limitation of this method is the increased dependency on the camera resolution, as the accuracy was reduced on low-resolution videos [45].

2.3. Classical Machine Learning Methods

Table 3 lists some relevant studies about classical machine learning for crack detection, classification models, data acquisition sources, and datasets, and their advantages and limitations are subsequently explained.

2.3.1. K-Means Clustering

K-means clustering is an example of an unsupervised learning algorithm. In contrast to supervised learning, this clustering does not use labeled data. Instead, it divides objects into k clusters based on similarities between them and differentiates them from objects in other groups. This algorithm has two main tasks; it uses an iterative technique to select the best value for the centroids and then allocate each data point to the nearest k-center. A cluster is formed by the data points close to the specific k-center. Oliveira and Correia [52] used a crack detection and classification method without manually labeling the dataset images. Eighty-four images of the road were captured using a digital camera to train the model. The combinations of the two Gaussian models and the K-means clustering method were evaluated to find cracks in the input images. The result showed that the mixture of the Gaussian model had the best F-Measure (93.5%) and the lowest error rate (0.6%). In addition, this method achieved a recall performance of 95.5%. The identified cracks are categorized as longitudinal, transverse, or other types. This is accomplished by evaluating the connecting elements of each crack and computing the skeleton of the crack. The width of the crack is calculated using the skeleton. The system’s poor accuracy in detecting small cracks (less than 2 mm width) is a key drawback.

2.3.2. Support Vector Machines (SVM)

Support Vector Machine (SVM) is an example of a supervised learning method. The SVM method aims to find a hyperplane in the N-dimensional space that distinctly categorizes data points. The number of features determines the hyperplane’s dimension. SVM has been used to detect road distress by Gavilan et al. [51]. A vehicle equipped with line scan cameras, laser beams, and the necessary hardware and software for scanning and storage was used to capture and process road images. A multiple directional non-minimum suppression (MDNMS) approach is used to detect cracks after image preprocessing. A linear SVM classifier is employed to distinguish between various pavements to choose the best parameters for detecting cracks. By adapting pavement-specific parameters, the crack-detecting algorithm performed better and achieved 98.29% precision and a recall of 93.86% in the relevant study by Gavilan et al. [51].

2.3.3. Random Structured Forests

A random forest comprises various independent decision trees that work together as an ensemble. Every tree in the random forest spits out a class forecast. The class that receives the most votes becomes the model’s prediction value. For such models, low correlations between the predictions of the individual trees are required. Further, there is a need for actual signals in the attributes so that models built using such attributes perform better than random guessing. Shi et al. [50] used random forests to address the issue of crack intensity heterogeneity in road images. Integral channel characteristics were used to locate cracks in the pictures. A random structured forest approach was then used to detect cracks. This technique can precisely identify arbitrary and complex cracks in images. Afterward, an SVM model is used to classify cracks according to their type. The method attained a precision score of 96.73% for crack classification.

2.4. Deep Learning Methods

Recently, there has been a significant increase in the utilization of deep learning models [53]. Alshboul et al. [54] used a hybrid mathematical and machine learning prediction approach to evaluate the impact of external support on green building construction costs. In another study, Alshboul et al. [55] used a machine learning-based model to predict the shear strength of slender reinforced concrete beams. Aslam et al. [56] used hybrid machine learning and data mining algorithms for water quality management. Bae et al. [57] used an end-to-end deep super-resolution crack network (SrcNet) to improve computer vision–based automated crack detection in bridges to address the issues of motion blur and lack of pixel resolution. The proposed SrcNet significantly enhanced crack detection using deep learning–based super-resolution image generation and automated crack detection. The model displayed 24% better crack detection using raw digital images. Table 4 lists some relevant studies about deep learning methods for crack detection, classification models, data acquisition sources and datasets, and their advantages and limitations. Some of these models are subsequently explained.

2.4.1. Convolutional Neural Network

CNN models combine a convolutional layer, a pooling layer, and a fully connected layer [81]. First, the convolutional layer differentiates between crack and non-crack images by extracting meaningful information from features in input images. The role of the pooling layer is twofold. First, it reduces the size of the input images and features by down-sampling them. Second, it enables the model to generate features invariant to scale and translation. Finally, a fully connected layer takes the output from the previous layer as input and maps it to an output label.
Cha et al. [63] proposed deep learning-based CNN for concrete crack detection. A total of 332 raw images were captured using a DSLR camera, out of which 227 images were cropped into 4k images with pixel resolutions of 256 × 256 to train the CNN. The remaining 55 images with a pixel resolution of 5888 × 3584 were used for testing purposes. The model achieved 98% accuracy. The trained CNN scanned the test images using a sliding window method, which allows it to scan images with resolutions higher than 256* 256 pixels, and a crack map was generated. Ali et al. [82] proposed a deep learning-based crack detection method in a concrete tunnel structure using multispectral dynamic imaging (MSX). The authors used 3600 MSX images (299 × 299 pixels) to train the modified deep inception neural network (DINN) and employed an additional 300 MSX images (299 × 299 pixels) for validation. The model achieved a training accuracy of 95.5% and a validation accuracy of 94% at 1600 iterations. Xu et al. [62] introduced an end-to-end CNN model based on Atrous Spatial Pyramid Pooling (ASPP) module and depth-wise separable convolution. A total of 2068 images of bridge cracks with a resolution of 1024 × 1024 were collected by Phantom 4 Pro’s Complementary Metal Oxide Semiconductor (CMOS) surface array camera. After data preprocessing and data augmentation on sub-images, 6069 images with a resolution of 224 × 224 were obtained. The model was trained with a total of 4856 images and tested on 1213 images. The model’s performance is compared with VGGNET and ResNet, where the ASPP model achieves a detection accuracy of 96.37%.
Qiao et al. [6] used deep CNN with the expected maximum attention (EMA) module to detect cracks using 400 images of different bridges, with a resolution of 4464 × 2976 pixels. These images were captured using a 5D Mark IV digital single-lens reflex camera (in Zhuhai, China) and supplemented with more than 800 crack images available publicly. As a deep network needs labeled images for supervised learning, so the collected images were carefully marked at the pixel level. For the damage feature extraction, the DenseNet was redesigned, and the EMA was added in the last polling layer to extract a more detailed feature map. A new loss function was adopted to train the network, which pays more attention to the connectivity of the damaged area. The performance of this network was compared with other models such as FCN, SegNet, DeepLab v3+, and SDDNet. The publicly available dataset had an MPA of 87.42%, MIoU of 92.59%, and precision of 81.97%. The bridge dataset had an MPA of 86.35%, MIoU of 79.87%, and a precision of 74.70%.

2.4.2. Region Proposal Networks

Region Proposal Network (RPN), a fully convolutional network, predicts the bounds of the object and objectness scores at each position simultaneously. To generate a region proposal of high quality, the RPN is trained in an end-to-end manner. Cha et al. [63] proposed Faster R-CNN as a type of RPN for detecting multiple cracks in real time. A database of 2366 images, each with a size of 500 × 375 pixels, labeled for five different types of damages (concrete crack, steel corrosion in two different degrees (medium and high), bolt corrosion, and steel delamination) was created. This database was used to train, validate, and test the Faster R-CNN. The results indicated average precision (AP) ratings of 90.6%, 83.4%, 82.1%, 98.1%, and 84.7% for the five types of damage, with mAP of 87.8%. To evaluate and demonstrate the robustness of Faster R-CNN, 11 new images of 6000 × 4000 pixels were used. One disadvantage is that a large data sample with a larger range of distance between the damage and the camera is necessary to increase accuracy and construct a strong network.

2.4.3. Fully Convolutional Network (FCN)

Yang et al. [60] proposed an FCN for crack detection at the pixel level. This network consists of up-sampling and down-sampling. Down-sampling uses several layers (convolutional, pooling, and dropout), while up-sampling consists of DE convolutional layers. This model detects objects at various scales. Eight hundred images with crack widths ranging from one to 100 pixels were collected to train the model. These were complemented with online crack images and existing buildings in the Hurbain chain to train the model. For crack segmentation, the model achieved accuracy, recall, and precision equal to 97.96%, 78.97%, and 81.73%, respectively.
Dung et al. [59] proposed a deep FCN for semantic segmentation on concrete images to detect cracks and determine their densities. VGG16 was used as a backbone for the FCN encoder due to its superior performance to ResNet and InceptionV3 in terms of classification of the crack images [83]. Five hundred annotated images from a publicly available concrete dataset were used to train the FCN encoder-decoder [59]. The system achieved an F1 score and average precision of 90%.

2.4.4. U-Net

U-Net, like FCN, employs an encoder-decoder network but with certain variations. For example, Liu et al. [74] used a trained U-Net network for concrete crack detection. A total of 84 images were captured under different conditions at the campus of Huazhong University with a resolution of 512 × 512. The model was trained with 57 images and tested with 27 images. The Adam optimizer and focal loss function were used for optimization and evaluation, and the performance of the proposed network was compared with DCNN. The U-Net proved more efficient than DCNN in terms of reliability, effectiveness, and detection accuracy.

2.4.5. Skip-Squeeze-and-Excitation Networks (SSENets)

Li et al. [61] proposed Skip-Squeeze-and-Excitation Networks (SSENets) for detecting cracks. The model consists of an SSE module with a skip-connection approach and an ASPP module with atrous convolution with multi-sample rates. Skip connection reduces the problem of gradient descent, and the ASPP module extracts multi-scale contextual information from images. In this way, the accuracy of crack detection can be improved. A total of 2068 images of bridge cracks with a resolution of 1024 × 1024 were collected using Phantom 4 Pro’s Complementary Metal Oxide Semiconductor (CMOS) surface array camera in the relevant study. After filtering, cropping, and other operations, 6069 images with a resolution of 224 × 224 were obtained. The model was trained with 4856 and tested with 1213 images. The performance of SSENet was compared with ResNet18, ResNet34, and ResNet50. The SSENet achieved a detection accuracy of 97%. However, its detection accuracy was reduced when the number of negative samples in the training set decreased.

2.4.6. CrackNet

Zhang et al. [78] proposed a CrackNet model based on CNN for automatic crack detection in 3D asphalt surfaces. Unlike the widely used CNN, CrackNet does not contain any pooling layers. Hidden layers of this network include convolutional and fully connected layers. The proposed model ensures pixel-level accuracy because the width and length of the image remain unchanged throughout all layers. The model was trained with 1800 and tested with 200 3D pavement images. The method achieved 90.13% precision, 87.63% recall, and 88.86% F-measure.

2.4.7. GoogleNet

Ni et al. [72] used GoogleNet, a CNN-based model, to automate crack detection. The classification of crack feature map fusion and pixel classification was achieved using this method. The output was refined using a feature pyramid network (FPN) consisting of fusion and convolutional layers that collectively delineate cracks. Although this network accurately delineates cracks with a precision of 80.13%, the processing time of the network is longer than other methods.

2.4.8. You Only Look Once (YOLO)

You only look once (YOLO) is a recently introduced state-of-the-art, real-time object detection method. It has different models, such as YOLOv3, YOLOv4, and the very recent YOLOv5. The variants include YOLOv5 s, m, l, and x. YOLOv4 has been used to study cracks in bridges where 376 images were collected using a digital SLR camera and UAVs. The model accurately detected cracks in images of various sizes [69]. Due to its superior accuracy and performance, YOLOv5 is used in the current study. More specifically, the YOLOv5 s, m, and l models are used in this study; YOLOv5x is not explored.

3. Materials and Methods

The method adopted in this study can be divided into three main steps: (1) Data preparation (collection, labeling, and sorting), (2) Model training, and (3) Model testing and application, as shown in Figure 1. The details of the steps are subsequently explained.

3.1. Data Preparation

The collected data are prepared in multiple steps for pertinent model training and testing in this study. The relevant details are discussed below:

3.1.1. Dataset

In this research, we used the 1250 images available online in the SDNET2018 database (https://digitalcommons.usu.edu/all_datasets/48/ accessed 10 July 2022), comprising 800 images with large and 450 with small cracks. The resolution of these images is 256 × 256. SDNET2018 dataset comprises 56,000 images (256 × 256 resolution) of cracked and uncracked concrete bridge walls, decks, and pavements. The dataset’s images consist of various obstructions, such as holes, edges, shadows, surface roughness, and scaling. In addition, the dataset contains cracks ranging in size from 0.06 mm to 25 mm. The selected 1250 images are the ones related to cracks in walls, decks, and pavements only. We also collected 120 images of two bridges located in Swabi and Wah Pakistan, consisting of two classes: large and small cracks. Overall, 1370 images were used in this study.

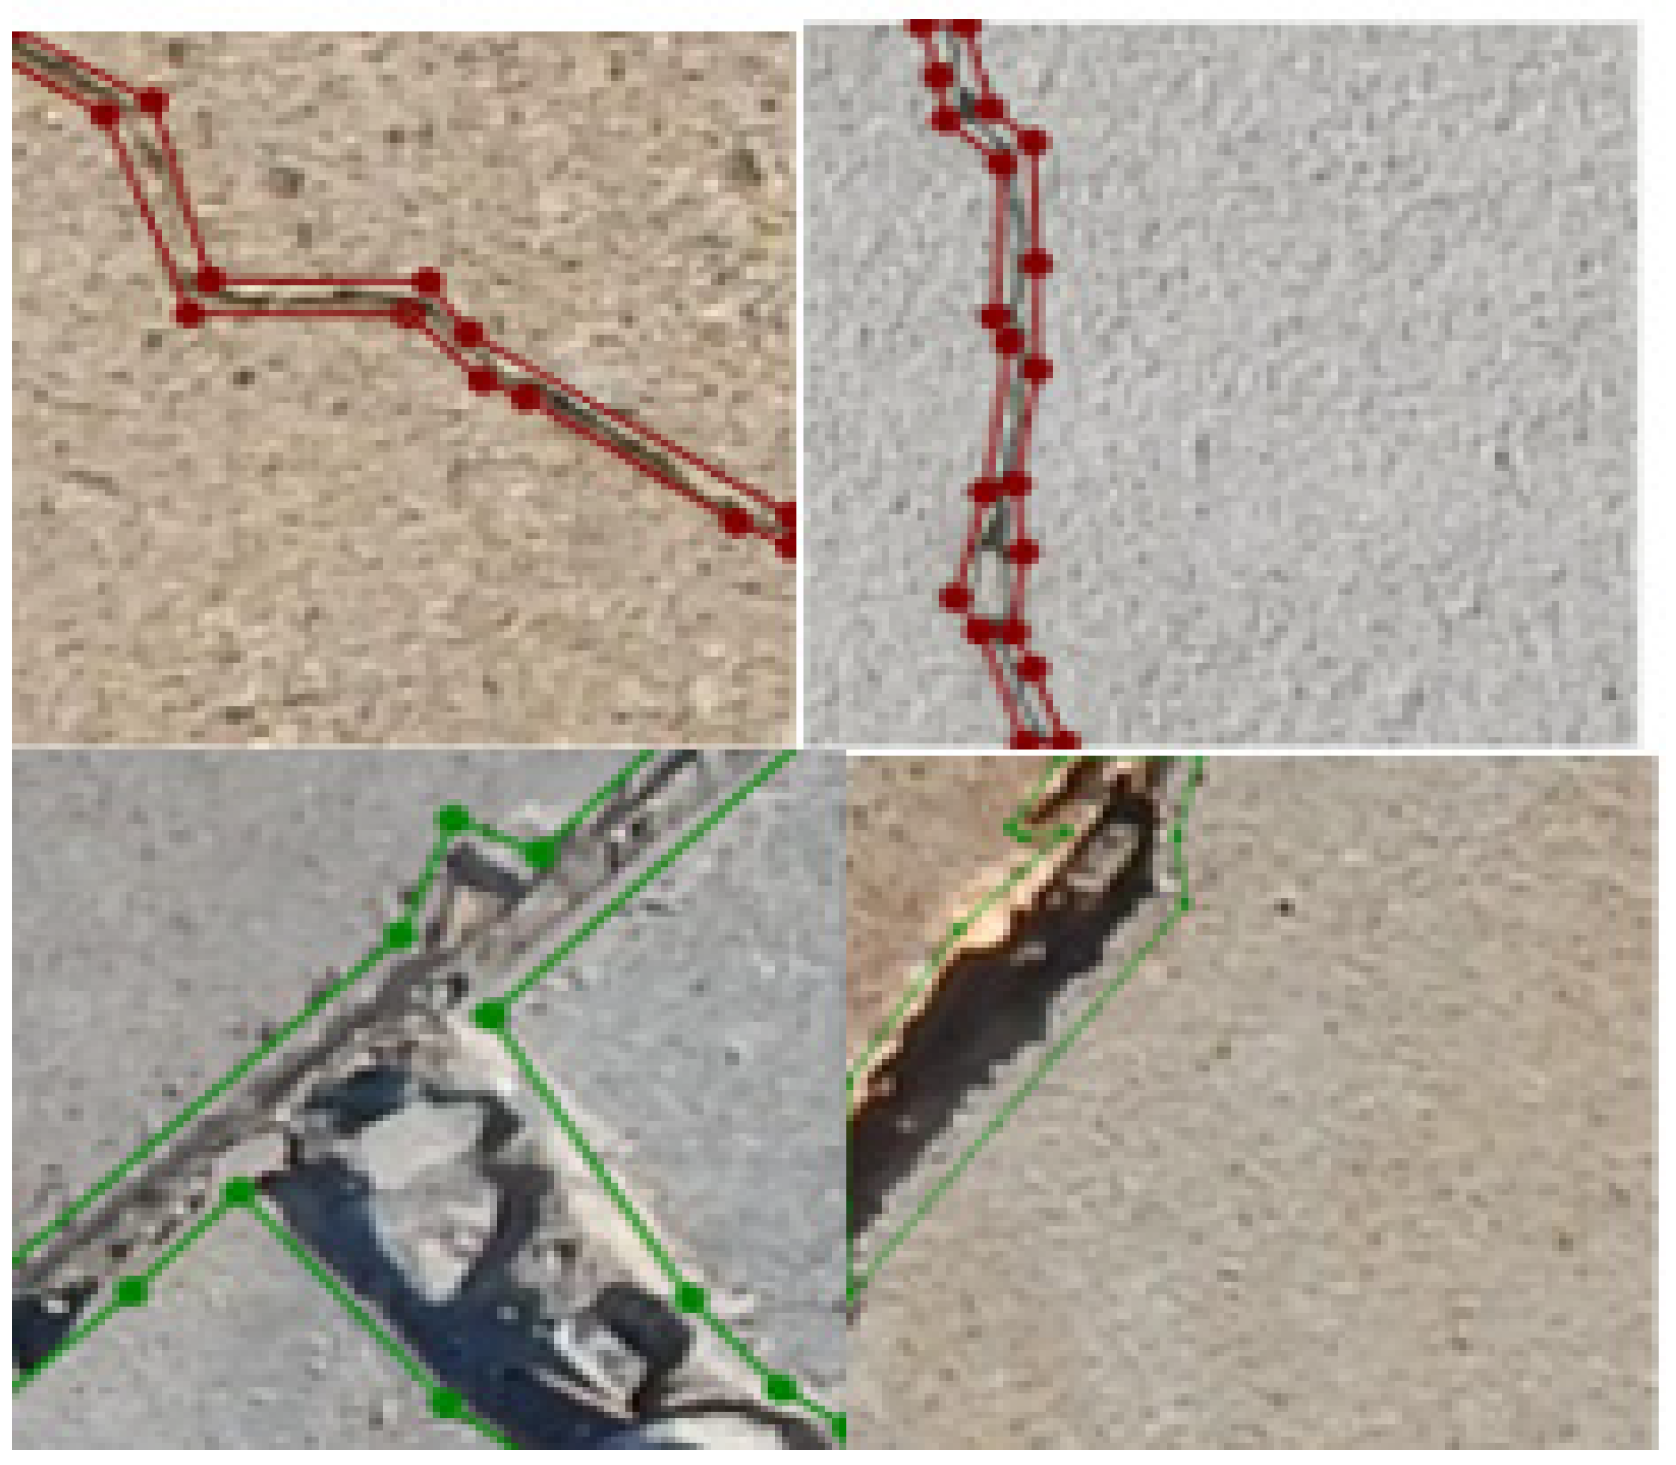
3.1.2. Data Annotation

Data annotation assigns labels to the datasets for object detection using different tools. It is conducted before inputting the dataset into the system to enhance the output’s accuracy. This data annotation process aims to label the classes in the dataset and assign a class. There are various types of data annotation, including semantic annotation, text categorization, image and video annotation, and others. Image annotation is utilized in this research. We labeled and annotated the images using the LabelMe® tool (http://labelme.csail.mit.edu/Release3.0/ accessed 25 July 2022). Each image is labeled with the polygon method because the cracks generally do not have a fixed shape or size and have an uneven structure. Therefore, representing a crack inside one bounding box will reduce the system’s accuracy; hence, the polygon method is used. Figure 2 shows a sample labeled image of the current study. After labeling the images, these are assigned to either of the two set classes: 1 or 0. Class 1 represents a small crack, and 0 represents a large crack.

3.1.3. Data Resizing

Data preprocessing is a fundamental component of deep learning since it enhances the quality of the data for better outcomes. Accordingly, as part of the preprocessing, each image in the dataset is resized to 640 × 640 resolution, which is the default image size of YOLOv5.

3.1.4. Data Augmentation

A model may become overfitted if trained on a small sample of images [84]. Overfitting leads to poor generalization; even if training accuracy is good, the testing accuracy continuously declines, and the model classifies the data into only one class. Such a model may have good training accuracy but poor validation accuracy. To avoid this issue, data are augmented before feeding into the model. This increases the quality of samples in the dataset. Various augmentation methods include rescaling, cropping, flipping, shifting, saturation, and zooming. The dataset used in this research has mainly been augmented using rotations (90-degree, clockwise, counterclockwise, or upside down) and cropping. The cropping increased the total number of images.
As a result of the preprocessing and augmentation, a total of 2270 images comprising 2069 SDNET2018 images and 201 images of Pakistani bridges with a resolution of 640 × 640 were obtained for further analysis in this study.

3.1.5. Data Splitting

The images are split into the training, validation, and test sets using a ratio of 7:2:1. Accordingly, 1423 images were used for training, 427 for validation, and 219 for testing. The total number of images in each class is shown in Table 5.

3.2. Model Description and Functions

Object detection combines localization and classification to identify and locate the objects in images and videos. Cracks have been classified and localized using the object detection method in this study, and the YOLOv5 model has been trained and tested accordingly. The model architecture and testing and training details are discussed below.

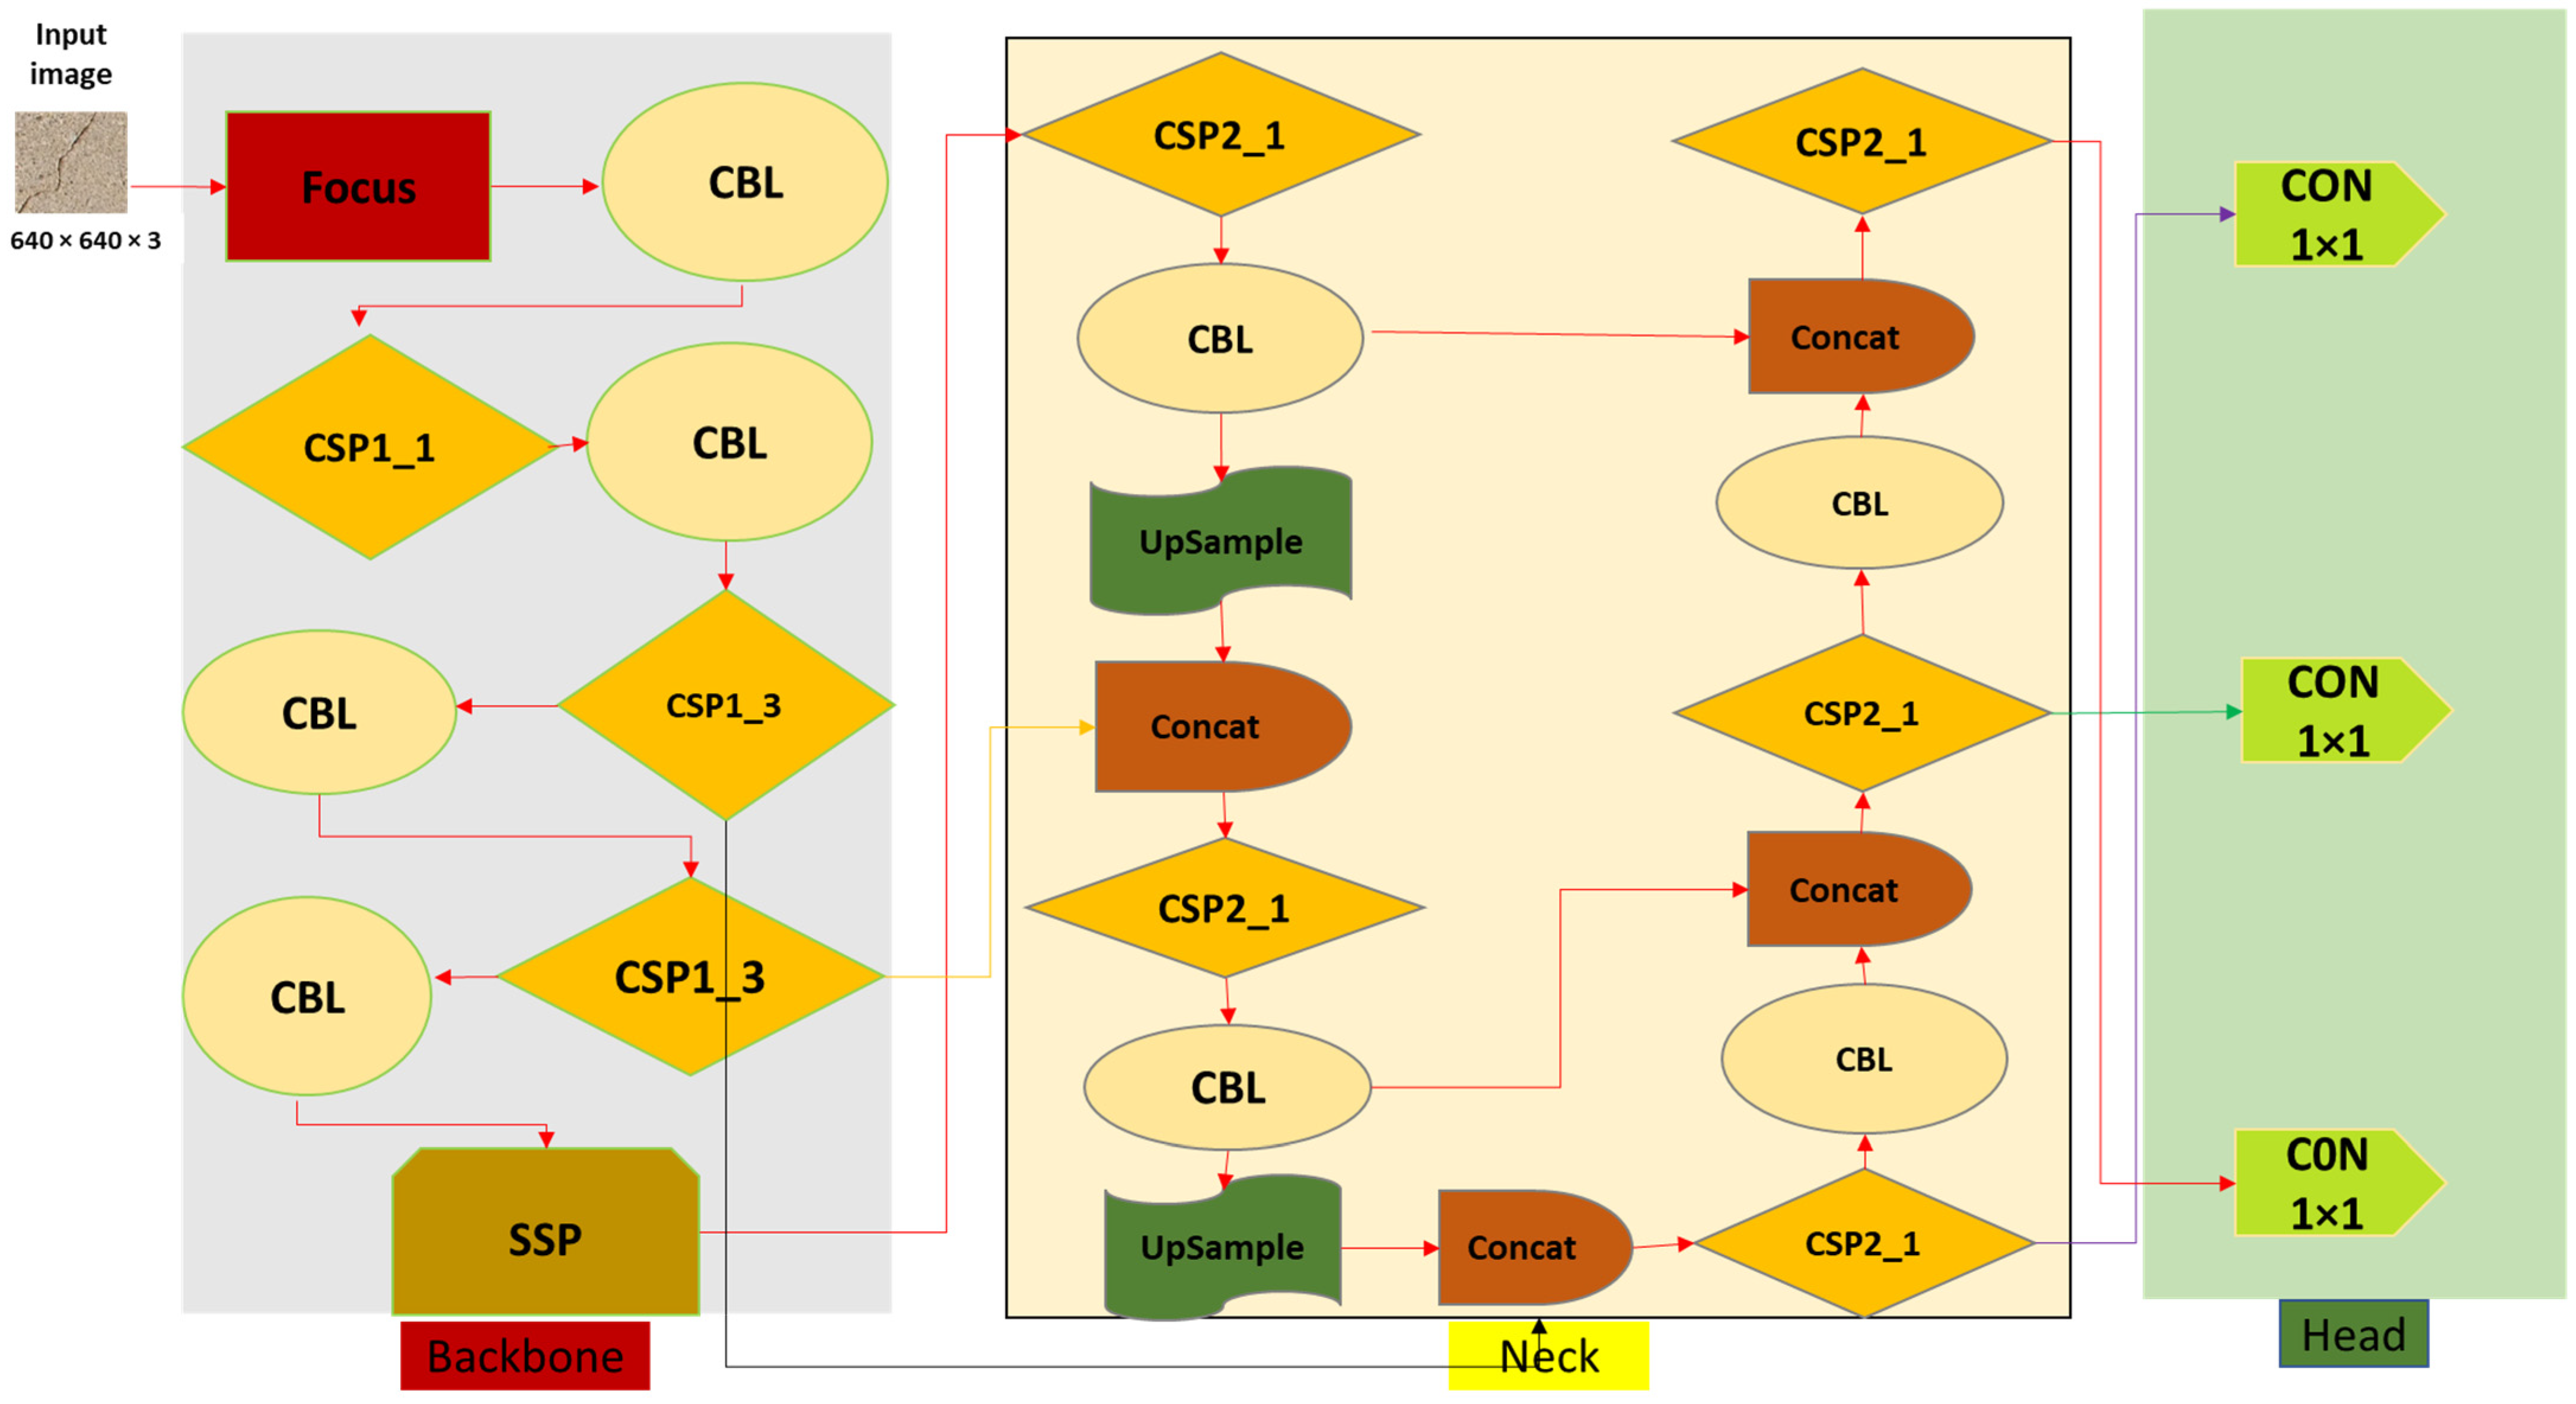
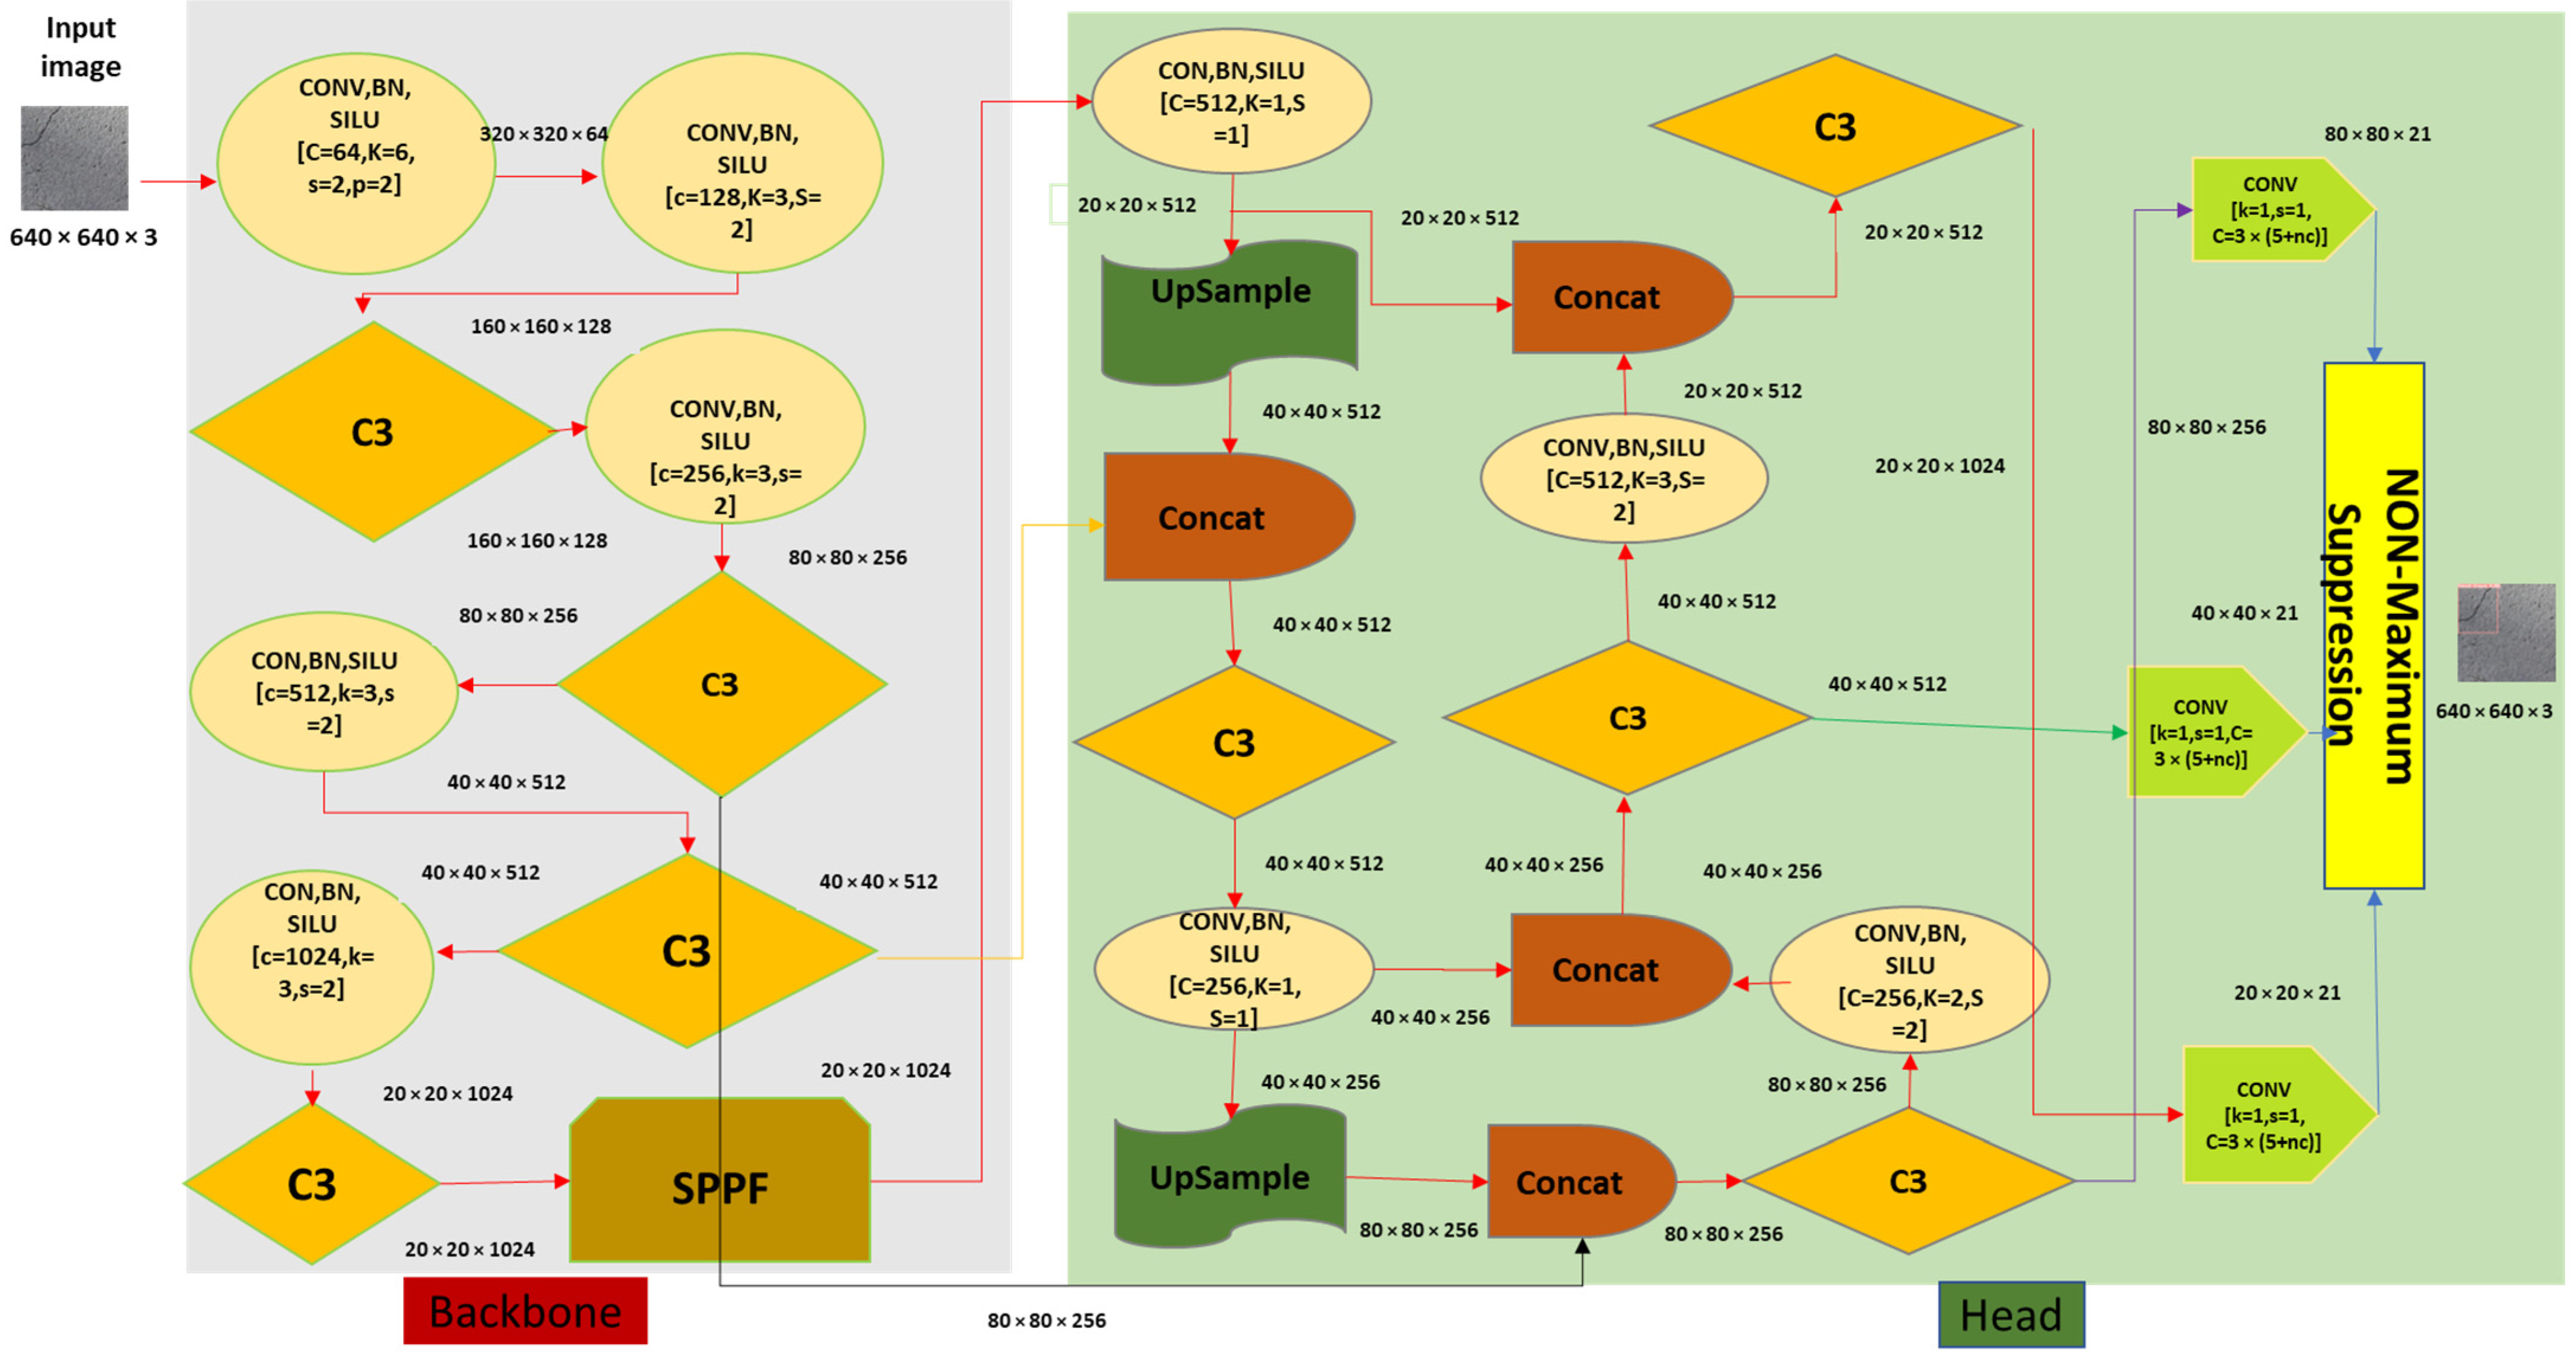
3.2.1. YOLOv5 Architecture

The YOLOv5 model is a single-stage object detector, as shown in Figure 3. Like every other single-stage object detector, it consists of three main parts: backbone, neck, and head [21], as subsequently discussed.
(1)
Backbone
In YOLOv5, Cross Stage Partial (CSP) Networks are utilized as the backbone to extract significant characteristics from the input image. In huge backbones, the CSP Darknet53 is utilized to solve the problem of repeating gradient information. The integrated gradient is transformed into a feature map to slow inference speed. Using the pooling layer SPP (Spatial Pyramid Pooling), the fixed size constraint of the network is removed in the current study. Further, the Bottleneck CSP is employed to speed up inference while reducing the number of calculations.
(2)
Neck
The feature pyramid structures of FPN and PAN are utilized in the neck network. The top feature maps convey strong semantic features to the bottom feature maps using FPN. The PAN simultaneously conveys strong localization features from the lower feature maps into higher feature maps [85]. Together, these two structures strengthen the feature obtained from network backbone fusion, further enhancing the detection performance. Up-sampling is used to facilitate the fusion of prior layers. Concat is a slicing layer used to slice the prior layers.
(3)
Head
The final detection is carried out using the head network. It uses anchor boxes on the features and produces the final output vectors that include bounding boxes, objectness scores, and class probabilities.
Recently, some changes have been made to the YOLOv5 architecture, as shown in Figure 4. The main difference between the previous and the updated YOLOv5 is that the focus layer is replaced by a 6 × 6 2D convolution layer in the updated model [86]. This is equal to the simple 2D convolutional layer without needing a space-to-depth operation. A focus layer with a kernel size of 3 can be described as a convolution layer with a kernel size of 6 and stride 2. Another difference between the two variants is that the SPP layer is replaced by SPPF, due to which the computing speed has increased by more than two times. As a result, this replacement has made the YOLOv5 more effective and faster in terms of speed. Besides these, other changes were also made to the YOLOv5, such as bottleneck CSP being replaced by C3. The difference between C3 and CSP is that the convolution after the bottleneck is removed in C3, and the activation function Leaky ReLu is replaced by SiLU (Sigmoid Linear Unit) activation function.

3.2.2. YOLOv5 Variants

YOLOv5 has four variants: YOLOv5s, YOLOv5m, YOLOv5l, and YOLOv5x, which are pre-trained using the COCO dataset. The difference in the four architectures is that of the feature extraction module, the network’s convolutional kernels, size, and time of inference. The size of the different versions varies from 14 to 168 MB. In this research, we used YOLOv5s, YOLOv5m, and YOLOv5l with transfer learning.

3.2.3. Activation Function

The activation function is used to introduce non-linearity in the output of the neurons. This function takes the weighted sum of the features and bias as input and determines whether to activate the neuron. Different activation functions include Sigmoid, Leaky ReLu, Tanh, ReLu, and Softmax. In the YOLOv5 model used in this study, the SiLU and Sigmoid activation functions are used. The hidden layers employ the SiLU activation function, and the final detection layer employs the Sigmoid activation function.

3.2.4. Optimization Function

Two optimization functions are used in the YOLOv5 model of the current study: SGD and Adam Optimizer. SGD is the default optimizer for training that has been modified to Adam in the command line.

3.2.5. Cost/Loss Function

A compound loss is computed for the YOLO family based on the objectness, class probability, and bounding box regression scores. In the YOLOv5 model of this study, binary cross-entropy with the Logits Loss function is used to calculate the loss. The loss can also be computed using the Focal Loss function.

3.2.6. YOLOv5 Model Training

The labeled data is fed into the three versions of the YOLOv5 model for training in the current study. Google Colab Pro+ has been utilized to implement the YOLOv5 model in this study. The YOLOv5 environment and dependencies have been installed in Google Colab Pro+ to detect objects (cracks) in the images, and the model was configured accordingly. For model training, the three versions of YOLOv5 used in this study (YOLOv5s, YOLOv5m, and YOLOv5l) were defined by one line of code as “custom_YOLOv5s.yaml”, “custom_YOLOv5m.yaml”, and “custom_YOLOv5l.yaml”.
Next, the data configuration file (.yaml) is defined, which contains the details of the custom data on which the model is to be trained. In this file, the following variables were defined: the path of the test, the training and validation set, the number of classes, and the names of classes. The model used in the current study was not trained from scratch, as random weights are needed for such training, which consumes extra time and may complicate the computations. Therefore, to save time and simplify the computations, we used the pre-trained COCO weights to train our model. Since we used the pre-trained weights, we have used the COCO model’s default layers and anchors. Moreover, we trained the model at 300 epochs. The model variants, such as YOLOv5 s, m, and l training and validation outcomes, were documented accordingly, and the mAP values were compared to assess the models’ performance.

3.2.7. YOLOv5 Model Testing

The trained models of YOLOv5 (s, m, and l) were used to check the model’s performance. Two hundred nineteen images from the test data were fed into the trained model for testing, and the output cracks were classified and located based on severity level.

3.3. Segmentation

The segmentation technique identifies the borders and regions of the objects of interest in the images by labeling each image pixel. In this study, image cracks are the objects of interest that have been segmented using the segmentation method. The U-Net model has been used to segment the cracks in bridge images of the current study. The segmentation has been split into two phases: training and testing.

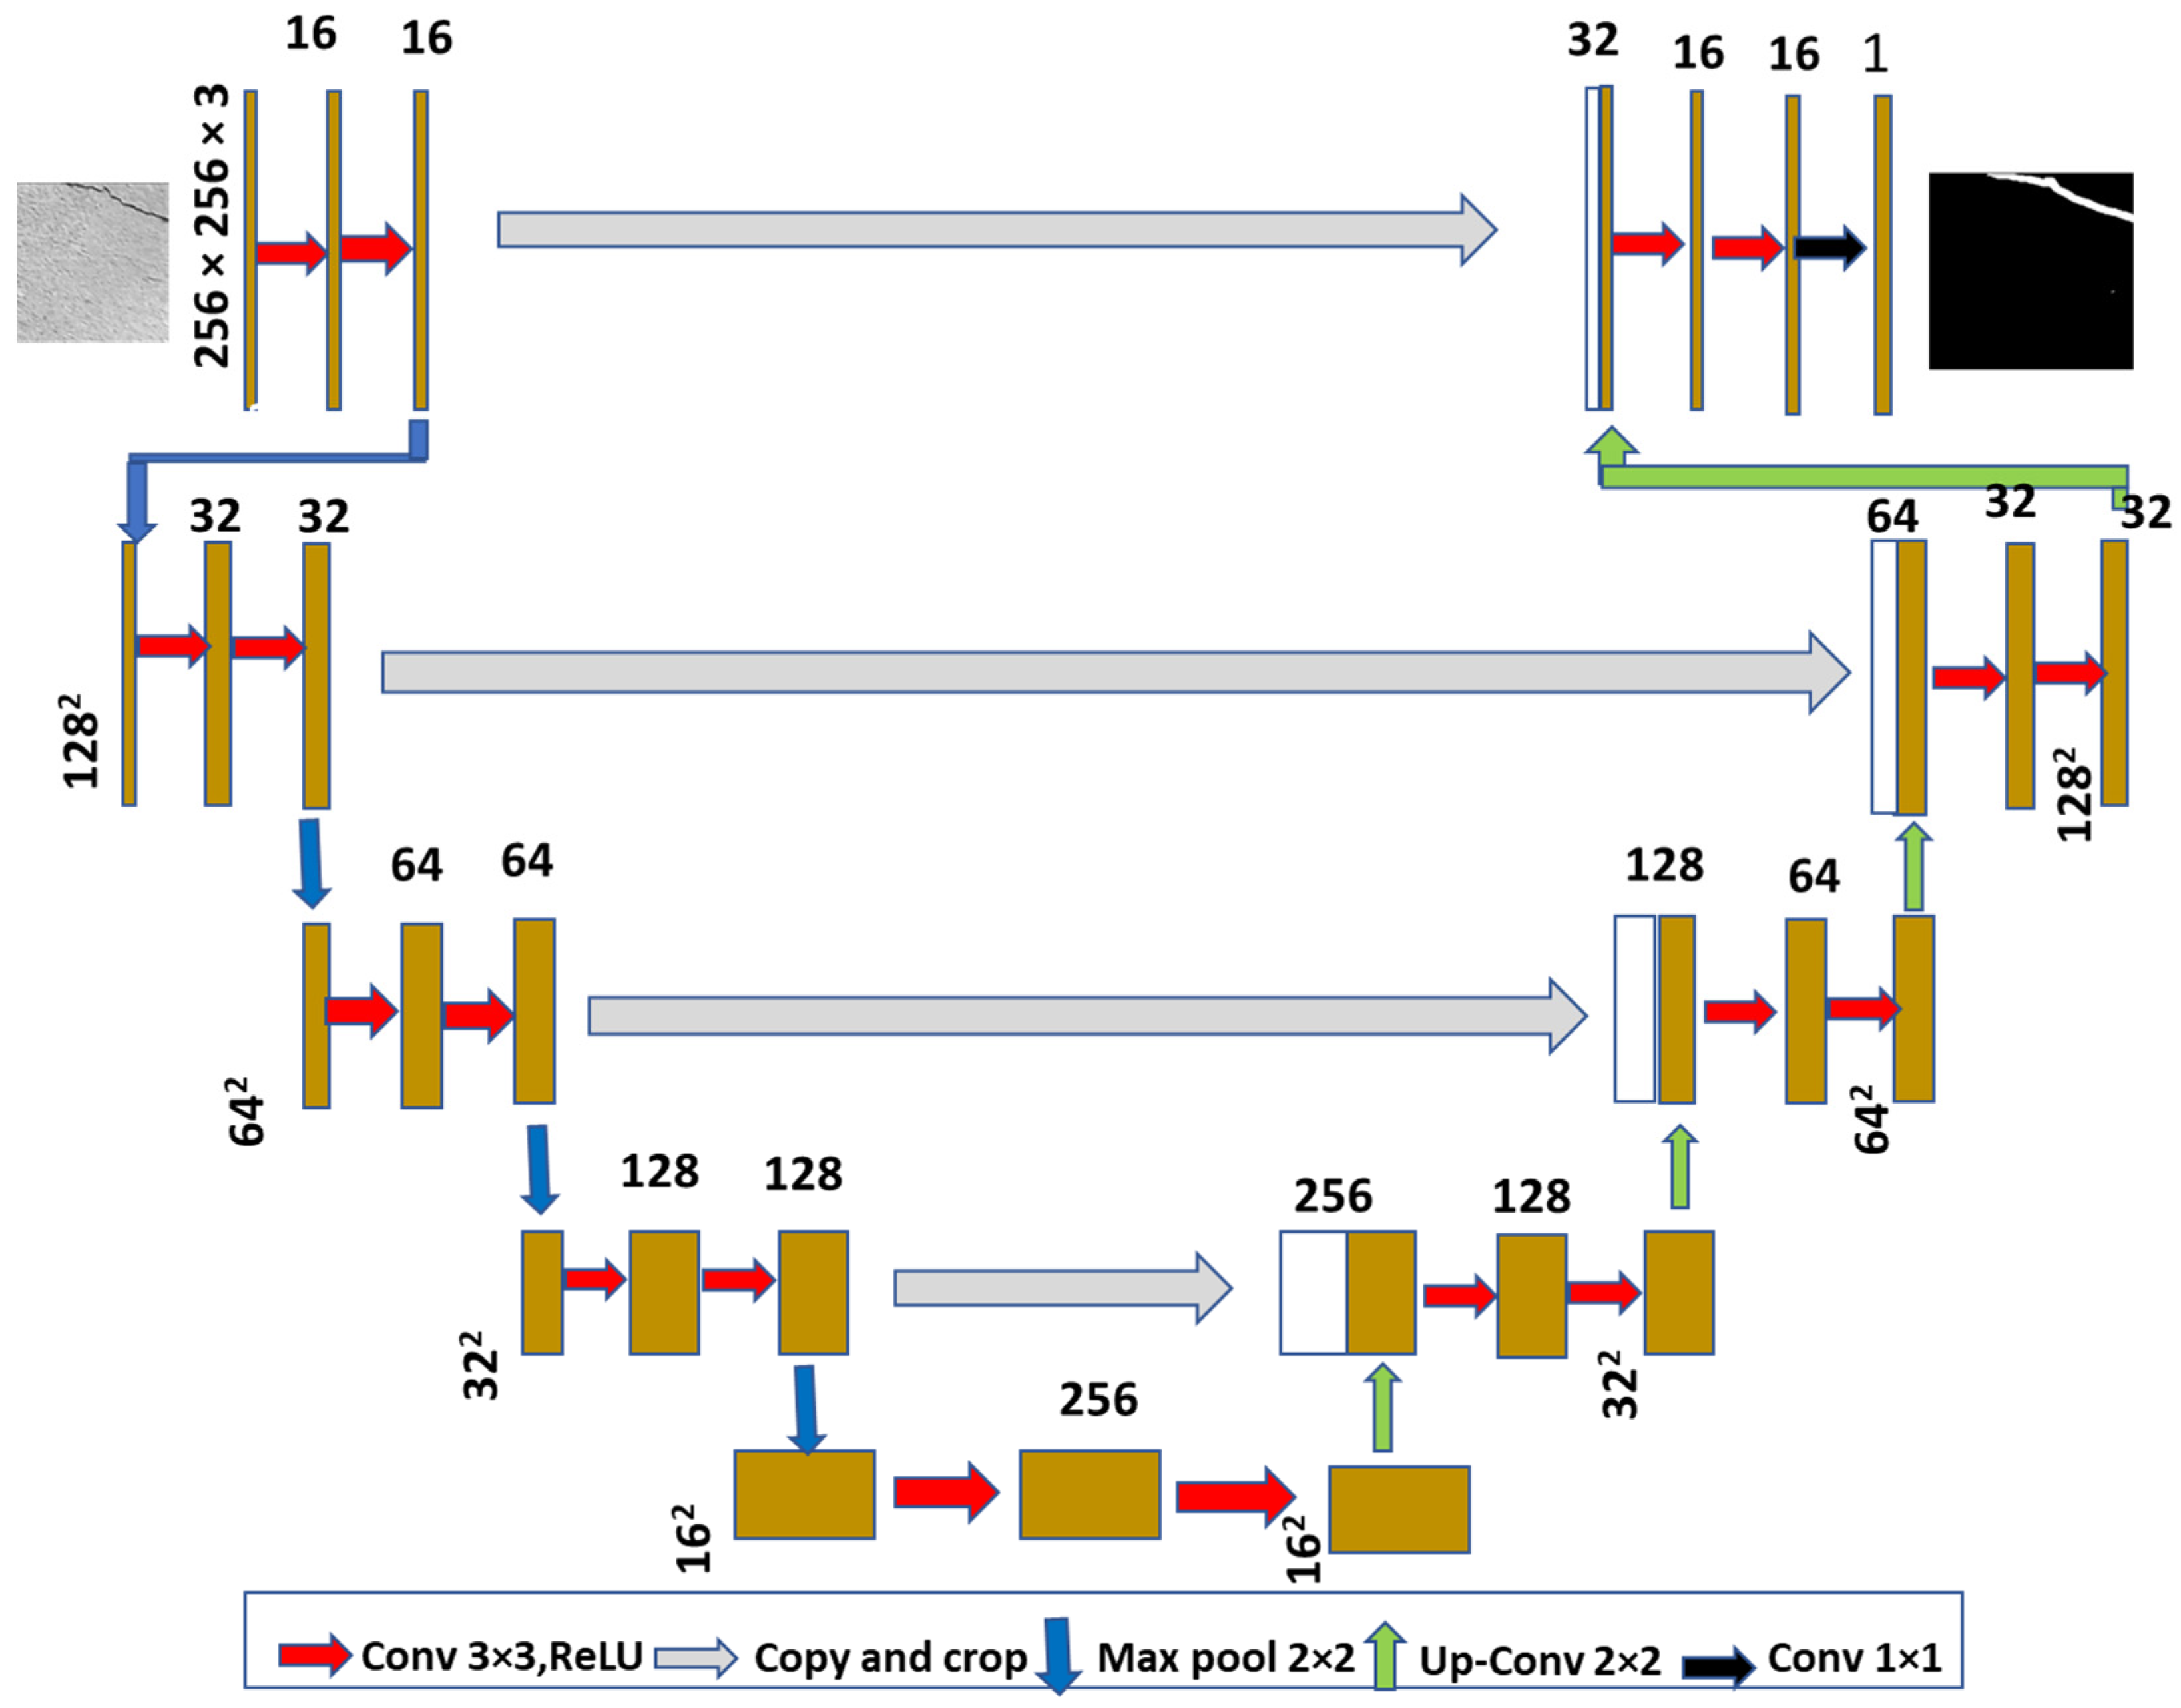
3.3.1. U-Net Model Architecture

U-Net is a CNN model used for semantic segmentation in the current study. It is composed of an encoder and a decoder, as shown in Figure 5. The encoder is a conventional stack of convolutional layers and the max pooling layer, which are utilized to extract the context from the image. The decoder makes it possible to locate objects precisely by using transposed convolutions. U-Net is an end-to-end FCN and only comprises the convolutional layers. There are no dense layers due to which U-Net can be applied to images of different sizes. The final prediction layer uses the sigmoid activation function, whereas the middle layer uses the ReLu activation function. The loss function is binary cross-entropy loss, and the optimizer used in this study is the Adam optimizer.
Each golden box in Figure 5 represents a multi-channel feature map. The number of channels is shown at the top of the box. At the lower-left corner of the box, the x and y sizes are displayed. The arrows denote the various actions, and the white box represents the copied feature maps.

3.3.2. U-Net Training

The polygon-based labeled data are converted into segmentation masks and fed into the U-Net model for training in the current study. Google Colab Pro+ has been utilized to implement the U-Net model. The U-Net dependencies and required libraries have been installed in Google Colab Pro+ to segment the objects. The model was trained from scratch at various epochs. Finally, we used a batch size of 12 and 200 epochs to achieve the best training results.

3.3.3. U-Net Testing

The trained U-Net model was used to check its performance on the test images. One hundred twelve random test data images were fed to the trained model for testing, and the output segmentation mask was predicted. Since the output is binary, we assigned an intensity of 0 to output pixels with a value of 0 and an intensity of 255 to those with a value of 1.

3.4. Crack Size Measurement

The segmentation mask obtained from U-Net was assigned to the attribute extractor. First, the area of the crack was measured by counting the number of non-zero pixels. Second, the width and height of the cracks were measured using a bounding box that best fits the crack. The distance from the box edges was used to measure the crack’s width and height. Finally, the ratio of width and height was calculated.

4. Experiment Design, Measures, and Results

The consideration for testing the YOLOv5 models and associated results are described below.

4.1. Hardware Configuration

We utilized the Google Colab Pro+ to simulate the proposed object detection technique. Online Python scripts and codes were run on this platform for applying pertinent machine learning and data analysis techniques. For effective data analysis, Google Colab Pro+ provides a large size of RAM, disk space, and faster GPUs. As more virtual memory is available, the runtime has been improved. Another important feature of Google Colab Pro+ is the background execution. Once the training has started, the code runs continuously for up to 24 h without requiring the browser to be active. A GPU of the P100, T4, V100, RAM of 52 GB, and the 2x vCPU is used for the current study. The hardware configurations used in the current study are shown in Table 6.

4.2. Performance Measures

Various model performance measures used in the current study are discussed below.
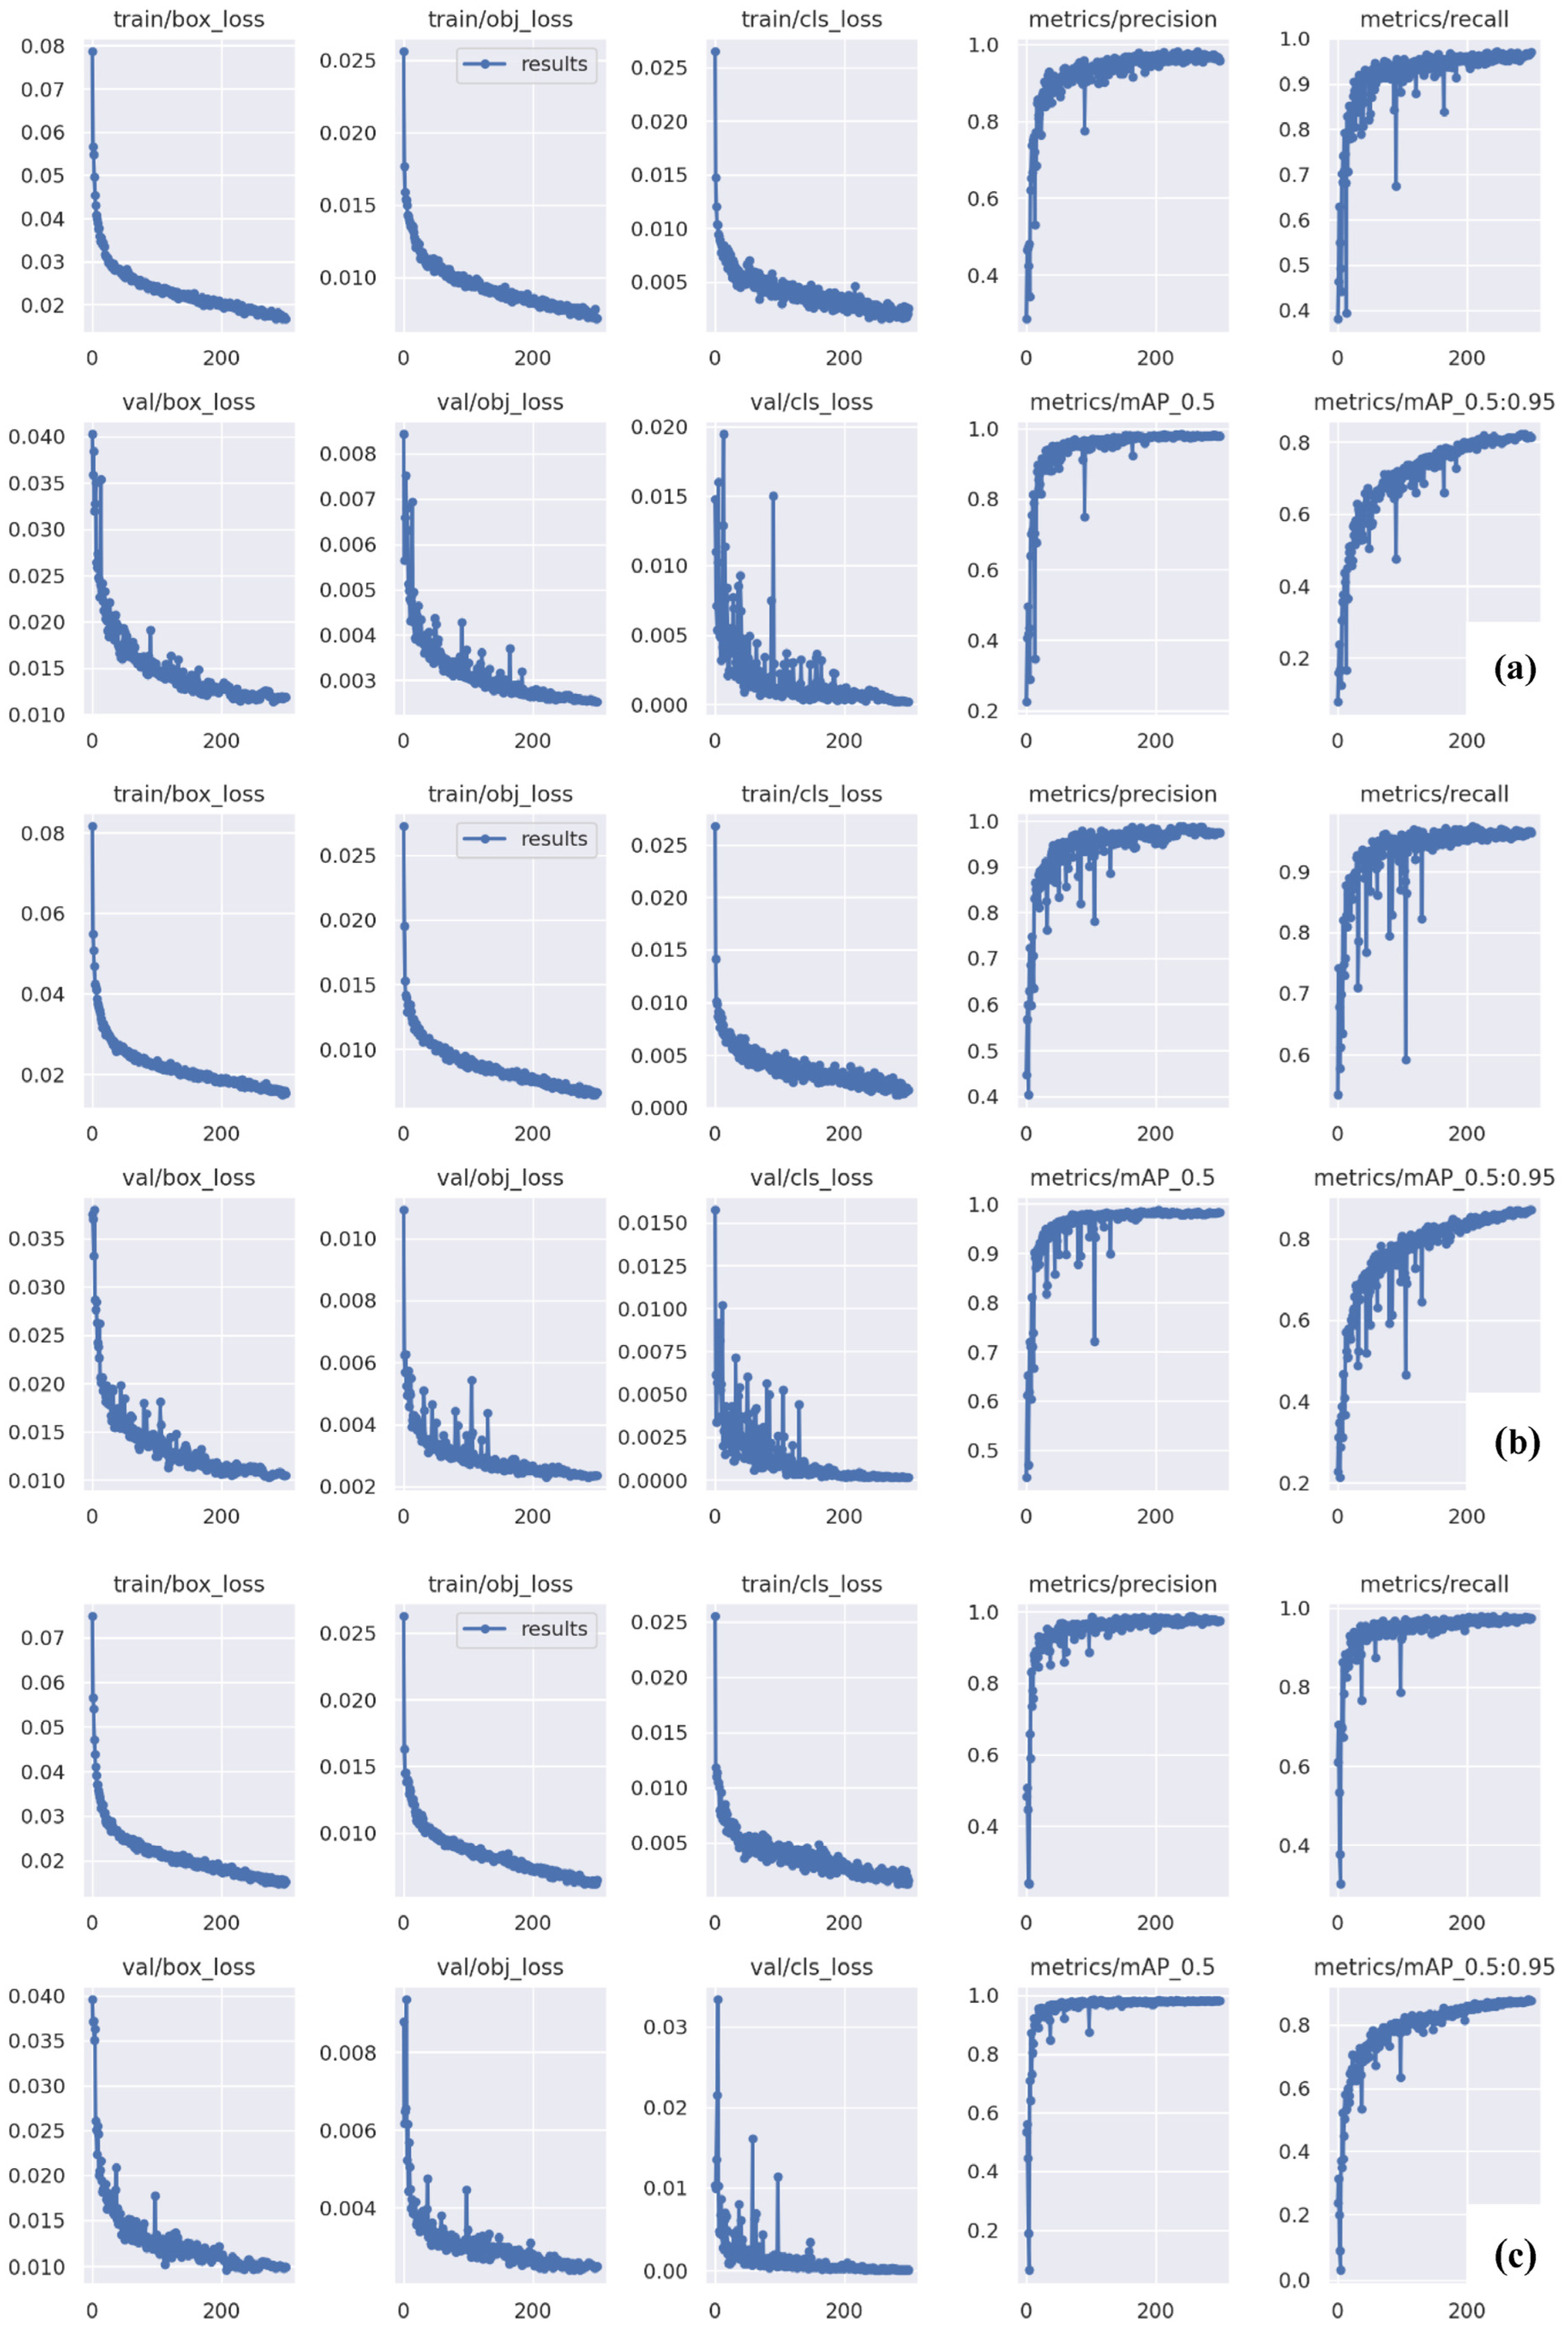
  • Box Loss: It measures how accurately the algorithm can pinpoint an object’s center and the precision of the bounding box enclosing the crack in the tested models.
  • Object Loss: It provides the likelihood of an object appearing in a particular location of interest as determined by the objectness score. The image likely contains the object if the score is high.
  • Classification loss: A type of cross-entropy that shows how accurately a given class has been predicted.
  • Intersection over Union (IoU): It determines the variation between the predicted and ground truth labels in our tested models. When detecting objects, the model predicts several bounding boxes for every object and eliminates the one which is not needed based on the threshold value and each bounding box’s confidence scores. The threshold value is defined according to requirements. The box is eliminated if the IoU value does not exceed the threshold value (set for cracks). IoU is computed using Equation (1).
    IoU = Area   of   union   Area   of   intersection
  • Precision: It is used to measure correct predictions and is determined using Equation (2).
    Precision = TP   TP + FP
  • Recall: It corresponds to the true positive rate and is determined using Equation (3). Recall measures the percentage of the true bounding box that was correctly predicted in the current study.
    Recall = TP   TP + FN
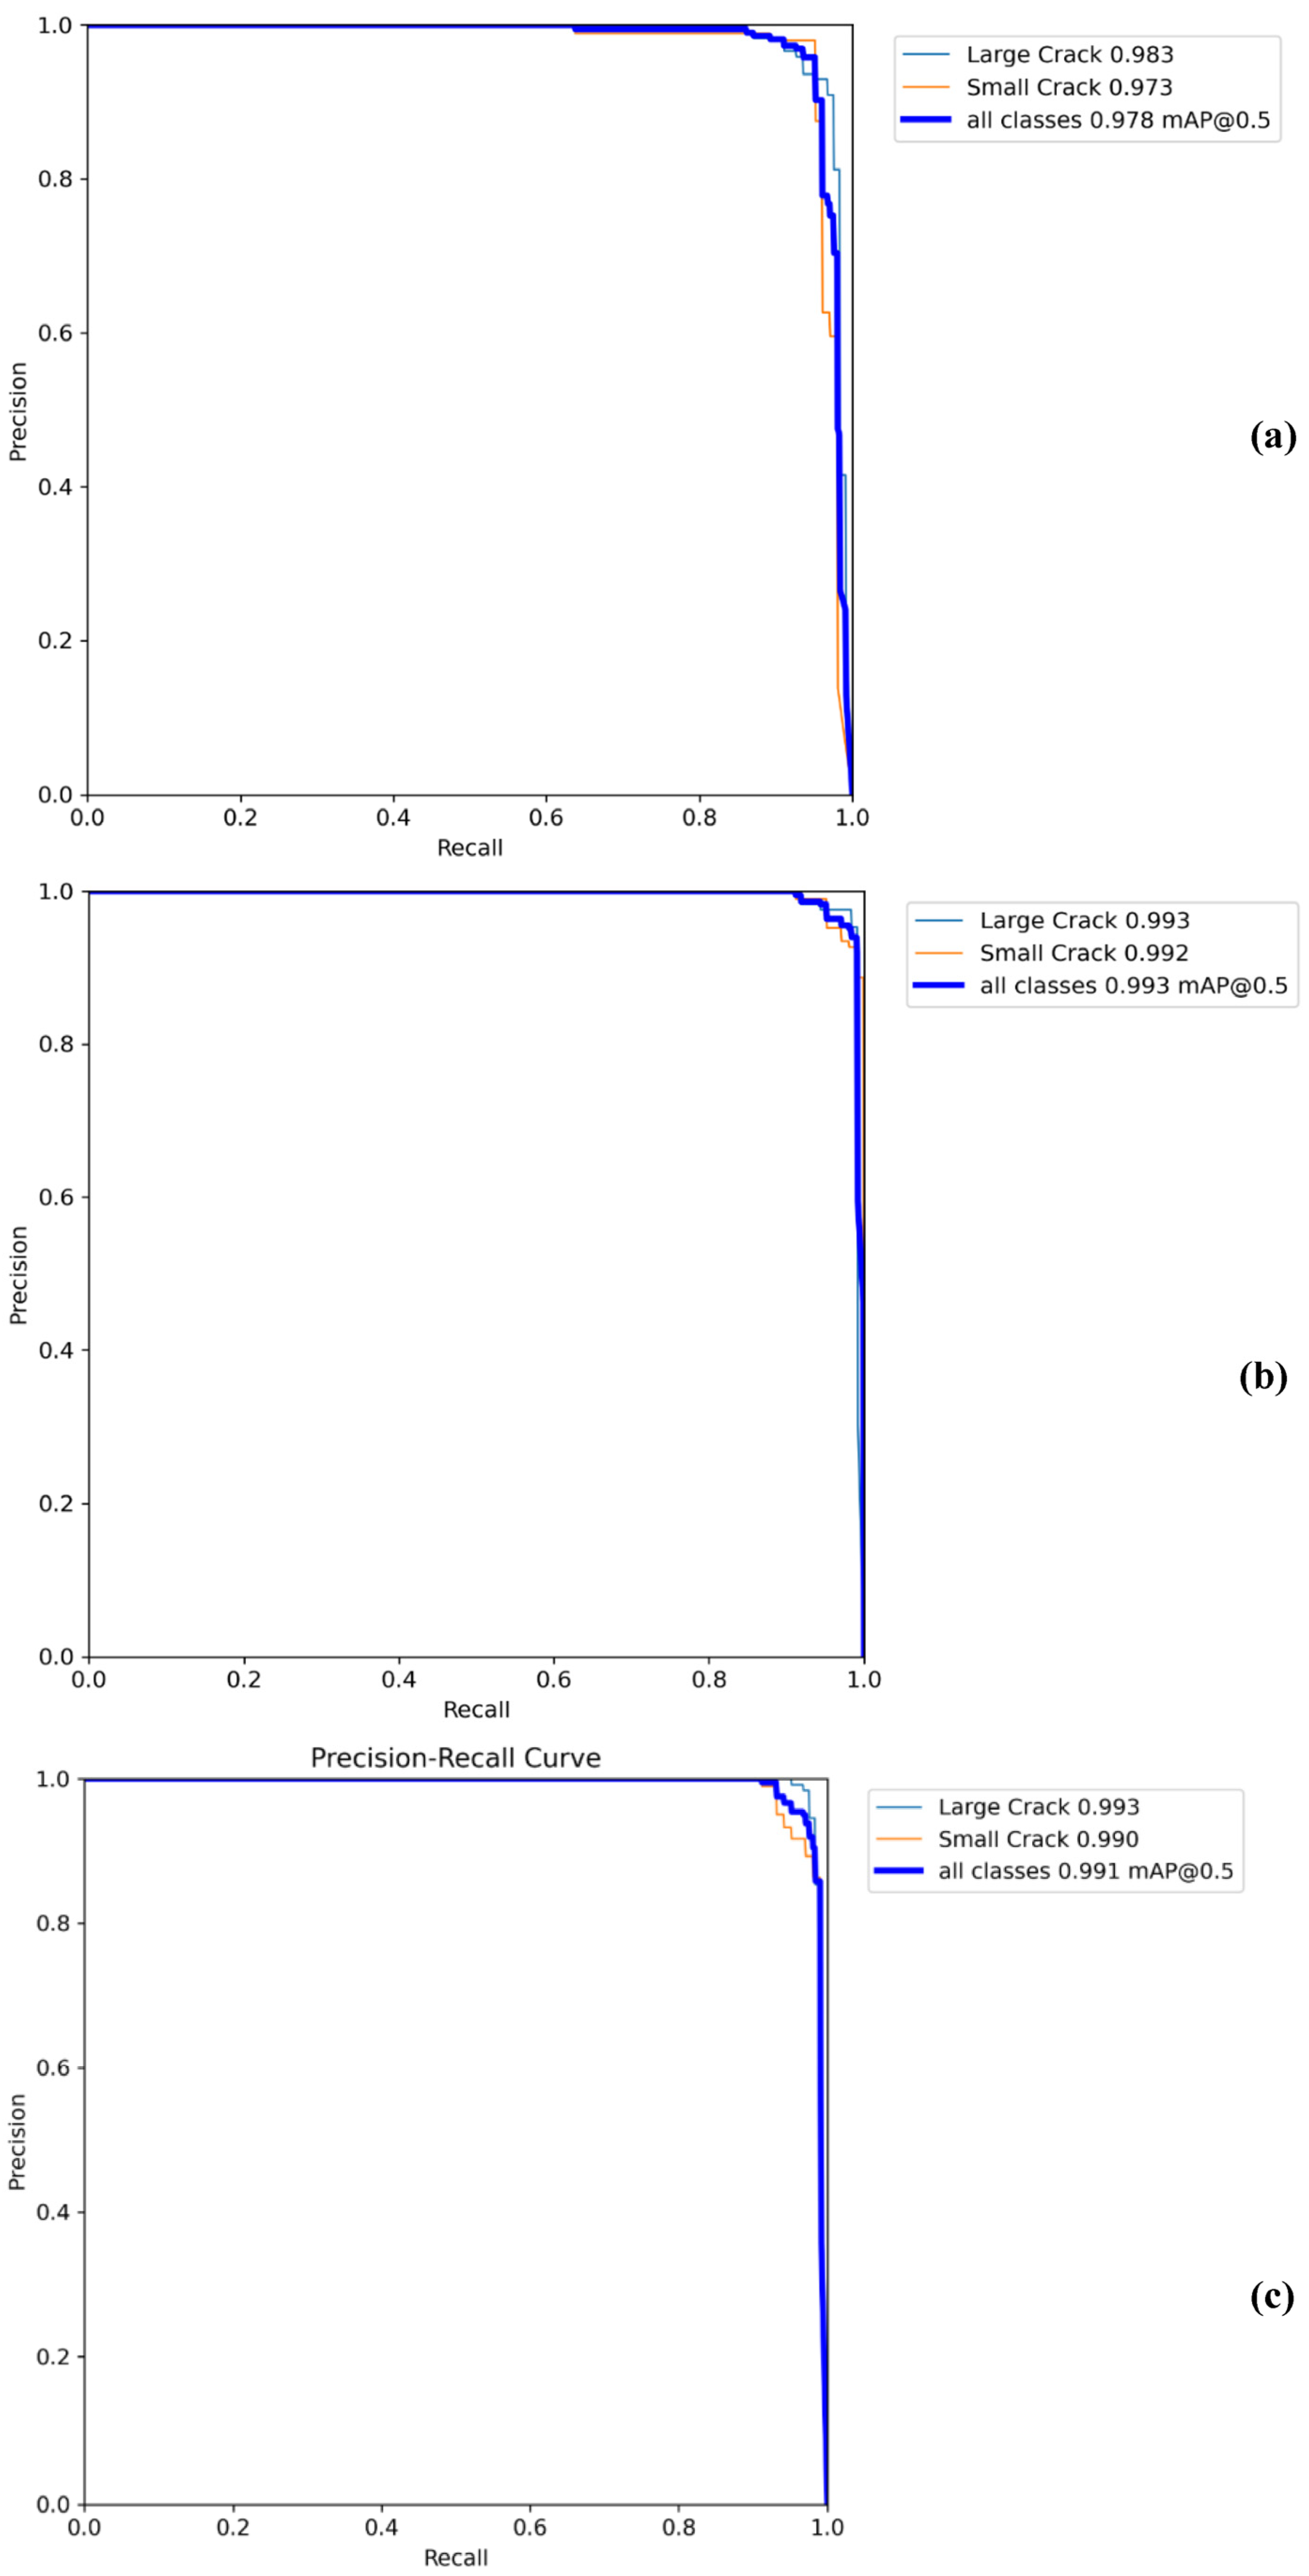
  • Average Precision (AP): The area under the precision-recall curve is used to determine AP.
  • Mean Average Precision (mAP): Mean AP (mAP) considers both precision and recall by averaging the recall values between 0 and 1, and sums up the precision-recall curve in a single numeral metric.
  • mAP_0.5: This is the mean mAP at the IoU threshold of 0.5.
  • mAP_0.5:0.95: This is the average mAP across a range of different IoU thresholds, from 0.5 to 0.95.

4.3. Model Training, Validation, and Testing Results

This section displays the outcomes of our models’ detection using SDNET2018 and Pakistani datasets using the weights obtained from the trained model. The results of the YOLOv5 s, m, and l versions for various epochs are presented accordingly.
The mAP values are compared to evaluate the performance of the YOLOv5 s, m, and l and highlight the most suitable model for our dataset. The training and validation results are visualized in Figure 6. Figure 6a shows the training and validation results for YOLOv5s; Figure 6b represents the same for YOLOv5m, and Figure 6c for YOLOv5l. The comparison of precision, recall, and mAP on the open-source dataset for all three versions is represented in Table 7. As evident from Table 7, YOLOv5m achieved the best results at 300 epochs. The model achieved an overall mAP of 98.3%, followed by YOLOv5l at 98.1% and YOLOv5s at 98%. Overall, all variants showed excellent values.

4.3.1. Testing Results for SDNET2018 Dataset

The training and validation process revealed that the YOLOv5m model is the most effective. For further demonstration, we assessed the performance of all the models—YOLOv5 s, m, and l—on 219 images of SDNET2018 test data. The results obtained from the test set are shown in Table 8.
Figure 7 shows the precision-recall graphs of the three YOLOv5 variants based on Table 8. Figure 7a represents the YOLOv5s, Figure 7b represents the YOLOv5m, and Figure 7c represents the graph for YOLOv5l.

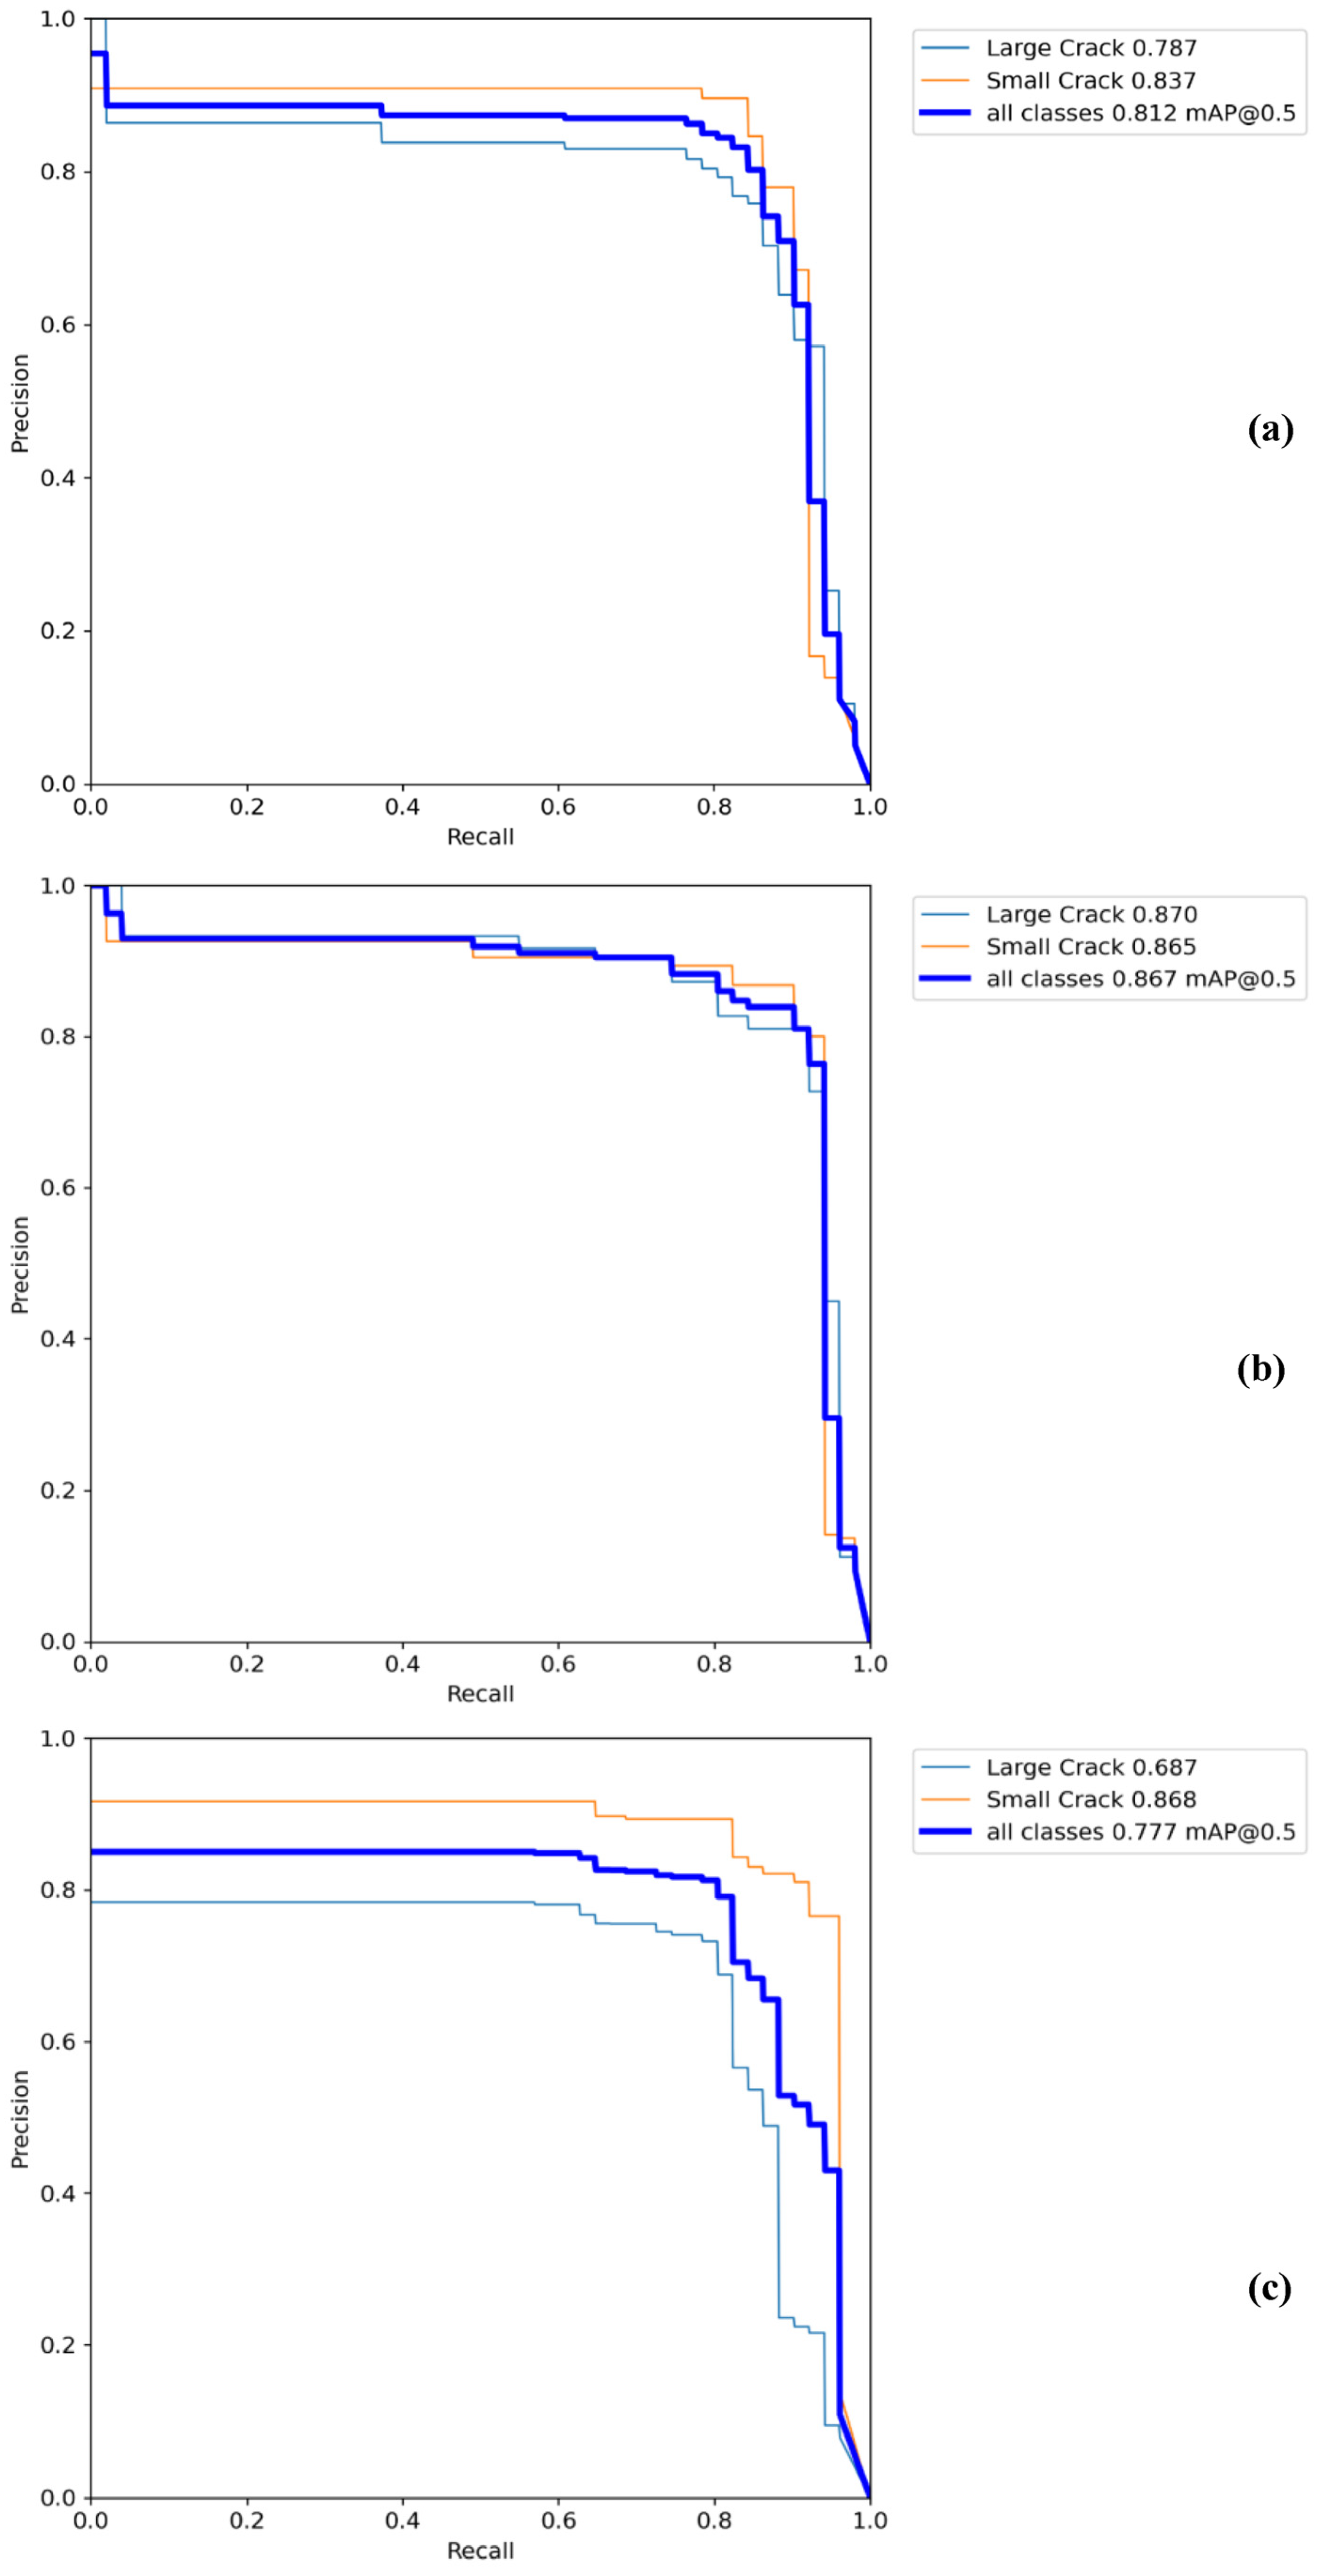
4.3.2. Testing Results for the Pakistani Dataset

To check the robustness of the model, the YOLOv5s, m and l are tested on 201 images collected from the case study bridges in Pakistan. The results of precision, recall, and mAP values obtained from all three variants are shown in Table 9 and graphically visualized in Figure 8. Figure 8a represents the curves for YOLOv5s, Figure 8b illustrates the same for YOLOv5m, and Figure 8c depicts the YOLOv5l.
From Figure 8, a drop can be seen in the model performance, which can be associated with the model not being trained on local images, which show significantly different cracks than the SDNET dataset. However, the accuracy of around 87% for YOLOv5m is still the best among the three variants. This is not a bad result, given that the model was not tested on similar images. Overall, the YOLOv5m model performed well on training and validation data of both test datasets (SDNET2018 and Pakistani). Although the bridge dataset of Pakistan is not used during training, the mAP is good enough, reflecting the robustness of the proposed model in the current study. It is expected that with pertinent training on local (Pakistani) datasets, the model’s accuracy will increase to levels comparable to that of the SDNET2018 dataset.

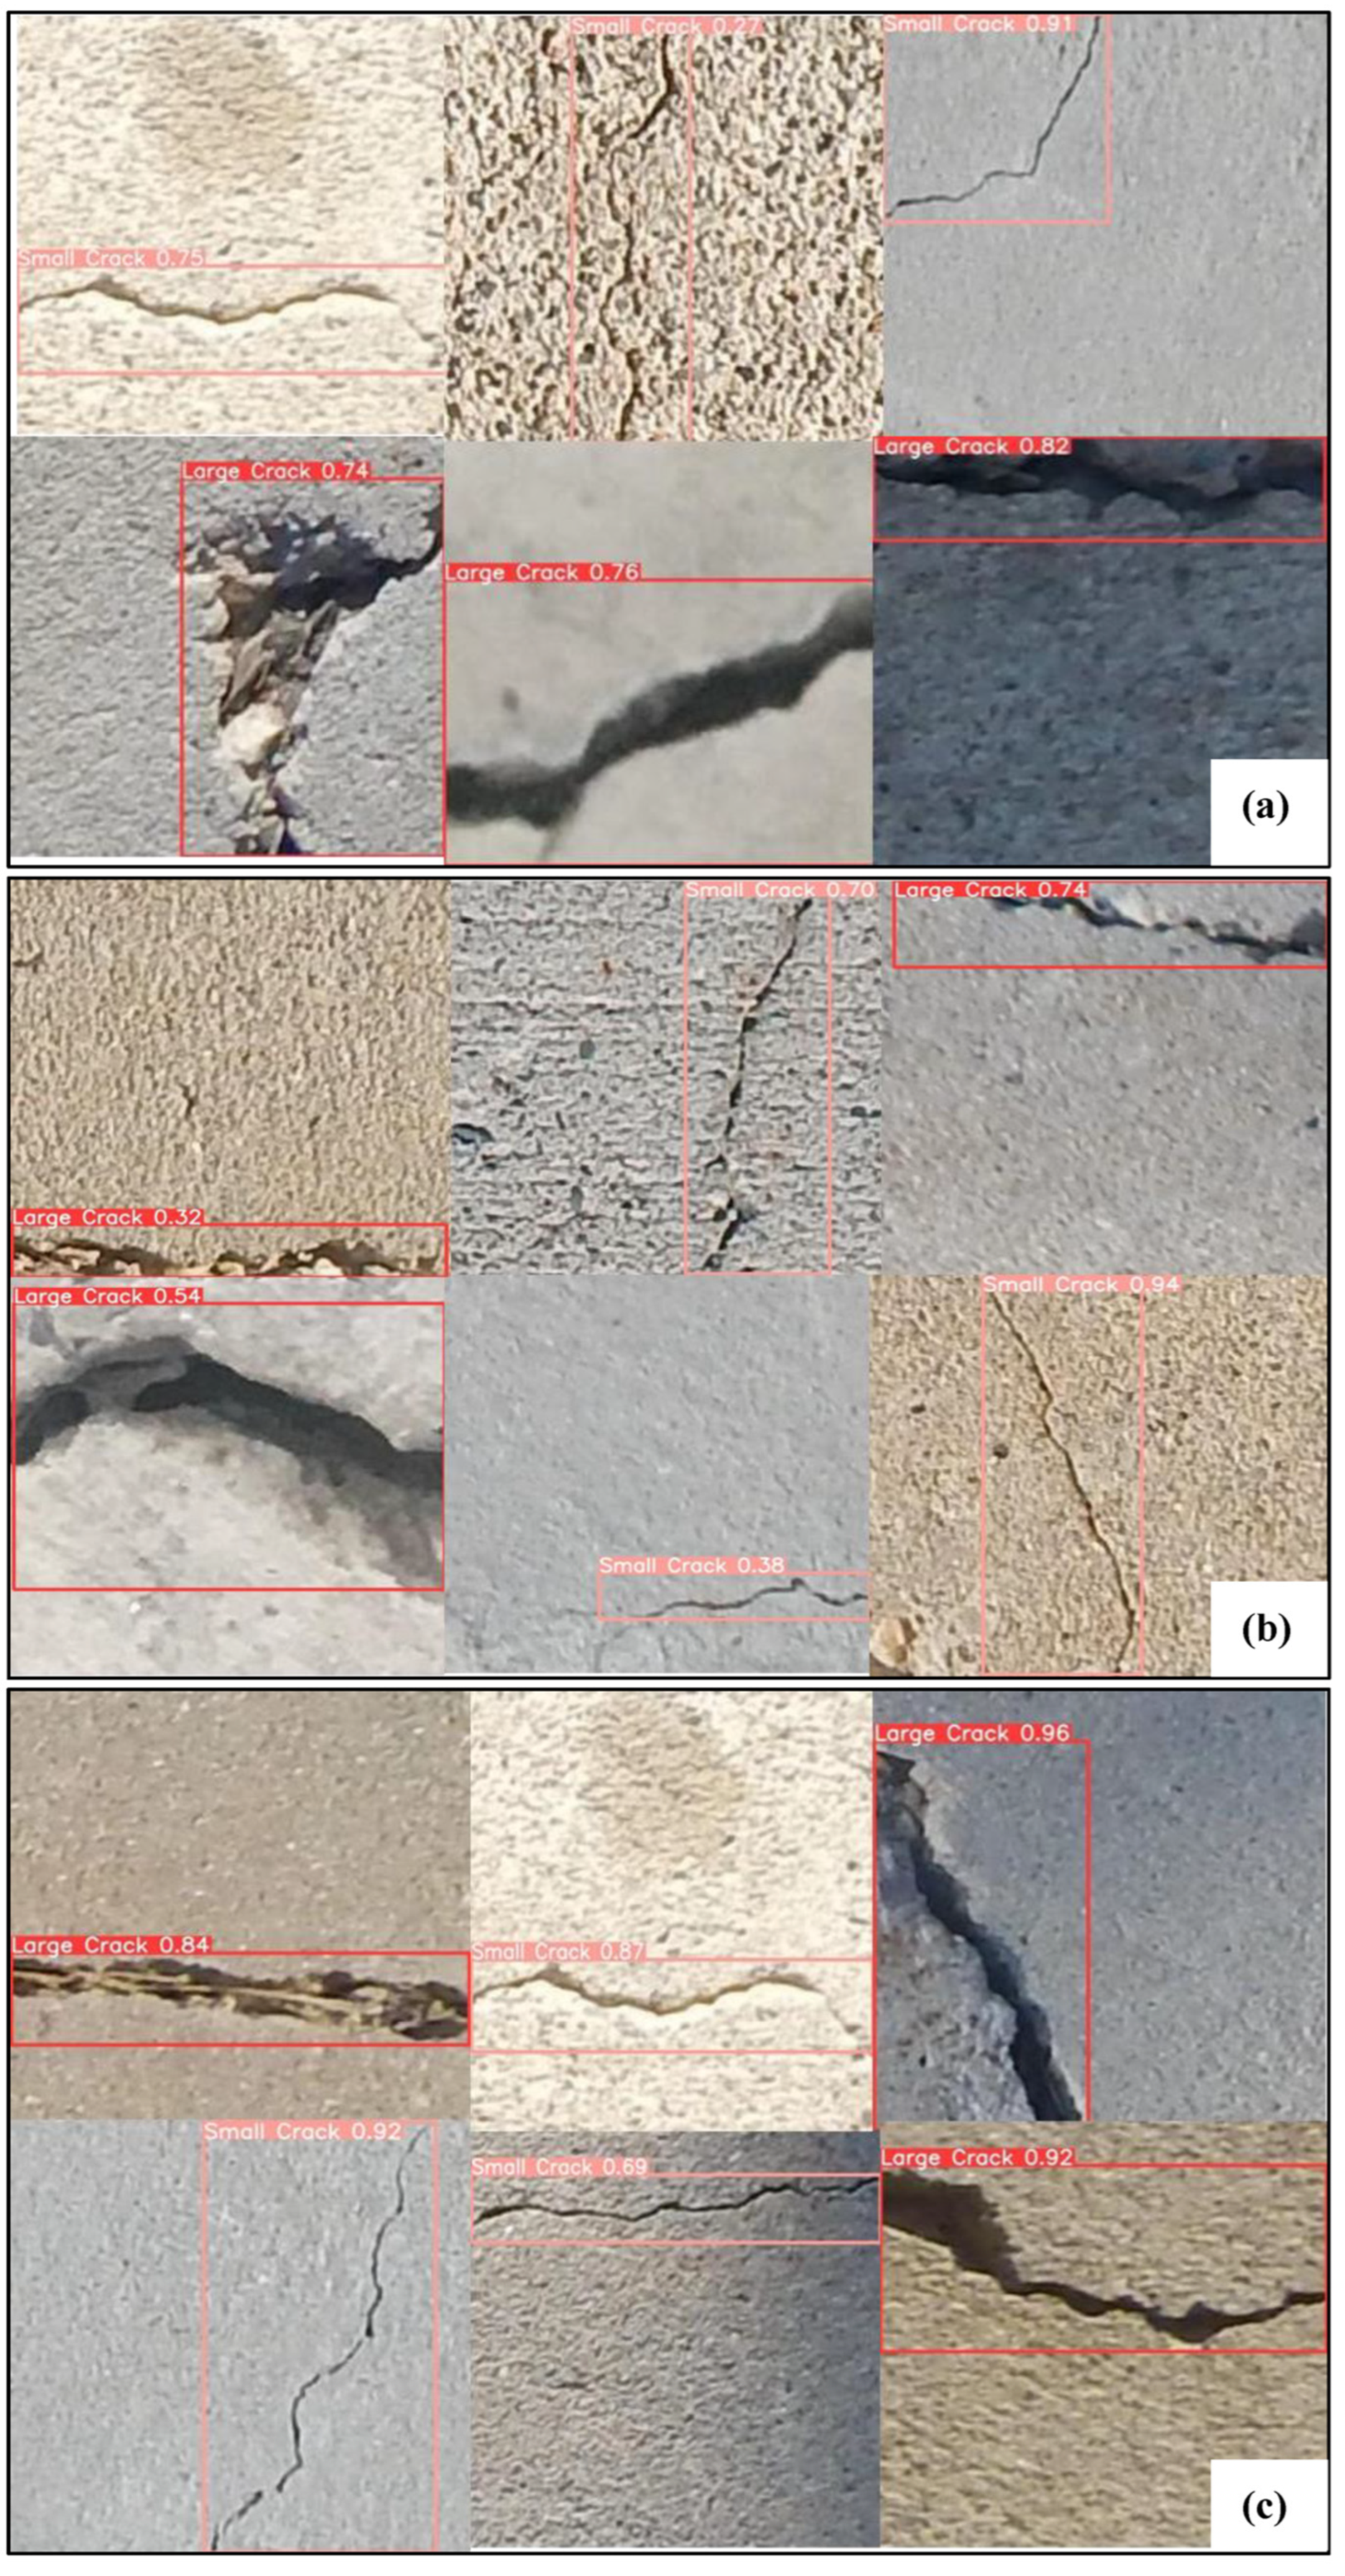
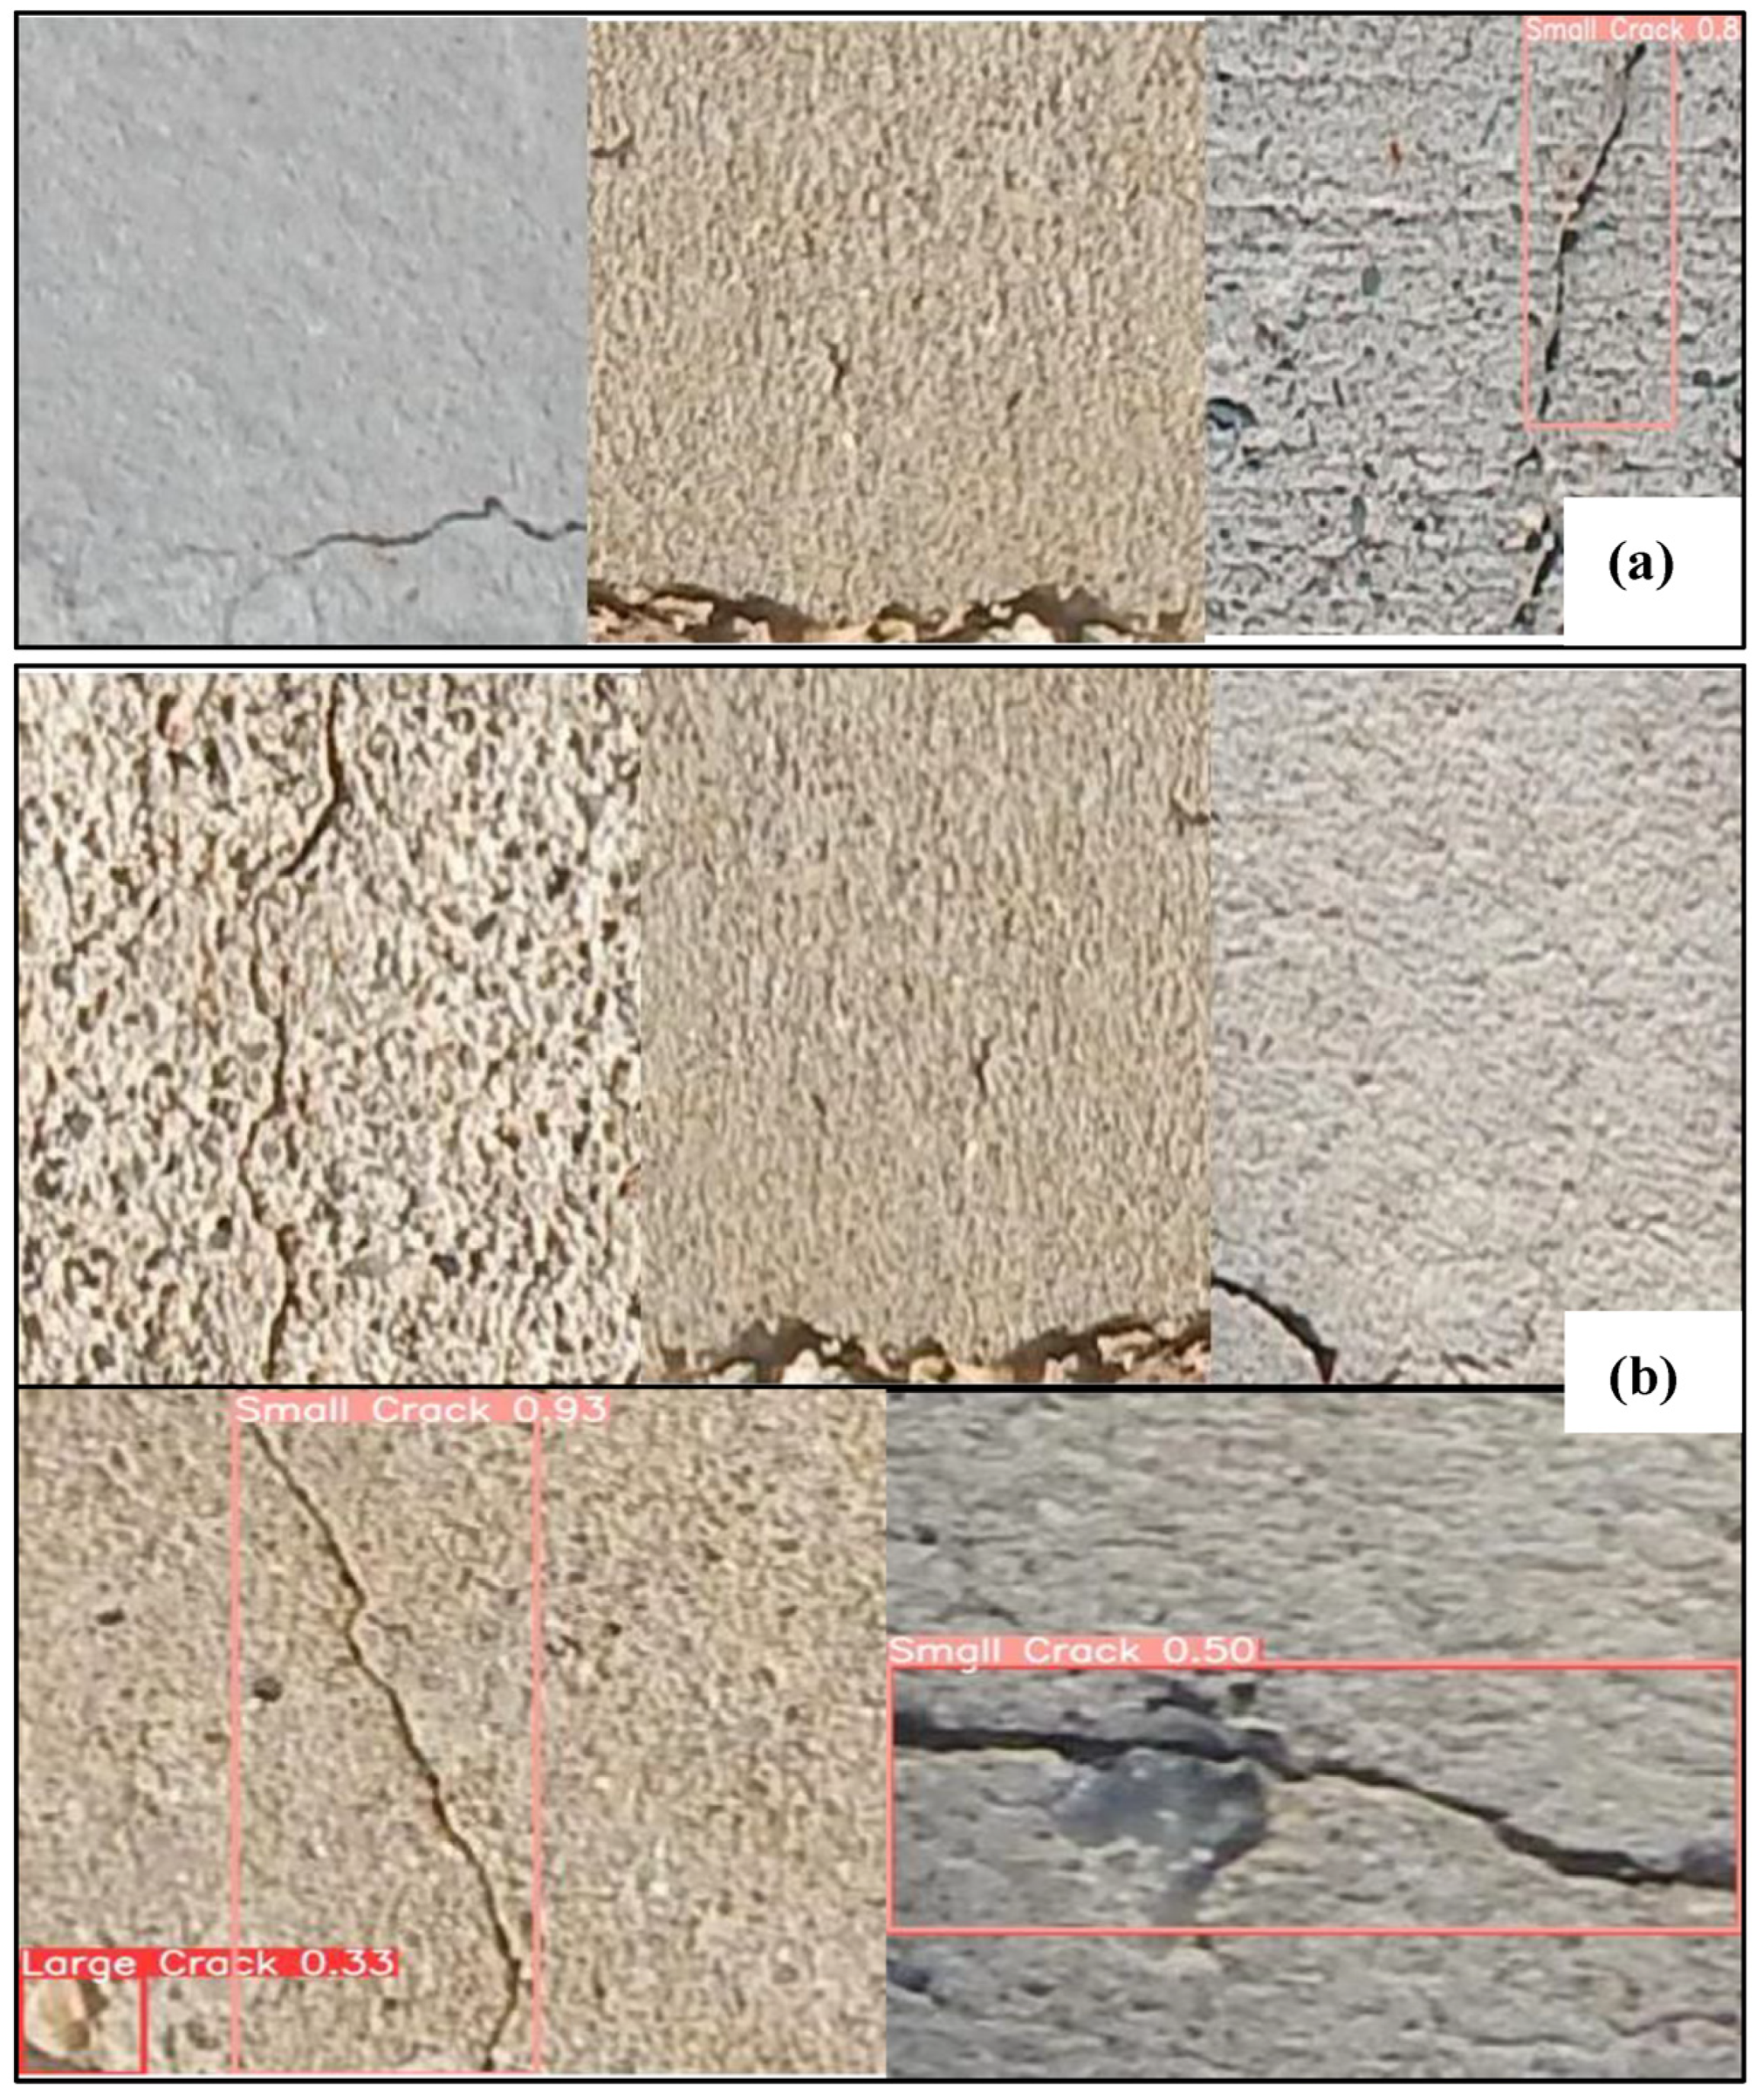
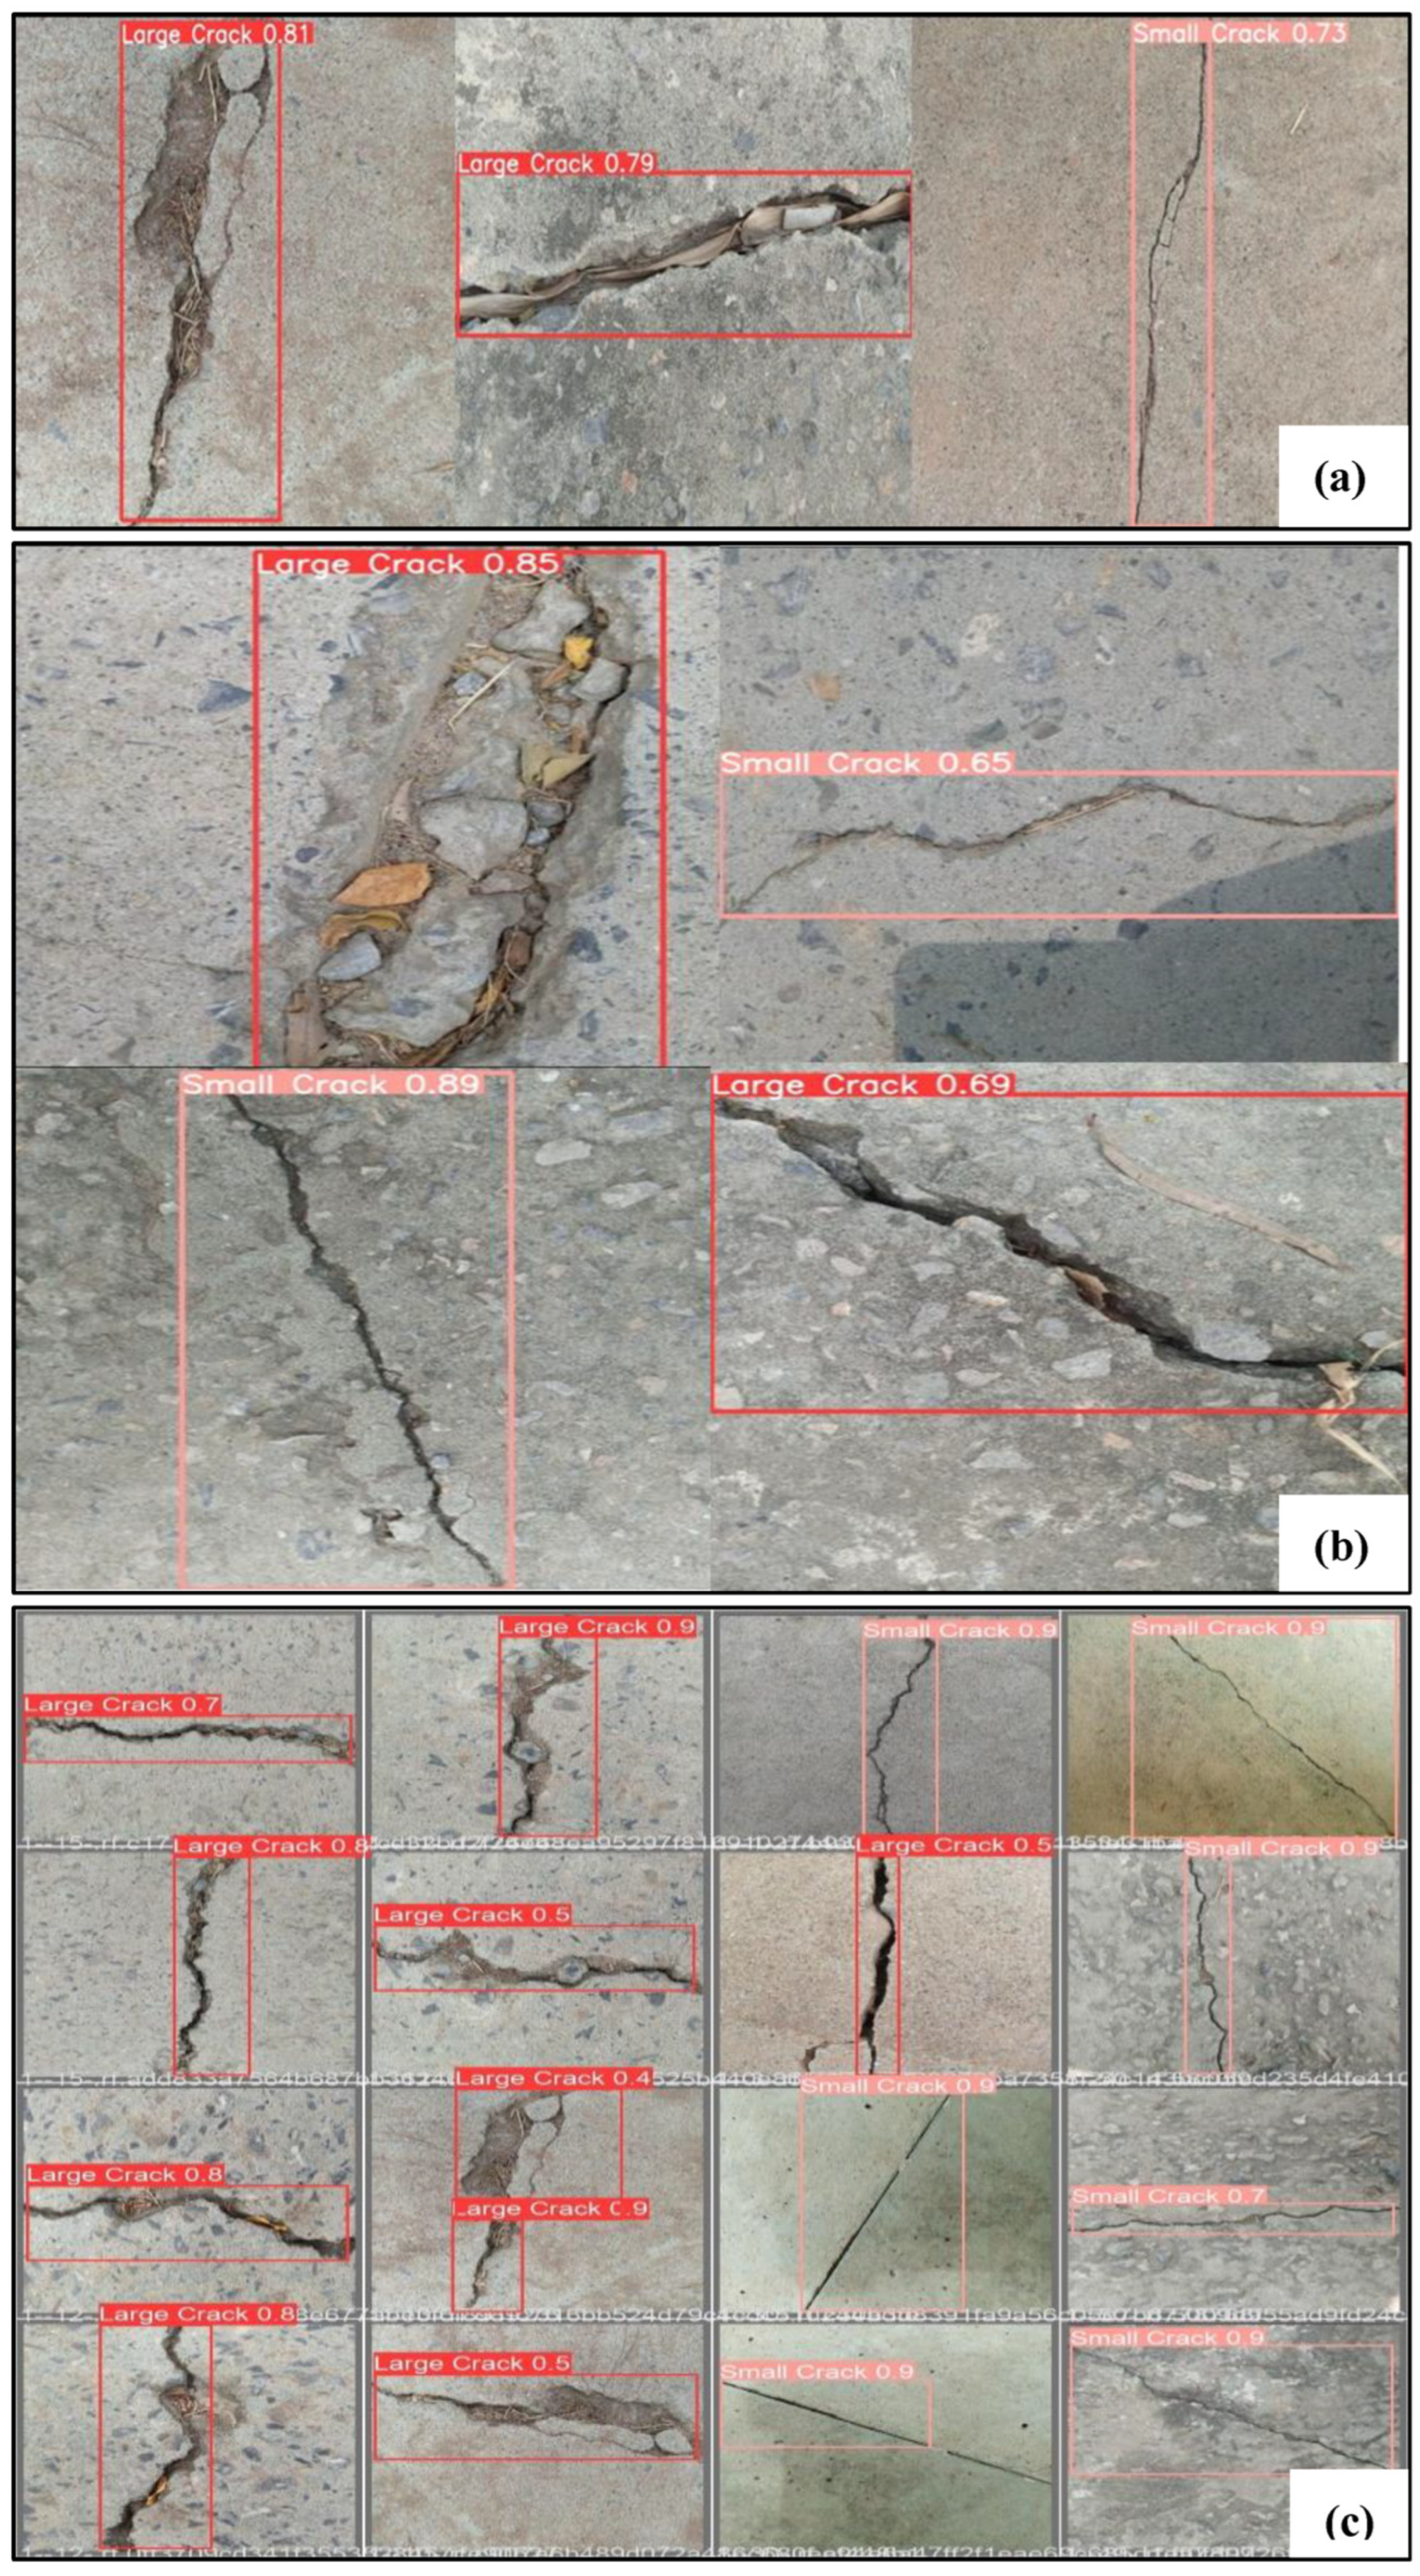
4.4. Crack Detection Results

The model is tested on a test dataset to determine how well it performs quantitative and qualitatively. For example, for testing the model variants on detecting cracks (object), the two test sets are fed to the YOLOv5 models used in the study, and the results are compared for holistic assessment.

4.4.1. Crack Detection Results of YOLOv5 Models Using SDNET2018 Dataset

Table 10 presents the total, correct, and inaccurate detections of the YOLOv5 models used in the current study based on the 219 test images from the SDNET2018 dataset. The results show that all YOLOv5 models have excellent accuracy for crack detection. Out of the 219 images, YOLOv5s accurately detected cracks in 217, YOLOv5m in all 219, and YOLOv5l in 216. In terms of wrong or missed detections, YOLOv5s missed two cracks, and YOLOv5l missed three.
Figure 9 shows samples of the correctly detected cracks. Figure 9a represents the results of YOLOv5s, Figure 9b illustrates the results of YOLOv5m, and Figure 9c depicts the results of YOLOv5l.
Similarly, Figure 10 shows samples of incorrect or missed detections using the tested models of the current study. Figure 10a represents the results of YOLOv5s, and Figure 10b illustrates the results of YOLOv5l. The YOLOv5m accurately detected all cracks. Figure 10a shows that YOLOv5s detection has noise, did not detect cracks in two images, and partially detected cracks in another image. Figure 10b shows that the YOLOv5l model did not detect cracks in images under different illumination conditions and missed the crack present at the image border. Further, a stone is classified as a crack by the YOLOv5l model.

4.4.2. Crack Detection Results of YOLOv5 Models Using the Pakistani Dataset

Table 11 presents the total, correct, and inaccurate detections of the YOLOv5 models used in the current study based on the 201 test images collected from the case study bridges in Pakistan. The results show that all YOLOv5 models have reasonably good accuracy for crack detection. Out of the 201 images, YOLOv5s accurately detected cracks in 190 and missed or wrongly classified 11 cracks. YOLOv5m detected the correct type of crack in 195 images and incorrectly identified/missed cracks in six images. YOLOv5l detected the correct type of crack in 182 images and missed or wrongly classified 19 images with cracks.
Figure 11 shows samples of the correctly detected cracks using the tested models. Figure 11a represents the results of YOLOv5s, Figure 11b illustrates the results of YOLOv5m, and Figure 11c depicts the results of YOLOv5l.

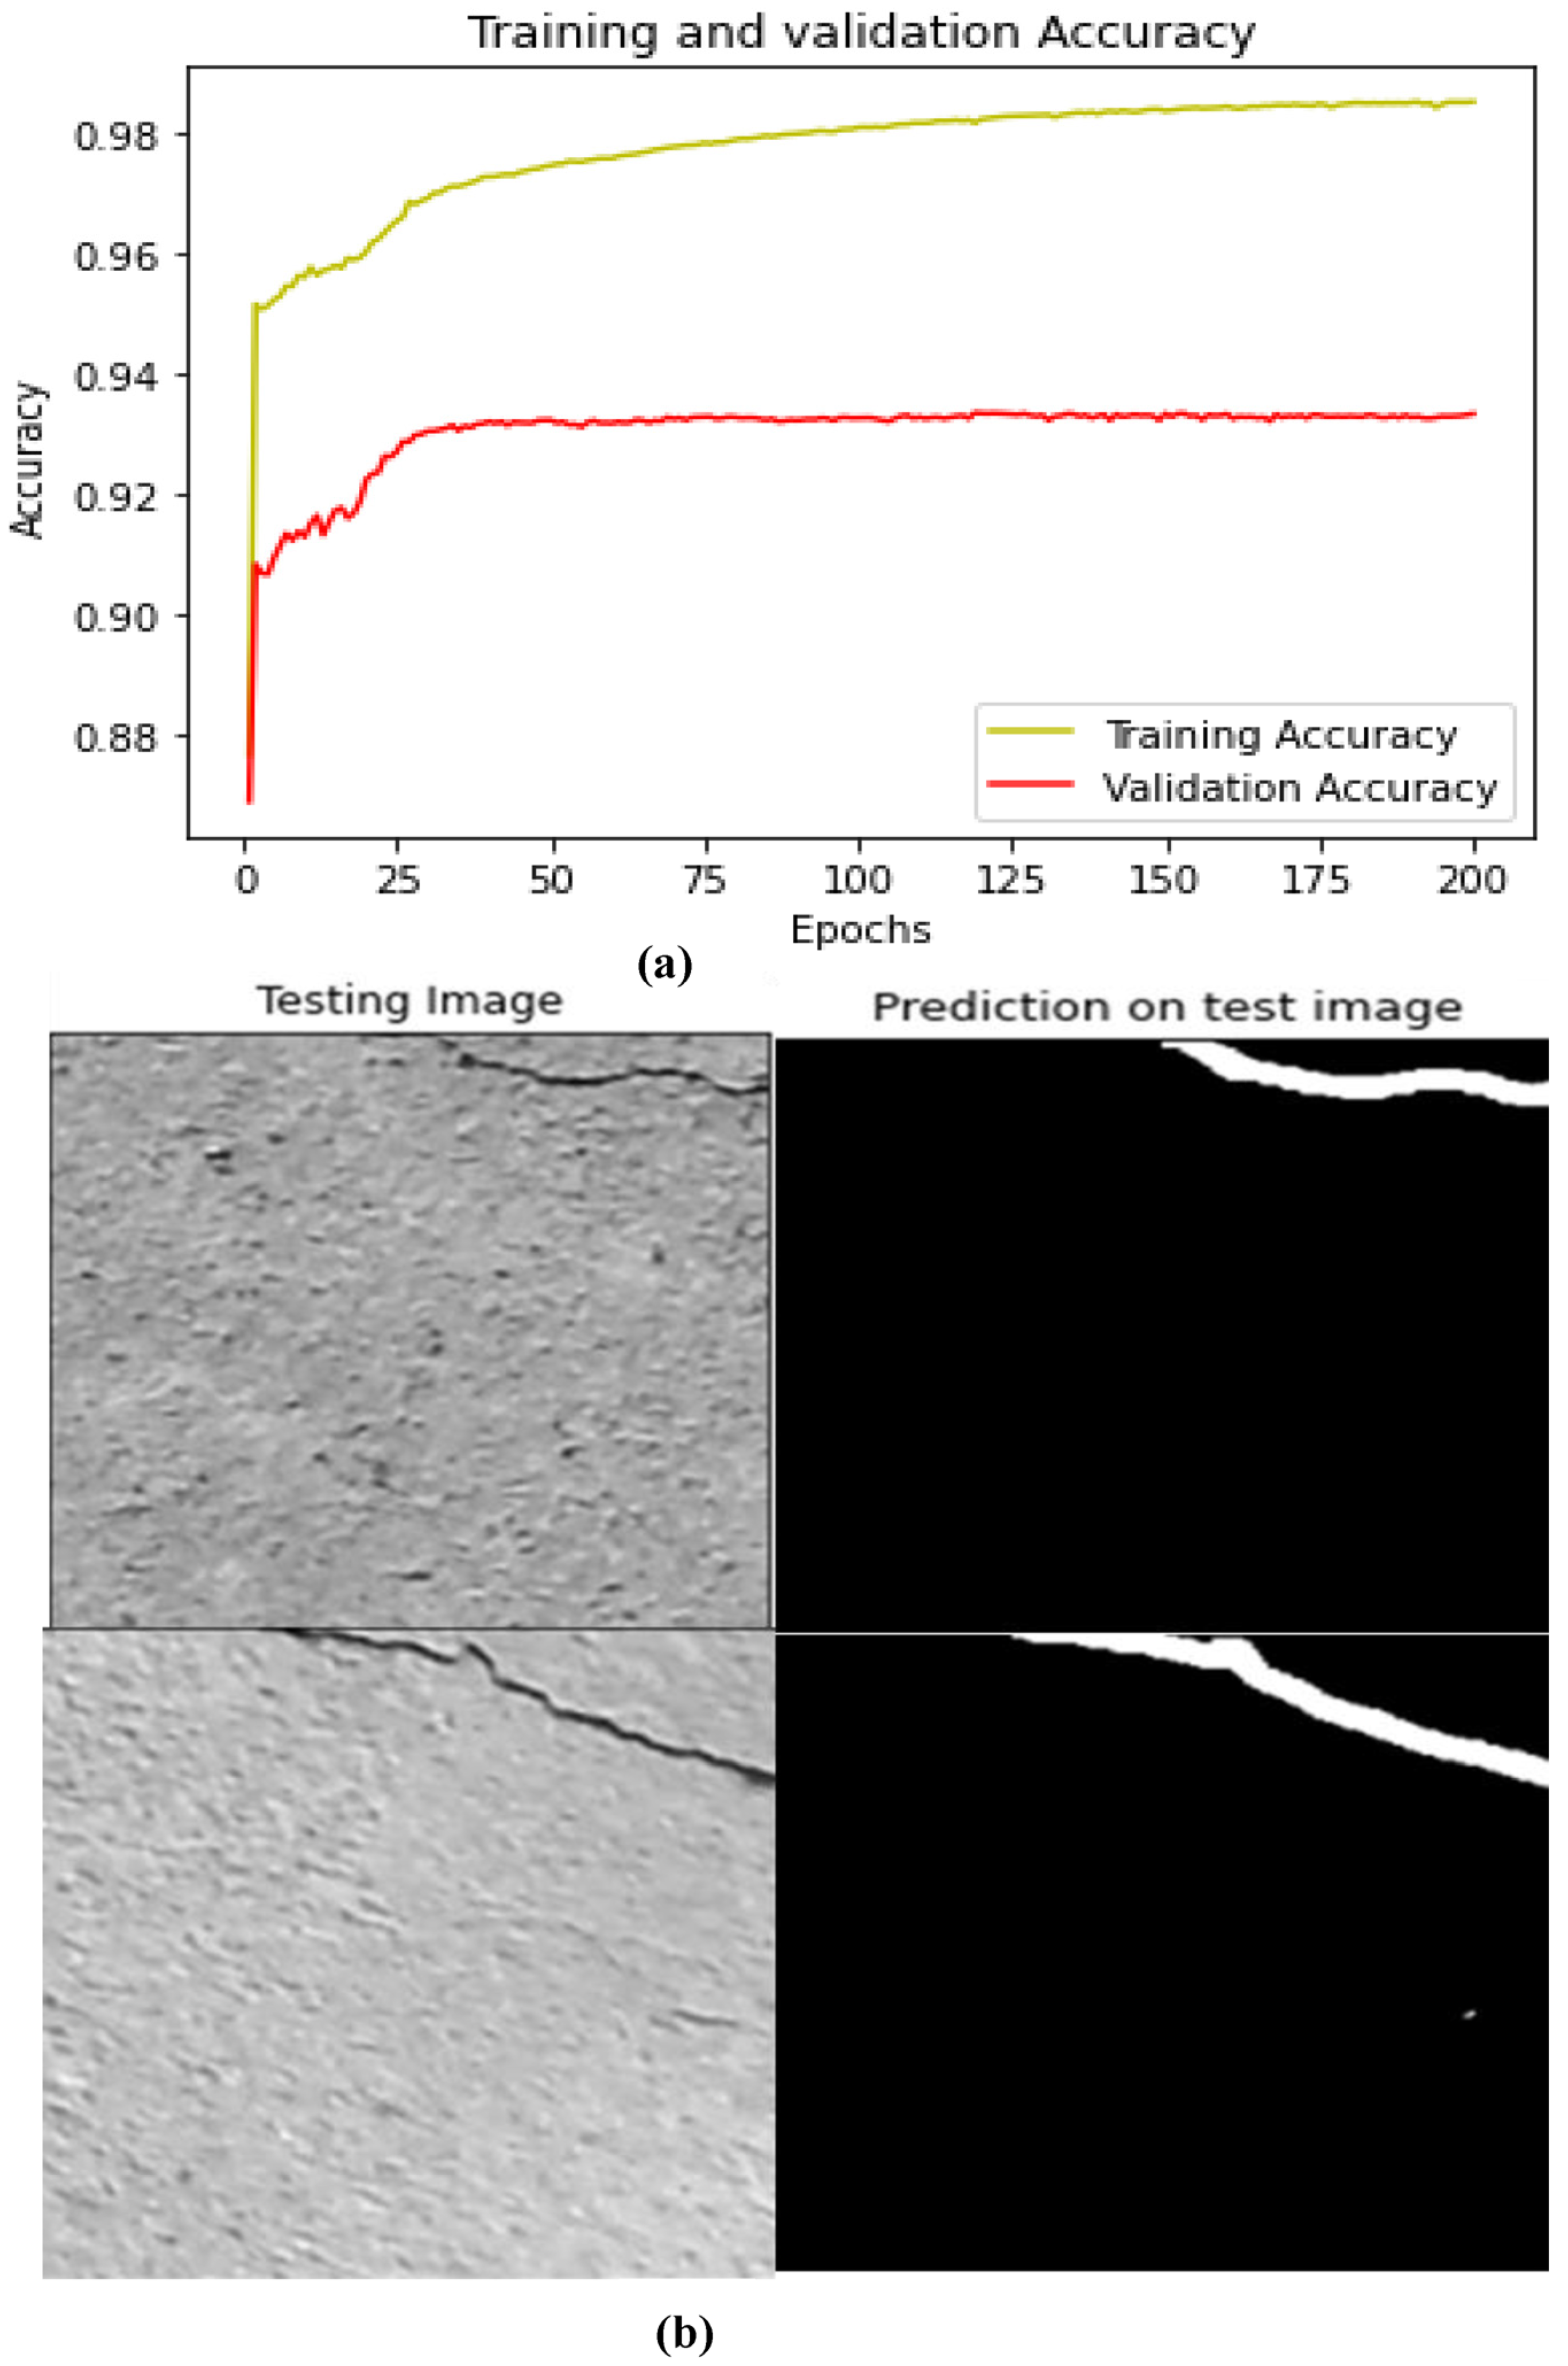
4.5. Segmentation Results

This section presents the segmentation results on the SDNET2018 dataset using the U-Net model. The numbers of test and validation images and the accuracy of the training and validation dataset are presented in Table 12. A batch size of 12 and 200 epochs was used in this study. The U-Net model achieved 98.3% accuracy on training data and 93.4% on validation data, as shown in Figure 12. Figure 12a represents the training and accuracy curves of the U-Net segmentation, and Figure 12b shows the tested images and predicted results. In this experiment, 112 randomly selected images are tested.

4.5.1. Crack Size Measurement

The segmentation mask is obtained after testing measures the crack’s area, width, and height. The size of the crack is calculated in pixels, as shown in Figure 13. The subcomponents, i.e., Figure 13a–d, show different crack pixels and their heights and widths.

4.5.2. Crack Size Variations

In this step, the variations in the detected crack sizes are plotted to visualize them systematically. Scatter and box plots have been used to visualize the crack variations using the width, height, area, and width and height ratio, as shown in Figure 14. Figure 14a shows the variations in crack sizes, where a prominent grouping of clusters is evident, showing the efficiency of the techniques used in this study for detecting cracks. The variations are more apparent in larger cracks. As defined in the method, anything beyond a certain threshold was deemed a large crack. This reflects the usefulness of the utilized techniques and their potential for dealing with more classes in the future. Figure 14b represents the box plot for cracks based on their areas and visualizes their spread. Figure 14c represents the box plot for cracks based on their heights, widths, and pertinent ratios.

4.6. Comparison with Previous YOLO Models

To verify the study’s results, it is essential to compare the current model’s accuracy with previous YOLO models presented in the literature. The two main YOLO models presented in the published research are YOLOv3-SPP [87] and YOLOv4 [88]. Accordingly, the results of the YOLOv5m presented in this study are compared with the previous models. For this purpose, we fed our dataset to the YOLOv3-SPP and YOLOv4 models, computed the values of the mAP, and documented the results for comparison. The results of this exercise are presented in Table 13. By comparing the results, it can be noted that the YOLOv5m model utilized in the current study displayed superior performance on the given datasets compared to the previous versions, i.e., YOLOv3-SPP and YOLOv4. Thus, it is evident that the current model is superior to the earlier models and can be utilized in similar studies with greater confidence. Overall, the YOLOV5m model utilized in this study shows mAP value of 98.3% compared to 95.1 (YOLOv4) and 94.1 (YOLOv3-SPP), thus showing an improvement of more than 3% in terms of mAP. For precision, the pertinent values are 97.4%, 96%, and 90.3% for the current model, YOLOv4, and YOLOv3-SPP, respectively. Similarly, for recall, the variations are even greater, with 96.6%, 90%, and 87.5% values for the current model, YOLOv4, and YOLOv3-SPP, respectively. This shows that the current model outperforms all previous versions in all assessment criteria considered in the present study and proves to be an improved YOLO version.

5. Conclusions

Identifying and assessing cracks are crucial to determining the health of critical infrastructure such as bridges. Millions of dollars are spent yearly on special equipment and human visual inspectors to detect cracks in civil infrastructures such as roads, bridges, and buildings. Historically, critical city infrastructure, such as bridges, has been monitored manually. This manual inspection process is carried out by experienced inspectors. The process requires more time and relies on the inspector’s subjective and empirical expertise. This process is costly and inconsistent due to the involvement of multiple parameters. Further, it causes inconvenience to local people and traffic, resulting in significant travel delays due to road or lane closures. To address this issue, a more automated process is needed.
In this study, we proposed a deep learning-based approach to detect and assess the cracks in bridges in developing countries for smart infrastructure management. A total of 2270 bridge images of resolution 640 × 640 consisting of variable size cracks (small and large) are collected and labeled using the “LabelMe” tool. Of the total images, 70% are used for training, 20% for validation, and 10% for testing. The study was conducted in two parts. First, we detected cracks in the dataset images using YOLOv5 variants. The severity levels of the cracks were assessed during this detection process. Next, three models of YOLOv5, including s, m, and l, were trained, validated, and tested on the dataset. The mAP values of all the models were compared to evaluate their performance. The mAP values of 97.8%, 99.3%, and 99.1% were obtained for YOLOv5 s, m, and l, respectively. Compared to the YOLOv5s and YOLOv5l, the YOLOv5m model showed superior performance.
In the second part of the study, the U-Net model was used for semantic segmentation of the dataset images to get the exact pixel of cracks. The output mask of U-Net was applied to the attribute extractor to calculate the crack’s width, height, and area in pixels for visualization purposes. Finally, the scatter and box plots were plotted using extracted attributes. The results show that both types of cracks have a clear difference indicating the strength of detection and assessment of the models.
Overall, this study not only located and classified the cracks based on their severity level, but also segmented the crack pixels and measured the width, height, and area of cracks per pixel. All cracks were accurately detected under different lighting conditions, including the cracks on the image border regions using the YOLOv5m variant. The mAP values were also calculated and compared with the older versions of YOLO, such as the YOLOv3-Spp and the YOLOv4, for a more precise comparison. YOLOv3-Spp and YOLOv4 have mAP of 94.1% and 95.1%, respectively, which is 4.2% and 3.2% less than the mAP of the YOLOv5m used in the current study.
This study is relevant to and humbly addresses the structural health monitoring needs of developing countries. When fully leveraged, the proposed model will help boost tourism due to increased traveler confidence in the host country’s infrastructure. The remote access feature of the images and the bypassing of the need to call in expensive specialist inspectors are other advantages for developing countries in addition to fewer bridge collapses, and enhanced emergency responses and victim evacuations in case of other natural disasters.
The current study is one of the few studies targeting low-cost assessment of, and damage detection in, bridges in developing countries that otherwise struggle with regular maintenance and rehabilitation of such critical infrastructure. The model utilized in the current study can be used by local infrastructure monitoring and rehabilitation authorities for regular condition and health assessment of the bridges. Authorities such as Provincial Disaster Management Authority (PDMA) in Pakistan can benefit from such holistic systems. This is critical in conducting post-disaster studies and preventing disasters that can result in the loss of human lives and strain developing countries’ economies. Furthermore, in countries like Pakistan, the study is important to tackle the ever-increasing effects of climate change resulting in floods and damaged infrastructure.
Limitations and Future Work
The current study is limited in terms of the image dataset and the models used. For example, it used only 2270 images with limited crack types and the YOLOv5 (s, m, and l) models. In the future, larger datasets, including more images and classes of cracks, can be used to compare the model’s accuracy over larger datasets. Furthermore, different models and algorithms can be used, and results compared with the current study to reach a more holistic conclusion. Similarly, the developed system may be modified and trained to recognize cracks in any environment, including low light, darkness, and other variations, especially in case of ongoing disasters such as heavy rains and floods where the light situation is less than ideal. Also, crack width and height can be determined (in mm) by specifying camera resolution and capturing the photo at a defined distance or using advanced tools such as LIDAR for real-time crack detection.

Author Contributions

Conceptualization, H.I., N.U.I., M.U.A. and F.U.; methodology, H.I., N.U.I., M.U.A. and F.U.; software, H.I.; validation, H.I., N.U.I., M.U.A. and F.U.; formal analysis, H.I.; investigation, H.I.; resources, F.U.; data curation, H.I., N.U.I., M.U.A. and F.U.; writing—original draft preparation, H.I.; writing—review and editing, N.U.I., M.U.A. and F.U.; visualization, H.I.; supervision, N.U.I., M.U.A. and F.U.; project administration, N.U.I., M.U.A. and F.U.; funding acquisition, F.U. All authors have read and agreed to the published version of the manuscript.

Funding

This research received no external funding.

Institutional Review Board Statement

Not applicable.

Informed Consent Statement

Not applicable.

Data Availability Statement

Data are available from the first author and can be shared upon reasonable request.

Acknowledgments

The authors acknowledge the support from the National University of Science and Technology (NUST) Pakistan and the University of Southern Queensland (UniSQ) Australia for conducting this study.

Conflicts of Interest

The authors declare no conflict of interest.

References

  1. Hu, W.; Wang, W.; Ai, C.; Wang, J.; Wang, W.; Meng, X.; Liu, J.; Tao, H.; Qiu, S. Machine vision-based surface crack analysis for transportation infrastructure. Autom. Constr. 2021, 132, 103973. [Google Scholar] [CrossRef]
  2. Munawar, H.S.; Ullah, F.; Shahzad, D.; Heravi, A.; Qayyum, S.; Akram, J. Civil infrastructure damage and corrosion detection: An application of machine learning. Buildings 2022, 12, 156. [Google Scholar] [CrossRef]
  3. Islam, N.U.; Lee, S. Cross domain image transformation using effective latent space association. In Proceedings of the International Conference on Intelligent Autonomous Systems, Singapore, 1–3 March 2018; pp. 706–716. [Google Scholar]
  4. Munawar, H.S.; Ullah, F.; Heravi, A.; Thaheem, M.J.; Maqsoom, A. Inspecting Buildings Using Drones and Computer Vision: A Machine Learning Approach to Detect Cracks and Damages. Drones 2021, 6, 5. [Google Scholar] [CrossRef]
  5. Maqsoom, A.; Aslam, B.; Yousafzai, A.; Ullah, F.; Ullah, S.; Imran, M. Extracting built-up areas from spectro-textural information using machine learning. Soft Comput. 2022, 26, 7789–7808. [Google Scholar] [CrossRef]
  6. Qiao, W.; Ma, B.; Liu, Q.; Wu, X.; Li, G. Computer vision-based bridge damage detection using deep convolutional networks with expectation maximum attention module. Sensors 2021, 21, 824. [Google Scholar] [CrossRef]
  7. Ullah, F. Smart Tech 4.0 in the Built Environment: Applications of Disruptive Digital Technologies in Smart Cities, Construction, and Real Estate. Buildings 2022, 12, 1516. [Google Scholar] [CrossRef]
  8. Sirshar, M.; Paracha, M.F.K.; Akram, M.U.; Alghamdi, N.S.; Zaidi, S.Z.Y.; Fatima, T. Attention based automated radiology report generation using CNN and LSTM. PLoS ONE 2022, 17, e0262209. [Google Scholar] [CrossRef]
  9. Islam, N.U.; Lee, S. Interpretation of deep CNN based on learning feature reconstruction with feedback weights. IEEE Access 2019, 7, 25195–25208. [Google Scholar] [CrossRef]
  10. Lee, S.; Islam, N.U. Robust image translation and completion based on dual auto-encoder with bidirectional latent space regression. IEEE Access 2019, 7, 58695–58703. [Google Scholar] [CrossRef]
  11. Chen, L.; Chen, W.; Wang, L.; Zhai, C.; Hu, X.; Sun, L.; Tian, Y.; Huang, X.; Jiang, L. Convolutional neural networks (CNNs)-based multi-category damage detection and recognition of high-speed rail (HSR) reinforced concrete (RC) bridges using test images. Eng. Struct. 2023, 276, 115306. [Google Scholar] [CrossRef]
  12. Li, R.; Yu, J.; Li, F.; Yang, R.; Wang, Y.; Peng, Z. Automatic bridge crack detection using Unmanned aerial vehicle and Faster R-CNN. Constr. Build. Mater. 2023, 362, 129659. [Google Scholar] [CrossRef]
  13. Islam, N.U.; Lee, S.; Park, J. Accurate and consistent image-to-image conditional adversarial network. Electronics 2020, 9, 395. [Google Scholar] [CrossRef] [Green Version]
  14. Mushtaq, M.; Akram, M.U.; Alghamdi, N.S.; Fatima, J.; Masood, R.F. Localization and Edge-Based Segmentation of Lumbar Spine Vertebrae to Identify the Deformities Using Deep Learning Models. Sensors 2022, 22, 1547. [Google Scholar] [CrossRef] [PubMed]
  15. Liu, W.; Anguelov, D.; Erhan, D.; Szegedy, C.; Reed, S.; Fu, C.-Y.; Berg, A.C. Ssd: Single shot multibox detector. In Proceedings of the European Conference on Computer Vision, Amsterdam, The Netherlands, 8–6 October 2016; pp. 21–37. [Google Scholar]
  16. Liu, C.; Tao, Y.; Liang, J.; Li, K.; Chen, Y. Object detection based on YOLO network. In Proceedings of the 2018 IEEE 4th Information Technology and Mechatronics Engineering Conference (ITOEC), Chongqing, China, 14–16 December 2018; pp. 799–803. [Google Scholar]
  17. Ren, S.; He, K.; Girshick, R.; Sun, J. Faster r-cnn: Towards real-time object detection with region proposal networks. Adv. Neural Inf. Process. Syst. 2015, 28, 1–9. [Google Scholar] [CrossRef] [Green Version]
  18. He, K.; Zhang, X.; Ren, S.; Sun, J. Spatial pyramid pooling in deep convolutional networks for visual recognition. IEEE Trans. Pattern Anal. Mach. Intell. 2015, 37, 1904–1916. [Google Scholar] [CrossRef] [Green Version]
  19. Fatima, J.; Mohsan, M.; Jameel, A.; Akram, M.U.; Muzaffar Syed, A. Vertebrae localization and spine segmentation on radiographic images for feature-based curvature classification for scoliosis. Concurr. Comput. Pract. Exp. 2022, 34, e7300. [Google Scholar] [CrossRef]
  20. Bochkovskiy, A.; Wang, C.-Y.; Liao, H.-Y.M. Yolov4: Optimal speed and accuracy of object detection. arXiv 2020, arXiv:2004.10934. [Google Scholar]
  21. Wu, W.; Liu, H.; Li, L.; Long, Y.; Wang, X.; Wang, Z.; Li, J.; Chang, Y. Application of local fully Convolutional Neural Network combined with YOLO v5 algorithm in small target detection of remote sensing image. PLoS ONE 2021, 16, e0259283. [Google Scholar] [CrossRef]
  22. Wynne, Z.; Stratford, T.; Reynolds, T.P. Perceptions of long-term monitoring for civil and structural engineering. In Proceedings of the Structures, Atlanta, GA, USA, 20–23 April 2022; pp. 1616–1623. [Google Scholar]
  23. Bao, Y.; Tang, Z.; Li, H.; Zhang, Y. Computer vision and deep learning–based data anomaly detection method for structural health monitoring. Struct. Health Monit. 2019, 18, 401–421. [Google Scholar] [CrossRef]
  24. Choudhry, R.M.; Aslam, M.A.; Hinze, J.W.; Arain, F.M. Cost and schedule risk analysis of bridge construction in Pakistan: Establishing risk guidelines. J. Constr. Eng. Manag. 2014, 140, 04014020. [Google Scholar] [CrossRef]
  25. Dawn. Pakistan: 70 Killed in NWFP Rain, Floods—Mardan Bridge Collapses. Dawn. 6 August 2006. Available online: https://www.dawn.com/news/204850/70-killed-in-nwfp-rain-floods-mardan-bridge-collapses (accessed on 15 December 2022).
  26. Najam, A. Many Killed and Injured as Karachi’s Shershah Bridge Collapses; More Still Trapped. Available online: https://pakistaniat.com/2007/09/01/pakistan-karachi-shersha-bridge-collapse-dead-infrastructure-killed-bridge/ (accessed on 14 October 2022).
  27. Pakistan Bridge Collapse Death Toll at 10. Available online: https://www.upi.com/Top_News/2007/09/02/Pakistan-bridge-collapse-death-toll-at-10/33361188736809/?st_rec=59951186106548&u3L=1 (accessed on 14 October 2022).
  28. Desk, W. Neelum Valley’s Kundal Shahi bridge Takes 40 People down with It. Daily Times. 14 May 2018. Available online: https://dailytimes.com.pk/239950/rescue-operation-to-recover-missing-students-in-neelam-valley-continues (accessed on 15 December 2022).
  29. Jamal, S. Pakistan: 25 Tourists Feared Dead as Bridge Collapses in Neelum Valley. Gulf News, 13 May 2018. [Google Scholar]
  30. Davies, R. Pakistan—Massive Floods Destroy Bridge in Gilgit-Baltistan. FloodList, 8 May 2022. [Google Scholar]
  31. Dawn. Under-Construction Bridge on Swabi-Mardan Road Collapses. Dawn. 27 January 2022. Available online: https://www.dawn.com/news/1671676 (accessed on 15 December 2022).
  32. Gong, M.; Chen, J. Numerical investigation of load-induced fatigue cracking in curved ramp bridge deck pavement considering tire-bridge interaction. Constr. Build. Mater. 2022, 353, 129119. [Google Scholar] [CrossRef]
  33. Talukdar, S.; Banthia, N.; Grace, J.; Cohen, S. Climate change-induced carbonation of concrete infrastructure. Proc. Inst. Civ. Eng.-Constr. Mater. 2014, 167, 140–150. [Google Scholar] [CrossRef]
  34. Ababneh, A.N.; Al-Rousan, R.Z.; Alhassan, M.A.; Sheban, M.A. Assessment of shrinkage-induced cracks in restrained and unrestrained cement-based slabs. Constr. Build. Mater. 2017, 131, 371–380. [Google Scholar] [CrossRef]
  35. Wang, T.-T. Characterizing crack patterns on tunnel linings associated with shear deformation induced by instability of neighboring slopes. Eng. Geol. 2010, 115, 80–95. [Google Scholar] [CrossRef]
  36. Sun, B.; Xiao, R.-c.; Ruan, W.-d.; Wang, P.-b. Corrosion-induced cracking fragility of RC bridge with improved concrete carbonation and steel reinforcement corrosion models. Eng. Struct. 2020, 208, 110313. [Google Scholar] [CrossRef]
  37. Zhang, C.; Cai, J.; Cheng, X.; Zhang, X.; Guo, X.; Li, Y. Interface and crack propagation of cement-based composites with sulfonated asphalt and plasma-treated rock asphalt. Constr. Build. Mater. 2020, 242, 118161. [Google Scholar] [CrossRef]
  38. Wan, M. Discussion on Crack Control in Road Bridge Design and Construction. J. World Archit. 2020, 4, 14–16. [Google Scholar] [CrossRef]
  39. Alshboul, O.; Shehadeh, A.; Tatari, O.; Almasabha, G.; Saleh, E. Multiobjective and multivariable optimization for earthmoving equipment. J. Facil. Manag. 2022. [Google Scholar] [CrossRef]
  40. Alshboul, O.; Shehadeh, A.; Almasabha, G.; Almuflih, A.S. Extreme Gradient Boosting-Based Machine Learning Approach for Green Building Cost Prediction. Sustainability 2022, 14, 6651. [Google Scholar] [CrossRef]
  41. Salman, M.; Mathavan, S.; Kamal, K.; Rahman, M. Pavement crack detection using the Gabor filter. In Proceedings of the 16th International IEEE Conference on Intelligent Transportation Systems (ITSC 2013), The Hague, The Netherlands, 6–9 October 2013; pp. 2039–2044. [Google Scholar]
  42. Lins, R.G.; Givigi, S.N. Automatic crack detection and measurement based on image analysis. IEEE Trans. Instrum. Meas. 2016, 65, 583–590. [Google Scholar] [CrossRef]
  43. Nishikawa, T.; Yoshida, J.; Sugiyama, T.; Fujino, Y. Concrete crack detection by multiple sequential image filtering. Comput.-Aided Civ. Infrastruct. Eng. 2012, 27, 29–47. [Google Scholar] [CrossRef]
  44. Ying, L.; Salari, E. Beamlet transform-based technique for pavement crack detection and classification. Comput.-Aided Civ. Infrastruct. Eng. 2010, 25, 572–580. [Google Scholar] [CrossRef]
  45. Mstafa, R.J.; Younis, Y.M.; Hussein, H.I.; Atto, M. A new video steganography scheme based on Shi-Tomasi corner detector. IEEE Access 2020, 8, 161825–161837. [Google Scholar] [CrossRef]
  46. Fujita, Y.; Hamamoto, Y. A robust automatic crack detection method from noisy concrete surfaces. Mach. Vis. Appl. 2011, 22, 245–254. [Google Scholar] [CrossRef]
  47. Yeum, C.M.; Dyke, S.J. Vision-based automated crack detection for bridge inspection. Comput.-Aided Civ. Infrastruct. Eng. 2015, 30, 759–770. [Google Scholar] [CrossRef]
  48. Kong, X.; Li, J. Vision-based fatigue crack detection of steel structures using video feature tracking. Comput.-Aided Civ. Infrastruct. Eng. 2018, 33, 783–799. [Google Scholar] [CrossRef]
  49. Shan, B.; Zheng, S.; Ou, J. A stereovision-based crack width detection approach for concrete surface assessment. KSCE J. Civ. Eng. 2016, 20, 803–812. [Google Scholar] [CrossRef]
  50. Shi, Y.; Cui, L.; Qi, Z.; Meng, F.; Chen, Z. Automatic road crack detection using random structured forests. IEEE Trans. Intell. Transp. Syst. 2016, 17, 3434–3445. [Google Scholar] [CrossRef]
  51. Gavilán, M.; Balcones, D.; Marcos, O.; Llorca, D.F.; Sotelo, M.A.; Parra, I.; Ocaña, M.; Aliseda, P.; Yarza, P.; Amírola, A. Adaptive road crack detection system by pavement classification. Sensors 2011, 11, 9628–9657. [Google Scholar] [CrossRef] [PubMed]
  52. Oliveira, H.; Correia, P.L. Automatic road crack detection and characterization. IEEE Trans. Intell. Transp. Syst. 2012, 14, 155–168. [Google Scholar] [CrossRef]
  53. Zaidi, S.Z.Y.; Akram, M.U.; Jameel, A.; Alghamdi, N.S. A deep learning approach for the classification of TB from NIH CXR dataset. IET Image Process. 2022, 16, 787–796. [Google Scholar] [CrossRef]
  54. Alshboul, O.; Shehadeh, A.; Almasabha, G.; Mamlook, R.E.A.; Almuflih, A.S. Evaluating the impact of external support on green building construction cost: A hybrid mathematical and machine learning prediction approach. Buildings 2022, 12, 1256. [Google Scholar] [CrossRef]
  55. Alshboul, O.; Almasabha, G.; Shehadeh, A.; Mamlook, R.E.A.; Almuflih, A.S.; Almakayeel, N. Machine learning-based model for predicting the shear strength of slender reinforced concrete beams without stirrups. Buildings 2022, 12, 1166. [Google Scholar] [CrossRef]
  56. Aslam, B.; Maqsoom, A.; Cheema, A.H.; Ullah, F.; Alharbi, A.; Imran, M. Water quality management using hybrid machine learning and data mining algorithms: An indexing approach. IEEE Access 2022, 10, 119692–119705. [Google Scholar] [CrossRef]
  57. Bae, H.; Jang, K.; An, Y.-K. Deep super resolution crack network (SrcNet) for improving computer vision–based automated crack detectability in in situ bridges. Struct. Health Monit. 2021, 20, 1428–1442. [Google Scholar] [CrossRef]
  58. Islam, M.M.; Kim, J.-M. Vision-based autonomous crack detection of concrete structures using a fully convolutional encoder–decoder network. Sensors 2019, 19, 4251. [Google Scholar] [CrossRef] [PubMed] [Green Version]
  59. Dung, C.V. Autonomous concrete crack detection using deep fully convolutional neural network. Autom. Constr. 2019, 99, 52–58. [Google Scholar] [CrossRef]
  60. Yang, X.; Li, H.; Yu, Y.; Luo, X.; Huang, T.; Yang, X. Automatic pixel-level crack detection and measurement using fully convolutional network. Comput.-Aided Civ. Infrastruct. Eng. 2018, 33, 1090–1109. [Google Scholar] [CrossRef]
  61. Li, H.; Xu, H.; Tian, X.; Wang, Y.; Cai, H.; Cui, K.; Chen, X. Bridge crack detection based on SSENets. Appl. Sci. 2020, 10, 4230. [Google Scholar] [CrossRef]
  62. Xu, H.; Su, X.; Wang, Y.; Cai, H.; Cui, K.; Chen, X. Automatic bridge crack detection using a convolutional neural network. Appl. Sci. 2019, 9, 2867. [Google Scholar] [CrossRef] [Green Version]
  63. Cha, Y.J.; Choi, W.; Büyüköztürk, O. Deep learning-based crack damage detection using convolutional neural networks. Comput.-Aided Civ. Infrastruct. Eng. 2017, 32, 361–378. [Google Scholar] [CrossRef]
  64. Pauly, L.; Hogg, D.; Fuentes, R.; Peel, H. Deeper networks for pavement crack detection. In Proceedings of the 34th ISARC, Taipei, Taiwan, 28 June–1 July 2017; pp. 479–485. [Google Scholar]
  65. Su, C.; Wang, W. Concrete cracks detection using convolutional neuralnetwork based on transfer learning. Math. Probl. Eng. 2020, 2020, 7240129. [Google Scholar] [CrossRef]
  66. Li, S.; Zhao, X. Image-based concrete crack detection using convolutional neural network and exhaustive search technique. Adv. Civ. Eng. 2019, 2019, 6520620. [Google Scholar] [CrossRef] [Green Version]
  67. Yang, Q.; Shi, W.; Chen, J.; Lin, W. Deep convolution neural network-based transfer learning method for civil infrastructure crack detection. Autom. Constr. 2020, 116, 103199. [Google Scholar] [CrossRef]
  68. Deng, W.; Mou, Y.; Kashiwa, T.; Escalera, S.; Nagai, K.; Nakayama, K.; Matsuo, Y.; Prendinger, H. Vision based pixel-level bridge structural damage detection using a link ASPP network. Autom. Constr. 2020, 110, 102973. [Google Scholar] [CrossRef]
  69. Yu, Z.; Shen, Y.; Shen, C. A real-time detection approach for bridge cracks based on YOLOv4-FPM. Autom. Constr. 2021, 122, 103514. [Google Scholar] [CrossRef]
  70. Chen, T.; Cai, Z.; Zhao, X.; Chen, C.; Liang, X.; Zou, T.; Wang, P. Pavement crack detection and recognition using the architecture of segNet. J. Ind. Inf. Integr. 2020, 18, 100144. [Google Scholar] [CrossRef]
  71. Bang, S.; Park, S.; Kim, H.; Kim, H. Encoder–decoder network for pixel-level road crack detection in black-box images. Comput.-Aided Civ. Infrastruct. Eng. 2019, 34, 713–727. [Google Scholar] [CrossRef]
  72. Ni, F.; Zhang, J.; Chen, Z. Pixel-level crack delineation in images with convolutional feature fusion. Struct. Control Health Monit. 2019, 26, e2286. [Google Scholar] [CrossRef] [Green Version]
  73. Maeda, H.; Sekimoto, Y.; Seto, T.; Kashiyama, T.; Omata, H. Road damage detection and classification using deep neural networks with smartphone images. Comput.-Aided Civ. Infrastruct. Eng. 2018, 33, 1127–1141. [Google Scholar] [CrossRef] [Green Version]
  74. Liu, Z.; Cao, Y.; Wang, Y.; Wang, W. Computer vision-based concrete crack detection using U-net fully convolutional networks. Autom. Constr. 2019, 104, 129–139. [Google Scholar] [CrossRef]
  75. Escalona, U.; Arce, F.; Zamora, E.; Sossa, H. Fully convolutional networks for automatic pavement crack segmentation. Comput. Sist. 2019, 23, 451–460. [Google Scholar] [CrossRef]
  76. Fan, Z.; Li, C.; Chen, Y.; Wei, J.; Loprencipe, G.; Chen, X.; Di Mascio, P. Automatic crack detection on road pavements using encoder-decoder architecture. Materials 2020, 13, 2960. [Google Scholar] [CrossRef]
  77. Huyan, J.; Li, W.; Tighe, S.; Zhai, J.; Xu, Z.; Chen, Y. Detection of sealed and unsealed cracks with complex backgrounds using deep convolutional neural network. Autom. Constr. 2019, 107, 102946. [Google Scholar] [CrossRef]
  78. Zhang, A.; Wang, K.C.; Li, B.; Yang, E.; Dai, X.; Peng, Y.; Fei, Y.; Liu, Y.; Li, J.Q.; Chen, C. Automated pixel-level pavement crack detection on 3D asphalt surfaces using a deep-learning network. Comput.-Aided Civ. Infrastruct. Eng. 2017, 32, 805–819. [Google Scholar] [CrossRef]
  79. Zhang, A.; Wang, K.C.; Fei, Y.; Liu, Y.; Tao, S.; Chen, C.; Li, J.Q.; Li, B. Deep learning–based fully automated pavement crack detection on 3D asphalt surfaces with an improved CrackNet. J. Comput. Civ. Eng. 2018, 32, 04018041. [Google Scholar] [CrossRef] [Green Version]
  80. Fei, Y.; Wang, K.C.; Zhang, A.; Chen, C.; Li, J.Q.; Liu, Y.; Yang, G.; Li, B. Pixel-level cracking detection on 3D asphalt pavement images through deep-learning-based CrackNet-V. IEEE Trans. Intell. Transp. Syst. 2019, 21, 273–284. [Google Scholar] [CrossRef]
  81. Islam, N.; Park, J. bCNN-Methylpred: Feature-Based Prediction of RNA Sequence Modification Using Branch Convolutional Neural Network. Genes 2021, 12, 1155. [Google Scholar] [CrossRef] [PubMed]
  82. Ali, R.; Zeng, J.; Cha, Y.-J. Deep learning-based crack detection in a concrete tunnel structure using multispectral dynamic imaging. In Proceedings of the Smart Structures and NDE for Industry 4.0, Smart Cities, and Energy Systems, Online, 27 April–8 May 2020; pp. 12–19. [Google Scholar]
  83. Islam, N.U.; Park, J. Depth estimation from a single RGB image using fine-tuned generative adversarial network. IEEE Access 2021, 9, 32781–32794. [Google Scholar] [CrossRef]
  84. Hawkins, D.M. The problem of overfitting. J. Chem. Inf. Comput. Sci. 2004, 44, 1–12. [Google Scholar] [CrossRef] [PubMed]
  85. Van Herk, M. A fast algorithm for local minimum and maximum filters on rectangular and octagonal kernels. Pattern Recognit. Lett. 1992, 13, 517–521. [Google Scholar] [CrossRef]
  86. Jung, H.-K.; Choi, G.-S. Improved YOLOv5: Efficient Object Detection Using Drone Images under Various Conditions. Appl. Sci. 2022, 12, 7255. [Google Scholar] [CrossRef]
  87. Cepni, S.; Atik, M.E.; Duran, Z. Vehicle detection using different deep learning algorithms from image sequence. Balt. J. Mod. Comput. 2020, 8, 347–358. [Google Scholar] [CrossRef]
  88. Andhy Panca Saputra, K. Waste Object Detection and Classification using Deep Learning Algorithm: YOLOv4 and YOLOv4-tiny. Turk. J. Comput. Math. Educ. (TURCOMAT) 2021, 12, 5583–5595. [Google Scholar]
Figure 1. Proposed Methodology.
Sustainability 15 01866 g001
Figure 2. Polygon-based labeling.
Sustainability 15 01866 g002
Figure 3. Previous YOLOv5 architecture.
Sustainability 15 01866 g003
Figure 4. New YOLOv5 architecture.
Sustainability 15 01866 g004
Figure 5. U-Net Architecture.
Sustainability 15 01866 g005
Figure 6. Training and validation results on SDNET2018 dataset with 300 epochs. (a) YOLOv5s, (b) YOLOv5m, (c) YOLOv5l.
Sustainability 15 01866 g006
Figure 7. The precision-recall curve of the SDNET2018 test data for (a) YOLOv5s, (b) YOLOv5m, and (c) YOLOv5l.
Sustainability 15 01866 g007
Figure 8. The precision-recall curves of the Pakistani test data for (a) YOLOv5s, (b) YOLOv5m, and (c) YOLOv5l.
Sustainability 15 01866 g008
Figure 9. Correct crack detection results of models on SDNET2018 for (a) YOLOv5s, (b) YOLOv5m, and (c) YOLOv5l.
Sustainability 15 01866 g009
Figure 10. Incorrect/missed crack detection results of models on SDNET2018 for (a) YOLOv5s, (b) YOLOv5l.
Sustainability 15 01866 g010
Figure 11. Correct crack detection results of models on the Pakistani dataset for (a) YOLOv5s, (b) YOLOv5m, and (c) YOLOv5l.
Sustainability 15 01866 g011
Figure 12. U-NET segmentation on SDNET2018 dataset (a) Training and validation accuracy curve, (b) Tested images and predictions.
Sustainability 15 01866 g012
Figure 13. Area, height, and width of cracks in pixels (a) Sample image 1, (b) Sample image 2, (c) Sample image 3, and (d) Sample image 4.
Sustainability 15 01866 g013
Figure 14. Variations in crack sizes (a) Scatter plot, (b) Area, and (c) Height and width.
Sustainability 15 01866 g014
Table 1. Bridges collapsed in the last two decades in Pakistan.
YearName/LocationCasualtiesRef
2006Kalpani Bridge, Marden KPK, Pakistan70[25]
2007SherShah Bridge, Karachi Sindh, Pakistan4[26]
2007Northern Bypass Bridge, Karachi, Sindh, Pakistan10[27]
2018Kundal Shahi bridge, Neelam valley Kashmir, Pakistan40[28]
2018Jagran Nullah, Neelum Valley Kashmir, Pakistan25[29]
2022Hassanabad Bridge, Hunza Gilgit-Baltistan, Pakistan-[30]
2022Gohati Bridge, Swabi KPK, Pakistan-[31]
Table 2. Image Processing Models.
ModelSource/DeviceDatasetDomainAdvantagesLimitationsResults
Image filtering- (Gabor Filter) [41]Canon IXUS
80 IS
5 images
336 × 339 pixels
PavementDetect multidirectional cracksThe results are presented
using only 5 images
Precision = 95%
Image filtering (Particle Filter) [42]IP camera14
images
12 MP camera
Civil structureThe dimensions of the crack are determined using a single camera-Range of error = 7.51% to 8.59%
Image filtering and GP
[43]
Digital camera17 images
(Variable resolutions)
ConcreteAccurately detects cracks in the surface images captured in diverse conditions-Accuracy = 80%
Beamlet Transform [44]Digital cameraImages of 256 × 256 pixelsPavementA robust method for crack extractionUnable to determine the crack width Fast and noise-resistant approach
Shi-Tomasi Algorithm
[45]
Consumer-grade
digital
camera
Real-time detectionSteel bridgeRobust to various lighting situations and complicated texturesAccuracy is affected by the camera resolution-
Table 3. Classical Machine Learning Methods.
ModelSource/DeviceDatasetDomainAdvantagesLimitationsResults
Gaussian Models, K-means clustering [49]Digital camera84 images
1536 × 2048 pixels
RoadCrack width is accurately determinedNarrow cracks are not accurately detectedF-Measure = 97%
SVM, MDNMS
[50]
Line scan
camera, laser beams
7250 images,
4000 × 1000
pixels
RoadEasily distinguish between the 10 types of pavements -Precision = 98.29%
Recall = 93.86%
SVM, Random
Forests
[51]
CDN and AigleRN
datasets
38 CDN, 118 AigleRN images
480 × 320 pixels
RoadReliable for noisy imagesThere is no measurement of crack widthPrecision = 96.73%
Table 4. Deep Learning Methods.
ModelSource/DeviceDatasetDomainAdvantagesLimitationsResults
Fully convolutional
network (FCN) [58]
Open-source data4000 images
224 × 224 pixels
ConcreteAccurately identify the crack path-F1 average and Recall = 92%
FCN
[59]
Public dataset500 annotated images 227 × 227 pixelsConcreteAccurately detect cracks and their density Challenging when the image is too noisy F1 and average Precision = 90%
FCN
[60]
Online dataset800 plus
building images
Concrete wallNo preprocessing requiredCannot accurately detect thin and image border cracksAccuracy = 97.96%,
Precision = 81.73%
F1 score = 79.95%
EMA-Dense Net
[6]
Public concrete crack dataset
and bridge images, 5D Mark IV digital single-lens reflex camera
400 bridge & 800+ concrete crack images
4464 × 2976
pixels
Bridge and concreteRobust and accurate detection High-resolution images neededMPA = 87.42%, MIoU 92.59% for the public concrete crack dataset. MioU = 79.87%, MPA = 86.35% for the bridge damage dataset.
SSENet [61]CMOS surface array camera6069 images
224 × 224
pixels
Bridge-Detection accuracy reduces with reduced negative samples Accuracy = 97%
CNN
[62]
CMOS surface array camera6069 images
224 × 224 pixels
BridgeSuperior performance than traditional models-Accuracy = 96.37%
CNN
[63]
DSLR Camera332 raw imagesConcreteAccurately detect thin cracksExtensive training is needed Accuracy = 98%
CNN
[64]
Smartphone500 images
3264 × 2448 pixels
PavementHigh detection accuracy Location variance problems Accuracy = 91.3%,
Precision = 90.7%
CNN
[65]
ImageNet
dataset, bridge images
6000
crack,
600 non-crack images
BridgeGood detection accuracyThe severity of the crack is not assessedAccuracy = 99.1%
CNN
[66]
ImageNet
dataset, bridge images
60,000 imagesBridgeAccurately detect cracks in real time
-Validation accuracy = 99.06%,
Testing accuracy = 98.32%
DCCN
[67]
Mixed online and in-person dataCCIC (14,000),
SDNET (4916),
BCD (5000) images
Concrete,
bridge
High accuracy, less training timeQuantitative representation of transfer knowledge is not studiedCCIC accuracy = 99.83%,
BCD = 99.72%, and SDNET = 97.07%.
LinkASSP Net
[68]
Digital camera732 imagesBridgeSuperior detection of minority class Cannot assess damage in practice High F1 score
YOLOv4-FPM
[69]
Digital SLR camera/UAV -Dajiang M210RTK376 imagesBridgeAccurately detect cracks in images of various sizePruning rate optimization is required to reduce storage space-
SegNet
[70]
Online dataset-Pavement, bridgeSuperior detection and generalization A huge dataset is required Mean average precision (mAP) = 83%
Deep encoder decoder
[71]
Black box camera527 imagesRoad pavementRobust and high detection accuracyRequires a superior and efficient approach to detect pixel-level cracksRecall = 77.68%, precision = 71.98%
GoogleNet,
FPN [72]
Canon digital camera 128,000 images, 224 × 224 pixelCivil
structures
Accurately delineate cracksTime-consumingPrecision = 80.13%
Recall = 86.09%
F-Measure = 81.55%
SSD Inception V2, SSD MobileNet
[73]
Smartphone9053 imagesRoadCost-efficientExtensive training needed Recall > 71%,
Precision > 77%
U-Net
[74]
Ordinary camera 84 images,
512 × 512
pixel
ConcreteHigher accuracy than FCNHyper parameters should be artificially adjustedPrecision = 90%
U-Net
[75]
CFD and Aigle-RN datasets118 images (CFD),
38 images (AigleRN)
PavementAccurately detect thin cracks, less processing time-CFD Precision = 97.31% and
Recall = 94.28%, Aigle-RN Recall = 82.9% and precision = 93.51%
U-HDN
[76]
Public dataset (CFD and AigleRN)118 images (CFD),
38 images (AigleRN)
PavementAccurately detect pavements cracksLess efficient and high computational cost CFD precision = 0.945, and Recall = 0.936, Aigle-RN Recall = 0.931 and precision = 0.921
Crack DN
[77]
Smartphones, ordinary cameras12,000 images,
500 × 356 pixel
RoadEasily detect sealed and unsealed cracks Lower detection speed Mean average precision(mAP) > 0.90,
Accuracy > 0.85
CrackNet
[78]
5,000 3D pavement images2000
3D images
PavementDetect cracks at pixel levelHairline cracks not accurately detectedPrecision = 90.13%, Recall = 87.63%, F-measure = 88.86%
CrackNet II
[79]
PaveVison3D system3000
Images
Asphalt pavementRobust network for detecting hairline cracks A complex problem like suppressing cracklike patterns is not solvedRecall = 89.06%,
Precision = 90.20%,
F-measure = 89.62%
CrackNet-V
[80]
PaveVision3D system3083
Images
PavementDetect fine cracks quicklyLess accurate in terms of wide crack detectionPrecision = 84.31%,
F1 score = 87.12%,
Recall = 90.12%
CrackNet-R
[78]
PaveVision 3D system4000
Images
PavementHigher speed and accuracy -Recall = 95.00%,
Precision = 88.89%,
F-measure = 91.84%
Table 5. Data classification.
StepSmall CrackLarge Crack
Training650773
Validation182245
Testing96123
Testing on Pakistani bridge images91110
Total10191251
Table 6. Hardware configuration of Google Colab Pro+.
ParameterValue
GPUP100, T4, V100
CPU2 × vCPU
RAM52 GB
Background executionyes
Table 7. Summary of models’ results on the SDNET 2018 dataset.
ModelBatch SizeEpochClassPrecision %Recall %[email protected] %
YOLOv5s16300All0.9730.9630.98
Large crack0.9720.9690.99
Small crack0.9730.9580.97
YOLOv5m16300All0.9740.9660.983
Large crack0.9760.980.988
Small crack0.9720.9530.978
YOLOv5l16300All0.980.9680.981
Large crack0.9830.9720.987
Small crack0.9780.9630.976
Table 8. Model testing results on the SDNET2018 dataset.
ModelNo of Test ImagesPrecisionRecall[email protected]Inference Time
YOLOv5s2190.9730.9310.9780.8 ms
YOLOv5m2190.9770.9670.9931.1 ms
YOLOv5l2190.9930.940.9911.2 ms
Table 9. Testing results for the Pakistani dataset.
ModelClassPrecision Recall[email protected]
YOLOv5sAll0.830.840.812
Large Crack0.7650.8430.787
Small Crack0.8950.8360.837
YOLOv5mAll0.8210.8980.867
Large Crack0.8060.8950.87
Small Crack0.8370.9020.865
YOLOv5lAll0.8080.8140.777
Large Crack0.730.8040.687
Small Crack0.8850.8240.868
Table 10. Crack detection using YOLOv5 models on the SDNET2018 dataset.
ModelTotal ImagesCorrect DetectionWrong/Missed Detection
YOLOv5s2192172
YOLOv5m2192190
YOLOv5l2192163
Table 11. Crack detection through YOLOv5 models on the Pakistani dataset.
ModelTotal ImagesCorrect DetectionWrong/Missed Detection
YOLOv5s20119011
YOLOv5m2011956
YOLOv5l20118219
Table 12. Training and validation data of U-NET segmentation on the SDNET2018 dataset.
CharacteristicsSub-CharacteristicsValues
DatasetTraining images1423
Validation images427
AccuracyTraining98.3
Validation93.4
Epoch200
Batch Size12
Table 13. Comparison of YOLOv5m (proposed) and previous YOLO models.
ModelPrecisionRecall[email protected]
YOLOv3-SPP 0.9030.8750.941
YOLOv4 0.960.900.951
YOLOv5m0.9740.9660.983
Disclaimer/Publisher’s Note: The statements, opinions and data contained in all publications are solely those of the individual author(s) and contributor(s) and not of MDPI and/or the editor(s). MDPI and/or the editor(s) disclaim responsibility for any injury to people or property resulting from any ideas, methods, instructions or products referred to in the content.

