Abstract
The coronavirus (COVID-19) pandemic devastated all economies across the world and triggered a deterioration in firms’ financial performance. However, some sectors turned out to be more vulnerable while others continued to perform well during the crisis period. Given this fact, we conducted a comprehensive study to estimate the impact of the COVID-19 pandemic on firms’ profitability in Europe. We used a dynamic panel data approach and a system generalized method of moment (System-GMM) model to investigate (i) which sectors were affected and what was the magnitude of the impact on firms’ profitability, and (ii) whether the stringency of anti-pandemic policies such as workplace closures and travel bans impacted firms unevenly. We find that COVID-19 caused about a 25% decline in the profitability of firms. The most impacted sectors were Consumer Discretionary, Consumer Staples, and Industrials, where profitability declined from 20 to 48%. We also find that firms in countries with high anti-pandemic policy stringency lost about 19% more in profitability than in the rest of the countries in Europe during 2020.
1. Introduction
COVID-19 severely disrupted countries and made the global economy weaker. The pandemic was unprecedented in terms of the speed of its spread and the scale of its impact, the worst since the great depression, which was a worldwide economic depression during 1929–1939 (Susskind & Vines, 2020; Wheelock, 2020 [1,2]). The pandemic adversely impacted the economic performances of countries (Barro et al., 2020; Habibi et al., 2022; Hayakawa & Mukunoki, 2021). It deteriorated the environmental results of firms (Facciolà et al., 2021; Nundy et al., 2021; SanJuan-Reyes et al., 2021; A. K. Verma & Prakash, 2020 [3,4,5,6]) and sunk their financial performances. This was reflected in the decline in stock prices, as well as the plunge in revenues and profits (Atayah et al., 2021; Devi et al., 2020; Ichsan et al., 2021; Rababah et al., 2020; P. Verma et al., 2021; Teng et al. [6,7,8,9,10,11,12]). However, this general picture does not apply uniformly to all countries and all businesses. Some sectors suffered more than others. Therefore, they bore prolonged and disrupted recovery processes (Al-Awadhi et al., 2020; Golubeva, 2021; Shen et al., 2020; Xiong et al., 2020 [13,14,15]). On the contrary, some sectors have even benefited from the pandemic. These include computers and IT manufacturing. Thus, it is essential to understand which sectors were the most vulnerable, in order to support effective recovery policies.
The literature on the impact of the pandemic shows that this impact is uneven across countries as well as across sectors within the same country. In this paper, we reconfirm this finding using data from European countries. Interestingly, we show that the impact of the pandemic is shaped by the stringency of the countries’ policy responses. We hypothesize that the harsher the policy measures adopted to tackle COVID-19, the higher the impact of the pandemic on a firm’s financial performance would be. We focus on the impact of COVID-19 on the profitability of firms, measured by return on assets (ROA). We then compare their performances in countries with different COVID-19 policies (workplace closures, travel bans, and other policy responses) to tackle the pandemic as measured by Stringency Index (Hale et al., 2021 [16]). We adopt the “Oxford COVID-19 Government Response Stringency Index” as a proxy for the strictness of anti-pandemic policies implemented by countries. This index tracks government responses to COVID-19 worldwide. The Oxford COVID-19 Government Response Stringency Index measures nine metrics regarding public policies to fight and contain the pandemic. These include school closures, workplace closures, bans of public events, the limiting of public gatherings, the stopping of public transport, and lockdowns; awareness-raising campaigns; control of travel and movements at the national level; and international travel restrictions. More details about this index are presented in the data section.
The literature on this topic can be split into three categories. The first focuses on a specific sector and investigates the performances of firms in that sector in a specific country or across different countries during the pandemic (Al-Kharusi & Murthy, 2020; Atayah et al., 2021; Elnahass et al., 2021; Fu & Shen, 2020; Nguyen, 2022; Størdal et al., 2021 [7,17,18,19,20,21]). For instance, Al-Kharusi and Murthy (2020) [17] measured the impact of COVID-19 on the banking sector in GCC using Monte Carlo simulation. Elnahass et al. (2021) [18] investigated the impact of the recent pandemic on the banking sector across 116 countries. Specifically, the authors investigated how financial performance indicators changed due to COVID-19 across 116 countries. Fu and Shen (2020) [19] found evidence that the recent pandemic had a significant negative effect on the performance of firms in China’s energy sector. The authors used a difference-in-difference (DID) analysis to show that firms in the energy sector faced difficulties in covering their costs, resulting in poor financial performances. Atayah et al. (2021) [7] investigated the case of logistics firms in G20 countries during the pandemic. They found evidence that firms in the logistics business performed well in 14 countries following the outbreak of the pandemic, and only in 6 countries was their financial performance significantly worsened due to COVID-19. Nguyen (2022) analyzed the financial performance of logistic firms listed on the Vietnam Stock Exchange and showed that the COVID-19 pandemic had a negative effect on their profitability. The second category of papers analyzes firms’ performances across sectors in one specific country (Mariolis et al., 2021; Öztürk et al., 2020; Rababah et al., 2020; Shen et al., 2020; Turkson et al., 2021 [10,22,23,24,25]). For example, Rababah et al. (2020) [10] made use of a pooled OLS regression for Chinese listed firms and concluded that the pandemic did not uniformly affect all industries. The authors show that some industries were hit more severely than others. In addition, small- and medium-sized firms suffered more than large ones from the pandemic. This finding extends to all industries. Mariolis et al. (2021) [22] estimated the COVID-19 multiplier effect using a multi-sectoral model for Greece and found that services and primary production were the most affected industries. Öztürk et al. (2020) [23] conducted a sectoral analysis of pandemic consequences in Turkey and found that the most affected sectors were banking, insurance, metal production, machinery, and sports. The third category of papers examines the role of moderating variables in shaping the performance of firms during the COVID-19 pandemic. The moderating variables considered include the ownership type, the corporate board composition, the firms’ size, and government grants, among others (Chu et al., 2021; Glossner et al., 2020; Song et al., 2021; Turkson et al., 2021 [25,26,27,28]). For instance, Glossner et al. (2020) [27], using simple OLS regressions, found that the institutional ownership level negatively affected U.S. stocks during COVID-19. Chu et al. (2021) [26] studied the performance of real estate firms in China during the pandemic with an emphasis on geographic scope and diversification using the Fixed Effect panel data method. They found that COVID-19 negatively affected real estate firms’ performance; however, t geographic scope and diversification soften the impact.
The literature studying the effects of COVID-19 on firms’ performances from a global perspective is not abundant. Only a few papers provide international evidence on firms’ performance during the pandemic outbreak. These few exceptions include Golubeva, (2021) [29], which uses OLS analysis and shows that the effect of COVID-19 on firms’ performances was sector-specific. Furthermore, firm size tended to drive the intensity of the impact during the COVID-19 outbreak. Ding et al. (2021) [30] analyzed stock returns during the pandemic across 61 countries using Fixed Effect regressions and identified firm characteristics that made the impact of COVID-19 milder; these are strong financial positions before the pandemic and have less dependence on global supply chains. Rizvi et al. (2022) [31] employed random effect regression and assessed the impact of COVID-19 on firms’ valuation in 10 EU countries. They found that firms’ value significantly declined in all sectors in all studied countries.
The main goal of this paper is threefold: first, it assesses the intensity of effects of the pandemic outbreak on the profitability of firms. Second, we show that these effects tend to be uneven across sectors. COVID-19 tends to be more impactful in sectors for which stronger effects are plausibly expected. Third, we investigate the shape of these effects and find that the non-linear nature of COVID-19’s effects across sectors and countries can be largely explained by the stringency of the anti-pandemic policies across countries. We argue that, beyond the natural differences (demographic, geographic, initial economic conditions, etc.), these uneven effects are mostly driven by the type of the sector as well as by the country’s responses to the pandemic. This investigation is all the more important as it contributes to the recent debate on a difficult trade-off, which was coined by Barro et al. (2020) [13] as “lives versus material goods.” The trade-off is unavoidable since the attempts to fight against the pandemic and contain its spread induced countries to conduct policies which reduced real GDP, particularly through restrictions on travel and commerce. We claim that strict public policies to tackle the pandemic significantly reduced firms’ financial performances. It is important to emphasize that, to the best of our knowledge, this is the first attempt to investigate, specifically, the impact of the government’s anti-pandemic policies on firms’ financial performances during the COVID-19 pandemic.
In terms of policy, our study is of utmost relevance as it provides insights to decision makers in terms of shaping their responses to the pandemic. Informed decisions should account for the underlying trade-offs between saving lives and economic contraction—stricter policy responses presumably decrease COVID-19 cases and death on the one hand; however, they also significantly shrink firms’ profitability, affecting economic and social welfare. By the same token, this paper identifies the most vulnerable sectors which may need extra effort to address the impacts of COVID-19 and correct the disrupted post-pandemic recovery in these sectors.
Our paper offers a unique econometric perspective by utilizing a System-GMM approach that takes into account the stock nature of financial performance drivers. Unlike most literature on the effects of the COVID-19 pandemic, which employs a static framework that ignores the fact that a firm’s financial performance is partly determined by its past performance, our approach accounts for this. Ignoring this aspect can lead to biased conclusions. The feedback effect of considering the effect of the dependent variable on the regressors is known as "dynamic endogeneity" and may result in inconsistent estimates. This type of endogeneity can occur alongside the traditional type of endogeneity, where contemporaneous values of the regressors and independent variables affect each other.
2. Data and Descriptive Analysis
Our paper combines two types of data, firm-level panel data and the country-level Stringency Index for the pandemic period (2020). We merge the datasets to examine the moderating effect of the Stringency Index on firms’ financial performances. We obtained firm-level annual data from Refinitiv Eikon for 2011–2020. The data cover 3822 public firms from 36 European countries. The largest number of companies in our database come from the United Kingdom, Sweden, France, Germany, Poland, Italy, Norway, Switzerland, and Spain. These countries account for approximately 75% of the total sample.
Our dependent variable is firms’ financial performances as proxied by the Return on Assets (ROA)—one of the most widely-used profitability measures in the literature (Devi et al., 2020; Ichsan et al., 2021; Li et al., 2021 [8,9,32]).
Figure 1 shows the average and median values of ROA over 2011–2020. The median ROA has fluctuated in between a 2 and 3% range during 2011–2019; however, 2020 was an exceptional year, in which the median value of ROA reached its lowest level of 0.9%. The average ROA (winsorized at 5th and 95th percentiles) dropped to its lowest value of −2.9% in 2020. Average values are low due to the pronounced left-skewed distribution of ROA. These values witness the intensity of the damages to firms following the outbreak of the pandemic. ROA is our main dependent variable. Firm-level explanatory variables are Tobin’s Q, leverage, liquidity, tangibility, growth, assets, and revenue. We take the natural log of assets and revenues to respond to skewness towards large values and de-emphasizes outliers. Firm-level data are described in Table 1.

Figure 1.
Return on Assets in Europe, average and median values over 2011–2020.

Table 1.
Description of variables.
Table 2 provides descriptive statistics of firm-level annual data. The number of observations varies between variables due to missing values. All variables are winsorized at the 5th and 95th percentiles, meaning that the bottom 5% and top 5% of values are replaced with the values at the 5th and 95th percentile, correspondingly.
Table 2.
Descriptive statistics.
In addition to firm-level data, we incorporate a measure of the strictness of anti-pandemic government policies. This is measured by the Oxford Covid-19 Government Response Tracker (OxCGRT) which gathers data on the policy measures implemented by governments to tackle COVID-19 (Hale et al., 2021). OxCGRT measures nine metrics about public policies to fight and contain the pandemic. These include school closures, workplace closures, bans of public events, the limiting of public gatherings, the stopping of public transport, lockdowns; awareness raising campaigns; control of travel and movements at the national level; and international travel restrictions. The data are available for all 36 countries in our sample. We calculate the average Stringency Index for each country in 2020 and split these countries into two groups: those that have implemented strict anti-COVID policies (countries having above the median value of the Stringency Index) and those that have milder policies (below the median value for the Stringency Index). The average value of the Stringency Index across countries in our sample during 2020 varies from 36 to 65 with a median value of 48. We assume that Stringency Index is zero before 2020 for all countries. Data on the Stringency Index show that the harshest anti-pandemic policies in 2020 were implemented in Italy. In contrast, the mildest anti-pandemic policies were seen in Estonia.
Figure 2 displays 36 European courtiers based on their Stringency Index quartiles. Countries in red have a Stringency Index above the median value of 48, and the rest of them in wheat color are countries with less rigid anti-COVID-19 policies.
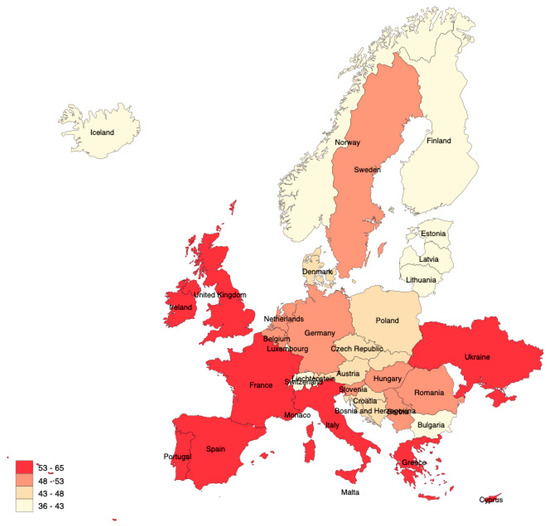
Figure 2.
COVID-19 average Stringency Index in Europe, 2020.
It is important to note that the deterioration of the financial performance of firms during the pandemic hides disparities across sectors but also disparities across countries. Indeed, aggregation induces a dilution effect that prevents distinguishing the effects of the pandemic on individual sectors. In addition, aggregation may hide differences across countries. This is problematic as it is widely understood that countries’ responses to COVID-19 were highly heterogenous. Some countries opted for early and widespread public actions to contain and fight COVID-19, while others followed a more passive approach. These differences were particularly noticeable at the beginning of the pandemic (first quarter of 2020), and these had large consequences on the differences stated in deaths and cases statistics, country-wise. To highlight these differences, we rely on Stringency Index. Thus, our goal is to test the following hypotheses:
Hypothesis 1.
COVID-19 negatively affected firms’ profitability.
Hypothesis 2.
The impact of COVID-19 on firms’ profitability is shaped by anti-pandemic policy stringency.
Hypothesis 3.
COVID-19 is more impactful in sectors for which stronger effects are plausibly expected.
The following section, Model and Results, describes econometric model and estimation techniques. It also includes tests for the above hypotheses, reports the results, and offers discussion of those results. In the final section, we provide the conclusions of this study.
3. Model and Results
To assess the impact of COVID-19 on firms’ financial performances and gauge the role of anti-pandemic policy stringency in this relationship, we rely on a panel data model described by Equation (1) below. As a first step, we use the fixed effect (FE) model to estimate Equation (1). Our choice over a FE model is dictated by the Hausman test, which rejects the hypothesis that Equation (1) can be estimated by a random effect model (RE). As a second step, we implement a System-GMM approach (For a detailed discussion of the implementation of the System-GMM estimation in varied contexts, see Sraieb (2022) [33] and Sraieb and Labadze (2022) [34]) to estimate Equation (1). System-GMM is used to address the potential inefficiency of the FE regression.
where is a natural logarithm of ROA for firm i in year t. Furthermore, and represent unobserved individual firm-fixed and time-fixed effects, respectively. The variable COVID-19 represents a dummy variable for the year 2020—the pandemic year. We include other year dummies as well to account for year-specific changes that affect all individuals. We also add the lag of the dependent variable as covariates to acquire a dynamic model. The lagged dependent variable translates a certain persistence in the ROA over the studied years. This persistence in firms’ profits was documented by a large body of literature (Mueller, 1977; Athanasoglou, 2008; Flamini et al., 2009; Muriu, 2016 [35,36,37,38]; etc). Control variables are also introduced with lag to allow for the delay in transmitting the impact (Shen et al., 2020 [24]). The control variables are Tobin’s Q, Leverage, Liquidity, Tangibility, Growth, the logged Assets, and the logged Revenue. We use the natural logarithm for variables that can be logged (no zeros for their values) to de-emphasize outliers and obtain less skewed distributions. is the error term, with ~iid (0, σ). All variables are winsorized at the 5th and 95th percentile to minimize outliers’ effects. Finally, to account for differences in terms of COVID-19 policies among different countries, we introduce a Stringency dummy variable whose coefficient measures the impact of government policies, such as lockdowns, closures of schools, workplaces, and bans on travelling and different types of events, to tackle the pandemic outbreak. The stringency dummy is equal to 1 if the country’s average Stringency Index during 2020 was higher than the median value and it is 0 otherwise. Countries with a Stringency Index above the median were: Belgium, Cyprus, France, Germany, Greece, Hungary, Ireland, Italy, Monaco, The Netherlands, Portugal, Romania, Serbia, Slovenia, Spain, Sweden, Ukraine, and the UK. Countries with a Stringency Index below the median were: Austria, Bosnia and Herzegovina, Bulgaria, Croatia, Czech Republic, Denmark, Estonia, Finland, Iceland, Latvia, Liechtenstein, Lithuania, Luxembourg, Malta, Norway, Poland, Slovakia, and Switzerland. FE regression analysis keeps a total of 3822 firms due to existing missing values.
For both approaches (FE and System-GMM), we run the regressions in the following order: First, to test the first hypothesis, we include all the firms in the regression and exclude the Stringency dummy . The coefficient of the COVID-19 dummy variable reports the aggregate effect of the pandemic on firms’ financial performance. The results are reported in the first column of Table 3 and Table 4; second, to test the second hypothesis, we keep all of the firms and incorporate the Stringency dummy in the regression. The coefficient of the Stringency dummy variable shows the difference in COVID-19 impact on firms’ profitability between low-stringency and highly stringent countries. The results are reported in the second column of Table 3 and Table 4.
Table 3.
Fixed-effects model results by industries, the dependent variable is .
Table 4.
System-GMM regression results by industries, the dependent variable is .
Finally, to test the third hypothesis, we consider the most impacted sectors and run the regression separately for the selected sectors (without Stringency dummy). We check the magnitude and significance of the COVID-19 dummy variable coefficient for each sector. The results for the most affected sectors are reported in columns 3–5 in Table 3 and Table 4 for FE and System-GMM estimation correspondingly.
The first column of Table 3 presents the FE regression results for all firms, without the Stringency dummy. The second column is obtained by incorporating the Stringency dummy in the regression. The results reported in columns 3–5 of Table 3 are those pertaining to the selected sectors—Consumer Discretionary, Consumer Staples, and Industrials. We adopt the Global Industry Classification Standard (GICS) system to identify sectors. Based on the GICS, the Consumer Discretionary sector includes the following industry groups: automobiles and components, consumer durables and apparel, consumer services (e.g., hotels, restaurants, and leisure), and retailing (e.g., distributors). The Consumer Staples sector includes the food and staples retailing, food, beverage and tobacco, household, and personal products sectors. Both of these sectors include industries that have been harshly hit by the pandemic (Lee, 2020; Sherif, 2020 [39,40]). For the Industrials sector, the GICS accounts for capital goods, commercial and professional services, and, most importantly, transportation industry, including air freight and logistics, airline, and marine, as well as road and rail transport. Specifically, air transport was one of the most hit industries (Suau-Sanchez et al., 2020; Sun et al., 2021 [41,42]). The regression results in Table 3 column 1 show evidence that COVID-19 had a statistically significant overall impact. Thus, the FE regression results are in favor of our first hypothesis. In particular, the pandemic is associated with a 12% decline in firms’ profitability, on average, as measured by ROA. This result is statistically significant at the 1% level. This is expected, as COVID-19 severely weakened economies, disrupted supply chains, and deteriorated productivity. The pandemic was unprecedented in terms of spreading speed and the scale of its impact. As discussed above, COVID-19 was the worst since the great depression, which was a worldwide economic depression during 1929–1939 (Susskind & Vines, 2020; Wheelock, 2020 [1,2]). The pandemic adversely impacted the economic performances of countries (Barro et al., 2020; Habibi et al., 2022; Hayakawa & Mukunoki, 2021 [13,14,15]). It deteriorated environmental results of firms (Facciolà et al., 202; Nundy et al., 2021; SanJuan-Reyes et al., 2021; A. K. Verma & Prakash, 2020 [3,4,5,6]) and sunk their financial performances. This was reflected in the decline in stock prices, as well as the plunge in revenues and profits (Atayah et al., 2021; Devi et al., 2020; Ichsan et al., 2021; Rababah et al., 2020; P. Verma et al., 2021).
Interestingly, the coefficient of the Stringency dummy (Table 3 column 2) shows that, in countries with highly stringent anti-pandemic policies, ROA declined by about 21% more than in those with below median Stringency Index. Therefore, our second hypothesis cannot be rejected based on FE estimation results. This finding further details the previous result on the negative impact of the pandemic on firms’ financial performances. It shows that disparities exist among countries. These differences can be attributed to the high heterogeneity characterizing countries’ responses to COVID-19. Some countries have opted for early and widespread public actions to contain and fight COVID-19, while others followed a more passive approach. The heterogeneity among countries was particularly noticeable at the beginning of the pandemic (first quarter of 2020), and these had large consequences on the differences stated in deaths and cases statistics, country-wise.
The regression in Table 3 also elucidates differences across sectors. This is of the utmost importance in terms of policy. Making informed decisions requires policy makers to call for accurate information about the differential effects across sectors. Efficiency in resources allocation requires identification of the most vulnerable sectors. This identification would allow for setting a priority order for governmental support for sectors as well as the design of sector-specific, effective anti-pandemic measures. Our findings suggest that the most vulnerable sectors are Consumer Discretionary, Consumer Staples, and Industrials sectors. The highest impact is associated with the Consumer Discretionary sector (27.6% decline in ROA), followed by the Consumer Staple sector (24.6% decline of ROA), and then the Industrials sector (19.8% decline in ROA). Recall that the most affected sector, according to FE estimation results, which is the Consumer Discretionary sector, includes the automobiles and components industry, consumer durables and apparel, consumer services (e.g., hotels, restaurants, and leisure), and retailing (e.g., distributors). Obviously, public policies including travel restrictions and bans, closure of companies, and lockdowns, as well as their macroeconomic consequences, had stronger adverse effects on sectors that depend on direct physical interaction with consumers (leisure, tourism, etc.), or those sectors that are at the upstream of the supply chain (apparel, automobile components, etc.). This order of most-affected sectors is for an average across countries. Individual countries may have these three most vulnerable sectors in a different order.
We have also run the modified version of equation (1) without the logarithm transformation of ROA. FE regression results of the modified model (with ROA in levels) reconfirmed our findings. The COVID-19 coefficient was a highly significant negative number for all sectors as well as separately for each sector under investigation. According to the modified FE regression, there was a 0.44-percentage-point decline in ROA for all sectors on average. The most impacted sector was Consumer Discretionary, which lost almost 3 percentage points, followed by Consumer Staples and Industrials with a 1.4- and 0.6-percentage-point decline in ROA due to COVID-19. In countries with stricter anti-pandemic policies, ROA declined by about 0.42 percentage points more than in the rest of the counties in our sample.
Our findings are consistent with previous studies. Hwang, Kim, and Jung (2021 [11]) found a 0.2–0.6-percentage-point decline in ROA due to COVID-19 in different modifications of their model for Korean firms. Pulawska (2021 [43]) found that the COVID-19 pandemic negatively affected the ROA of insurance companies in Europe, where average ROA declined by 0.574 times.
The relationship between the log of ROA (dependent variable) and its lagged value is highly significant, emphasizing the dynamic nature of the relationship (coefficient for ). The result is consistent with findings in the literature on the topic (Bartik et al., 2020; Panzone et al., 2021; Siddiqui, 2020 [44,45,46]), likewise for the linear coefficient across all models (columns 1–5). The only exception is the Consumer Staples sector, where the number of firms is relatively low in our dataset (Table 3, column 4). It is worth noting that the corresponding coefficient is not significant; however, the counterintuitive negative sign of the coefficient associated with the lagged ROA for this sector may refer to the spurious nature of the estimation due to the presence of endogeneity concerns, as will be explained below.
The FE estimation results suggest that leverage, liquidity, and firm size, as measured by the log of total assets, negatively affect firms’ financial performance (Table 3, column 1). The literature is not unanimous regarding the findings on these variables. The relationship is usually found significant, although the direction depends on a sector and the country (Ammari et al., 2014; Batool & Sahi, 2019; Matar & Eneizan, 2018; Nugraha et al., 2020; Rababah et al., 2020 [10,47,48,49,50]). For example, Batool and Sahi (2019) [48] found that, during the global financial crisis, leverage, liquidity, and firm size positively affected firms’ profitability in the USA, while, in the UK, only liquidity and firm size contributed positively to the profitability of firms. Leverage, however, had a negative impact. Matar and Eneizan (2018) [49] focused on Jordanian firms. They found that leverage and firm size have a negative effect on ROA, while liquidity positively impacts profitability. Chu et al. (2021) [26] found that COVID-19 had a negative impact on the financial performance of firms with high leverage. The logic is that firms with high leverage have a high default risk on average. These results are consistent with our findings. Previous research about the impact of COVID-19 on firms’ financial performance finds a negative coefficient for the leverage (Rababah et al., 2020 [10]).
Most of the research about the impact of COVID-19 on firms’ performance relies on OLS regression analysis, which may produce spurious results (Rababah et al., 2020; Golubeva, 2021; Glossner et al. 2020 [10,27,29]). Some papers on the topic rely on the FE model (Chu et al., 2021 [26]). However, it is well established that FE regression may give biased estimates due to endogeneity concerns. The endogeneity problem is caused by the presence of a lagged dependent variable as a regressor along with other potentially endogenous explanatory variables (Harris & Mátyás, 2004 [51]). To address this issue, and check the robustness of our results, we use the System-GMM estimator developed by Arellano and Bover (1995) [52] and Blundell and Bond (1998) [53]. The intuition behind this estimator is that because it is challenging to find proper external instruments for an endogenous variable, the method opts for the use of the lag of the independent variables as “internal” instruments. System-GMM is preferable to FE because it removes the bias generated by standard panel models. System-GMM deals with potential heteroskedasticity and autocorrelation problems and provides efficient and consistent estimates. The System-GMM technique also tackles the dynamic panel bias. Furthermore, the System-GMM provides better estimates than the Difference-GMM in terms of efficiency (Arellano and Bond, 1991 [54]). Last but not least, the System-GMM approach is particularly suitable for a situation where the number of time periods is small and the number of observations in each time period is large. This is precisely the case in our paper. Therefore, this is a substantial methodological improvement in analyzing the impact of COVID-19 on firms’ financial performance.
We run system-GMM regression with robust standard errors to estimate equation (1) and present results in Table 4. Column 1 relates to all sectors combined. It indicates that ROA distribution tends to be persistent. The coefficient of is positive and highly significant. This finding confirms the result of the FE model which was discussed earlier. COVID-19 is found to have a negative statistically significant impact on ROA for all sectors combined, likewise for the selected individual sectors. In particular, the pandemic is associated with a 24.7% decline in ROA on average. Note that this estimate is twice as high as the corresponding FE estimate of 12%. Both models (FE and System-GMM) results are in favor of our hypothesis 1.
According to the System-GMM estimation results reported in Table 4 (column 2), the profitability of firms in more stringent countries (with Stringency Index above median) declined by 18.8% more than those in less stringent countries (with Stringency Index below median). This result is close to the FE estimator of 21%. In countries with mild anti-pandemic policies, firms experienced an 11.6% decline in ROA in 2020 as compared to a 30.4% decline in ROA in countries with harsher anti-pandemic policies to tackle COVID-19. Thus, our second hypothesis is accepted (proved correct). This result highlights the trade-off that policymakers are facing between saving lives with more stringent anti-pandemic policies and economic contraction. To better understand the magnitude of this decline in ROA, we can compare it with past trends. According to Blažek et al. (2020) [55], the average annual ROA in the banking sector before the global financial crises (2004–2006) declined by 78% in Western Europe, 21% in southern Europe, and 39% in Central and Eastern Europe during the crises (2007–2009).
As explained in Section 3 above, we select the sectors identified in the literature as those that suffered most from the pandemic. These are Consumer Discretionary, Consumer Staples, and Industrials. Similar to the results for FE, the Consumer Discretionary sector is found to be among the most vulnerable, with about a 48% decline in ROA. This is followed by Industrials and Consumer Staples with 43% and 21% declines in ROA associated with the COVID-19 outbreak, respectively. This finding is consistent with the previous literature, which found that the impact of COVID-19 on Consumer Staples was relatively milder as compared to the Consumer Discretionary and Industrials sectors (Dharani et al., 2022 [56]). This confirms our hypothesis 3, that the effect of the pandemic is not homogenous. The pandemic of COVID-19 is more impactful in terms of ROA in sectors where a higher effect is expected.
We also checked System-GMM results of the modified version of Equation (1) without the logarithm trans-formation of ROA. The System-GMM regression results of the modified model (with ROA in levels) were similar. According to the results, there was a 0.9-percentage-point decline in ROA for all sectors on average (two times higher than FE estimate). The most impacted sector was Consumer Discretionary, which lost almost 3 percentage points (which is exactly the same as FE model estimate), followed by Consumer Staples and Industrials with a 1- and 0.5-percentage-point decline in ROA due to COVID-19 (very close to FE model estimates). However, the System-GMM model with ROA in levels failed consistency tests; thus, we only report the results of models with a natural logarithm of ROA.
The System-GMM estimator’s consistency depends on two specification tests: On the one hand, there is the test for over-identifying restrictions; this is used to detect whether the model is correctly specified (Sargan test, Hansen test). On the other hand, there is a serial correlation test in the error terms (AR(1), AR(2)). In particular, the model passes the specification test if it fails to reject the null hypothesis that the instruments are not correlated with the disturbances (the p-value of the Hansen J-test should be greater than 0.1).
We follow Roodman (2009) [57] and collapse the instrument matrix to prevent the model from being over-fitted. This allows us to avoid bias and inconsistency due to instrument proliferation.
Furthermore, the model passes the errors correlation test as it rejects the null hypothesis of first-order serial correlation in errors. At the same time, the null hypothesis of no second-order serial correlation of errors should be rejected. The p-values for all tests suggest that our specification is appropriate to model the behavior of ROA.
4. Conclusions
This study empirically investigates the impact of COVID-19 on the financial performance of public firms in Europe and how this impact was shaped by the stringency of anti-pandemic policies across countries. We find that (a) COVID-19 negatively affected firms’ profitability, (b) the impact of COVID-19 on firms’ profitability was significantly higher in countries with stricter anti-pandemic policies, and (c) the impact of COVID-19 on financial performance was heterogenous across sectors.
COVID-19 disrupted lives across the world and created an unprecedented economic crisis, weakening the global economy. Its impact on firms’ financial performance was devastating in terms of scope and magnitude. Importantly, the impact was not uniform across sectors, nor was it across countries. Furthermore, the responses of countries to the surgency of the pandemic were uneven. The stringency of restrictions and public anti-pandemic policies went from “laisser-faire” to drastic constraining measures, particularly at the early stages of the pandemic. This strongly determined the severity of the impact on firms’ financial performance. This paper investigates the drivers of the effects of the pandemic on the profitability of firms. We show that these effects tend to be uneven across sectors. COVID-19 tends to be more impactful in sectors for which stronger effects are plausibly expected. Sectors other than those of first necessity goods and services were among the most vulnerable to the pandemic (leisure, tourism, travel, etc.). Furthermore, we investigate the shape of these effects and find that the non-linear nature of the COVID-19 pandemic’s effects across sectors and countries can be largely explained by the stringency of the anti-pandemic policies across countries.
In terms of policy, this investigation is highly relevant, as it provides insights to decision makers in terms of shaping their responses to the pandemic. Informed decisions should account for the underlying trade-offs between saving lives and economic contraction. Stricter policy responses presumably decrease COVID-19 cases and death on one hand; however, they also significantly shrink firms’ profitability, affecting economic and social welfare. By the same token, this paper identifies the most vulnerable sectors which may need extra effort to address the impacts of COVID-19 and correct the disrupted post-pandemic recovery in these sectors.
We analyzed more than 3000 public firms from 36 European countries using the System-GMM panel data model and found that COVID-19 caused a decline in firms’ profitability, as measured by ROA, by almost 25% in 2020. The most hit sectors were Consumer Discretionary, Industrials, and Consumer Staples (GICS classification), where ROA dropped by about 48, 43, and 21%, correspondingly. The impact of COVID-19 was harsher in countries where governments implemented stricter anti-pandemic policies (above median Stringency Index). In these highly stringent countries, the profitability of firms dropped by 30.4% on average as compared to an 11.6% decline in less stringent countries (below median Stringency Index). This gap, as found by the System-GMM model, is close to the FE model estimate. Also, both the System GMM and FE models found that the most impacted sector was Consumer Discretionary, which indicates the robustness of our finding.
From an econometric perspective, our paper innovates by using a System-GMM approach that accounts also for the stock nature (as opposed to flow) of financial performances drivers. Indeed, most of the literature on the effects of the COVID-19 pandemic is cast in a static framework that completely ignores the fact that firms’ financial performances are partly driven by their own past performances. Ignoring this dimension introduces a bias that may result in misleading inference. Interestingly, the feedback effect introduced by considering the effect of the dependent variable on the regressors is called “dynamic endogeneity” (Wintoki et al., 2012 [58]), and may lead to inconsistent estimates. This type of endogeneity may occur together with the traditional type of endogeneity whereby contemporaneous values of the regressors and the independent values affect each other.
Expanding our analysis to different regions and to a larger time span would shed light on the dynamics of the relationship between the stringency of anti-pandemic policies and firms’ financial performance over time. This investigation is all the more important because it can help governments to design optimal strategies in the face of potential major health shocks. These might be interesting directions for future research.
Author Contributions
Conceptualization, L.L. and M.M.S.; Methodology, L.L.; Writing—original draft, L.L. and M.M.S.; Visualization, L.L. All authors have read and agreed to the published version of the manuscript.
Funding
This research received no external funding.
Institutional Review Board Statement
Not applicable.
Informed Consent Statement
Not applicable.
Data Availability Statement
The current study is based on two datasets. The first dataset is not publicly available as it contains proprietary information that the authors acquired through a license. Information on how to obtain it and reproduce the analysis is available from the corresponding author on request. The first dataset that support the findings of this study are obtained from Refinitiv Eikon (https://eikon.refinitiv.com, accessed on 1 November 2022). The second dataset analysed in current study are openly available at https://covidtracker.bsg.ox.ac.uk/, accessed on 1 November 2022.
Conflicts of Interest
The authors declare no conflict of interest.
References
- Susskind, D.; Vines, D. The economics of the COVID-19 pandemic: An assessment. Oxf. Rev. Econ. Policy 2020, 36 (Suppl. 1), S1–S13. [Google Scholar] [CrossRef]
- Wheelock, D.C. Comparing the COVID-19 Recession with the Great Depression. Econ. Synopses 2020, 2020, 1–4. [Google Scholar] [CrossRef]
- Facciolà, A.; Laganà, P.; Caruso, G. The COVID-19 pandemic and its implications on the environment. Environ. Res. 2021, 201, 111648. [Google Scholar] [CrossRef]
- Nundy, S.; Ghosh, A.; Mesloub, A.; Albaqawy, G.A.; Alnaim, M.M. Impact of COVID-19 pandemic on socio-economic, energy-environment and transport sector globally and sustainable development goal (SDG). J. Clean. Prod. 2021, 312, 127705. [Google Scholar] [CrossRef] [PubMed]
- SanJuan-Reyes, S.; Gómez-Oliván, L.M.; Islas-Flores, H. COVID-19 in the Environment. Chemosphere 2021, 263, 127973. [Google Scholar] [CrossRef] [PubMed]
- Verma, A.K.; Prakash, S. Impact of Covid-19 on Environment and Society. J. Glob. Biosci. 2020, 9, 7352–7363. [Google Scholar]
- Atayah, O.F.; Dhiaf, M.M.; Najaf, K.; Frederico, G.F. Impact of COVID-19 on financial performance of logistics firms: Evidence from G-20 countries. J. Glob. Oper. Strateg. Sourc. 2021, 15, 172–196. [Google Scholar] [CrossRef]
- Devi, S.; Warasniasih, N.M.S.; Masdiantini, P.R.; Musmini, L.S. The Impact of COVID-19 Pandemic on the Financial Performance of Firms on the Indonesia Stock Exchange. J. Econ. Bus. Account. Ventura 2020, 23, 226–242. [Google Scholar] [CrossRef]
- Ichsan, R.N.; Suparmin, S.; Yusuf, M.; Ismal, R.; Sitompul, S. Determinant of Sharia Bank’s Financial Performance during the Covid-19 Pandemic. Bp. Int. Res. Crit. Inst.-J. BIRCI-J. 2021, 4, 298–309. [Google Scholar] [CrossRef]
- Rababah, A.; Al-Haddad, L.; Sial, M.S.; Chunmei, Z.; Cherian, J. Analyzing the effects of COVID-19 pandemic on the financial performance of Chinese listed companies. J. Public Aff. 2020, 20, e2440. [Google Scholar] [CrossRef]
- Hwang, J.; Kim, H.; Jung, D. The Effect of ESG Activities on Financial Performance during the COVID-19 Pandemic—Evidence from Korea. Sustainability 2021, 13, 11362. [Google Scholar] [CrossRef]
- Teng, X.; Chang, B.-G.; Wu, K.-S. The Role of Financial Flexibility on Enterprise Sustainable Development during the COVID-19 Crisis—A Consideration of Tangible Assets. Sustainability 2021, 13, 1245. [Google Scholar] [CrossRef]
- Barro, R.J.; Ursúa, J.F.; Weng, J. The Coronavirus and the Great Influenza Pandemic: Lessons from the “Spanish Flu” for the Coronavirus’s Potential Effects on Mortality and Economic Activity; National Bureau of Economic Research: Cambridge, MA, USA, 2020. [Google Scholar]
- Habibi, Z.; Habibi, H.; Mohammadi, M.A. The Potential Impact of COVID-19 on the Chinese GDP, Trade, and Economy. Economies 2022, 10, 73. [Google Scholar] [CrossRef]
- Hayakawa, K.; Mukunoki, H. The impact of COVID-19 on international trade: Evidence from the first shock. J. Jpn. Int. Econ. 2021, 60, 101135. [Google Scholar] [CrossRef] [PubMed]
- Hale, T.; Angrist, N.; Goldszmidt, R.; Kira, B.; Petherick, A.; Phillips, T.; Webster, S.; Cameron-Blake, E.; Hallas, L.; Majumdar, S.; et al. A global panel database of pandemic policies (Oxford COVID-19 Government Response Tracker). Nat. Hum. Behav. 2021, 5, 529–538. [Google Scholar] [CrossRef] [PubMed]
- Al-Kharusi, S.; Murthy, S.R. Financial Stability of GCC Banks in the COVID-19 Crisis: A Simulation Approach. J. Asian Finance Econ. Bus. 2020, 7, 337–344. [Google Scholar] [CrossRef]
- Elnahass, M.; Trinh, V.Q.; Li, T. Global banking stability in the shadow of Covid-19 outbreak. J. Int. Financ. Mark. Inst. Money 2021, 72, 101322. [Google Scholar] [CrossRef]
- Fu, M.; Shen, H. COVID-19 and Corporate Performance in the Energy Industry. Energy Res. Lett. 2020, 1, 12967. [Google Scholar] [CrossRef]
- Størdal, S.; Lien, G.; Trømborg, E. Impacts of Infectious Disease Outbreaks on Firm Performance and Risk: The Forest Industries during the COVID-19 Pandemic. J. Risk Financ. Manag. 2021, 14, 318. [Google Scholar] [CrossRef]
- Nguyen, H.T.X. The Effect of COVID-19 Pandemic on Financial Performance of Firms: Empirical Evidence from Vietnamese Logistics Enterprises. J. Asian Financ. Econ. Bus. 2022, 9, 177–183. [Google Scholar]
- Mariolis, T.; Rodousakis, N.; Soklis, G. Inter-sectoral analysis of the Greek economy and the COVID-19 multiplier effects. Eur. Politics Soc. 2021, 23, 505–516. [Google Scholar] [CrossRef]
- Ztürk, Ö.; Şişman, M.Y.; Uslu, H.; Çıtak, F. Effect of COVID-19 Outbreak on Turkish Stock Market: A Sectoral-Level Analysis. Hitit Univ. J. Soc. Sci. Inst. 2020, 13, 56–68. [Google Scholar]
- Shen, H.; Fu, M.; Pan, H.; Yu, Z.; Chen, Y. The Impact of the COVID-19 Pandemic on Firm Performance. Emerg. Mark. Finance Trade 2020, 56, 2213–2230. [Google Scholar] [CrossRef]
- Turkson, D.; Addai, N.B.; Chowdhury, F.; Mohammed, F. Government policies and firm performance in the COVID-19 pandemic era: A sectoral analysis. SN Bus. Econ. 2021, 1, 168. [Google Scholar] [CrossRef]
- Chu, X.; Lu, C.; Tsang, D. Geographic Scope and Real Estate Firm Performance during the COVID-19 Pandemic. J. Risk Financ. Manag. 2021, 14, 309. [Google Scholar] [CrossRef]
- Glossner, S.; Matos, P.; Ramelli, S.; Wagner, A.F. Do Institutional Investors Stabilize Equity Markets in Crisis Periods? Evidence from COVID-19; Evidence from COVID-19 (June 28, 2021); European Corporate Governance Institute—Finance Working Paper 2020, No. 688; European Corporate Governance Institute: Brussels, Belgium, 2021; pp. 20–56. [Google Scholar]
- Song, H.J.; Yeon, J.; Lee, S. Impact of the COVID-19 pandemic: Evidence from the U.S. restaurant industry. Int. J. Hosp. Manag. 2021, 92, 102702. [Google Scholar] [CrossRef]
- Golubeva, O. Firms’ performance during the COVID-19 outbreak: International evidence from 13 countries. Corp. Gov. Int. J. Bus. Soc. 2021, 21, 1011–1027. [Google Scholar] [CrossRef]
- Ding, W.; Levine, R.; Lin, C.; Xie, W. Corporate immunity to the COVID-19 pandemic. J. Financ. Econ. 2021, 141, 802–830. [Google Scholar] [CrossRef]
- Rizvi, S.K.A.; Yarovaya, L.; Mirza, N.; Naqvi, B. The impact of COVID-19 on the valuations of non-financial European firms. Heliyon 2022, 8, e09486. [Google Scholar] [CrossRef]
- Li, X.; Feng, H.; Zhao, S.; Carter, D.A. The effect of revenue diversification on bank profitability and risk during the COVID-19 pandemic. Finance Res. Lett. 2021, 43, 101957. [Google Scholar] [CrossRef]
- Sraieb, M.M. The dynamics of US foreign aid decisions. Empir. Econ. 2022, 63, 1859–1886. [Google Scholar] [CrossRef]
- Sraieb, M.M.; Labadze, L. A Dynamic Perspective on the Gender Diversity–Firms’ Environmental Performances Nexus: Evidence from the Energy Industry. Sustainability 2022, 14, 7346. [Google Scholar] [CrossRef]
- Mueller, D.C. The Persistence of Profits above the Norm. Economica 1977, 44, 369–380. [Google Scholar] [CrossRef]
- Athanasoglou, P.P.; Brissimis, S.N.; Delis, M.D. Bank-specific, industry-specific and macroeconomic determinants of bank profitability. J. Int. Financ. Mark. Inst. Money 2008, 18, 121–136. [Google Scholar] [CrossRef]
- Flamini, V.; McDonald, C.A.; Schumacher, L.B. The Determinants of Commercial Bank Profitability in Sub-Saharan Africa. IMF Work. Pap. 2009, 9, 32. [Google Scholar] [CrossRef]
- Muriu, P.W. Do Microfinance Profits Converge? Pan-African Evidence. J. Econ. Sustain. Dev. 2016, 7, 38–55. [Google Scholar]
- Lee, H.S. Exploring the Initial Impact of COVID-19 Sentiment on US Stock Market Using Big Data. Sustainability 2020, 12, 6648. [Google Scholar] [CrossRef]
- Sherif, M. The impact of Coronavirus (COVID-19) outbreak on faith-based investments: An original analysis. J. Behav. Exp. Finance 2020, 28, 100403. [Google Scholar] [CrossRef]
- Suau-Sanchez, P.; Voltes-Dorta, A.; Cugueró-Escofet, N. An Early Assessment of the Impact of COVID-19 on Air Transport: Just Another Crisis or the End of Aviation as We Know It? J. Transp. Geogr. 2020, 86, 102749. [Google Scholar] [CrossRef]
- Sun, X.; Wandelt, S.; Zheng, C.; Zhang, A. COVID-19 pandemic and air transportation: Successfully navigating the paper hurricane. J. Air Transp. Manag. 2021, 94, 102062. [Google Scholar] [CrossRef]
- Puławska, K. Financial Stability of European Insurance Companies during the COVID-19 Pandemic. J. Risk Financ. Manag. 2021, 14, 266. [Google Scholar] [CrossRef]
- Bartik, A.W.; Bertrand, M.; Cullen, Z.; Glaeser, E.L.; Luca, M.; Stanton, C. The impact of COVID-19 on small business outcomes and expectations. Proc. Natl. Acad. Sci. USA 2020, 117, 17656–17666. [Google Scholar] [CrossRef] [PubMed]
- Panzone, L.A.; Larcom, S.; She, P.-W. Estimating the impact of the first COVID-19 lockdown on UK food retailers and the restaurant sector. Glob. Food Secur. 2021, 28, 100495. [Google Scholar] [CrossRef] [PubMed]
- Siddiqui, K. The Impact of COVID-19 on the Global Economy. World Financ. Rev. 2020, 25–31. [Google Scholar]
- Ammari, A.; Kadria, M.; Ellouze, A. Board Structure and Firm Performance: Evidence from French Firms Listed in SBF 120. Int. J. Econ. Financ. Issues 2014, 4, 580–590. [Google Scholar]
- Batool, A.; Sahi, A. Determinants of Financial Performance of Insurance Companies of USA and UK during Global Financial Crisis (2007–2016). Int. J. Account. Res. 2019, 7, 1–8. [Google Scholar] [CrossRef]
- Matar, A.; Eneizan, B.M. Determinants of Financial Performance in the Industrial Firms: Evidence from Jordan. Asian J. Agric. Ext. Econ. Sociol. 2018, 22, 1–10. [Google Scholar] [CrossRef]
- Nugraha, N.M.; Sulastri, L.; Nugraha, D.; Puspitasari, D.; Putra, R. Effect of Leverage and Liquidity on Financial Performance of Companies in the Property and Real Estate Sub Sector in Indonesia. PalArch’s J. Archaeol. EgyptEgyptol. 2020, 17, 3675–3688. [Google Scholar]
- Harris, M.N.; Mátyás, L. A Comparative Analysis of Different IV and GMM Estimators of Dynamic Panel Data Models. Int. Stat. Rev. 2004, 72, 397–408. [Google Scholar] [CrossRef]
- Arellano, M.; Bover, O. Another look at the instrumental variable estimation of error-components models. J. Econ. 1995, 68, 29–51. [Google Scholar] [CrossRef]
- Blundell, R.; Bond, S. Initial conditions and moment restrictions in dynamic panel data models. J. Econ. 1998, 87, 115–143. [Google Scholar] [CrossRef]
- Arellano, M.; Bond, S. Some Tests of Specification for Panel Data: Monte Carlo Evidence and an Application to Employment Equations. Rev. Econ. Stud. 1991, 58, 277–297. [Google Scholar] [CrossRef]
- Blažek, J.; Hejnová, T.; Rada, H. The impacts of the global economic crisis and its aftermath on the banking centres of Europe. Eur. Urban Reg. Stud. 2020, 27, 35–49. [Google Scholar] [CrossRef]
- Dharani, M.; Hassan, M.K.; Rabbani, M.R.; Huq, T. Does the Covid-19 pandemic affect faith-based investments? Evidence from global sectoral indices. Res. Int. Bus. Finance 2022, 59, 101537. [Google Scholar] [CrossRef]
- Roodman, D. A Note on the Theme of Too Many Instruments. Oxf. Bull. Econ. Stat. 2009, 71, 135–158. [Google Scholar] [CrossRef]
- Wintoki, M.B.; Linck, J.S.; Netter, J.M. Endogeneity and the dynamics of internal corporate governance. J. Financ. Econ. 2012, 105, 581–606. [Google Scholar] [CrossRef]


Disclaimer/Publisher’s Note: The statements, opinions and data contained in all publications are solely those of the individual author(s) and contributor(s) and not of MDPI and/or the editor(s). MDPI and/or the editor(s) disclaim responsibility for any injury to people or property resulting from any ideas, methods, instructions or products referred to in the content. |
© 2023 by the authors. Licensee MDPI, Basel, Switzerland. This article is an open access article distributed under the terms and conditions of the Creative Commons Attribution (CC BY) license (https://creativecommons.org/licenses/by/4.0/).