


Behavioural Profiling of Cycling and Walking in Nine European Cities
 ,
,  ,
,  , , ,
, , ,
Abstract
1. Introduction
2. Materials and Methods
2.1. Survey Design
2.2. Data Preparation
2.3. Factor and Cluster Analysis
3. Results
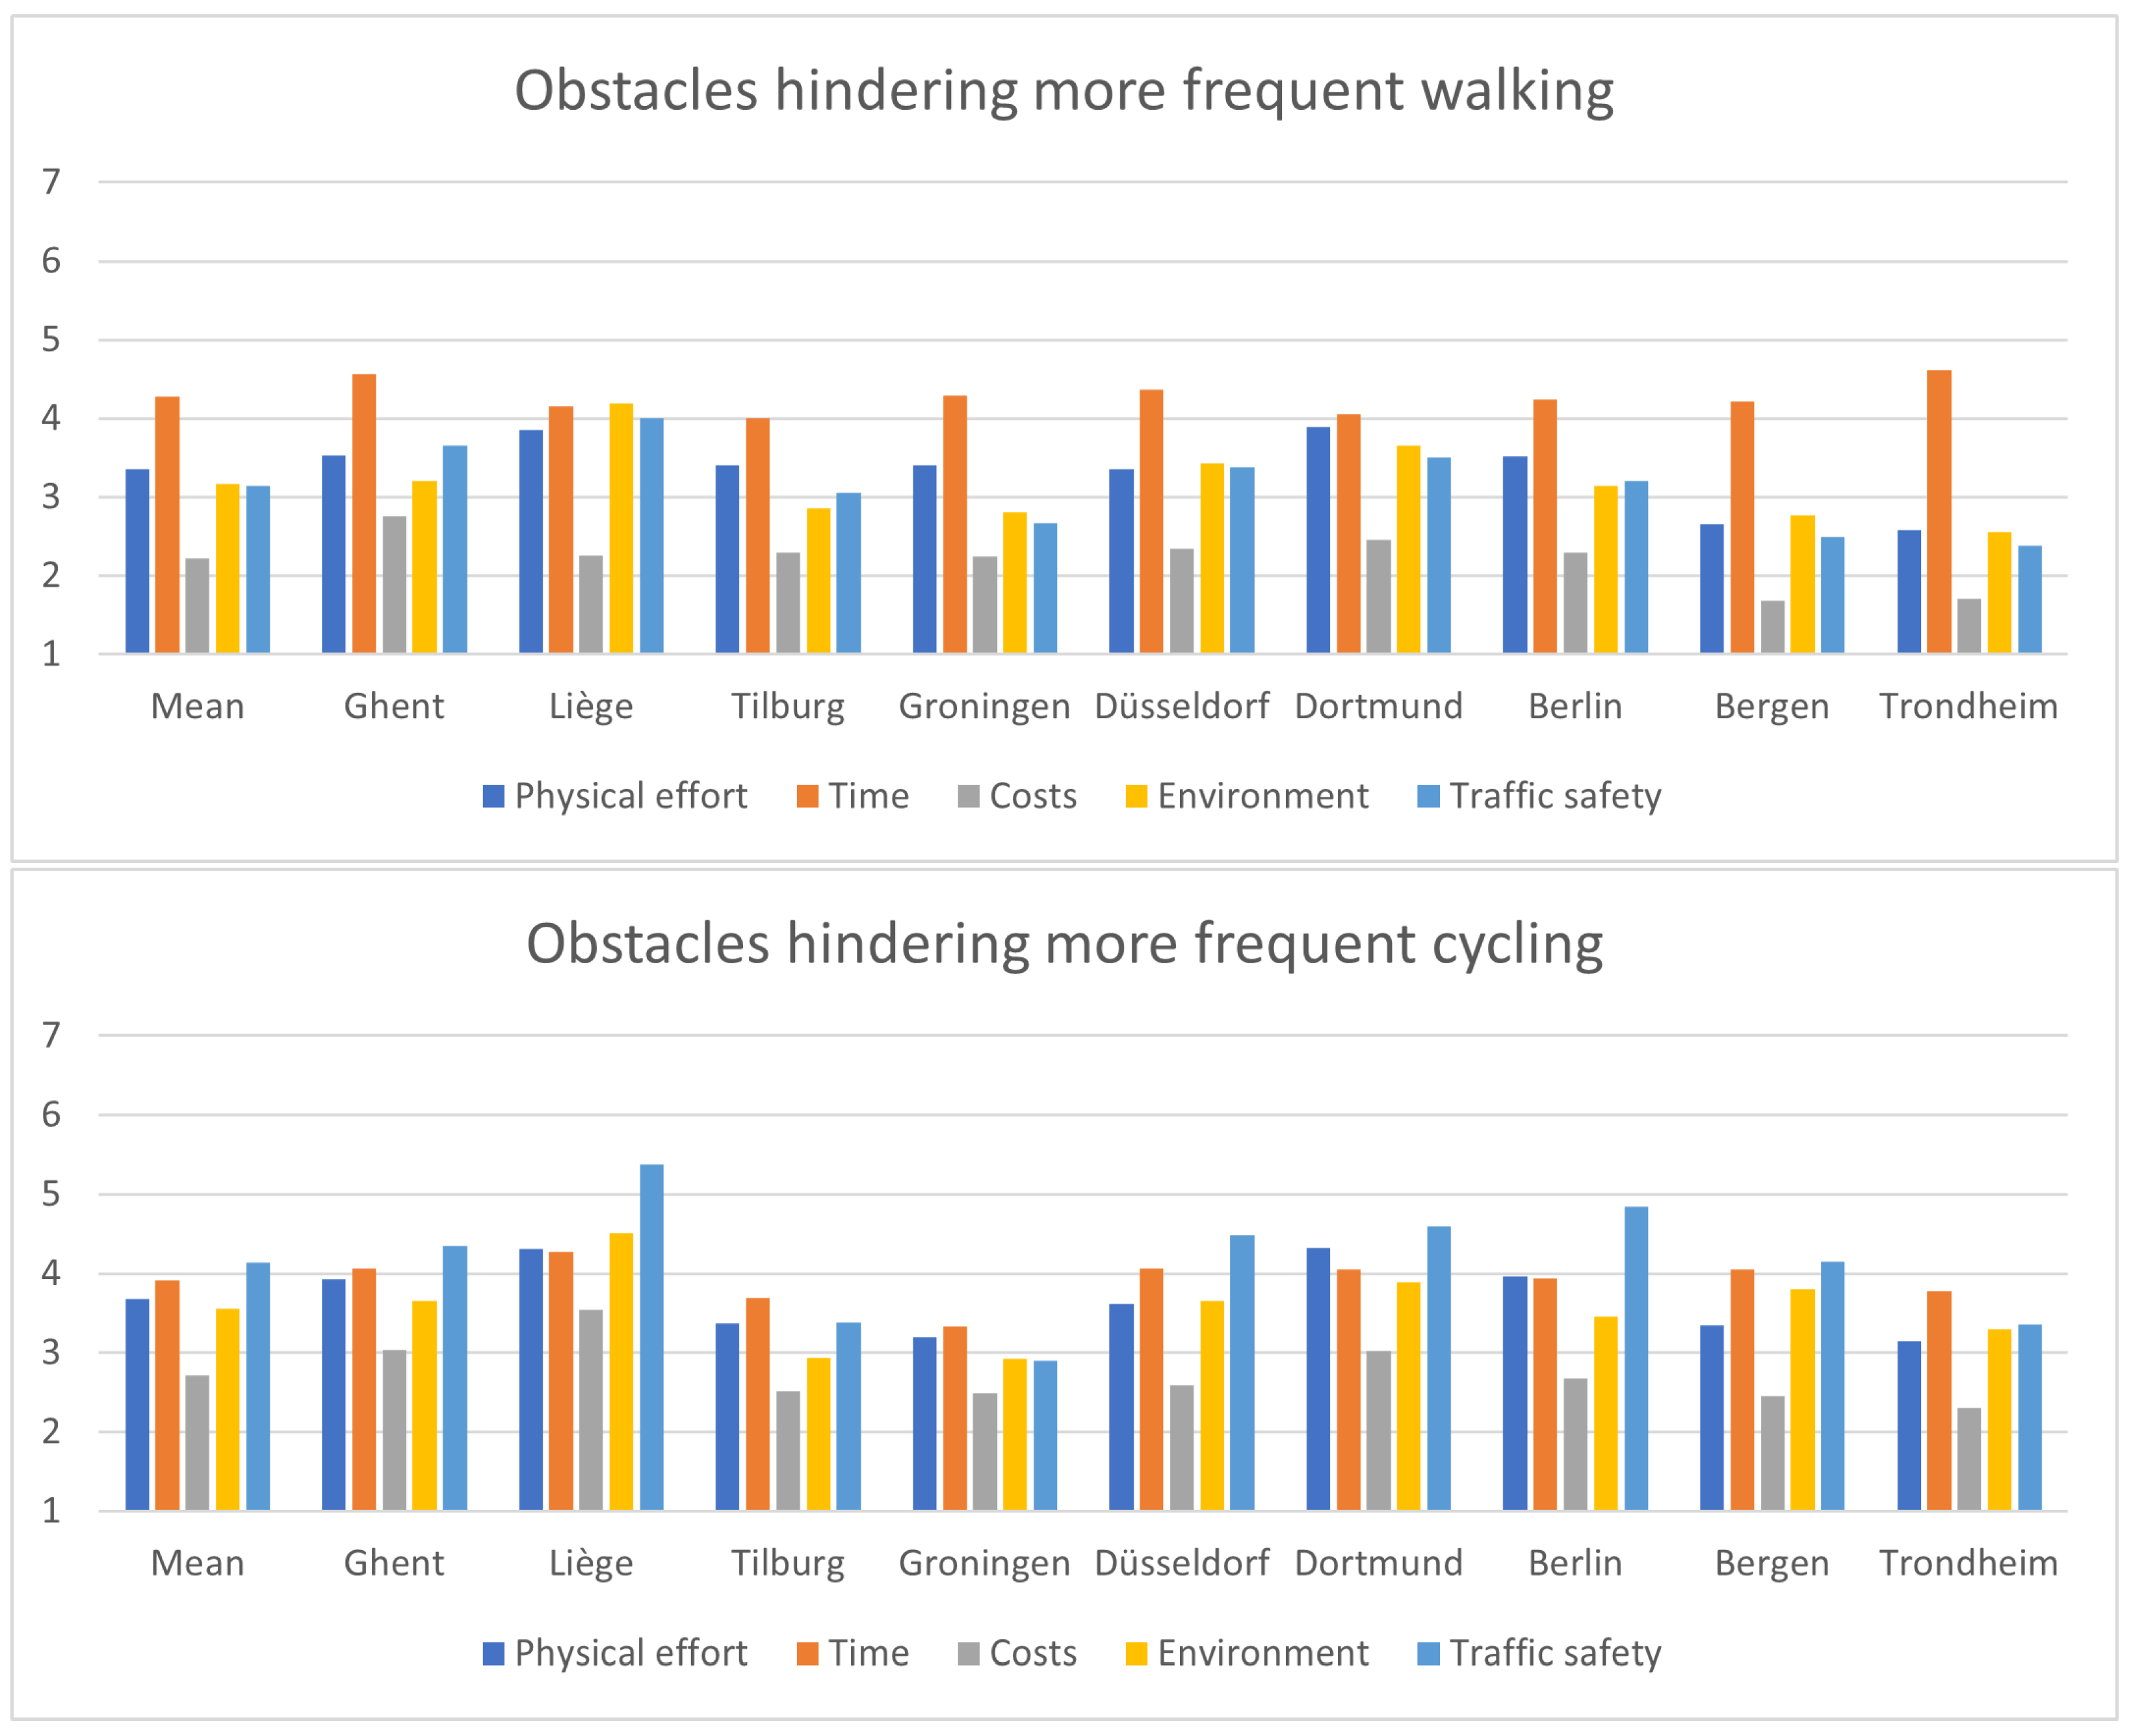
3.1. Descriptive Statistics
3.2. Factor Analysis
3.3. Cluster Analysis
4. Discussion and Conclusions
4.1. Summary of the Results
4.2. Policy Implications
4.2.1. Implications for Cycling Policy
4.2.2. Implications for Walking Policy
4.3. Strengths, Limitations and Future Research
Author Contributions
Funding
Informed Consent Statement
Data Availability Statement
Conflicts of Interest
Abbreviations
| CatPCA | Categorical Principal Component Analysis |
| NEPS | New Ecological Paradigm Scale |
| PBC | Perceived Behavioural Control |
| TPB | Theory of Planned Behaviour |
References
- Agarwal, A.; Ziemke, D.; Nagel, K. Bicycle superhighway: An environmentally sustainable policy for urban transport. Transp. Res. Part A Policy Pract. 2019, 137, 519–540. [Google Scholar] [CrossRef]
- United Nations. World Urbanization Prospects: The 2014 Revision; Technical Report ST/ESA/SER.A/366; United Nations, Department of Economic and Social Affairs, Population Division: New York, NY, USA, 2015. [Google Scholar]
- World Health Organization. Lobal Status Report on Physical Activity 2022; World Health Organization: Geneva, Switzerland, 2022.
- Li, X.; Hu, Q.; Liu, J.; Nambisan, S.; Khattak, A.J.; Lidbe, A.; Lee, H.Y. Pathway analysis of relationships among community development, active travel behavior, body mass index, and self-rated health. Int. J. Sustain. Transp. 2022, 16, 340–356. [Google Scholar] [CrossRef]
- Charreire, H.; Roda, C.; Feuillet, T.; Piombini, A.; Bardos, H.; Rutter, H.; Compernolle, S.; Mackenbach, J.D.; Lakerveld, J.; Oppert, J.M. Walking, cycling, and public transport for commuting and non-commuting travels across 5 European urban regions: Modal choice correlates and motivations. J. Transp. Geogr. 2021, 96, 103196. [Google Scholar] [CrossRef]
- Delclòs-Alió, X.; Rodríguez, D.A.; Medina, C.; Miranda, J.J.; Avila-Palencia, I.; Targa, F.; Moran, M.R.; Sarmiento, O.L.; Quistberg, D.A. Walking for transportation in large Latin American cities: Walking-only trips and total walking events and their sociodemographic correlates. Transp. Rev. 2022, 42, 296–317. [Google Scholar] [CrossRef] [PubMed]
- Ek, K.; Wårell, L.; Andersson, L. Motives for walking and cycling when commuting—Differences in local contexts and attitudes. Eur. Transp. Res. Rev. 2021, 13, 46. [Google Scholar] [CrossRef]
- Pooley, C.G.; Horton, D.; Scheldeman, G.; Tight, M.; Jones, T.; Chisholm, A.; Harwatt, H.; Jopson, A. Household decision-making for everyday travel: A case study of walking and cycling in Lancaster (UK). J. Transp. Geogr. 2011, 19, 1601–1607. [Google Scholar] [CrossRef]
- Lindelöw, D.; Svensson, A.; Sternudd, C.; Johansson, M. What limits the pedestrian? Exploring perceptions of walking in the built environment and in the context of every-day life. J. Transp. Health 2014, 1, 223–231. [Google Scholar] [CrossRef]
- De Witte, A.; Hollevoet, J.; Dobruszkes, F.; Hubert, M.; Macharis, C. Linking modal choice to motility: A comprehensive review. Transp. Res. Part A Policy Pract. 2013, 49, 329–341. [Google Scholar] [CrossRef]
- van de Kaa, E.J. Prospect Theory and Choice Behaviour Strategies: Review and Synthesis of Concepts from Social and Transport sciences. Eur. J. Transp. Infrastruct. Res. 2010, 10, 299–329. [Google Scholar]
- Buehler, R. Determinants of transport mode choice: A comparison of Germany and the USA. J. Transp. Geogr. 2011, 19, 644–657. [Google Scholar] [CrossRef]
- Panter, J.R.; Jones, A. Attitudes and the Environment as Determinants of Active Travel in Adults: What Do and Don’t We Know? J. Phys. Act. Health 2010, 7, 551–561. [Google Scholar] [CrossRef] [PubMed]
- Ajzen, I. The theory of planned behavior. Organ. Behav. Hum. Decis. Process. 1991, 50, 179–211. [Google Scholar] [CrossRef]
- Schwanen, T.; Banister, D.; Anable, J. Rethinking habits and their role in behaviour change: The case of low-carbon mobility. J. Transp. Geogr. 2012, 24, 522–532. [Google Scholar] [CrossRef]
- Willis, D.P.; Manaugh, K.; El-Geneidy, A. Cycling Under Influence: Summarizing the Influence of Perceptions, Attitudes, Habits, and Social Environments on Cycling for Transportation. Int. J. Sustain. Transp. 2015, 9, 565–579. [Google Scholar] [CrossRef]
- Friedrichsmeier, T.; Matthies, E.; Klöckner, C.A. Explaining stability in travel mode choice: An empirical comparison of two concepts of habit. Transp. Res. Part F Traffic Psychol. Behav. 2013, 16, 1–13. [Google Scholar] [CrossRef]
- Kamargianni, M.; Polydoropoulou, A. Hybrid Choice Model to Investigate Effects of Teenagers’ Attitudes toward Walking and Cycling on Mode Choice Behavior. Transp. Res. Rec. 2013, 2382, 151–161. [Google Scholar] [CrossRef]
- Habib, K.N. A Heteroscedastic Polarized Logit Model to Investigate the Competition of Bicycle for the Bikeable Trips with the Other Modes. Transp. Res. Rec. 2018, 2672, 58–68. [Google Scholar] [CrossRef]
- Ton, D.; Duives, D.C.; Cats, O.; Hoogendoorn-Lanser, S.; Hoogendoorn, S.P. Cycling or walking? Determinants of mode choice in the Netherlands. Transp. Res. Part A Policy Pract. 2019, 123, 7–23. [Google Scholar] [CrossRef]
- Biehl, A.; Ermagun, A.; Stathopoulos, A. Modelling determinants of walking and cycling adoption: A stage-of-change perspective. Transp. Res. Part F Traffic Psychol. Behav. 2018, 58, 452–470. [Google Scholar] [CrossRef]
- Bird, E.L.; Panter, J.; Baker, G.; Jones, T.; Ogilvie, D. Predicting walking and cycling behaviour change using an extended Theory of Planned Behaviour. J. Transp. Health 2018, 10, 11–27. [Google Scholar] [CrossRef]
- García, J.; Arroyo, R.; Mars, L.; Ruiz, T. The Influence of Attitudes towards Cycling and Walking on Travel Intentions and Actual Behavior. Sustainability 2019, 11, 2554. [Google Scholar] [CrossRef]
- Hasan, R.A.; Abbas, A.H.; Kwayu, K.M.; Oh, J.S. Role of social dimensions on active transportation and environmental protection: A survey at the University of Samarra, Iraq. J. Transp. Health 2019, 14, 100564. [Google Scholar] [CrossRef]
- Keall, M.; Chapman, R.; Shaw, C.; Abrahamse, W.; Howden-Chapman, P. Are people who already cycle and walk more responsive to an active travel intervention? J. Transp. Health 2018, 10, 84–91. [Google Scholar] [CrossRef]
- De Ceunynck, T.; Wijlhuizen, G.J.; Fyhri, A.; Gerike, R.; Köhler, D.; Ciccone, A.; Dijkstra, A.; Commandeur, J.; Dupont, E.; Cools, M. Determinants and Barriers of Walking, Cycling and Using Personal e-Transporters; ISAAC Project Deliverable D1.1.2; Vias Institute: Brussels, Belgium, 2019. [Google Scholar]
- De Ceunynck, T.; Wijlhuizen, G.J.; Fyhri, A.; Gerike, R.; Köhler, D.; Ciccone, A.; Dijkstra, A.; Dupont, E.; Cools, M. Assessing the Willingness to Use Personal e-Transporters (PeTs): Results from a Cross-National Survey in Nine European Cities. Sustainability 2021, 13, 3844. [Google Scholar] [CrossRef]
- Cools, M.; Brijs, K.; Tormans, H.; Moons, E.; Janssens, D.; Wets, G. The socio-cognitive links between road pricing acceptability and changes in travel-behavior. Transp. Res. Part A Policy Pract. 2011, 45, 779–788. [Google Scholar] [CrossRef]
- Cools, M.; Declercq, K.; Janssens, D.; Wets, G. Onderzoek Verplaatsingsgedrag Vlaanderen 4.2 (2009–2010); Technical Report; Transportation Research Institute, Hasselt University: Diepenbeek, Belgium, 2011. (In Dutch) [Google Scholar]
- Linting, M.; Meulman, J.J.; Groenen, P.J.F.; van der Koojj, A.J. Nonlinear principal components analysis: Introduction and application. Psychol. Methods 2007, 12, 336–358. [Google Scholar] [CrossRef]
- SPSS. The SPSS TwoStep Cluster Component: A Scalable Component Enabling More Efficient Customer Segmentation; White Paper—Technical Report TSCWP-0101; SPSS, Headquarters: Chicago, IL, USA, 2001. [Google Scholar]
- Schepers, P.; Twisk, D.; Fishman, E.; Fyhri, A.; Jensen, A. The Dutch road to a high level of cycling safety. Saf. Sci. 2017, 92, 264–273. [Google Scholar] [CrossRef]
- Pucher, J.; Dill, J.; Handy, S. Infrastructure, programs, and policies to increase bicycling: An international review. Prev. Med. 2010, 50, S106–S125. [Google Scholar] [CrossRef]
- Cervero, R.; Kockelman, K. Travel demand and the 3Ds: Density, diversity, and design. Transp. Res. Part D Transp. Environ. 1997, 2, 199–219. [Google Scholar] [CrossRef]


| Variable | Categories | Full Sample |
|---|---|---|
| Age | 18–34 | 32.7% |
| 35–54 | 33.3% | |
| 55+ | 34.1% | |
| Gender | Female | 50.9% |
| Male | 49.1% | |
| Degree | None/primary education | 3.7% |
| Secondary education | 45.7% | |
| Bachelor’s degree or similar | 32.5% | |
| Master’s degree or higher | 18.1% | |
| Living situation | I live alone | 32.2% |
| I live without a partner, with children | 5.5% | |
| I live with my parents | 8.1% | |
| I live with a partner, without children | 27.8% | |
| I live with a partner and children | 19.9% | |
| Other living situation | 6.5% | |
| Vehicle ownership per household (mean number | Bicycle | 1.45 |
| of vehicles in your household that are available for | Electric bicycle | 0.16 |
| you to use) | Motorized two-wheeler | 0.13 |
| Passenger car | 0.97 | |
| Personal e-Transporters (e.g., electric scooter, monowheel, Segway, hoverboard, etc.) | 0.16 | |
| Season ticket for public transport | Yes | 44.3% |
| No | 55.7% | |
| Car driving license | Yes | 82.4% |
| No | 17.6% | |
| Subscription to a car-sharing system | Yes | 7.8% |
| No | 86.6% | |
| I do not know what this is | 5.6% | |
| Subscription to a bicycle-sharing system | Yes | 4.7% |
| No | 87.0% | |
| I do not know what this is | 8.3% | |
| Can you park your bicycle easily at home? | Yes | 89.0% |
| No | 11.0% | |
| Do you know how to ride a bicycle? | Yes | 95.5% |
| No | 4.0% | |
| Prefer not to answer | 0.5% | |
| To what extent do you experience difficulties in | It is no problem for me | 89.8% |
| walking (for at least 10 min) because of | It is possible, but with difficulty | 7.8% |
| physical reasons? | It is only possible with special assistance | 2.0% |
| Is impossible | 0.5% | |
| To what extent do you experience difficulties in | It is no problem for me | 80.7% |
| cycling because of physical reasons? | It is possible, but with difficulty | 11.6% |
| It is only possible with special assistance | 2.3% | |
| It is impossible | 5.5% |
| Cycling | Walking | ||
|---|---|---|---|
| Label | Interpretation | Label | Interpretation |
| CATT1 | Cycling Attitude 1: for me to cycle for my daily travel from my current place of residence would be: Fast | WATT1 | Walking Attitude 1: for me, walking for daily travel from my current place of residence would be: Fast |
| CATT2 | Cycling Attitude 2: for me to cycle for my daily travel from my current place of residence would be: Convenient | WATT2 | Walking Attitude 2: for me, walking for daily travel from my current place of residence would be: Convenient |
| CATT3 | Cycling Attitude 3: for me to cycle for my daily travel from my current place of residence would be: Safe | WATT3 | Walking Attitude 3: for me, walking for daily travel from my current place of residence would be: Safe |
| CATT4 | Cycling Attitude 4: for me to cycle for my daily travel from my current place of residence would be: Good | WATT4 | Walking Attitude 4: for me, walking for daily travel from my current place of residence would be: Good |
| CATT5 | Cycling Attitude 5: for me to cycle for my daily travel from my current place of residence would be: Pleasant | WATT5 | Walking Attitude 5: for me, to walk for daily travel from my current place of residence would be: Pleasant |
| CNORM1 | Cycling Norm 1: people who are important to me think I should cycle more (injuctive norm) | WNORM1 | Walking Norm 1: people who are important to me think I should walk more (injuctive norm) |
| CNORM2 | Cycling Norm 2: people who are important to me cycle for their daily travel (descriptive norm) | WNORM2 | Walking Norm 2: people who are important to me walk for their daily travel (descriptive norm) |
| CNORM3 | Cycling Norm 3: because of my own values/principles I feel an obligation to cycle instead of using the car for everyday travel | WNORM3 | Walking Norm 3: because of my own values/principles I feel an obligation to walk instead of using the car for everyday travel |
| CCON1 | Cycling PBC—Controllability 1: in my city, the existing infrastructure makes it easier for me to cycle | WCON1 | Walking PBC—Controllability 1: in my city, the existing infrastructure makes it easier for me to walk |
| CCON2 | Cycling PBC—Controllability 2: in my city, I could/can park my bicycle securely | ||
| CCON3 | Cycling PBC—Controllability 3: in my city, there are hills, changes in level and slopes which hinder routine cycling | WCON2 | Walking PBC—Controllability 2: in my city, there are hills, changes in level and slopes which hinder routine walking |
| CSE1 | Cycling PBC—Self-efficacy 1: I am capable of riding my bicycle through traffic | WSE1 | Walking PBC—Self-efficacy 1: I am capable of crossing a street as a pedestrian with dense traffic |
| CSE2 | Cycling PBC—Self-efficacy 2: I am capable of going uphill or over rough terrain on a bicycle | WSE2 | Walking PBC—Self-efficacy 2: I am capable of walking uphill or over rough terrain |
| CSE3 | Cycling PBC—Self-efficacy 3: I am capable of riding my bicycle for at least 30 min | WSE3 | Walking PBC—Self-efficacy 3: I am capable of walking for at least 30 min |
| Cycling | Walking | ||
|---|---|---|---|
| Label | Interpretation | Label | Interpretation |
| CINT1 | Cycling Intention 1: my intention to cycle instead of using the car in the next few weeks for everyday trips is | WINT1 | Walking Intention 1: my intention to walk instead of using the car in the next few weeks for everyday trips is |
| CINT2 | Cycling Intention 2: how likely is it that in the next weeks, you will cycle instead of using the car for everyday routes | WINT2 | Walking Intention 2: how likely is it that in the next weeks, you will walk instead of using the car for everyday routes |
| CINT3 | Cycling Intention 3: I intend to cycle instead of using the car in the next few weeks for everyday trips in my city | WINT3 | Walking Intention 3: I intend to walk instead of using the car in the next few weeks for everyday trips in my city |
| CBEH1 | Cycling Behaviour 1: # trips the past 30 days you made by bicycle: to work/school | WBEH1 | Walking Behaviour 1: # trips the past 30 days you walk: to work/school |
| CBEH2 | Cycling Behaviour 2: # trips the past 30 days you made by bicycle: to do shopping and errands | WBEH2 | Walking Behaviour 2: # trips the past 30 days you walk: to do shopping and errands |
| CBEH3 | Cycling Behaviour 3: # trips the past 30 days you made by bicycle: to participate in leisure activities | WBEH3 | Walking Behaviour 3: # trips the past 30 days you walk: to participate in leisure activities |
| HAB1 | Habit 1: the way I travel to work/school is an ingrained routine | ||
| HAB2 | Habit 2: the way I travel to shopping locations is an ingrained routine | ||
| HAB3 | Habit 3: the way I travel to leisure locations is an ingrained routine | ||
| Variable | Ghent | Liège | Tilburg | Groningen | Düsseldorf | Dortmund | Berlin | Bergen | Trondheim |
|---|---|---|---|---|---|---|---|---|---|
| CATT1 | 4.765 | 3.755 | 4.841 | 5.638 | 4.539 | 4.078 | 4.476 | 2.994 | 4.302 |
| CATT2 | 4.794 | 3.814 | 5.002 | 5.695 | 4.465 | 4.063 | 4.644 | 2.836 | 4.080 |
| CATT3 | 3.998 | 3.039 | 4.990 | 5.563 | 4.285 | 4.074 | 3.911 | 3.351 | 4.572 |
| CATT4 | 4.910 | 4.395 | 5.263 | 5.789 | 4.561 | 4.185 | 4.668 | 3.553 | 4.554 |
| CATT5 | 4.512 | 3.867 | 4.894 | 5.534 | 4.242 | 3.796 | 4.261 | 3.135 | 4.211 |
| WATT1 | 4.045 | 3.549 | 4.101 | 4.185 | 3.825 | 3.915 | 3.957 | 3.721 | 3.939 |
| WATT2 | 4.684 | 4.245 | 4.685 | 4.707 | 4.453 | 4.309 | 4.694 | 4.138 | 4.479 |
| WATT3 | 5.232 | 4.710 | 5.359 | 5.573 | 5.059 | 4.785 | 5.169 | 5.232 | 5.585 |
| WATT4 | 5.288 | 5.077 | 5.287 | 5.281 | 4.792 | 4.697 | 4.915 | 5.027 | 5.305 |
| WATT5 | 4.996 | 4.616 | 4.910 | 5.029 | 4.528 | 4.367 | 4.665 | 4.646 | 5.165 |
| CNORM1 | 3.079 | 2.588 | 3.121 | 2.583 | 3.153 | 3.308 | 2.906 | 2.387 | 2.723 |
| CNORM2 | 4.014 | 2.562 | 4.024 | 4.563 | 3.578 | 3.580 | 3.632 | 2.282 | 3.396 |
| CNORM3 | 4.029 | 2.643 | 3.913 | 4.267 | 3.664 | 3.501 | 3.615 | 2.289 | 3.176 |
| WNORM1 | 3.060 | 3.261 | 3.107 | 2.681 | 3.404 | 3.429 | 2.990 | 2.828 | 2.904 |
| WNORM2 | 3.767 | 3.470 | 3.620 | 3.623 | 4.176 | 4.157 | 4.026 | 3.166 | 3.271 |
| WNORM3 | 4.281 | 3.840 | 3.915 | 3.782 | 4.296 | 3.973 | 3.902 | 3.495 | 3.665 |
| CCON1 | 4.224 | 2.978 | 5.221 | 5.691 | 4.303 | 3.976 | 4.054 | 3.225 | 4.789 |
| CCON2 | 4.521 | 3.301 | 5.325 | 5.112 | 4.755 | 4.497 | 4.592 | 4.057 | 4.964 |
| CCON3 | 4.305 | 3.589 | 5.624 | 5.365 | 4.804 | 3.901 | 4.791 | 3.400 | 4.267 |
| WCON1 | 4.877 | 5.055 | 5.152 | 5.610 | 5.378 | 5.026 | 5.281 | 5.358 | 5.504 |
| WCON2 | 5.210 | 4.386 | 5.725 | 5.712 | 5.394 | 4.617 | 5.359 | 5.320 | 5.574 |
| CSE1 | 5.135 | 4.084 | 5.728 | 6.130 | 5.619 | 5.069 | 5.520 | 4.684 | 5.481 |
| CSE2 | 4.681 | 3.395 | 4.727 | 5.299 | 4.808 | 4.185 | 4.745 | 4.692 | 5.432 |
| CSE3 | 5.522 | 4.688 | 5.700 | 6.137 | 6.034 | 5.328 | 5.901 | 5.545 | 6.185 |
| WSE1 | 6.338 | 6.024 | 6.082 | 6.360 | 6.083 | 5.847 | 5.971 | 6.680 | 6.602 |
| WSE2 | 5.746 | 5.082 | 5.174 | 5.521 | 5.519 | 5.162 | 5.414 | 6.423 | 6.482 |
| WSE3 | 6.192 | 5.872 | 5.805 | 5.979 | 6.214 | 5.735 | 6.015 | 6.539 | 6.645 |
| CINT1 | 4.322 | 2.673 | 4.834 | 5.746 | 3.954 | 3.720 | 4.161 | 2.659 | 3.861 |
| CINT2 | 4.443 | 2.624 | 4.684 | 5.753 | 3.875 | 3.527 | 3.907 | 2.449 | 3.659 |
| CINT3 | 4.425 | 2.541 | 4.752 | 5.684 | 4.012 | 3.602 | 3.989 | 2.283 | 3.609 |
| WINT1 | 4.821 | 4.376 | 4.475 | 4.759 | 4.641 | 4.494 | 4.721 | 4.216 | 4.520 |
| WINT2 | 4.624 | 4.451 | 4.442 | 4.618 | 4.581 | 4.304 | 4.624 | 4.101 | 4.344 |
| WINT3 | 4.746 | 4.415 | 4.333 | 4.767 | 4.677 | 4.399 | 4.714 | 4.101 | 4.401 |
| CBEH1 | 7.613 | 0.943 | 6.695 | 12.167 | 3.915 | 2.377 | 3.918 | 1.517 | 5.368 |
| CBEH2 | 6.361 | 1.644 | 7.573 | 13.117 | 5.077 | 4.467 | 4.205 | 1.471 | 3.565 |
| CBEH3 | 4.635 | 1.542 | 5.750 | 8.975 | 4.240 | 4.085 | 3.761 | 1.319 | 2.695 |
| WBEH1 | 4.655 | 5.863 | 3.098 | 3.726 | 5.283 | 4.572 | 5.550 | 8.421 | 5.039 |
| WBEH2 | 9.412 | 8.929 | 8.176 | 10.149 | 10.635 | 9.746 | 13.060 | 8.522 | 9.708 |
| WBEH3 | 5.549 | 5.527 | 4.693 | 6.058 | 6.459 | 7.863 | 7.519 | 5.471 | 4.792 |
| HAB1 | 5.415 | 4.733 | 5.098 | 5.348 | 5.479 | 5.109 | 5.245 | 5.417 | 5.661 |
| HAB2 | 5.566 | 4.845 | 5.576 | 5.754 | 5.634 | 5.650 | 5.862 | 5.640 | 5.501 |
| HAB3 | 4.849 | 4.224 | 4.976 | 5.368 | 4.638 | 4.607 | 4.584 | 5.259 | 5.288 |
| Indicator | Attitudes | Norm | PBC | Intention | Habit | Behaviour | ||||||||
|---|---|---|---|---|---|---|---|---|---|---|---|---|---|---|
| 1 | 2 | 1 | 2 | 1 | 2 | 3 | 4 | 1 | 2 | 1 | 2 | 1 | 2 | |
| CATT1 | 0.860 | 0.265 | ||||||||||||
| CATT2 | 0.886 | 0.207 | ||||||||||||
| CATT3 | 0.837 | 0.175 | ||||||||||||
| CATT4 | 0.893 | 0.176 | ||||||||||||
| CATT5 | 0.889 | 0.182 | ||||||||||||
| WATT1 | 0.138 | 0.824 | ||||||||||||
| WATT2 | 0.152 | 0.888 | ||||||||||||
| WATT3 | 0.279 | 0.748 | ||||||||||||
| WATT4 | 0.217 | 0.860 | ||||||||||||
| WATT5 | 0.195 | 0.878 | ||||||||||||
| CNORM1 | 0.267 | 0.819 | ||||||||||||
| CNORM2 | 0.749 | 0.186 | ||||||||||||
| CNORM3 | 0.847 | 0.084 | ||||||||||||
| WNORM1 | 0.135 | 0.907 | ||||||||||||
| WNORM2 | 0.642 | 0.379 | ||||||||||||
| WNORM3 | 0.754 | 0.202 | ||||||||||||
| CCON1 | −0.079 | 0.280 | 0.794 | 0.124 | ||||||||||
| CCON2 | 0.031 | 0.215 | 0.748 | 0.009 | ||||||||||
| CCON3 | −0.069 | 0.179 | 0.081 | 0.898 | ||||||||||
| WCON1 | 0.422 | −0.149 | 0.674 | 0.129 | ||||||||||
| WCON2 | 0.308 | −0.035 | 0.109 | 0.842 | ||||||||||
| CSE1 | 0.153 | 0.830 | 0.211 | 0.093 | ||||||||||
| CSE2 | 0.254 | 0.851 | 0.127 | 0.015 | ||||||||||
| CSE3 | 0.379 | 0.785 | 0.115 | 0.102 | ||||||||||
| WSE1 | 0.792 | 0.178 | 0.109 | 0.118 | ||||||||||
| WSE2 | 0.803 | 0.354 | 0.018 | 0.029 | ||||||||||
| WSE3 | 0.858 | 0.243 | 0.044 | 0.079 | ||||||||||
| CINT1 | 0.934 | 0.145 | ||||||||||||
| CINT2 | 0.954 | 0.179 | ||||||||||||
| CINT3 | 0.955 | 0.168 | ||||||||||||
| WINT1 | 0.160 | 0.920 | ||||||||||||
| WINT2 | 0.164 | 0.953 | ||||||||||||
| WINT3 | 0.164 | 0.949 | ||||||||||||
| HAB1 | 0.057 | 0.997 | ||||||||||||
| HAB2 | 0.892 | 0.002 | ||||||||||||
| HAB3 | 0.882 | 0.102 | ||||||||||||
| CBEH1 | 0.760 | −0.045 | ||||||||||||
| CBEH2 | 0.878 | 0.048 | ||||||||||||
| CBEH3 | 0.867 | 0.152 | ||||||||||||
| WBEH1 | −0.118 | 0.693 | ||||||||||||
| WBEH2 | 0.075 | 0.812 | ||||||||||||
| WBEH3 | 0.211 | 0.800 | ||||||||||||
| Cluster 1 (55.6%) | Cluster 2 (44.4%) | 2-Sample t-Test | ||||
|---|---|---|---|---|---|---|
| Categorical Principal Component Analysis Factor | Mean | Std Dev | Mean | Std Dev | t-Value | p-Value |
| Attitude Factor 1: general cycling attitude | 0.58 | 0.62 | −0.73 | 0.91 | 37.07 | <0.001 |
| Attitude Factor 2: general walking attitude | 0.01 | 0.88 | −0.02 | 1.13 | 0.58 | 0.563 |
| Norm Factor 1: descriptive and personal norm | 0.54 | 0.63 | −0.68 | 0.96 | 32.80 | <0.001 |
| Norm Factor 2: injunctive norm | 0.04 | 1.05 | −0.05 | 0.93 | 2.09 | 0.037 |
| PBC Factor 1: self-efficacy (capability) in walking skills | −0.14 | 0.93 | 0.18 | 1.06 | −7.06 | <0.001 |
| PBC Factor 2: self-efficacy (capability) in cycling skills | 0.44 | 0.56 | −0.55 | 1.14 | 23.99 | <0.001 |
| PBC Factor 3: inducive cycling and walking facilities | 0.21 | 0.99 | −0.26 | 0.95 | 10.91 | <0.001 |
| PBC Factor 4: hills/levels/slopes hinder routine cycling/ walking | 0.00 | 1.03 | 0.01 | 0.96 | −0.21 | 0.831 |
| Habit Factor 1: shopping and leisure trips | −0.03 | 1.00 | 0.04 | 0.99 | −1.57 | 0.116 |
| Habit Factor 2: work/school trips | 0.23 | 0.71 | −0.28 | 1.22 | 11.10 | <0.001 |
| BEH Factor 1: cycling behaviour | 0.61 | 0.91 | −0.76 | 0.43 | 44.83 | <0.001 |
| BEH Factor 2: walking behaviour | 0.06 | 1.02 | −0.08 | 0.97 | 3.26 | 0.001 |
| Intention Factor 1: Cycling intention | 0.73 | 0.55 | −0.91 | 0.62 | 61.85 | <0.001 |
| Intention Factor 2: Walking intention | 0.09 | 0.86 | −0.12 | 1.14 | 4.64 | <0.001 |
| Pro-Cycling | Non-Pro-Cycling | |||
|---|---|---|---|---|
| Variable | Cluster (55.6%) | Cluster (44.4%) | Chi-Value | p-Value |
| City | 332.57 | <0.001 | ||
| Ghent | 65.5% | 34.5% | ||
| Liège | 30.3% | 69.7% | ||
| Tilburg | 73.9% | 26.1% | ||
| Groningen | 87.7% | 12.3% | ||
| Düsseldorf | 63.8% | 36.2% | ||
| Dortmund | 54.9% | 45.1% | ||
| Berlin | 58.3% | 41.7% | ||
| Bergen | 18.4% | 81.6% | ||
| Trondheim | 47.1% | 52.9% | ||
| Age | 74.00 | <0.001 | ||
| 18–34 | 66.0% | 34.0% | ||
| 35–54 | 57.1% | 42.9% | ||
| 55+ | 42.8% | 57.2% | ||
| Gender | 8.92 | 0.003 | ||
| Male | 58.9% | 41.1% | ||
| Female | 52.3% | 47.7% | ||
| Degree | 19.09 | <0.001 | ||
| None/Primary education | 31.8% | 68.2% | ||
| Secondary education | 54.4% | 45.6% | ||
| Bachelor’s degree or similar | 57.4% | 42.6% | ||
| Master’s degree or higher | 59.5% | 40.5% | ||
| Living situation | 18.33 | 0.003 | ||
| I live alone | 55.5% | 44.5% | ||
| I live without a partner, with children | 50.5% | 49.5% | ||
| I live with my parents | 56.3% | 43.7% | ||
| I live with a partner, without children | 52.9% | 47.1% | ||
| I live with a partner and children | 63.6% | 36.4% | ||
| Other living situation | 46.1% | 53.9% | ||
| Season ticket for public transportation | 15.02 | <0.001 | ||
| No | 51.8% | 48.2% | ||
| Yes | 60.4% | 39.6% | ||
| Car driving licence or permit | 0.62 | 0.430 | ||
| No | 57.5% | 42.5% | ||
| Yes | 55.2% | 44.8% | ||
| Subscription to a car-sharing system | 31.37 | <0.001 | ||
| Yes | 75.5% | 24.5% | ||
| No | 53.4% | 46.6% | ||
| I don’t know what a car-sharing system is | 61.2% | 38.8% | ||
| Subscription to a bicycle-sharing system | 45.63 | <0.001 | ||
| Yes | 88.6% | 11.5% | ||
| No | 54.0% | 46.1% | ||
| I do not know what a bicycle-sharing system is | 53.4% | 46.6% |
| Pro-Cycling | Non-Pro-Cycling | ||||||
|---|---|---|---|---|---|---|---|
| Cluster (55.6%) | Cluster (44.4%) | Difference | 2-Sample t-Test | ||||
| Variable | Mean | Std Dev | Mean | Std Dev | Mean | t-Value | p-Value |
| Vehicle ownership per household | |||||||
| Number of bicycles | 1.90 | 1.36 | 1.06 | 1.25 | 0.84 | 14.30 | <0.001 |
| Number of e-bike | 0.24 | 0.61 | 0.06 | 0.34 | 0.18 | 8.14 | <0.001 |
| Number of motorcycles | 0.18 | 0.50 | 0.08 | 0.33 | 0.10 | 5.84 | <0.001 |
| Number of cars | 0.95 | 0.82 | 1.03 | 0.77 | −0.08 | −2.37 | 0.018 |
| Number of segways | 0.07 | 0.36 | 0.01 | 0.14 | 0.06 | 4.62 | <0.001 |
| Number of e-scooters | 0.08 | 0.44 | 0.01 | 0.10 | 0.07 | 5.58 | <0.001 |
| Number of solowheels | 0.04 | 0.28 | 0.01 | 0.09 | 0.03 | 4.07 | <0.001 |
| Number of hoverboards | 0.09 | 0.39 | 0.02 | 0.14 | 0.07 | 5.66 | <0.001 |
| New ecological paradigm scale | 5.40 | 1.01 | 5.35 | 1.16 | 0.05 | 0.91 | 0.365 |
| Obstacles to use the bicycle more frequently | |||||||
| Physical effort | 3.47 | 1.87 | 3.92 | 2.02 | −0.45 | −5.27 | <0.001 |
| Time | 3.86 | 1.85 | 3.97 | 2.11 | −0.11 | −1.19 | 0.235 |
| Costs | 2.86 | 1.91 | 2.55 | 1.83 | 0.31 | 3.73 | <0.001 |
| Environment (climate, hilliness) | 3.48 | 1.90 | 3.66 | 2.05 | −0.18 | −2.00 | 0.045 |
| Traffic safety | 3.84 | 1.88 | 4.50 | 2.12 | −0.66 | −7.24 | <0.001 |
| Obstacles to walk more frequently | |||||||
| Physical effort | 3.30 | 1.99 | 3.16 | 2.03 | 0.14 | 1.62 | 0.106 |
| Time | 4.54 | 1.93 | 4.05 | 2.25 | 0.49 | 5.23 | <0.001 |
| Costs | 2.51 | 1.93 | 1.80 | 1.48 | 0.71 | 8.99 | <0.001 |
| Environment (climate, hilliness) | 3.15 | 1.95 | 3.07 | 2.02 | 0.08 | 0.96 | 0.336 |
| Traffic safety | 3.18 | 1.96 | 3.01 | 2.03 | 0.17 | 1.91 | 0.056 |
Disclaimer/Publisher’s Note: The statements, opinions and data contained in all publications are solely those of the individual author(s) and contributor(s) and not of MDPI and/or the editor(s). MDPI and/or the editor(s) disclaim responsibility for any injury to people or property resulting from any ideas, methods, instructions or products referred to in the content. |
© 2023 by the authors. Licensee MDPI, Basel, Switzerland. This article is an open access article distributed under the terms and conditions of the Creative Commons Attribution (CC BY) license (https://creativecommons.org/licenses/by/4.0/).
Share and Cite
De Ceunynck, T.; Wijlhuizen, G.J.; Fyhri, A.; Gerike, R.; Köhler, D.; Ciccone, A.; Dijkstra, A.; Dupont, E.; Cools, M. Behavioural Profiling of Cycling and Walking in Nine European Cities. Sustainability 2023, 15, 1996. https://doi.org/10.3390/su15031996
De Ceunynck T, Wijlhuizen GJ, Fyhri A, Gerike R, Köhler D, Ciccone A, Dijkstra A, Dupont E, Cools M. Behavioural Profiling of Cycling and Walking in Nine European Cities. Sustainability. 2023; 15(3):1996. https://doi.org/10.3390/su15031996
Chicago/Turabian StyleDe Ceunynck, Tim, Gert Jan Wijlhuizen, Aslak Fyhri, Regine Gerike, Dagmar Köhler, Alice Ciccone, Atze Dijkstra, Emmanuelle Dupont, and Mario Cools. 2023. "Behavioural Profiling of Cycling and Walking in Nine European Cities" Sustainability 15, no. 3: 1996. https://doi.org/10.3390/su15031996
APA StyleDe Ceunynck, T., Wijlhuizen, G. J., Fyhri, A., Gerike, R., Köhler, D., Ciccone, A., Dijkstra, A., Dupont, E., & Cools, M. (2023). Behavioural Profiling of Cycling and Walking in Nine European Cities. Sustainability, 15(3), 1996. https://doi.org/10.3390/su15031996