Abstract
The present capabilities for collecting and storing all kinds of data exceed the collective ability to analyze, summarize, and extract knowledge from this data. Knowledge management aims to automatically organize a systematic process of learning. Most meta-learning strategies are based on determining data characteristics, usually by computing data complexity measures. Such measures describe data characteristics related to size, shape, density, and other factors. However, most of the data complexity measures in the literature assume the classification problem is binary (just two decision classes), and that the data is numeric and has no missing values. The main contribution of this paper is that we extend four data complexity measures to overcome these drawbacks for characterizing multiclass, hybrid, and incomplete supervised data. We change the formulation of Feature-based measures by maintaining the essence of the original measures, and we use a maximum similarity graph-based approach for designing Neighborhood measures. We also use ordering weighting average operators to avoid biases in the proposed measures. We included the proposed measures in the EPIC software for computational availability, and we computed the measures for publicly available multiclass hybrid and incomplete datasets. In addition, the performance of the proposed measures was analyzed, and we can confirm that they solve some of the biases of previous ones and are capable of natively handling mixed, incomplete, and multiclass data without any preprocessing needed.
1. Introduction
Several disciplines, such as Pattern Recognition, Machine Learning, Computational Intelligence, and Artificial Intelligence share an interest in automatic knowledge management strategies [1]. The latter is becoming an active research area useful for several daily-life aspects such as environmental concerns (i.e., clothing sustainability [2], fault detection in the subsea [3], and pollution analysis [4]), education (teacher training [5] and other educational applications [6]), and health (disease prediction [7], secure Internet of Things in healthcare [8] and other healthcare challenges [9]), among others.
There are numerous supervised classification algorithms, such as Neighborhood-based classifiers [10], Decision trees [11], Neural networks [12], Support vector machines [13], Associative classifiers [14], and Logical-combinatorial classifiers [15]. However, because of the No Free Lunch theorems [16], no algorithm will outperform all others for all problems and performance measures. That is why meta-learning, as a knowledge management technique, is the focus of several research efforts [17,18,19].
Most meta-learning strategies are based on determining data characteristics, usually by computing data complexity measures [20,21]. Such measures aim at describing data characteristics [22,23,24] related to size, shape, density, and others. However, the majority of the data complexity measures in the literature assume the classification problem is binary (just two decision classes), and that the data is numeric and has no missing values.
Unfortunately, in many real-life applications, such assumptions are not fulfilled. Real data is often hybrid (described by both numeric and categorical attributes) and can present an absence of information. In addition, several problems have multiple possible outcomes or decisions to make; they have multiple decision classes.
As stated before, data complexity measures [20] are usually defined for numeric, complete, and binary classification problems. Therefore, our aim is to extend the measures for characterizing multiclass, hybrid, and incomplete supervised data. The main contributions of this paper are the following:
- We extend four data complexity measures for the multiclass classification scenario and for dealing with hybrid and incomplete data.
- We include the proposed four measures in the EPIC software [25,26] for computational availability.
- We compute the proposed measures for publicly available multiclass hybrid and incomplete datasets.
This paper is organized as follows: Section 2 reviews some of the related works on data complexity measures. Section 3 introduces the extended data complexity measures, and Section 4 shows some of the properties of the proposed measures, as well as their computation over publicly available datasets. Finally, we present some conclusions and future works.
2. Related Works
This section reviews the existing data complexity measures of the Feature-based, Linearity, and Neighborhood taxonomies for dealing with single-label supervised classification. Section 2.1 offers the preliminary concepts. Section 2.2 details Feature-based complexity measures. Section 2.3 explains Linearity measures, and Section 2.4 covers Neighborhood measures.
2.1. Preliminaries
Let U be a universe of instances, described by a set of features . Each attribute has a definition domain, which can be Boolean, numeric, or categorical, and can have missing values (denoted by ?). Let be an instance. Its value in the i-th feature is denoted by . Let us have a decision attribute or label and a set of decision classes . The true label value of the instance is denoted by . If the decision class has two values, we have a binary single-label classification. On the other hand, if has more than two values, we have a multi-class single-label classification problem (Figure 1).
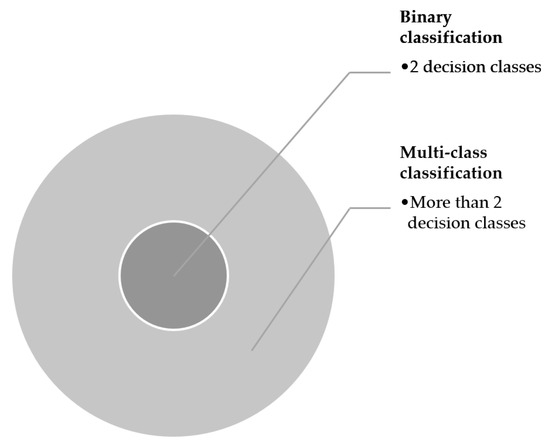
Figure 1.
Different scenarios in supervised classification while considering a decision label.
Since 2002, there has been an interest in assessing the complexity of supervised data for automatic classification problems [23]. Several data complexity measures have been introduced [27].
An established taxonomy of data complexity measures is the following [27]:
- Feature-based measures describe how useful the features are to separate the classes.
- Linearity measures try to determine the extent of linear separation between the classes.
- Neighborhood measures characterize class overlapping in neighborhoods.
- Network measures focus on the structural information of the data.
- Dimensionality measures estimate data sparsity.
- Class imbalance measures consider the number of instances in the classes.
In the following analysis, we survey some of the most used data complexity measures of the Feature-based, Linearity, and Neighborhood taxonomies and describe their advantages and disadvantages and their potential to be extended for multidimensional classification.
2.2. Feature-Based Measures
Feature-based measures consider the individual power of the features regarding the classification task. They are usually easy to compute, but they do not consider feature dependencies.
2.2.1. Maximum Fisher’s Discriminant Ratio (F1)
F1 is a measure devoted to assessing the discriminant power of individual features. It is given by:
where is a discriminant ratio for the i-th feature. Several formulations of exist in the literature, all considering means and standard deviation of classes. Let and be the means of the classes, and let and be the standard deviations. The original formulation by Ho and Basu [23] is:
The F1 measure has several drawbacks. It assumes data is numeric and complete (no missing values) and that the classification problem is binary. In addition, it assumes that the linear boundary is perpendicular to one of the feature axes. If features are separable but with an oblique line, it does not capture such information.
2.2.2. Volume of the Overlapping Region (F2)
The original F2 formulation [23] has the same disadvantages as F1 and fails in classes where one or more features occupy different intervals. It is also susceptible to noise in the data.
where and are the maximum and minimum values is a feature for class cj ∈ {1, 2}, respectively.
F2 measure has the same disadvantages as F1 but also fails in classes where one or more features occupy different intervals. It is also susceptible to noise in the data. To overcome some of these drawbacks, Cummins introduced a modified version (F2’) [28].
2.2.3. Maximum Individual Feature Efficiency (F3)
F3 measures the capability of individual features for class separation as follows:
where is the number of overlapping instances according to , is the indicator function, and is the number of instances (), as:
In the same manner as F1 and F2, the F3 measure assumes data is numeric, complete, and has only two decision classes.
2.3. Linearity Measures
Linearity measures aim at determining if it is possible to separate the classes by a hyperplane under the hypothesis that a linearly separable problem is simpler than a non-linear one.
2.3.1. Sum of the Error Distance by Linear Programming (L1)
This measure computes the sum of the distances of the instances incorrectly classified as:
where an optimization process of a Support Vector Machine (SVM), which is used to compute the desired hyperplane, determines values.
2.3.2. Error Rate of Linear Classifier (L2)
L2 computes the error ratio of the linear SVM classifier. Let be the linear classifier, L2 is computed as:
The main issues with L1 and L2 these measures are:
- It assumes two classes, as it uses an SVM;
- It assumes data is numeric and complete;
- It uses a fixed classifier (SVM) to establish the linearity of the data.
2.3.3. Non-linearity of Linear Classifier (L3)
The L3 measure starts by obtaining an interpolated set of instances of cardinality . Let be the linear classifier obtained using the training data and be the interpolated instances; L3 is as follows:
According to [27], L3 is sensitive to how the data from a class are distributed in the border regions and also on how much the convex hulls that delimit the classes overlap. In addition, L3 shares the disadvantages of L1 and L2.
2.4. Neighborhood Measures
The data complexity measures based on neighborhoods aim to capture the structure of the classes and/or the shape of the decision boundaries. Such measures use distances or dissimilarity functions between instances and, therefore, are bounded by .
2.4.1. Fraction of Borderline Points (N1)
A Minimum Spanning Tree is built and denoted as . Each vertex corresponds to an instance, and the edges are weighted according to the distance between them. N1 is obtained by calculating the percentage of instances in vertices involved in edges that connect instances of opposite classes in the generated tree, as:
The N1 measure is not deterministic, due to the fact that there can be multiple MSTs for the same dataset. However, its formulation is suitable for multiclass data and allows the use of different functions for computing the dissimilarities in hybrid and incomplete data.
2.4.2. Ratio of Intra/Extra Class Nearest Neighbor Distance (N2)
This measure calculates the ratio of two sums: (i) the sum of the distances between each example and its nearest neighbor of the same class (intra class); and (ii) the sum of the distances between each example and its nearest neighbor of another class (extra class)
where is the distance of to its nearest neighbor of the same class and is the distance of to its nearest enemy. N2 is computed as:
2.4.3. Error Rate of the Nearest Neighbor Classifier (N3)
This measure calculates the global error of the nearest neighbor classifier as:
The main issue with this measure is that it is biased towards the majority class and is unsuitable for imbalanced data.
2.4.4. Non-Linearity of the Nearest Neighbor Classifier (N4)
This measure is similar to L3 but uses NN instead of the linear classifier, as:
where is the number of interpolated instances.
The main problem with this instance is that it is unsuitable for hybrid and incomplete data (due to data interpolation).
2.4.5. Fractions of Hyperspheres Covering Data (T1)
The T1 measure aims to capture the topological structure of the data by recursively computing the hyperspheres needed to cover the data, without instances of different classes in the same hypersphere, as:
where is the number of hyperspheres needed to cover the data.
The T1 measure assumes data is numeric and complete and has a recursive procedure for computing the hyperspheres with high computational complexity.
2.4.6. Local Set Average Cardinality (LSC)
LSC is a measure of local characterization. It considers the number of instances of the same class surrounding an instance. Then, it considers the average surrounding.
This measure can complement N1 and L1 by also revealing the narrowness of the between-class margin [27]. It handles multiclass data, and its ability to handle hybrid and incomplete data will depend on the dissimilarity function used.
Table 1 summarizes the reviewed data complexity measures, considering their proportion, boundaries, computational complexity, and ability to deal with multiclass, hybrid, and incomplete data.

Table 1.
Description of the reviewed data complexity measures.
As shown, Feature-based measures do not handle multiclass nor hybrid and incomplete data, as well as Linearity measures. On the other hand, some Neighborhood measures are applicable for such scenarios if using appropriate dissimilarity functions, while others (N3, N4, and T1) do not.
It is important to mention that with the increase in the applicability of machine-learning techniques, the need for validating such techniques has also increased [29]. To such end, formal methods have been developed [30]. Data complexity measures are between two phases of the machine learning cycle: data understanding and data preparation (Figure 2). Depending on the complexity assessment, data preparation techniques can be used more wisely.
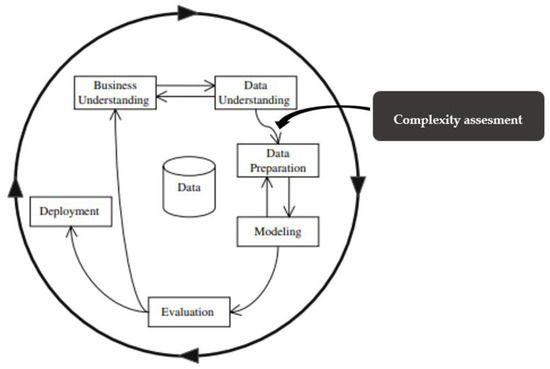
Figure 2.
Placement of data complexity assessment in the CRISP-DM-KD cycle as in [31].
Unfortunately, to the best of our knowledge, no formal method has been developed to deal with the task of assessing data complexity, and it remains a gap in the scientific research on the topic.
3. Proposed Approach and Results
Our hypothesis is that extending data complexity measures for the multiclass scenario, having hybrid and incomplete data, is possible (Figure 3).
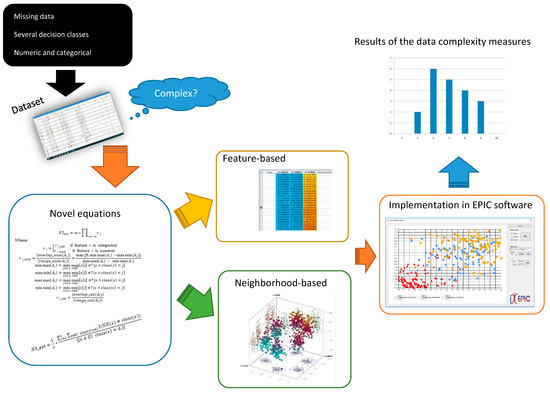
Figure 3.
Proposed approach for developing novel data complexity measures.
In the following, we describe the proposed extended measures. It is important to mention that all proposed measures are able to deal with multiclass, hybrid, and incomplete data.
3.1. Extended Feature-Based Measures
3.1.1. Extended Maximum Fisher’s Discriminant Ratio (F1_ext)
We wanted to maintain the idea behind F1 as a way of assessing the discriminant power of individual features. It is given by:
For numerical features, is the mean of feature and is the mean of feature considering only the instances in . Both means are computed, disregarding the instances with missing values (?).
Our definition of overlap for categorical feature values extends [28] by enumerating values appearing in different classes and disregarding missing values, and our definition of range considers all possible values of feature Ai. Using an efficient implementation, the computational complexity of our proposal is bounded by .
The proposed measure is able to deal with multiclass hybrid and incomplete data, presenting an advance for data complexity analysis. However, as its predecessor F1, for numerical data, our measure assumes that the linear boundary is unique and perpendicular to one of the feature axes. If a feature is separable but with more than one line, it does not capture such information (Figure 4).
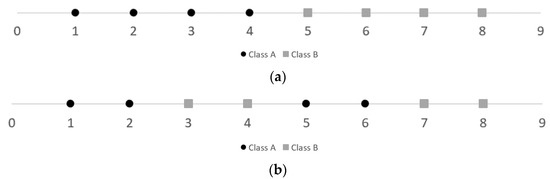
Figure 4.
Example of instances linearly separable (a) by one line and (b) by three lines. Note the values of F1_ext are 0.14 and 0.24, respectively.
3.1.2. Extended Volume of the Overlapping Region (F2_ext)
We extended the original F2 measure by using different overlapping ranges for numeric and categorical data. For numeric data, our formulation is close to the original but with extensions.
where:
Both minimum and maximum values are computed, disregarding the instances with missing values (?). Our formulation solves the problem of dealing with multiple classes, as well as with missing and hybrid data. Using an efficient implementation, the computational complexity of our proposal is bounded by .
As pointed out by Lorena [27], the F2 value can become very small depending on the number of operands in Equation (17); that is, it is highly dependent on the number of features a dataset has. Our extension does not avoid this situation. It has the same problems as F1_ext (Figure 5).
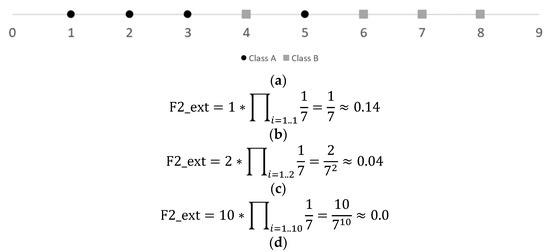
Figure 5.
Example of the curse of the dimensionality for F2 measure. (a) Dataset with two overlapping instances. Assume all attributes have the same values. (b) Results for one attribute. (c) Results for two attributes. (d) Results for ten attributes. Note the values of F2_ext values rapidly decrease as the number of attributes increase, even though are only two overlapping instances in all cases.
3.1.3. Extended Maximum Individual Feature Efficiency (F3_ext)
We inspire in the extension to the F3 measure in [28], but we maintain the idea of [27] to the measure providing lower values for simpler problems. Our proposal is as follows:
where is the number of overlapping instances according to , as:
where is the indicator function.
For this measure, our formulation solves the problem of dealing with multiple classes, as well as with missing and hybrid data. In addition, it solves the F3 drawback of not penalizing attributes having the same (or very similar) values for all instances (Figure 6).
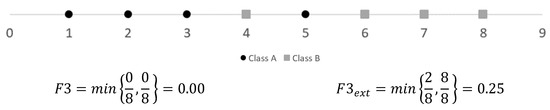
Figure 6.
The drawback of F3 is solved by F3_ext. We use a two-dimensional dataset, having zero for all instances in the attribute, with two overlapping instances. Note the values of F3 and F3_ext are 0.00 and 0.50, respectively.
Using an efficient implementation, the computational complexity of our proposal is bounded by .
3.2. Linearity Measures
Linearity measures are based on the idea of designing a hyperplane able to separate decision classes. Due to the fact that we are working with categorical data and with incomplete data, there is no direct way of using the notions of planes with such data. For future works, we will be working with other topological ideas resembling Linearity and able to deal with hybrid and incomplete data.
3.3. Neighborhood Measures
To extend Neighborhood measures, we propose using a dissimilarity function able to deal with mixed and incomplete data, such as HEOM [32]. We also propose using the normalized version (NHEOM) to guarantee the distance function to return values in [0, 1]. Let and be the maximum and minimum values of the numeric attribute . The NHEOM is as follows:
As shown in Equation (21), the NHEOM function operates by attribute, and for each attribute, it uses one of three cases: for missing values, it returns one. For complete categorical values, the overlap function considers values similar only if they are equal, and for numerical values, the rd_diss function compares them by considering their difference with respect to the maximum difference between values. The normalization procedure (dividing by the square root of the number of attributes) guarantees NHEOM to be in [0, 1].
We maintain the original formulation of N1, N2, and LSC measures, just by using a dissimilarity function able to deal with hybrid and incomplete data. Regarding the N3 measure, to avoid bias toward the majority class, we change the formulation by considering average by class error.
This formulation solves the bias by considering the errors for each decision class (Figure 7). It maintains the ability to handle multiclass, hybrid, and incomplete data.
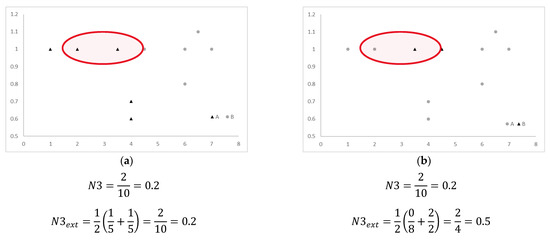
Figure 7.
Solving the N3 bias towards the majority class with the new formulation. (a) Balanced dataset with ten instances, two of them misclassified. (b) Imbalanced dataset with ten instances, two of them misclassified. Note how the proposed measure considers there is a full class misclassified in (b).
Due to the difficulties of interpolation in hybrid and incomplete data, we chose not to extend the N4 measure. Similarly, the T1 measure was not considered because of the impossibility of computing hyperspheres with categorical data.
4. Discussion
For discussion, we first analyze the behavior of the proposed measures over synthetic data (Section 4.1), and we compute the measures over publicly available datasets (Section 4.2). All experiments were executed in a Lenovo ThinkPad X1 laptop, with Windows 10 operating system, Intel(R) Core(TM) i7-8550U CPU at 1.80 GHz and 16 GB of RAM. The laptop was not exclusively dedicated to the experiments (all were executed on low priority).
4.1. Synthetic Data
We first supply three explanatory examples for the computation of the proposed measures. The first two of them use two-dimensional datasets, with no missing values (Figure 8 and Figure 9), to be able to visualize the data distribution, and the second example consists of a synthetic hybrid and incomplete dataset, adapted from the well-known play tennis dataset (Figure 10). The results of the data complexity measures over the example datasets are shown in Table 2.
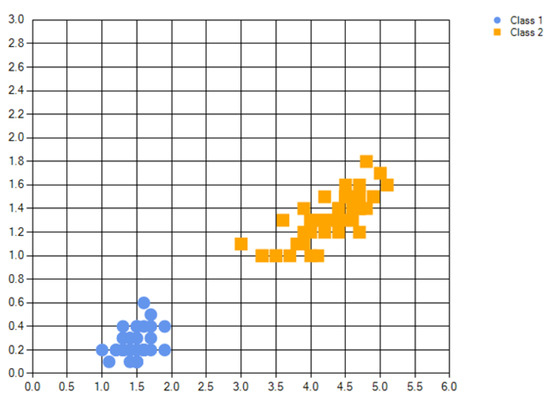
Figure 8.
Iris2D dataset. Note that classes are compact, balanced, and fully separated.
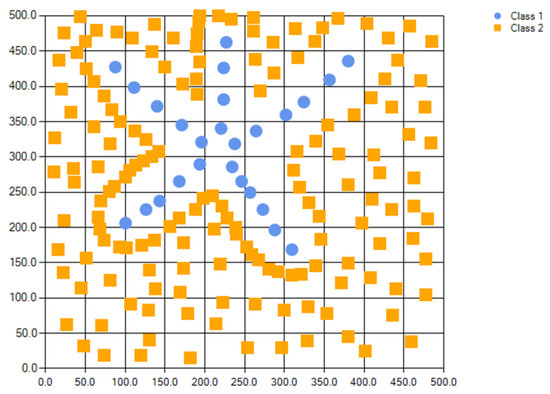
Figure 9.
Clover dataset. Classes are separated but imbalanced and with disjoints. The dataset resembles a clover flower.
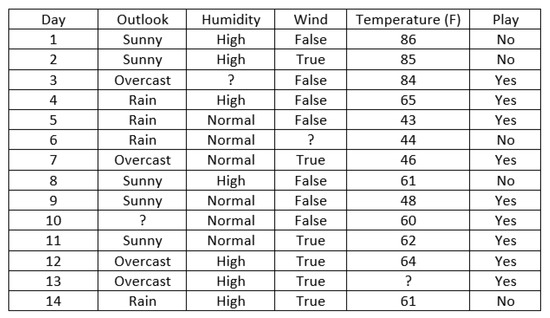
Figure 10.
Tennis dataset. This is a modified version of the well-known tennis dataset by Quinlan. Note that it has hybrid numeric and categorical data with missing values.
Table 2.
Results of the data complexity measures for synthetic datasets.
4.2. Real Data
In this section, we compute the measures over publicly available multiclass hybrid and incomplete datasets. We add the proposed measures to the EPIC software [25,26]. Table 3 summarizes the measures used in the experiments, clarifying their type, proportion, boundaries, computational complexity, and whether or not it is a newly proposed method.
Table 3.
Description of the proposed data complexity measures and each measure’s ability to deal with hybrid and incomplete data.
We selected 15 datasets publicly available in the KEEL repository [33]. All datasets correspond to real-life hybrid and incomplete problems (Table 4); all of them are partitioned using stratified five-fold cross-validation.
Table 4.
Description of the real datasets used.
We also provide the non-error rate (NER) results for the Nearest Neighbor classifier for each dataset. NER is computed as [34]:
where
The NER measure assumes a confusion matrix of classes (Figure 11), and it is robust for imbalanced data.
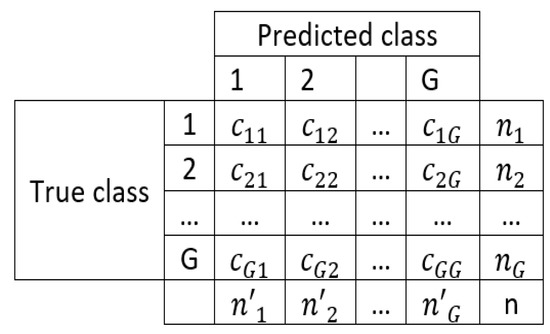
Figure 11.
Confusion matrix of c classes.
Table 5 presents the results of the data complexity measures’ computation for Feature-based and Neighborhood measures, and Table 6 shows the execution time (in milliseconds). The complex dataset according to each measure is highlighted in bold.
Table 5.
Results for Feature-based and Neighborhood and Dimensionality measures.
Table 6.
Execution time (in milliseconds) to compute the data complexity measures.
As shown, the hardest dataset is marketing. This complexity is shown in the low values of the non-error rate obtained in Table 4. F2_ext measure offers little information, being close to zero for 14 of the studied datasets. F3_ext measure points out that for most datasets, there is at least one attribute with low overlapping for 12 of the analyzed datasets.
The datasets with no clear separation are horse-colic, mammographic, and wisconsin. N1, N2, and N3_ext measures correlate well with the results of the Nearest Neighbor classifier (Table 4), while LSC shows near one value for all datasets.
The Feature-based measures are very fast, in contrast with the Neighborhood-based measures, which depend on the computation of the dissimilarity matrix between instances. For marketing and mushroom datasets, Neighborhood measures took up to two minutes. However, it is important to mention that we used a sequential implementation of the dissimilarity computation, and such time can be significantly diminished with parallel computation.
In addition, for practical purposes, when we want to assess the complexity of a given dataset, we can compute the measures in less than three minutes for the biggest ones. We think this timeframe is suitable for real-world data, and the proposed measures are computationally feasible, even with a sequential implementation.
The limitations of the proposed measures are as follows:
- The F1_ext measure, as its predecessor F1, for numerical data assumes that the linear boundary is unique and perpendicular to one of the feature axes. If a feature is separable but with more than one line, it does not capture such information.
- F2_ext measure can become very small depending on the number of operands in Equation (17); that is, it is highly dependent on the number of features a dataset has.
- Neighborhood measures are bounded by . For datasets with a huge number of instances, they can be computationally expensive.
5. Conclusions
Our hypothesis related to the fact that extending data complexity measures for the multiclass scenario, having hybrid and incomplete data is possible, has been verified. We have introduced four data complexity measures for multiclass classification problems. All of the proposed measures are able to deal with hybrid (numeric and categorical) and missing data. This will allow knowing the complexity of a complex dataset in advance before using it to train a classifier. We included the proposed measures in the EPIC software [25,26], and we computed the measures for some of the publicly available datasets with satisfactory results.
In experiments with real datasets, it has been found that the Feature-based measures are very fast, in contrast with the Neighborhood-based measures, which depend on the computation of the dissimilarity matrix between instances. Specifically, when performing the experiments on the marketing and mushroom datasets, Neighborhood measures took up to two minutes, while only fractions of a second were invested in the others.
In future work, we want to work with topological ideas resembling Linearity with the intent to design new Linearity-based measures to deal with hybrid and incomplete data. In addition, we want to solve the issue of the F2_ext measure being severely affected by the curse of dimensionality.
Also, in the case of Neighborhood-based measures, we will implement them using parallel computation. This is to reduce the computation time required to obtain the matrix between instances.
A very relevant future work consists of carrying out a deeper analysis of all the complexity measures available in the current state-of-the-art. Then we will apply formal mathematical methods to specify, build, and verify software and hardware systems focused on their application to machine learning solutions. To do this, we will rely heavily on research papers that clearly explain the phases of machine learning and the available formal methods to verify each phase [30].
Author Contributions
Conceptualization, F.J.C.-U. and Y.V.-R.; methodology, Y.V.-R.; software, Y.V.-R.; formal analysis, C.Y.-M. and M.L.; investigation, F.J.C.-U.; data curation, F.J.C.-U.; writing—original draft preparation, F.J.C.-U. and Y.V.-R.; writing—review and editing, C.Y.-M. and M.L. All authors have read and agreed to the published version of the manuscript.
Funding
This research received no external funding.
Institutional Review Board Statement
Not applicable.
Informed Consent Statement
Not applicable.
Data Availability Statement
All used real datasets are available at https://www.mdpi.com/ethics (accessed on 1 December 2022).
Acknowledgments
The authors would like to thank the Instituto Politécnico Nacional (Secretaría Académica, Comisión de Operación y Fomento de Actividades Académicas, Secretaría de Investigación y Posgrado, Centro de Investigación en Computación, and Centro de Innovación y Desarrollo Tecnológico en Cómputo), the Consejo Nacional de Ciencia y Tecnología, and Sistema Nacional de Investigadores for their economic support to developing this work.
Conflicts of Interest
The authors declare no conflict of interest.
References
- Shetty, S.H.; Shetty, S.; Singh, C.; Rao, A. Supervised Machine Learning: Algorithms and Applications. In Fundamentals and Methods of Machine and Deep Learning: Algorithms, Tools and Applications; Singh, P., Ed.; Wiley: Hoboken, NJ, USA, 2022; pp. 1–16. [Google Scholar]
- Satinet, C.; Fouss, F. A Supervised Machine Learning Classification Framework for Clothing Products’ Sustainability. Sustainability 2022, 14, 1334. [Google Scholar] [CrossRef]
- Eastvedt, D.; Naterer, G.; Duan, X. Detection of faults in subsea pipelines by flow monitoring with regression supervised machine learning. Process Saf. Environ. Prot. 2022, 161, 409–420. [Google Scholar] [CrossRef]
- Liu, X.; Lu, D.; Zhang, A.; Liu, Q.; Jiang, G. Data-Driven Machine Learning in Environmental Pollution: Gains and Problems. Environ. Sci. Technol. 2022, 56, 2124–2133. [Google Scholar] [CrossRef] [PubMed]
- Voulgari, I.; Stouraitis, E.; Camilleri, V.; Karpouzis, K. Artificial Intelligence and Machine Learning Education and Literacy: Teacher Training for Primary and Secondary Education Teachers. In Handbook of Research on Integrating ICTs in STEAM Education; IGI Global: Hershey, PA, USA, 2022; pp. 1–21. [Google Scholar]
- Aksoğan, M.; Atici, B. Machine Learning applications in education: A literature review. In Education & Science 2022; EFE Academy: Jaipur, India, 2022; p. 27. [Google Scholar]
- Rezapour, M.; Hansen, L. A machine learning analysis of COVID-19 mental health data. Sci. Rep. 2022, 12, 14965. [Google Scholar] [CrossRef]
- Aitzaouiat, C.E.; Latif, A.; Benslimane, A.; Chin, H.-H. Machine Learning Based Prediction and Modeling in Healthcare Secured Internet of Things. Mob. Netw. Appl. 2022, 27, 84–95. [Google Scholar] [CrossRef]
- Alanazi, A. Using machine learning for healthcare challenges and opportunities. Inform. Med. Unlocked 2022, 30, 100924. [Google Scholar] [CrossRef]
- Hu, Q.; Yu, D.; Xie, Z. Neighborhood classifiers. Expert Syst. Appl. 2008, 34, 866–876. [Google Scholar] [CrossRef]
- Kotsiantis, S.B. Decision trees: A recent overview. Artif. Intell. Rev. 2013, 39, 261–283. [Google Scholar] [CrossRef]
- Abiodun, O.I.; Jantan, A.; Omolara, A.E.; Dada, K.V.; Umar, A.M.; Linus, O.U.; Arshad, H.; Kazaure, A.A.; Gana, U.; Kiru, M.U. Comprehensive review of artificial neural network applications to pattern recognition. IEEE Access 2019, 7, 158820–158846. [Google Scholar] [CrossRef]
- Cervantes, J.; Garcia-Lamont, F.; Rodríguez-Mazahua, L.; Lopez, A. A comprehensive survey on support vector machine classification: Applications, challenges and trends. Neurocomputing 2020, 408, 189–215. [Google Scholar] [CrossRef]
- Yáñez-Márquez, C.; López-Yáñez, I.; Aldape-Pérez, M.; Camacho-Nieto, O.; Argüelles-Cruz, A.J.; Villuendas-Rey, Y. Theoretical foundations for the alpha-beta associative memories: 10 years of derived extensions, models, and applications. Neural Process. Lett. 2018, 48, 811–847. [Google Scholar] [CrossRef]
- Martínez-Trinidad, J.F.; Guzmán-Arenas, A. The logical combinatorial approach to pattern recognition, an overview through selected works. Pattern Recognit. 2001, 34, 741–751. [Google Scholar] [CrossRef]
- Wolpert, D.H. The supervised learning no-free-lunch theorems. In Soft Computing and Industry; Springer: London, UK, 2002; pp. 25–42. [Google Scholar]
- Luengo, J.; Herrera, F. An automatic extraction method of the domains of competence for learning classifiers using data complexity measures. Knowl. Inf. Syst. 2015, 42, 147–180. [Google Scholar] [CrossRef]
- Ma, Y.; Zhao, S.; Wang, W.; Li, Y.; King, I. Multimodality in meta-learning: A comprehensive survey. Knowl.-Based Syst. 2022, 250, 108976. [Google Scholar] [CrossRef]
- Huisman, M.; Van Rijn, J.N.; Plaat, A. A survey of deep meta-learning. Artif. Intell. Rev. 2021, 54, 4483–4541. [Google Scholar] [CrossRef]
- Camacho-Urriolagoitia, F.J.; Villuendas-Rey, Y.; López-Yáñez, I.; Camacho-Nieto, O.; Yáñez-Márquez, C. Correlation Assessment of the Performance of Associative Classifiers on Credit Datasets Based on Data Complexity Measures. Mathematics 2022, 10, 1460. [Google Scholar] [CrossRef]
- Cano, J.-R. Analysis of data complexity measures for classification. Expert Syst. Appl. 2013, 40, 4820–4831. [Google Scholar] [CrossRef]
- Barella, V.H.; Garcia, L.P.; de Souto, M.C.; Lorena, A.C.; de Carvalho, A.C. Assessing the data complexity of imbalanced datasets. Inf. Sci. 2021, 553, 83–109. [Google Scholar] [CrossRef]
- Ho, T.K.; Basu, M. Complexity measures of supervised classification problems. IEEE Trans. Pattern Anal. Mach. Intell. 2002, 24, 289–300. [Google Scholar]
- Bello, M.; Nápoles, G.; Vanhoof, K.; Bello, R. Data quality measures based on granular computing for multi-label classification. Inf. Sci. 2021, 560, 51–67. [Google Scholar] [CrossRef]
- Hernández-Castaño, J.A.; Villuendas-Rey, Y.; Camacho-Nieto, O.; Yáñez-Márquez, C. Experimental platform for intelligent computing (EPIC). Comput. Y Sist. 2018, 22, 245–253. [Google Scholar] [CrossRef]
- Hernández-Castaño, J.A.; Villuendas-Rey, Y.; Nieto, O.C.; Rey-Benguría, C.F. A New Experimentation Module for the EPIC Software. Res. Comput. Sci. 2018, 147, 243–252. [Google Scholar] [CrossRef]
- Lorena, A.C.; Garcia, L.P.; Lehmann, J.; Souto, M.C.; Ho, T.K. How Complex is your classification problem? A survey on measuring classification complexity. ACM Comput. Surv. (CSUR) 2019, 52, 1–34. [Google Scholar] [CrossRef]
- Cummins, L. Combining and Choosing Case Base Maintenance Algorithms; University College Cork: Cork, Ireland, 2013. [Google Scholar]
- Seshia, S.A.; Sadigh, D.; Sastry, S.S. Toward verified artificial intelligence. Commun. ACM 2022, 65, 46–55. [Google Scholar] [CrossRef]
- Krichen, M.; Mihoub, A.; Alzahrani, M.Y.; Adoni, W.Y.H.; Nahhal, T. Are Formal Methods Applicable To Machine Learning And Artificial Intelligence? In Proceedings of the 2022 2nd International Conference of Smart Systems and Emerging Technologies (SMARTTECH), Riyadh, Saudi Arabia, 9–11 May 2022; pp. 48–53. [Google Scholar]
- Cios, K.J.; Swiniarski, R.W.; Pedrycz, W.; Kurgan, L.A. The knowledge discovery process. In Data Mining; Springer: Boston, MA, USA, 2007; pp. 9–24. [Google Scholar]
- Wilson, D.R.; Martinez, T.R. Improved heterogeneous distance functions. JAIR 1997, 6, 1–34. [Google Scholar] [CrossRef]
- Alcalá-Fdez, J.; Fernández, A.; Luengo, J.; Derrac, J.; García, S.; Sánchez, L.; Herrera, F. KEEL Data-Mining Software Tool: Data Set Repository, Integration of Algorithms and Experimental Analysis Framework. J. Mult.-Valued Log. Soft Comput. 2011, 17, 255–287. [Google Scholar]
- Ballabio, D.; Grisoni, F.; Todeschini, R. Multivariate comparison of classification performance measures. Chemom. Intell. Lab. Syst. 2018, 174, 33–44. [Google Scholar] [CrossRef]


Disclaimer/Publisher’s Note: The statements, opinions and data contained in all publications are solely those of the individual author(s) and contributor(s) and not of MDPI and/or the editor(s). MDPI and/or the editor(s) disclaim responsibility for any injury to people or property resulting from any ideas, methods, instructions or products referred to in the content. |
© 2023 by the authors. Licensee MDPI, Basel, Switzerland. This article is an open access article distributed under the terms and conditions of the Creative Commons Attribution (CC BY) license (https://creativecommons.org/licenses/by/4.0/).