1. Introduction
Over the past couple of decades, global temperatures have risen as a now-acknowledged consequence of the accumulated impact of human activities such as burning fossil fuels. The excessive release of CO
2 into the atmosphere decreases the amount of infrared radiation energy leaving the planet. Therefore, the greenhouse effect—essential to ensure a habitable planet—is accelerating, resulting in a continual increase in global surface and ocean temperatures. Global warming will lead to dramatic changes in the climate, including more frequent and chaotic weather events such as intense heatwaves, droughts, and floods [
1,
2,
3].
Global warming is now linked to severe weather conditions affecting the lives of millions. Recent examples are flooding in Germany, Belgium, and China; wildfires in Greece, Turkey, Australia, and Italy; heatwaves in the US, Pacific Northwest, and Canada; and the massive ice melt in the Arctic, equivalent to the size of Florida, between June and mid-July 2021. Global warming affects all countries, including the UK. Erosion caused by waves in Happisburgh as well as the scorching of Saddleworth Moor and Ramslye Wood in the UK caused by heatwaves and floods and storms in York, Dawlish Warren in Devon, Somerset, and Leeds are a few of the recent examples of the local disasters linked to climate change in the UK [
4].
The Paris Agreement has focussed urgent attention on limiting the global temperature increase to 1.5 °C through the formulation of its Article 2.1a, which states the aim of “Holding the increase in global average temperature to well below 2 °C above pre-industrial levels and pursuing efforts to limit the temperature increase to 1.5 °C above pre-industrial levels.” [
5]. The lower temperature goal means that CO
2 must be rapidly reduced to zero in the next 20 years and beyond zero after that [
6]. Although an average temperature rise of 1.1 °C has resulted in the most recent climate catastrophes, according to the latest IPCC Climate Report there is more than a 50% chance that the 1.5 °C target will be reached or crossed in the early 2030s [
7].
Although carbon emissions from fuel combustion have decreased in the UK, a few energy-intensive foundation industries such as cement, metal, and paper still produce considerable CO
2 [
8]. Carbon capture and storage (CCS) could provide a key contribution to tackling the emissions from these sectors. The UK has one of the most suitable environments for commercial CCS, ranking fourth in the CCS Readiness Index (RI) (after the US, Canada, and Norway). Apart from the UK, most nations with a top RI rank already have large-scale storage projects in operation. Moreover, the UK dropped in ranking between 2015 and 2016 (from first to fourth) following the UK Government‘s cancellation of its CCS Commercialization Programme [
9]. However, there has recently been a volte-face, with the UK planning to become a “world leader” in the field of CCS, aiming to remove 10 MT of CO
2 by 2030. According to the Ten Point Plan, UK Prime Minister Boris Johnson announced on 18 November 2020 a GBP 12 bn investment to push the UK towards net-zero emissions. CCS is one of the critical objectives of the Ten Point Plan (Point #8), for which the UK Government has allocated GBP 1 bn, supporting 50,000 jobs by 2030 [
10].
The ideal and safe long-term storage sites for captured CO
2 are primarily geological formations such as saline aquifers or where the gas is used as an enhanced oil recovery (EOR) agent in hydrocarbon reservoirs [
11]. Of these two options, CO
2 storage in saline aquifers appears far more beneficial for the environment, given that the enhanced production of hydrocarbons in the EOR process maintains the use of fossil fuels, thereby contributing to global warming. Currently, there are only three operational CO
2 storage projects on a commercial scale; namely, Sleipner and SnØhvit in Norway, and Quest in Canada. Based on the UK Storage Appraisal Project (UKSAP) estimation, the UK has a total theoretical storage capacity of 78 GT with a 50% confidence (P50) [
12]. According to the CO2Stored database, over 68.6 Gt of potential theoretical storage is located within saline aquifer systems in the UK and its waters, representing over 85% of the total inventory [
13]. Five storage sites (Bunter Closure 36, Hamilton, Forties 5 Site 1, Captain Site X, and Viking A) have been studied in detail. They have been proven to store CO
2 securely at commercially significant volumes [
13].
One of the main tasks in storing carbon dioxide in geological formations is continuously monitoring its dynamic condition and plume migration [
14,
15,
16]. However, knowledge of the fluid and formation properties is usually incomplete due to inaccurate rock and fluid datasets as well as the complexity and heterogeneity of the storage site. One of the primary sources of uncertainty reported in the literature is an inaccurate containment of rock and fluid spatial properties in the aquifer, resulting from a lack of direct measurements of the properties and noise in the well logs and geophysical data [
17].
Moreover, Bunter Closure 36 (BC36) is subjected to significant uncertainty in a similar fashion to most aquifers, which are sparsely drilled with minimal dynamic data. Therefore, a new 3D survey and appraisal wells are essential to reduce this uncertainty in the model data by collecting reservoir, caprock, and fluid samples to support detailed development planning. In this current study, we attempted to provide a better understanding of the fluid flow in the Bunter Closure 36 aquifer. Despite the site’s promising potential, there are few studies on the CO2 storage process in Bunter Closure 36. This is the first study on the impact of the model and fluid uncertainties on CO2 storage in Bunter.
2. Methods and Materials
In the current study, we aimed to quantify the importance of uncertain input parameters on the overall plume migration and trapping in the Bunter Closure 36 model. We employed the Dice coefficient (SDC) method to quantify the similarity of the plume shape resulting from a base case and simulation models [
18,
19]. The Dice coefficient, which has been widely used in previous CO
2 storage studies [
20,
21,
22], is a statistic used to calculate the similarity of two samples.
where
X and
Y represent the plume outline from the simulation and base case at the same time, respectively. A Dice coefficient equivalent to 1 corresponds with identical samples.
A reliable data-driven model that shows the linear/non-linear trend in data is needed to find the relationship between the target values (output) and uncertain variables (inputs). A data-driven model helps to quantify the importance of each uncertain variable (inputs) based on their contribution to the predicted target values (outputs). In our model, the inputs were pressure, caprock elevation, temperature, porosity, and permeability. The outputs were the SDC values in 2032, 2037, 2047, 2057, and 2067 (5, 10, 20, 30, and 40 years after the start of the injection).
In order to test the model, 25% of the dataset was selected. A baseline linear regression (LR) model was fitted and the predicted target values were compared with the observed data. The LR model led to a poor R-squared value of 0.42. We employed the same training and test dataset as in the LR model and used the models below to improve the baseline model prediction: K-nearest neighbours (KNN), a neighbours-based regression model based on the proximity to make classifications or predictions about the grouping of an individual data point [
1]; decision trees (DTree), a tree-based model that sets up decision rules inferred from observed data [
23]; and random forests (RF), an ensemble method used for classification and regression problems by linking the predictions of several decision trees [
24].
Table 1 illustrates the performance of the different data-driven models employed in this study.
As shown in
Table 1, RF and DTree outperformed the LR and KNN models. Therefore, RF and DTree were employed to determine the underlying relationship between the input and output parameters. Finding the relevant data-driven model is always challenging; therefore, these methods were chosen to evaluate the variable importance due to their promising performance in similar studies [
20,
25].
Simple models are based on simple rules and are easily interpretable in variable importance problems. However, complex statistical models such as the one in this study are difficult to explain. Therefore, using an interpretable approximation of the original statistical model is expected. To provide a more straightforward interpretation of the variable importance, we employed a unified structure to interpret the predictions called the SHAP (Shapley Additive Explanations) method [
26]. SHAP is a game-theoretic approach that aims to explain the prediction of an instance by calculating the contribution of each uncertain parameter in the prediction. Although solving SHAP values is computationally expensive, they can be approximated by combining different additive feature attribution methods. Please refer to [
26] for more information regarding SHAP.
Previous studies on saline aquifers such as Sleipner and Snohvit employed the one-factor-at-a-time (OFAT) approach [
21]. Using OFAT, it is possible to investigate the reservoir model’s response to one parameter whilst keeping the rest at their initial values. In the current study, we aimed to fully span the uncertainty space by using the cross-correlation of five parameters to show their impact on the overall CO
2 migration and trapping process. Several sources of uncertainty were considered, including the reservoir pressure, porosity, permeability, reservoir temperature, and caprock morphology. Data-driven models were used to comprehensively analyse the impact of the uncertainties in the model and the fluid on the injected CO
2 plume migration and trapping. We generated twenty thousand samples for five uncertain parameters within the reported range for the Bunter Closure 36 model and ran forward simulations for each input set. The vertical equilibrium model implemented in MRST-co2lab [
27,
28] was used to maintain a feasible computational cost. A forward simulation performed on the Bunter Closure 36 took around 8 and 14 h using the ECLIPSE Blackoil and ECLIPSE Compositional simulators, respectively; using MRST-co2lab reduced the simulation to less than 2 min. MRST-co2lab has een shown to have promising performance compared with commercial simulators [
29,
30]. Please refer to [
30] for further information regarding vertical equilibrium modelling.
As this study was computationally expensive, a cluster system was employed to run 50 parallel simulations simultaneously. The RF and DTree [
23,
24] models available in Python (Scikit-learn library) were used to quantify the importance of the uncertain parameters in the CO
2 plume outline. The input was a matrix of twenty thousand by five (temperature, pressure, porosity, permeability, and caprock elevation) and the output was a matrix of twenty thousand by five (the SDC for five time steps).
2.1. Geological Model
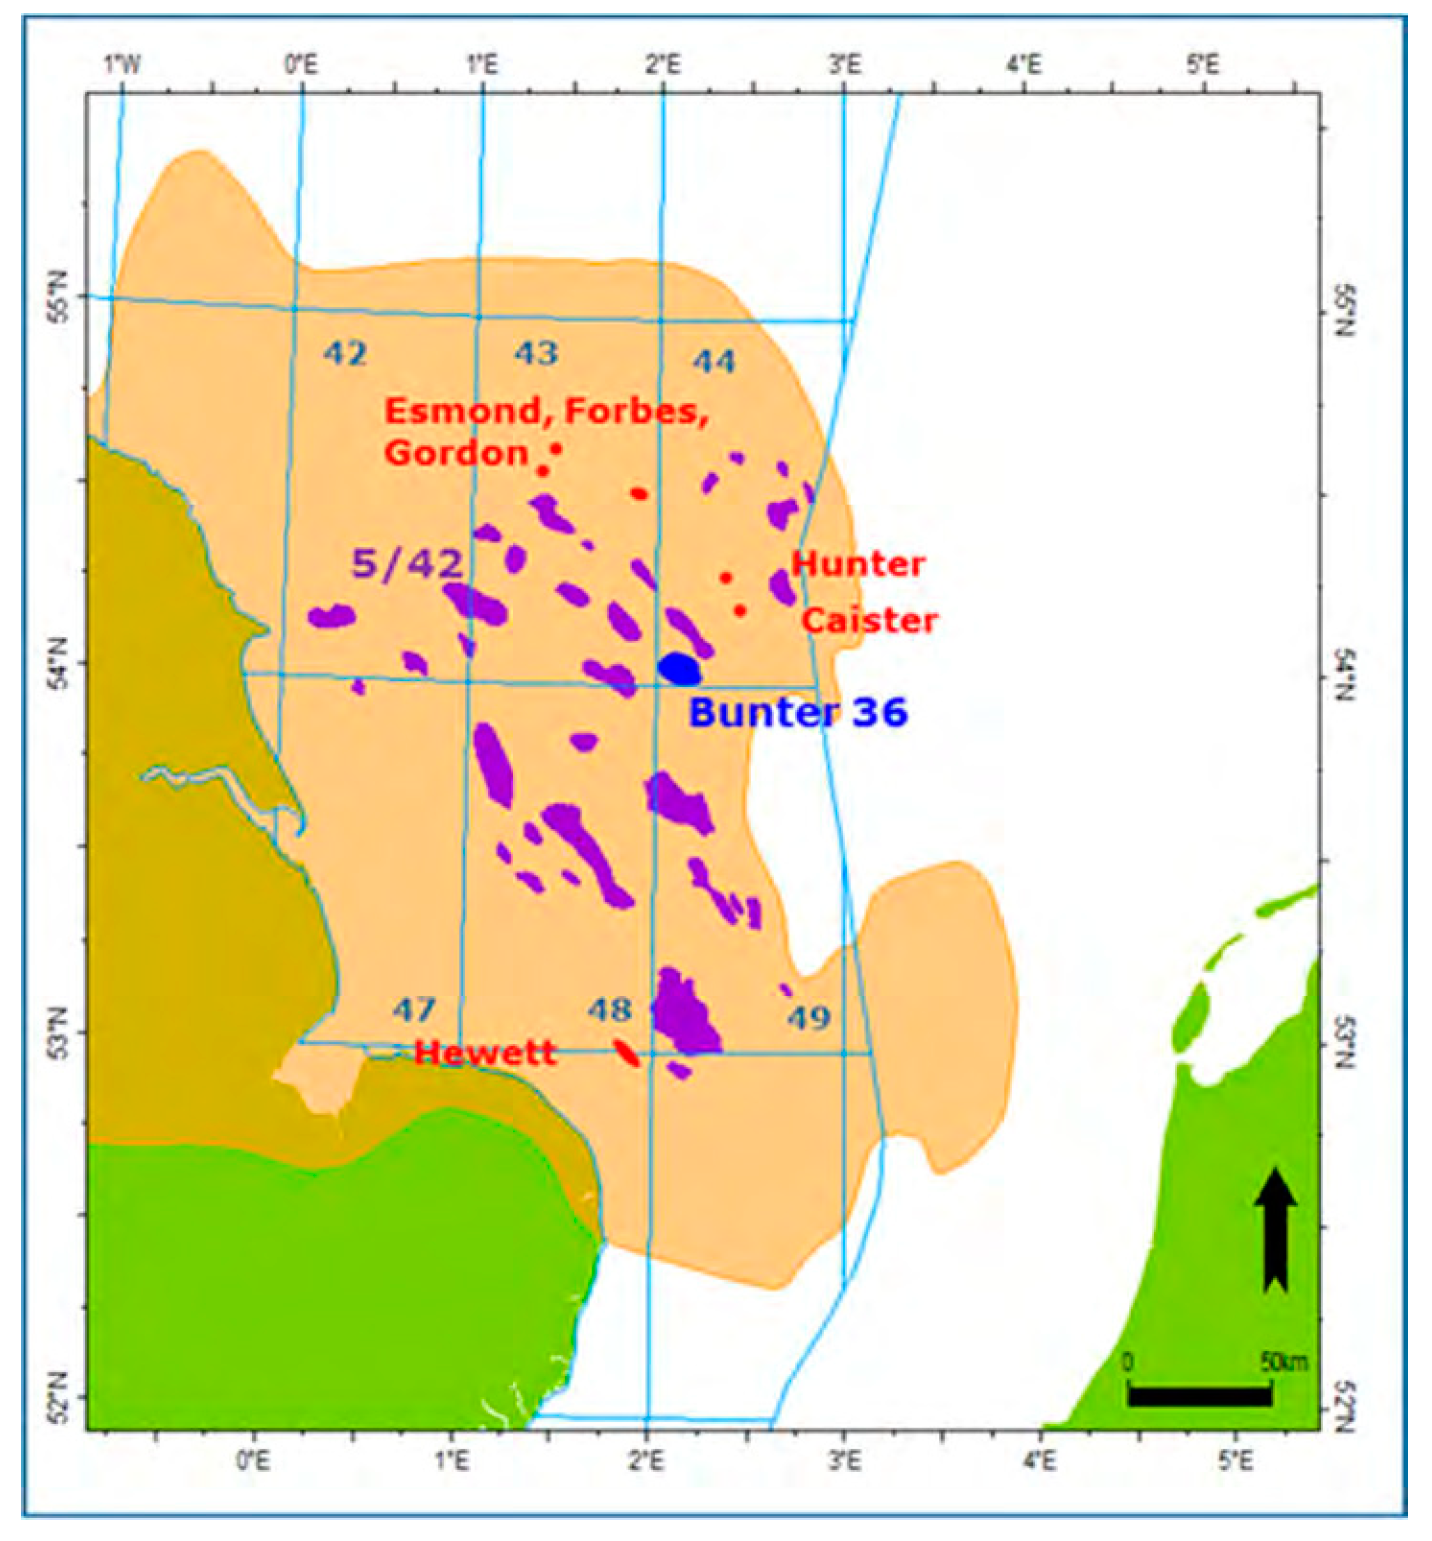
The Bunter Closure 36 site (BC36), a saline aquifer in the Southern North Sea Basin, is a potential site for commercial CO
2 storage in the UK. Located 150 km off the Yorkshire coast (
Figure 1), BC36 is close to the Thames and Humber estuaries, two important CO
2-generating clusters in the UK.
The Bunter Sandstone is situated between 1200 m and 1800 m below sea level, with an average thickness of around 210 m. The Bunter model has suitable 3D seismic coverage and the well database results are from the six wells that have been drilled in the model since 1968. The aquifer has an average porosity and permeability of 22% and 210 mD, respectively, resulting in a smooth fluid flow in the model. Dissolution trapping was considered in the current work. The parameters used in this study were taken from the Bunter Storage Development Plan [
31] and are listed in
Table 2.
There are multiple caprocks above the Bunter Sandstone that would permanently seal the injected CO
2. The sealing system would be a combination of laterally continuous mudstone from the Haisborough Group, with an average thickness of 300 m and a 60 m-thick Rot Halite formation. Thick mudstone layers at the bottom of the storage site would provide an effective impermeable floor.
Figure 2 illustrates a schematic of the Bunter Closure 36 storage site.
According to the Energy Technology Institute [
31], the development plan in BC36 will begin in 2024, leading to the first injection in 2027. The model is expected to store a CO
2 supply of 7 MT/year from the Humberside area over an operational life of 40 years, equivalent to a coal fire power plant of 1.2 GW. The site’s development plan and geological and fluid models are publicly available, and were employed in the current study [
31].
Similar to the original plan, in the current study, CO
2 was injected into the model continuously through the four wells that deviate from the platform into the northwest flank of the dome. The coordinates of the injection wells are listed in
Table 3. The employed coordinate system was UTM, ED50 Common Offshore, Zone 31N (0° East to 6° East). The injected CO
2 was in a liquid phase throughout the injection and storage phases.
2.2. Model Uncertainty
2.2.1. Pressure and Temperature
Subsurface analyses of the local and regional Bunter Sandstone hydrology and aquifer strength are essential due to their impact on the long-term dynamic performance of the site. Moreover, a comprehensive analysis of the production and pressure information from nearby Triassic gas fields would help us better understand the hydraulic connection between these structures and the Bunter Sandstone aquifer. In this study, the reservoir pressure was considered to be hydrostatic, leading to a pressure of about 120 bar on top of the model (depth of around 1200 m). The uncertainty in pressure was applied with the term DP. Twenty thousand random values of DP between −10 and 10 bars were considered to modify the model pressure.
Temperature variations can significantly change density and viscosity, consequently affecting the occupied volume and mobility. A recent study [
32] compared different modelling options, including isothermal, full thermal and thermal gradient, to assess temperature effects in the BC36 model. The temperature was shown to considerably affect the overall plume migration. Moreover, the seabed water temperature at the Bunter Closure 36 location (Block 44) fluctuates from 6 °C to 16 °C over a year [
31]. The aquifer temperature in the current study was modified using the term DT to implement its uncertainty. Twenty thousand random values of DT within the range of ± 6 °C were considered to modify the temperature.
2.2.2. Porosity, Permeability, and Caprock Morphology
Heterogeneities can significantly change the fate of injected CO
2 in saline aquifers [
33]. Pore spaces are not uniformly distributed, resulting in a heterogeneity in porosity, permeability, and capillary pressure. Therefore, it is essential to precisely incorporate the heterogeneities into simulation models. However, occasionally in CO
2 storage studies, the models are simplified and averaged values are considered for the rock properties. Traditionally, geophysical methods have been employed for the static modelling of pre-injection aquifer conditions, often proving inaccurate due to uncertainty in the data. A recent study [
2] investigated the impact of heterogeneities on CO
2 plume migration and trapping in the Bunter model. The results showed that sedimentological heterogeneities controlled the flow direction and migration rate of the injected CO
2. As the model heterogeneities were usually poorly constructed using the well and production history data, the authors suggested the inclusion of these heterogeneities in more detail for the future modelling of CO
2 migration in the Bunter model [
2].
The reported ranges for porosity and permeability in the Bunter model are around 18% to 24% and 62 mD to 271 mD, respectively. The current study generated twenty thousand porosity realisations within the range reported in the Bunter Storage Development Plan [
31]. The permeability realisations were generated from porosity data using Equation (2), available in the Bunter Storage Development Plan [
31]:
where
and
denote permeability (mD) and porosity, respectively. Equation (2) was derived for the Bunter model using onsite core data. It is a simple and effective method to generate permeability data for the model.
The seismic vertical resolution is typically around 10 m. Therefore, the topographical variations below this limit (i.e., rugosity) were not observed in the geological modelling process. To analyse the impact of the topography variations on the CO2 storage and trapping process, twenty thousand realisations of the top surface elevation within a range of ± 8 were considered in this study.
2.3. Simulation Approach
The numerical simulations in this study were performed using the co2lab module in MRST. This module is formulated based on vertical equilibrium assumptions; i.e., brine and CO
2 are in a hydrostatic equilibrium throughout the simulation and the vertical fluid migration compared with the lateral migration is negligible. Due to the significantly different fluid densities in the BC36 model, CO
2 and brine were expected to form separate layers after an instant segregation. The vertical equilibrium method has been shown to have a promising performance in CO
2 storage problems [
34,
35,
36,
37]. VE modelling can reduce the problem dimension to two, leading to a significantly lower computational cost. Therefore, a modeller could consider a higher lateral grid resolution beyond the practical limits in full 3D simulations.
The CO
2 was injected at a constant annual rate of 7 Mt for 40 years, starting from 2027.
Figure 3 illustrates the top and view of the saturation profile after 1, 20, and 40 years of injections for the original model.
3. Results and Discussion
Figure 4 and
Figure 5 illustrate the variable importance plots for the DTree and RF models approximated by SHAP. Multiple starting points were considered when estimating the SHAP values to ensure the reliability and reproductivity of the data. The results from the RF and DTree models were similar, with temperature and permeability being the most and least essential variables in controlling the plume outline, respectively. Pressure, porosity, and elevation had a similar variable importance value of around 10% to 20%.
Figure 4 and
Figure 5 also show the percentage of the variable importance for the variables at each time step (see the number in the boxes). A parameter with a higher percentage should have had more control over the match between the simulated and observed plume outlines. For example, in 2032, the model prediction was mainly affected by the uncertainty in pressure.
Similar to this study, temperature was shown to have a critical role in controlling plume migration in the Sleipner model [
20,
21,
25]. Temperature and pressure would have an impact on density and viscosity. According to Coolprops data [
38], the model at its initial condition (i.e., T = 45 °C and P = 119 bar) would have an average density of 653 kg/m
3. Density has a crucial impact on the overall CO
2 migration in a saline aquifer. Changing the temperature within a range of −6 to 6 whilst keeping the pressure constant resulted in densities of 727 kg/m
3 and 562 kg/m
3, respectively. The corresponding density for cases with DP of −10 and 10 bar under isothermal conditions rose to 596 kg/m
3 and 690 kg/m
3, respectively. Therefore, the density was more sensitive to the temperature in the Bunter model than the pressure within the uncertainty ranges used in the current study.
The impact of the caprock elevation on the plume migration in Bunter seemed to be less significant than in Sleipner [
20,
21,
25]. The reason could be that Sleipner has a small-scale caprock morphology. Therefore, small topography changes would alter the migration path. However, in the Bunter model, the plume migration path is mainly controlled by a dome-shaped topography with large amplitudes. Therefore, changing the elevation within a small range would not have as much impact as the Sleipner model. Uncertainties in porosity had a minimum impact on the plume dynamics. Whilst the level of perturbations and reservoir characteristics might have affected the outcome, similar results were observed in the Sleipner model [
20,
21,
25].
The static capacity in terms of CO
2 mass could be estimated from the following equation [
21]:
where
is the CO
2 plume density at the aquifer condition (kg/m
3),
V is the trap volume (m
3),
is the porosity, and
Srw is the residual water saturation.
A higher CO2 density would lead to an increase in the structural traps. As mentioned before, in the Bunter aquifer condition, the CO2 density would increase by a drop in temperature and a rise in pressure. This condition would consequently lead to a higher static capacity. Moreover, a larger (and positive) elevation in the aquifer caprock and higher porosity would also increase the structural trapping.
4. Conclusions
This work analysed the joint effect of uncertain parameters on the CO2 plume migration in the Bunter Closure 36 model. In this regard, twenty thousand simulations were performed to investigate the importance of the model temperature and pressure as well as the porosity and permeability heterogeneities and caprock elevation. To minimise the computational costs, the simulations were performed using VE models. The joint effect of the parameters was analysed using data-driven models.
Bunter Closure 36 is one of the primary candidates for CO2 storage in the UK. This is the first study on the impact of the model and fluid uncertainties on the CO2 storage process in the model. This work raises our understanding of the Bunter model’s storage process well before initiating the injection phase. The temperature was shown to have the most impact on the plume dynamic (overall importance of 41%), followed by the pressure (21%), permeability (17%), elevation (13%), and porosity (8%). It is crucial for storage safety to improve our understanding of the migration process and develop confidence in long-term carbon storage performance. The results showed that a slight error in the temperature data of the model could lead to a significant error in evaluating the CO2 plume migration path. The results also indicated the complexity of one parameter’s impact on another, making it inaccurate to generalise the impact of a variable on the plume migration.
A similar study could be conducted on any geological model such as CO2 storage or petroleum or gas reservoirs to find the importance of the uncertain parameters on the overall simulation process before performing any history matching. This way, we could efficiently minimise the mismatch between the results from our simulation and observed data by improving the accuracy of the geological, operational, and fluid information.


