
An Exploratory Analysis of Sustainability Indicators in Turkish Small- and Medium-Sized Industrial Enterprises

Abstract
:1. Introduction
2. Literature Review
3. Theoretical Background
4. Research Methodology
4.1. Measures and Data Collection
4.2. Descriptive Statistics
4.3. Analyses
4.3.1. Exploratory Factor Analysis
4.3.2. Best–Worst Method
5. Results
5.1. Exploratory Factor Analysis
5.2. Best–Worst Method
6. Discussion
7. Conclusions
7.1. Theoretical Contributions
7.2. Managerial Contributions
7.3. Limitations
Author Contributions
Funding
Institutional Review Board Statement
Informed Consent Statement
Data Availability Statement
Conflicts of Interest
Appendix A

| Category | Aspect | No. of Indicators |
|---|---|---|
| Economic | Economic performance Market presence Indirect economics impacts Procurement practices | 4 2 2 1 |
| Environmental | Materials Energy Water Biodiversity Emissions Effluents and waste Products and services Compliance Transport Overall Supplier environmental assessment Environmental grievance mechanisms | 2 5 3 4 7 5 2 1 1 1 2 1 |
| Social Sub-category: Labor practices and decent work Sub-category: Human rights Sub-category: Society Sub-category: Product responsibility | Employment Labor and management relations Training and education Diversity and equal opportunity Equal remuneration for men and women Supplier assessment for labor practices Labor practices grievance mechanisms Investment Non-discrimination Child labor Forced or compulsory labor Security practices Indigenous rights Assessment Supplier human rights assessment Human rights grievance mechanisms Local communities Anti-corruption Public policy Anti-competitive behavior Compliance Supplier assessment for impacts on society Grievance mechanisms for impacts on society Customer health safety Product and service labeling Marketing communications Customer privacy Compliance Total number of indicators | 3 5 3 1 1 2 1 2 2 1 1 1 1 1 2 1 2 3 1 1 1 2 1 2 3 2 1 1 91 |
Appendix B
- Economic Sustainability
- G4/EC1: Direct economic value generated and distributed by the organization
- G4/EC2: Financial implications and other risks and opportunities for the organization’s activities due to climate change
- G4/EC3: Organization’s defined benefit plan obligations
- G4/EC4: Financial assistance received from government
- G4/EC5: Ratios of standard entry-level wage by gender compared to local minimum wage at significant locations of operation
- G4/EC6: Proportion of senior management hired from the local community at significant locations of operation
- G4/EC7: Development and impact of infrastructure investments and services supported
- G4/EC8: Significant indirect economic impacts generated by the organization
- G4/EC9: Proportion of spending on local suppliers at significant locations of operation
- Environmental Sustainability
- 10.
- G4/EN2 (RE1) *: Percentage of materials used that are recycled input materials.
- 11.
- G4/EN6 (ES1): Reduction in energy consumption.
- 12.
- G4/EN7 (ES2): Reductions in energy requirements of products and services.
- 13.
- G4/EN10 (RE2): Percentage and total volume of water recycled and reused.
- 14.
- G4/EN12 (EP1): Description of significant impacts of activities, products, and services on biodiversity in protected areas and areas of a high biodiversity value outside protected areas.
- 15.
- G4/EN19 (EP2): Reduction in greenhouse gas (GHG) emissions.
- 16.
- G4/EN27 (GR1): Extent of impact mitigation of environmental impacts of products and services.
- 17.
- G4/EN28 (RE3): Percentage of products sold and their packaging materials that are reclaimed by category.
- 18.
- G4/EN29 (GR2): Monetary value of significant fines and total number of non-monetary sanctions for non-compliance with environmental laws and regulations.
- 19.
- G4/EN30 (GR3): Significant environmental impacts of transporting products and other goods and materials for the organization’s operations, and transporting members of the workforce.
- 20.
- G4/EN31 (GR4): Total environmental protection expenditures and investments by type.
- 21.
- G4/EN32 (GR5): Percentage of new suppliers that were screened using environmental criteria.
- 22.
- G4/EN33 (GR6): Significant actual and potential negative environmental impacts in the supply chain and actions taken.
- Social Sustainability
- 23.
- G4/LA1 (ER1): Total number and rates of new employee hires and employee turnover by age group, gender, and region.
- 24.
- G4/LA2 (ER2): Benefits provided to full-time employees that are not provided to temporary or part-time employees, by significant locations of operation.
- 25.
- G4/LA3 (ER3): Return to work and retention rates after parental leave, by gender.
- 26.
- G4/LA4 (ER4): Minimum notice periods regarding operational changes, including whether these are specified in collective agreements.
- 27.
- G4/LA6 (ER5): Type of injury and rates of injury, occupational diseases, lost days absenteeism, and total number of work-related fatalities, by region and by gender.
- 28.
- G4/LA10 (ER6): Programs for skills management and lifelong learning that support the continued employability of employees and assist them in managing career endings.
- 29.
- G4/LA12 (EE1): Composition of governance bodies and breakdown of employees per employee category according to gender, age group, minority group members and other indicators of diversity.
- 30.
- G4/LA13 (EE2): Ratio of basic salary and remuneration of women to men by employee category, by significant locations of operations.
- 31.
- G4/LA14 (ER7): The percentage of new suppliers that were screened using labor practices data.
- 32.
- G4/HR2: Total hours of employee training on human rights policies or procedures concerning aspects of human rights that are relevant to operations, including the percentage of employees trained.
- 33.
- G4/HR3: Total number of incidents of discrimination and corrective actions taken.
- 34.
- G4/HR4: Freedom of association and collective bargaining.
- 35.
- G4/HR5: Operations and suppliers identified as having significant risk for incidents of child labor, and measures taken to contribute to the effective abolition of child labor.
- 36.
- G4/HR6: Operations and suppliers identified as having significant risk of incidents of forced or compulsory labor, and measures to contribute to the elimination of all forms of forced or compulsory labor.
- 37.
- G4/HR7: Percentage of security personnel trained in the organization’s human rights policies or procedures that are relevant to operations.
- 38.
- G4/HR10: Percentage of new suppliers that were screened using human rights criteria.
- 39.
- G4/SO1: Percentage of operations with implemented local community engagement, impact assessments, and development programs.
- 40.
- G4/SO4 (SC1): Communication and training on anti-corruption policies and procedures.
- 41.
- G4/SO7 (SC2): Total number of legal actions for anti-competitive behavior, anti-trust, and monopoly practices and their outcomes.
- 42.
- G4/SO9: Percentage of new suppliers that were screened using criteria for impacts on society.
- 43.
- G4/PR1 (CR1): Percentage of significant product and service categories for which health and safety impacts are assessed for improvement.
- 44.
- G4/PR2: Total number of incidents of non-compliance with regulations and voluntary codes concerning product and service information and labeling by type of outcomes.
- 45.
- G4/PR5: Results of surveys measuring customer satisfaction.
- 46.
- G4/PR6: Sale of banned or disputed products.
- 47.
- G4/PR7: Total number of incidents of non-compliance with regulations and voluntary codes concerning marketing communications, including advertising, promotion, and sponsorship, by type of outcomes
- 48.
- G4/PR8 (CR2): Total number of substantiated complaints regarding breaches of customer privacy and losses of customer data.
- 49.
- G4/PR9: Monetary value of significant fines for non-compliance with laws and regulations concerning the provision and use of products and services.
- * Some codes in the text have been replaced with codes in parentheses.
References
- Galal, N.M.; Abdul Moneim, A.F. A mathematical programming approach to the optimal sustainable product mix for the process industry. Sustainability 2015, 7, 13085–13103. [Google Scholar] [CrossRef] [Green Version]
- Zeng, S.X.; Meng, X.H.; Zeng, R.C.; Tam, C.M.; Tam, V.W.; Jin, T. How environmental management driving forces affect environmental and economic performance of SMEs: A study in the Northern China district. J. Clean. Prod. 2011, 19, 1426–1437. [Google Scholar] [CrossRef]
- Ahmad, S.; Wong, K.Y. Development of weighted triple-bottom-line sustainability indicators for the Malaysian food manufacturing industry using the Delphi method. J. Clean. Prod. 2019, 229, 1167–1182. [Google Scholar] [CrossRef]
- Mitchell, S.; O’Dowd, P.; Dimache, A. Manufacturing SMEs doing it for themselves: Developing, testing and piloting an online sustainability and eco-innovation toolkit for SMEs. Int. J. Sustain. Eng. 2020, 13, 159–170. [Google Scholar] [CrossRef]
- Alshawi, S.; Missi, F.; Irani, Z. Organizational, technical and data quality factors in CRM adoption—SMEs perspective. Industrial Mark. Manag. 2011, 40, 376–383. [Google Scholar] [CrossRef]
- Arena, M.; Azzone, G. A process-based operational framework for sustainability reporting in SMEs. J. Small Bus. Enterp. Dev. 2012. [Google Scholar] [CrossRef]
- Singh, S.; Olugu, E.U.; Fallahpour, A. Fuzzy-based sustainable manufacturing assessment model for SMEs. Clean Technol. Environ. Policy 2014, 16, 847–860. [Google Scholar] [CrossRef]
- Winroth, M.; Almström, P.; Andersson, C. Sustainable production indicators at factory level. J. Manuf. Technol. Manag. 2016. [Google Scholar] [CrossRef]
- Ocampo, L.A.; Clark, E.E.; Promentilla, M.A.B. Computing sustainable manufacturing index with fuzzy analytic hierarchy process. Int. J. Sustain. Eng. 2016, 9, 305–314. [Google Scholar] [CrossRef]
- Mengistu, A.T.; Panizzolo, R. Tailoring sustainability indicators to small and medium enterprises for measuring industrial sustainability performance. Meas. Bus. Excell. 2022. [Google Scholar] [CrossRef]
- Hsu, C.H.; Chang, A.Y.; Luo, W. Identifying key performance factors for sustainability development of SMEs–integrating QFD and fuzzy MADM methods. J. Clean. Prod. 2017, 161, 629–645. [Google Scholar] [CrossRef]
- Álvarez ME, P.; Bárcena, M.M.; González, F.A. On the sustainability of machining processes. Proposal for a unified framework through the triple bottom-line from an understanding review. J. Clean. Prod. 2017, 142, 3890–3904. [Google Scholar] [CrossRef]
- Khan, I.S.; Ahmad, M.O.; Majava, J. Industry 4.0 and sustainable development: A systematic mapping of triple bottom line, Circular Economy and Sustainable Business Models perspectives. J. Clean. Prod. 2021, 297, 126655. [Google Scholar] [CrossRef]
- Commission of the European Communities (CEC). Commission recommendation of 3 April 1996 concerning the definition of small- and medium sized enterprises. Off. J. 1996, L 107, 4–9, (Document 369x0280). [Google Scholar]
- WCED, Special Working Session. World Commission on Environment and Development; Oxford University Press: Oxford, UK, 1987. [Google Scholar]
- Johnson, M.P.; Schaltegger, S. Two decades of sustainability management tools for SMEs: How far have we come? J. Small Bus. Manag. 2016, 54, 481–505. [Google Scholar] [CrossRef]
- Lawrence, S.R.; Collins, E.; Pavlovich, K.; Arunachalam, M. Sustainability Practices of SMEs: The Case of New Zealand. Bus. Strategy Environ. 2006, 15, 242–257. [Google Scholar] [CrossRef]
- Brammer, S.; Hoejmose, S.; Marchant, K. Environmental Management in SMEs in the UK: Practices, Pressures and Perceived Benefits. Bus. Strategy Environ. 2012, 21, 423–434. [Google Scholar] [CrossRef]
- Seidel, M.; Seidel, R.; Tedford, D.; Cross, R.; Wait, L.; Hämmerle, E. Overcoming Barriers to Implementing Environmentally Benign Manufacturing Practices: Strategic Tools for SMEs. Environ. Qual. Manag. 2008, 18, 37–55. [Google Scholar] [CrossRef]
- Borga, F.; Citterio, A.; Noci, G.; Pizzurno, E. Sustainability Report in Small Enterprises: Case Studies in Italian Furniture Companies. Bus. Strategy Environ. 2009, 18, 162–176. [Google Scholar] [CrossRef]
- Revell, A.; Stokes, D.; Chen, H. Small businesses and the environment: Turning over a new leaf? Bus. Strategy Environ. 2010, 19, 273–288. [Google Scholar]
- Cassells, S.; Lewis, K.; Findlater, A. SMEs and ISO 14001 Adoption: A New Zealand Perspective. Small Enterp. Res. 2011, 18, 19–32. [Google Scholar] [CrossRef]
- Elkington, J. Cannibals with Forks: The Triple Bottom Line of 21st Century Business; Capstone Publishing: Oxford, UK, 1997. [Google Scholar]
- Buhr, N.; Gray, R.; Milne, M.J. Histories, rationales, voluntary standards and future prospects for sustainability reporting: CSR, GRI, IIRC and beyond. In Sustainability Accounting and Accountability; Routledge: Oxfordshire, UK, 2014; pp. 69–89. [Google Scholar]
- KPMG. The Road Ahead: The KPMG Survey of Corporate Responsibility Reporting. 2017. Available online: https://assets.kpmg/content/dam/kpmg/xx/pdf/2017/10/kpmg-survey-of-corporate-responsibility-reporting-2017.pdf (accessed on 22 February 2022).
- Lozano, R. Sustainability inter-linkages in reporting vindicated: A study of European companies. J. Clean. Prod. 2013, 51, 57–65. [Google Scholar] [CrossRef]
- Roca, L.C.; Searcy, C. An Analysis of Indicators Disclosed in Corporate Sustainability Reports. J. Clean. Prod. 2012, 20, 103–118. [Google Scholar] [CrossRef]
- Asif, M.; Searcy, C.; Santos, P.D.; Kensah, D. A Review of Dutch Corporate Sustainable Development Reports. Corp. Soc. Responsib. Environ. Manag. 2013, 20, 321–339. [Google Scholar] [CrossRef]
- Gallego, I. The Use of Economic, Social and Environmental Indicators as a Measure of Sustainable Development in Spain. Corp. Soc. Responsib. Environ. Manag. 2006, 13, 78–97. [Google Scholar] [CrossRef]
- Skouloudis, A.; Evangelinos, K.I. Sustainability Reporting in Greece: Are We There Yet? Environ. Qual. Manag. 2009, 19, 43–60. [Google Scholar] [CrossRef]
- Yangil, F.M. Kurumsal sürdürülebilirlik kapsamında sürdürülebilirlik raporlarına yönelik içerik analizi: Türkiye’deki en büyük 100 sanayi işletmesi. İşletme Araştırmaları Derg. 2015, 7, 356–376. [Google Scholar]
- Gencoglu, U.G.; Aytac, A. Kurumsal sürdürülebilirlik açısından entegre raporlamanın önemi ve BIST uygulamaları. Muhasebe Ve Finans. Derg. 2016, 72, 51–66. [Google Scholar] [CrossRef] [Green Version]
- Ertan, Y. Türkiye’de Sürdürülebilirlik Raporlaması, Muhasebe ve Vergi Uygulamaları Dergisi, Cilt 11. Sayı 2018, 3, 463–478. [Google Scholar]
- Saygili, E.; Yargi, S.G.; Erginer, D. Halka açık şirketlerin sürdürülebilirlik raporları analizi: Borsa İstanbul’da bir uygulama. Yönetim Ve Ekon. Derg. 2020, 27, 239–261. [Google Scholar] [CrossRef]
- Caliskan, A.; Ozturkoglu, O.; Ozturkoglu, Y. Ranking of Responsible Automotive Manufacturers According to Sustainability Reports Using PROMETHEE and VIKOR Methods. Adv. Sustain. Syst. 2022, 2100301. [Google Scholar] [CrossRef]
- Etikan, I.; Bala, K. Sampling and sampling methods. Biom. Biostat. Int. J. 2017, 5, 00149. [Google Scholar] [CrossRef] [Green Version]
- Joseph, H.F.; Black, W.C.; Babin, B.J.; Anderson, R.E.; Tatham, R.L. Multivariate Data Analysis, 6th ed.; Pearson Prentice Hall: Upper Saddle River, NJ, USA, 2006. [Google Scholar]
- Ozturkoglu, O.; Saygılı, E.E.; Ozturkoglu, Y. A manufacturing-oriented model for evaluating the satisfaction of workers–Evidence from Turkey. Int. J. Ind. Ergon. 2016, 54, 73–82. [Google Scholar] [CrossRef]
- Ozturkoglu, Y.; Esendemir, E. ERP software selection using IFS and GRA methods. J. Emerg. Trends Comput. Inf. Sci. 2014, 5, 363–370. [Google Scholar]
- Rezaei, J. Best-worst multi-criteria decision-making method. Omega 2015, 53, 49–57. [Google Scholar] [CrossRef]
- Safarzadeh, S.; Khansefid, S.; Rasti-Barzoki, M. A group multi-criteria decision-making based on best-worst method. Comput. Ind. Eng. 2018, 126, 111–121. [Google Scholar] [CrossRef]
- Hair, J.F.; Hult, G.T.M.; Ringle, C.M.; Sarstedt, M. A Primer on Partial Least Squares Structural Equation Modeling (PlS-SEM); SAGE Publications: New York, NY, USA, 2017. [Google Scholar]
- Rezaei, J.; Kothadiya, O.; Tavasszy, L.; Kroesen, M. Quality assessment of airline baggage handling systems using SERVQUAL and BWM. Tour. Manag. 2018, 66, 85–93. [Google Scholar] [CrossRef]
- Esendemir Saygili, E.; Saygili, A.T.; Goren Yargi, S. An Analysis of the Sustainability Disclosures of Textile and Apparel Companies in Turkey. Text. Appar. 2019, 29, 189–196. [Google Scholar]
- Birelma, A. Trade Unions in Turkey. 2018. Available online: https://library.fes.de/pdf-files/id/ipa/14911.pdf (accessed on 15 October 2022).
- Russo, A.; Perrini, F. Investigating stakeholder theory and social capital: CSR in large firms and SMEs. J. Bus. Ethics 2010, 91, 207–221. [Google Scholar] [CrossRef]
- Hörisch, J.; Freeman, R.E.; Schaltegger, S. Applying stakeholder theory in sustainability management: Links, similarities, dissimilarities, and a conceptual framework. Organ. Environ. 2014, 27, 328–346. [Google Scholar] [CrossRef]
- Phillips, R.A.; Freeman, R.E.; Wicks, A.C. What stakeholder theory is not. Bus. Ethics Q. 2003, 13, 479–502. [Google Scholar] [CrossRef]
- GRI. G4 Sustainability Reporting Guidelines. 2013. Available online: https://www2.globalreporting.org/standards/g4/Pages/default.aspx (accessed on 3 February 2022).
| Author(s) | Economic Indicators | Environmental Indicators | Social Indicators |
|---|---|---|---|
| Arena and Azzone, 2012 [6] | Materials, energy, water, greenhouse gas emissions, NOx, SOx, other significant air emissions, water discharge, waste, compliance, transport | Employment, occupational health and safety, training and education, diversity and equal opportunity, procurement practices, community, customer health and safety, compliance | |
| Singh et al., 2014 [7] | Cost, quality, responsiveness, flexibility | Materials, reused and recyclable materials, hazardous and waste materials, non-renewable materials, renewable energy, energy intensity, water consumption, wastewater, land usage, direct and indirect emissions | Employee turnover, labor intensity, employee training, customers satisfaction, community involvement |
| Winroth et al., 2016 [8] | Employees, customers, development expenditure, production operation, supplier | Natural resources, energy, material, waste, and emissions, environmental legal and standard compliance | Health and safety, education and training, labor-management relations, diversity and equal opportunity, human capital |
| Hsu et al., 2017 [11] | Cost reduction, quality improvement, delivery performance, economic potential | Substance emissions, resource consumption, green manufacturing, environmental policy | Community impact, work environment, customer relationship |
| Ahmad and Wong, 2019 [3] | Revenue, profit, subsidy or tax relief from the government, the cost for raw materials, packaging, depreciation, labor, maintenance, environmental fines, utility, defective products, R&D, training, advertisement, and promotion | Materials used, energy used, water used, chemicals used, emissions, wastewater, solid waste | Labor rights, working conditions, labor well-being and satisfaction, customer well-being and satisfaction, community and social well-being, community and society satisfaction |
| Mengistu and Panizzolo, 2022 [10] | Profit, revenue, R&D expenditure, material and labor costs, maintenance and energy costs, packaging and inventory costs, product quality, lead time, on-time delivery | Water and recycled water use, energy and renewable energy use, energy efficiency and intensity, material and recycled material use, packaging, land use, GHG emissions, wastewater discharge, solid water disposal, recyclable waste | Employment opportunity, fair salary, employee turnover and satisfaction, occupational and customer health and safety, training and development, working conditions and hours, work-related injuries, lost working days, customer satisfaction and complaints, corruption |
| Gender % | Education of Participants % | Position of Participants % | |||
|---|---|---|---|---|---|
| Male | 57.7 | High school | 11.3 | Owner-manager | 38.3 |
| Female | 42.3 | University | 71.1 | Senior manager | 31.6 |
| Graduate school | 17.6 | Mid-level manager | 24.6 | ||
| Other | 5.5 | ||||
| Age of Companies % | Sales Revenue of Companies % | No. of Employees in Companies % | |||
| 1–9 years | 18.5 | USD 0–4.9 million | 31.5 | 1–9 | 44.0 |
| 10–19 years | 44.4 | USD 5–14.9 million | 35.2 | 10–49 | 37.1 |
| 20 years and above | 37.1 | USD 15 million and above | 33.3 | 50–249 | 38.9 |
| Indicators | ||||||||||||
|---|---|---|---|---|---|---|---|---|---|---|---|---|
| Items | 1 | 2 | 3 | 4 | 5 | 6 | 7 | 8 | 9 | 10 | 11 | 12 |
| ER5 | 0.751 | |||||||||||
| ER2 | 0.691 | |||||||||||
| ER1 | 0.622 | |||||||||||
| HR3 | 0.588 | |||||||||||
| ER3 | 0.542 | |||||||||||
| ER6 | 0.531 | |||||||||||
| ER4 | 0.526 | |||||||||||
| HR4 | 0.698 | |||||||||||
| HR2 | 0.661 | |||||||||||
| HR5 | 0.646 | |||||||||||
| HR7 | 0.570 | |||||||||||
| HR10 | 0.518 | |||||||||||
| PR2 | 0.716 | |||||||||||
| PR6 | 0.606 | |||||||||||
| PR1 | 0.575 | |||||||||||
| PR7 | 0.563 | |||||||||||
| PR9 | 0.531 | |||||||||||
| RE2 | 0.760 | |||||||||||
| RE1 | 0.731 | |||||||||||
| RE3 | 0.704 | |||||||||||
| GR2 | 0.689 | |||||||||||
| GR5 | 0.670 | |||||||||||
| GR3 | 0.580 | |||||||||||
| EP2 | 0.834 | |||||||||||
| EP3 | 0.658 | |||||||||||
| EC9 | 0.809 | |||||||||||
| EC5 | 0.697 | |||||||||||
| EC6 | 0.540 | |||||||||||
| EC3 | 0.526 | |||||||||||
| EE1 | 0.792 | |||||||||||
| EE2 | 0.521 | |||||||||||
| SC1 | 0.647 | |||||||||||
| SC2 | 0.549 | |||||||||||
| ES1 | 0.777 | |||||||||||
| ES2 | 0.606 | |||||||||||
| CR1 | 0.642 | |||||||||||
| CR2 | 0.598 | |||||||||||
| EC1 | 0.858 | |||||||||||
| EC7 | 0.640 | |||||||||||
| EC8 | 0.587 | |||||||||||
| Expert | Working Experience | Sector | Position |
|---|---|---|---|
| 1 | 14 years | SME development and organization of Turkey | SME expert |
| 2 | 12 years | Sustainability consultancy company | Sustainability supervisor |
| 3 | 10 years | Sustainability consultancy company | Sustainability advisor |
| 4 | 10 years | SME | Sustainability expert |
| 5 | 13 years | SME | Sustainability project manager |
| 6 | 16 years | Academics | Associate professor |
| 7 | 25 years | Academics | Professor |
| Kaiser–Meyer–Olkin Measure of Sampling Adequacy | ||
| 0.782 | ||
| Bartlett’s test of sphericity | ||
| Approx. chi-square | 2829.103 | |
| Df | 820 | |
| Sig. | 0.000 | |
| Initial Eigenvalues | Rotation Sums of Squared Loadings | |||||
|---|---|---|---|---|---|---|
| Factors | Total | % of Variance | Cumulative % | Total | % of Variance | Cumulative % |
| 1 | 11.982 | 29.224 | 29.224 | 4.161 | 10.149 | 10.149 |
| 2 | 2.889 | 7.045 | 36.269 | 3.269 | 7.973 | 18.122 |
| 3 | 2.383 | 5.812 | 42.081 | 2.871 | 7.003 | 25.126 |
| 4 | 2.020 | 4.927 | 47.008 | 2.802 | 6.835 | 31.961 |
| 5 | 1.822 | 4.444 | 51.452 | 2.534 | 6.181 | 38.142 |
| 6 | 1.612 | 3.931 | 55.383 | 2.375 | 5.793 | 43.935 |
| 7 | 1.376 | 3.356 | 58.739 | 2.305 | 5.622 | 49.557 |
| 8 | 1.249 | 3.045 | 61.784 | 2.220 | 5.415 | 54.971 |
| 9 | 1.166 | 2.843 | 64.627 | 1.901 | 4.637 | 59.608 |
| 10 | 1.098 | 2.677 | 67.304 | 1.805 | 4.402 | 64.011 |
| 11 | 1.082 | 2.640 | 69.945 | 1.781 | 4.344 | 68.355 |
| 12 | 1.022 | 2.493 | 72.438 | 1.674 | 4.083 | 72.438 |
| Factors | Items | Item Description | Cronbach Alpha Value (α) | CR | AVE |
|---|---|---|---|---|---|
| 1. Employee rights | ER1 | Employee diversification | |||
| ER2 | Employee benefits | ||||
| ER3 | Rate of return to work after parental leave | ||||
| ER4 | Minimum notice periods | 0.864 | 0.81 | 0.38 | |
| ER5 | Occupational health and safety | ||||
| ER6 | Education and training programs | ||||
| HR3 | Prevention of employee discrimination | ||||
| 2. Human rights | HR2 | Human rights employee training | |||
| HR4 | Association and collective bargaining rights | ||||
| HR5 | Prevention of child labor | 0.809 | 0.76 | 0.38 | |
| HR7 | Human rights training of security personnel | ||||
| HR10 | Supplier human rights assessment | ||||
| 3. Product responsibility | PR1 | Product health and safety | 0.803 | ||
| PR2 | Product labelling | 0.74 | |||
| PR6 | Sale of banned products | ||||
| PR7 | Compliance with marketing regulations | 0.37 | |||
| PR9 | Compliance with regulations concerning the provision and use of products | ||||
| 4. Recycling | RE1 | Recycled material | |||
| RE2 | Recycled water and wastes | 0.793 | 0.78 | 0.54 | |
| RE3 | Recycled packaging | ||||
| 5. Green products and suppliers | GR2 | Compliance with environmental law | 0.762 | ||
| GR3 | Environmentally friendly transportation | 0.70 | 0.43 | ||
| GR5 | Environmentally friendly suppliers | ||||
| 6. Environmental protection | EP1 | Conservation of biological diversity | 0.717 | 0.72 | 0.57 |
| EP2 | Reduction in greenhouse gas emissions | ||||
| 7. Economic impact on labor and local community | EC3 | Employee benefit plans | 0.730 | 0.74 | 0.43 |
| EC5 | Entry-level wages | ||||
| EC6 | Local employment | ||||
| EC9 | Local supplier | ||||
| 8. Labor equality | EE1 | Equal opportunities for employees | 0.676 | 0.61 | 0.45 |
| EE2 | Equal remuneration for women and men | ||||
| 9. Social compliance | SC1 | Anti-corruption | 0.660 | 0.53 | 0.36 |
| SC2 | Compliance with competition rules | ||||
| 10. Energy-saving | ES1 | Reduction in energy consumption | 0.680 | 0.65 | 0.49 |
| ES2 | Energy saving product | ||||
| 11. Customer relations | CR1 | Customer satisfaction surveys | 0.653 | 0.56 | 0.39 |
| CR2 | Importance given to customer privacy | ||||
| 12. Economic issues | EC1 | Direct economic impacts | 0.720 | 0.74 | 0.50 |
| EC7 | Financial implications of climate change | ||||
| EC8 | Infrastructure investments |
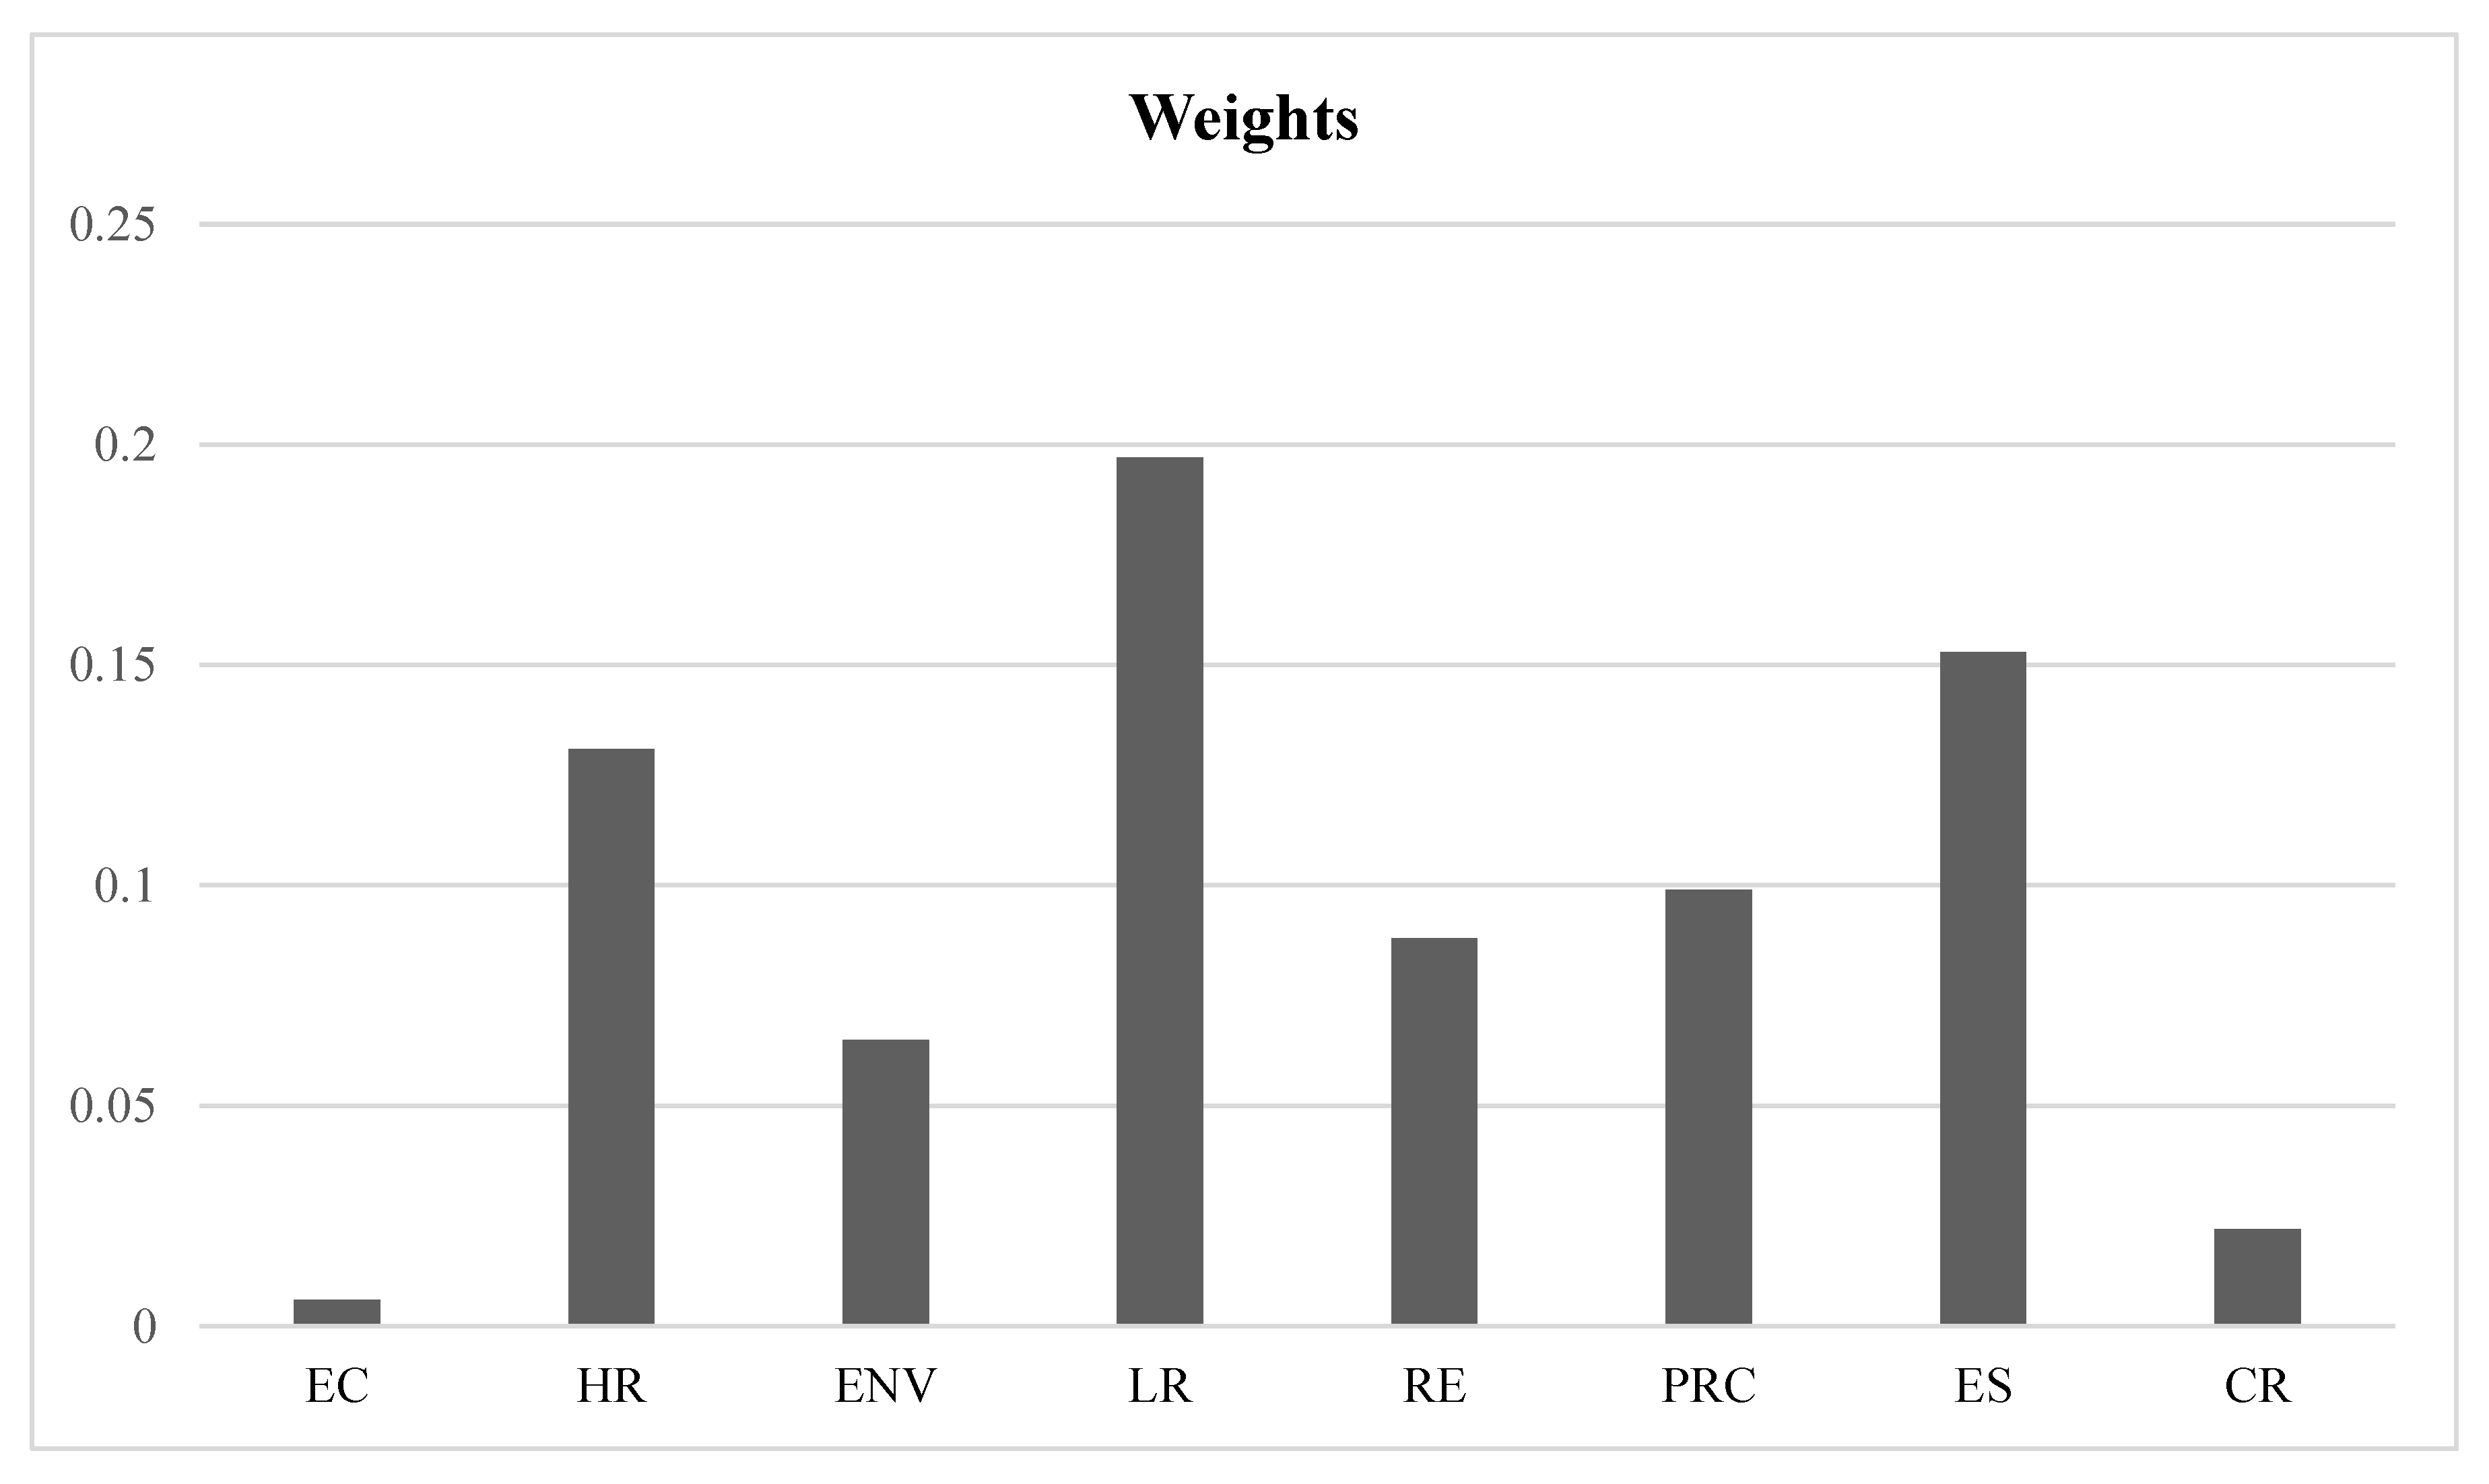
| Criteria | Local Weights | Rank | Definitions |
|---|---|---|---|
| Economic impact and compliance (EC) | 0.006 | 8 | Economic impacts on labor and local community, climate change, and infrastructure investments |
| Human rights (HR) | 0.131 | 3 | Human rights training and assessment, prevention of child labor |
| Environment protection (ENV) | 0.065 | 6 | Green products, transportation and suppliers, biological diversity, and GHG emissions |
| Labor rights (LR) | 0.197 | 1 | Employee rights and labor equality |
| Recycling (RE) | 0.088 | 5 | Recycled material, water, wastes and packaging |
| Product responsibility and compliance (PRC) | 0.099 | 4 | Product responsibility and compliance with market rules and regulations |
| Energy saving (ES) | 0.153 | 2 | Reduction in energy consumption and energy saving product |
| Customer relations (CR) | 0.022 | 7 | Customer satisfaction and privacy |
| EC | HR | ENV | LR | RE | PRC | ES | CR | |
|---|---|---|---|---|---|---|---|---|
| Mean | 0.122 | 0.290 | 0.070 | 0.187 | 0.364 | 0.290 | 0.194 | 0.224 |
| 0.068 | 0.020 | 0.028 | 0.038 | 0.043 | 0.043 | 0.090 | 0.080 |
Disclaimer/Publisher’s Note: The statements, opinions and data contained in all publications are solely those of the individual author(s) and contributor(s) and not of MDPI and/or the editor(s). MDPI and/or the editor(s) disclaim responsibility for any injury to people or property resulting from any ideas, methods, instructions or products referred to in the content. |
© 2023 by the authors. Licensee MDPI, Basel, Switzerland. This article is an open access article distributed under the terms and conditions of the Creative Commons Attribution (CC BY) license (https://creativecommons.org/licenses/by/4.0/).
Share and Cite
Saygili, E.; Uye Akcan, E.; Ozturkoglu, Y. An Exploratory Analysis of Sustainability Indicators in Turkish Small- and Medium-Sized Industrial Enterprises. Sustainability 2023, 15, 2063. https://doi.org/10.3390/su15032063
Saygili E, Uye Akcan E, Ozturkoglu Y. An Exploratory Analysis of Sustainability Indicators in Turkish Small- and Medium-Sized Industrial Enterprises. Sustainability. 2023; 15(3):2063. https://doi.org/10.3390/su15032063
Chicago/Turabian StyleSaygili, Ebru, Elif Uye Akcan, and Yucel Ozturkoglu. 2023. "An Exploratory Analysis of Sustainability Indicators in Turkish Small- and Medium-Sized Industrial Enterprises" Sustainability 15, no. 3: 2063. https://doi.org/10.3390/su15032063