Abstract
In the current paper, different thermal energy storage unit-integrated photovoltaic thermal (PVT) air collectors with and without nanoparticles have been designed, fabricated and tested. Aluminum oxide nanoparticles have been integrated into the thermal storage unit to increase the performance of the PVT collector. The developed collectors have been tested in a drying application at two different mass flow rates. The major goals of this work are upgrading the performance of the PVT air collector by employing a nano-embedded thermal energy storage unit and analyzing the impacts of using nanoparticles in the latent heat storage unit in the PVT collector on the drying performance of the system. The drying time was reduced by approximately 15–22% by employing nanoparticles in the thermal storage unit. Moreover, overall exergy efficiency values were obtained in ranges of 12.49–14.67% and 13.64–16.06%, respectively, for modified and unmodified PVT air collectors. It should be indicated that the overall energy and exergy efficiencies of the PVT air collectors were improved in the ranges of 6.91–6.97% and 9.20–9.47%, respectively, by using nanoparticles in the thermal energy storage unit. The combination of increasing the flow rate and integrating nanoparticles into the storage unit improved the overall exergetic efficiency of the PVT air collector by 28.58%. The mean exergetic efficiency of the drying room was between 48.33 and 54.26%. In addition to the experimental analysis, dynamic models for thermal and exergy efficiencies of developed collectors were constructed by employing the system identification method.
1. Introduction
Global energy demand is increasing day by day and results in negative consequences such as environmental pollution [1,2]. Sustainable and inexhaustible energy resources should be utilized to eliminate these negative impacts. In recent years, solar energy has become one of the most popular renewable energy sources because of its widely accessible and easy-to-apply features [3,4]. Both electrical and thermal energy can be produced by using solar irradiance.
One of the most popular methods for simultaneously producing electrical and thermal energies is utilizing hybrid photovoltaic thermal (PVT) collectors. Different working fluids such as air, water and nanofluids can be employed in PVTs. Moreover, various modifications such as fins [5] and obstacles [6] can be integrated to increase the residence time of the working fluid and heat transfer surface area. There are some works about different modifications in PVT systems in the academic literature. Fan et al. [7] investigated a hybrid PVT solar air heating system by employing a multiobjective design optimization approach. The thermal and electrical output values were significantly improved with the optimization study. Fudholi et al. [8] designed a grooved PVT air heating system and tested the collector under different conditions. They achieved an exergy efficiency value in the range of 12.89–13.36%.
In addition to geometrical modifications, the thermal performance of PVT systems can be upgraded by utilizing latent heat thermal energy storage units (TESUs). Generally, paraffin wax is employed in TESUs as a phase change material (PCM) [9]. There are some advantages of paraffin, which are the absence of phase separation and constant latent heat of fusion [10,11]. One of the main characteristics of paraffin wax is its low melting point, which allows its usage in low-temperature systems [12]. Fiorentini et al. [13] developed a PVT air system with PCM to be utilized in a residential HVAC system. They employed a hybrid predictive control model for optimizing the system. In a work published by Ahmadi et al. [14], PCM-integrated PVT systems have been tested under natural and forced convection modes. Energy efficiency values for the best PVT cases were achieved as 67–83% and 13–14%, respectively, for active and passive modes. Carmona et al. [15] designed a PVT system with PCM and a recovery system. The electrical efficiency was improved by 7.43% in comparison to a conventional photovoltaic panel. Fu et al. [16] structured a PVT system using PCM with multilayer heat exchangers. In their work, the mean electrical yield was upgraded by 1% by employing PCM.
It is known that paraffin wax has low thermal conductivity [17,18]. Nanoparticles can be added to PCMs for upgrading their thermal conductivity values. There are some studies that investigate PVT systems modified with nano-enhanced PCM. Al-Waeli et al. [19] investigated a PVT system with nano-embedded PCM. They achieved electrical and thermal efficiencies between 13.2 and 13.7% and 71.3 and 72%, respectively. Kazemian et al. [20] utilized aluminum oxide nano-enhanced PCM in a PVT water heater. They also used response surface methodology in the study. The optimal thermal and electrical exergies were attained as approximately 2.4 and 136 W/m2, respectively. There are also some studies that consider the utilization of PVT water heaters with zinc oxide and copper oxide nano-enhanced PCM [21,22]. It should be indicated that these mentioned studies include PVT water heating systems.
PVT collectors can be utilized in various processes such as domestic water heating, space heating and drying. Agricultural product drying by using PVT collectors has become a popular research topic in recent years. Veeramanipriya and Sundari [23] developed a PVT system based on a vacuum tube collector and tested it in a drying application. The drying process was performed for eight hours, and moisture content was reduced from approximately 91.5% to 11%. Tiwari et al. [24] designed a PVT-assisted greenhouse dehumidification system and performed an experimental analysis. They also performed a numerical investigation based on MATLAB. In another study, Mortezapour et al. [25] structured a PVT heater-assisted heat pump dryer for a saffron drying process. According to the experimental results, the maximum drying efficiency was obtained as 72%. Nayak et al. [26] utilized a PVT collector to improve the performance of a greenhouse dryer. The mean efficiency of the dryer was found to be 34.2%. Tiwari and Tiwari [27] developed a mixed-mode PVT air collector integrated greenhouse dryer. They utilized different numbers of collectors in the drying application. The thermal efficiency of the developed system varied approximately between 42% and 61%. In another study, Çiftçi et al. [28] fabricated a vertically placed PVT air heating system, which was utilized in a drying application. The thermal efficiency of the developed PVT was found to be between 47.46% and 58.16%. Gupta et al. [29] analyzed a PVT dryer under forced and natural convection conditions. The thermal efficiency of the PVT collector and payback time of the dryer were between 43.58 and 69.27% and 1.4 and 1.7 years, respectively. Tiwari et al. [30] investigated a solar dryer based on a PV-attached roof and a drying room. The overall yield of the system was attained as 77.98%. In another work, Gupta et al. [31] designed a PVT drying system for a green tea drying process, where the maximum thermal efficiency of the PVT collector was found to be 58.71%.
In recent years, modeling of drying applications by utilizing different modeling approaches has become a popular research topic. Hao et al. [32] analyzed and modeled a solar dehumidifier. They used experimental data including environmental conditions, air flow rate and outlet temperature by using five different machine learning approaches. They obtained higher accuracy between the experimental data and model outputs. Gürel et al. [33] developed and experimentally analyzed a solar-collector-assisted fluidized bed drying system. A modeling approach based on response surface methodology was used for the experimentally obtained moisture content. In another work, Kırbaş et al. [34] employed artificial intelligence to estimate various drying methods of pomelo peel while a smart interface in the model was also provided. In a study performed by Dhalsamant [35], a mixed-mode solar drying process was modeled using an artificial intelligence method by using different parameters such as product diameter, drying time and product temperature. Abdenouri et al. [36] predicted the thermal behavior in a solar dryer by developing a state-space model. A new type of temperature controller was developed for the solar drying system.
In this work, two different PVT air collectors including a paraffin-based TESU and nano-enhanced paraffin-based TESU are designed and produced. In the previous work, the influence of adding copper oxide nanoparticles in the thermal storage component on the thermal and electrical performances of a PVT air heater was explored [37]. Moreover, alumina nanoparticles were utilized in the thermal energy storage unit of a greenhouse drying system [38]. This study also compares the effect of utilizing an alumina nano-enhanced TESU on the performances of greenhouse dryers and PVT dryers. In the present work, a new type of PVT is developed, and its effectiveness in a drying application is experimentally explored. A novel nano-enhanced TESU-integrated PVT air collector has been utilized in a solar drying application. The major aims of this work are to develop a novel nano-enhanced thermal energy storage unit to improve the performance of a PVT air collector and test the newly developed PVT air collector in a drying application. Solar radiation has been employed to meet both the thermal and electricity demands of a drying system by using the present design. By using alumina nanoparticles, the effectiveness of the TESU in the PVT air collector is significantly upgraded. There are many works available in the literature that explain the positive effects of utilizing alumina nanoparticles in various types of solar thermal systems including the solar organic Rankine cycle [39], solar thermal energy storage system [40], solar liquid collector [41] and concentrating solar systems [42] because of their superior thermal properties [43]. The general structure of the current study is presented in Figure 1. Data from the experimental analysis are used to create a dynamic model based on the system identification method, which is also another novelty of the present work. A multi-input multi-output (MIMO) dynamic model is developed for the energetic and exergetic efficiency values of the PVT collectors.
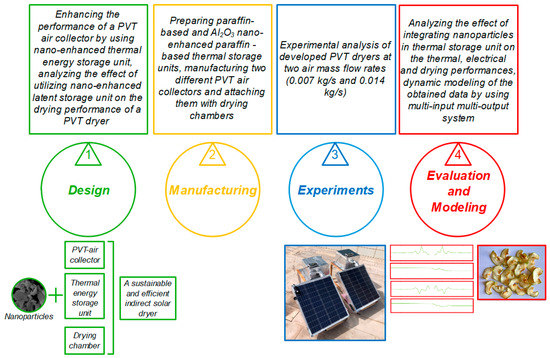
Figure 1.
General structure of the present study.
2. Materials and Methods
2.1. Fabrication of Nano-Integrated Latent Heat Storage Unit
In the current study, two different PVT air collectors with different modifications are developed. In this regard, two different thermal energy storage units (TESUs) were prepared. Two basins were fabricated by utilizing 1 mm thick aluminum sheets (dimensions: 620 × 590 × 250). Paraffin was selected as the phase change material in PVT air collectors. The first TESU contains paraffin wax. Paraffin wax was liquefied on a heater at a constant 60 °C and poured into the basin for fabricating the first TESU. The volume expansion rate of the phase change material is indicated as 0.125 by the manufacturing company. In this context, 85% of basins were filled to prevent leakages in the liquid phase. The second TESU includes alumina (Al2O3) nanoparticles. A two-step approach was employed to fabricate a nano-embedded TESU (NeTESU) [44,45]. In the initial stage, paraffin was liquefied, and nano-sized particles were added to the paraffin. After that process, the obtained mixture was stirred by a mechanical stirrer for an hour at 500 rpm. An MTOPS brand MS3040 model mechanical mixer was utilized for that purpose. In the last step of the preparation process, nano-embedded paraffin wax was sonicated for three hours to achieve a homogenous dispersion. It should be stated that the entire process was conducted in the liquid phase at a constant temperature (60 °C). Additionally, the weight concentration of the nano-integrated phase change material is 1% (wt/wt). Determination of the weight concentration and the entire preparation process were performed by referring to similar works in the literature that analyzed different types of nano-enhanced PCMs including myoinositol-based nano-PCM [46], oxide nano-enhanced PCM [47] and alumina nano-enhanced paraffin wax [48]. Specifications of the employed PCM and nanoparticles are depicted in Table 1. In addition, the SEM image and XRD pattern of utilized alumina nanoparticles are shown in Figure 2. The morphological structure of the Al2O3 nanoparticles was examined with the LEO 1430VP model scanning electron microscope (SEM) images (Figure 2a). This micrograph showed that the synthesized nanoparticles are not apart but rather interconnected in chains of beads with primary particles with an average size of ∼130 nm. However, small particles less than 40 nm in size exist in clusters between larger particles as evidenced by Figure 2a. The X-ray diffraction (XRD) pattern of Al2O3 nanoparticles (Figure 2b) was recorded at room temperature using Philips X-ray diffractometer with Cu Kα radiation (λ = 1.5406 Å) in 2θ ranging from 20° to 80°. The prepared nanostructures’ XRD pattern confirmed the formation of Al2O3 nanostructures with a cubic structure and a face-centered lattice of Al2O3 nanoparticles with a lattice constant of a = b = c = 7.94 Å. This is completely consistent with the standard Joint Committee on Powder Diffraction Standards (JCPDS) card (no: 79-1558) [49].

Table 1.
Specifications of the utilized paraffin wax and Al2O3 nanoparticles.
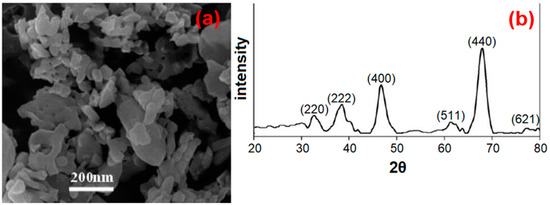
Figure 2.
SEM image (a) and XRD pattern (b) of the utilized nanoparticles.
2.2. Experimental Setup
As mentioned before, a copper oxide nanoparticle-integrated TESU has been utilized in a PVT air collector in the previous study [37]. The present work investigates the effects of utilizing alumina nanoparticles on the performance of the PVT air collector. Moreover, the performance of the newly developed collector was tested in a drying application. In this regard, two PVT air heaters with different modifications were developed and fabricated. PV panels (power: 85 W) were employed (brand/model: Lexron/LXR-85P, Imp = 4.44 A, Vmp = 18.00 V, Isc = 4.86 A, Voc = 22.10 V and dimensions: 670 × 780 × 25 mm) in the experimental part of this study. The first PVT collector contains a paraffin-based TESU. The second PVT collector was improved with a nano-enhanced TESU. The depths of air channels are 70 mm for both collectors. Four guiding plates were integrated into each collector. TESUs were put on the back surface of the PV systems. The dimensions of the storage units are 620 × 590 × 25 mm. Impermeability was secured by employing epoxy glue and liquid seal. The guiding fins and the basin of the TESU were fabricated from 1 mm thick aluminum sheets for both collectors. Dimensions of the PVTs are illustrated in Figure 3. Fabricated PVT collectors were coupled with drying chambers with dimensions of 300 × 300 × 200 mm. It should be indicated that the sides and bottom part of the PVT collectors and entire surfaces of drying chambers were thermally insulated. Two identical platforms were manufactured for placing the PVT dryer with a thermal energy storage unit (PVTD/TESU) and nano-embedded thermal energy storage unit (PVTD/NeTESU). The schematic illustration and an image of the test rig are presented in Figure 4 and Figure 5, respectively.
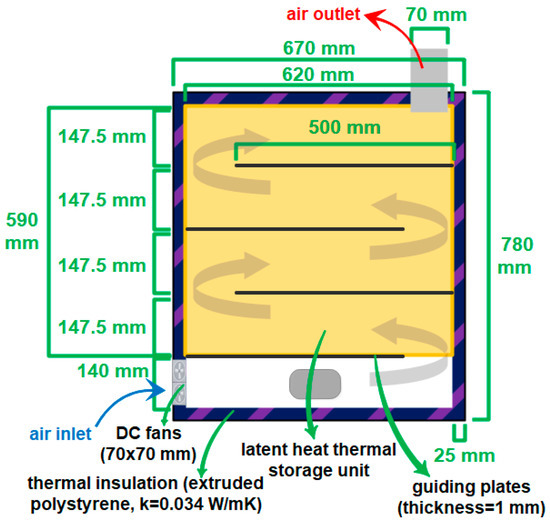
Figure 3.
Dimensions of the PVT air heaters.
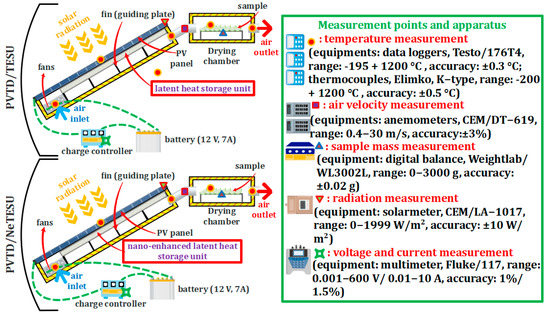
Figure 4.
Schematic image of the test setup.
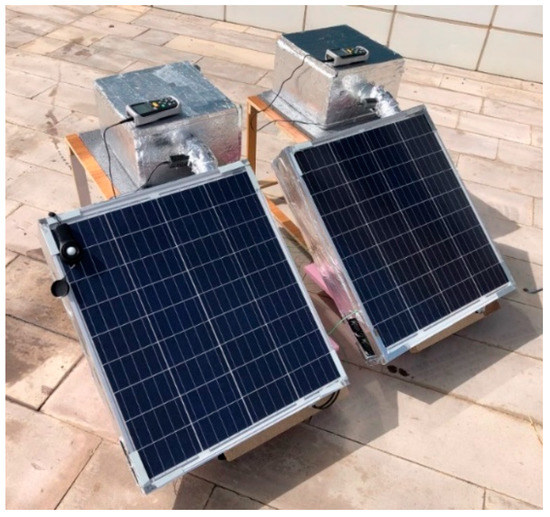
Figure 5.
A photograph of the test rig.
2.3. Experimental Procedure
Performance tests were executed on two consecutive days in August 2021 in Manisa province of Turkey. The developed dryers were tested simultaneously at two mass flow rates of 0.014 and 0.007 kg·s−1. In other words, the developed systems were tested at a higher flow rate on the first day, while on the second day, the developed PVT dryers were tested simultaneously at a lower flow rate. Green apples (Granny Smith) were employed as a drying sample within the scope of this survey. Apples were cleaned and seeds were subtracted and sized into 3 mm slabs by employing a special slicing apparatus. The initial moisture content (5.20 ± 0.12 gwater·gdry matter−1) of the drying sample was determined by using an oven-drying approach, which is a widely utilized method [28,50,51]. The mass of products is taken as 100 g for each drying system. Drying samples were placed on a perforated tray before the tests. Performance tests were started at 10 a.m. in the morning and finished when the variation between two mass measurements was lower than one percent. However, PVT collector performance tests were continued until 17:00 to observe the thermal and electrical behavior of newly developed TESUs. Temperature measurements were taken every five seconds. Other metrics were measured ten-minute intervals.
3. Theoretical Analysis
3.1. Energy Evaluation of the PVT Collector
The energy expressions in a hybrid PVT air collector system can be given as below:
In the second equation (Equation (2)), represents the receiving solar radiation and could be expressed by employing Equation (4) [52]:
The thermal energy gained by flowing air could be found as
The specific heat capacity of the air can be found as [53]
Electrical power can be attained as
In Equation (7), depicts the fill factor of the PV module, and it could be attained as [54]
The overall energy of the PVT system can be given as
Energy losses in the hybrid collector could be shown as follows:
The electrical yield of the PVT collector could be attained as [52]
The thermal efficiency of the PVT system could be given as [55]
The normalized power output efficiency defines the ratio of outlet power attained under actual conditions to standard test conditions, and it can be achieved as
The performance ratio is a widely employed warranty metric for commercial PV facilities. This indicator could be employed to compare the performance of PV plants in different regions and could be found by employing Equation (14) [56]
3.2. Exergy Evaluation of the PVT Collector
The exergy expressions in a PVT air heater at quasi-steady-state conditions could be given as follows [57]:
Exergy input can be achieved as follows [58]:
Exergy of the air flow rate could be expressed by using Equation (19):
Stream exergy equations could be given as [52]
The electrical exergy can be found as below [59]:
Total exergy can be achieved by employing Equation (23):
Destroyed exergy of the collector can be found as
The electrical exergy efficiency could be obtained by employing the expression below [52]:
Thermal exergy efficiency could be achieved as [52]
Total exergy efficiency can be attained as
3.3. Exergy Evaluation of the Drying Room
The exergy balance expression for the drying chamber could be attained as
Inlet and outlet exergies for the drying room could be attained by using Equations (29) and (30), respectively [60]:
The exergy yield of the drying room could be given as [61]
3.4. Evaluation of Drying Parameters
The dry basis moisture content could be expressed as [62]
The moisture ratio could be found by employing Equation (33) [34]:
The drying rate could be achieved as
Fresh agricultural crops have high moisture content. In this context, Equation (33) can be rewritten as [63]
3.5. Analysis of Exergy-Based Sustainability Parameters
The sustainability index (SI) depicts the lifetime of the analyzed dehumidifier, and WER expresses the exergy loss per given unit exergy inlet. The SI can be expressed as
The waste exergy ratio can be found as [62]
3.6. Uncertainty Analysis
Expression of experimental uncertainty in its general form can be given as [64,65]
Obtained uncertainty values are depicted in Table 2. The obtained uncertainties are in good agreement with similar surveys that analyzed PVT collectors and solar dryers [52,66,67,68].
Table 2.
Empirical uncertainties.
4. Dynamic Model with MIMO System Identification
An input–output dynamic model is constructed by using the available data from the experimental study. Models based on artificial intelligence, identification and model order reduction are created by using a data set from the experimental test rig or computational fluid dynamics in diverse energy system technologies [69,70,71,72,73]. These mathematical models are used for fast estimation of the system performance or to capture the dynamic features of the systems.
A multi-input multi-output (MIMO) system is considered by using system identification [74,75,76]. In this method, relevant input and output data sets are collected. Then, a model structure using finite impulse response (FIR), autoregressive with exogenous input (ARX) and output error (OE) is selected. The number of delays in the input and output data set, regressor type, selection of the appropriate model structure and model validation checks are some of the common steps available in dynamics system modeling. The functional form for a multivariable ARX model can be represented as
In Equation (39), and denote the input and output data set, respectively.
In the present work, ambient temperature and solar radiation were considered as the input while thermal energy and exergy efficiencies were used as the output for the system at a flow rate of 0.07 kg/s. Time-dependent data from local time between 10:00 to 16:00 with 10 min sampling were used to obtain the input–output dynamic models. Two different MIMO models were constructed—one for the PVT with TESU and the other for the PVT with NeTESU. The MATLAB system identification toolbox was utilized in the investigation. The model order and delays for a 2 input–2 output ARX model were selected as
5. Results and Discussion
5.1. Experimental Results
In this part, empirical outcomes and results of the modeling study of the present work have been presented and discussed in detail. Experimental evaluation includes thermal, electrical and exergetic analysis of the developed PVT air heating systems, investigation of drying parameters and exergy-based sustainability indicators and exergetic analysis of the drying room.
Change in environmental parameters over time is illustrated in Figure 6. The attained mean environmental temperature values for the tests performed at high and low mass flow rates are 31.8 and 32.0 °C, respectively. Moreover, mean solar radiation values were observed as 866 and 870 W/m2, respectively. Environmental parameters are quite similar for both days. The deviation between solar radiation and ambient temperature values are 0.62% and 0.46%, respectively. These similar environmental values allow us to make an accurate comparison of the obtained results.
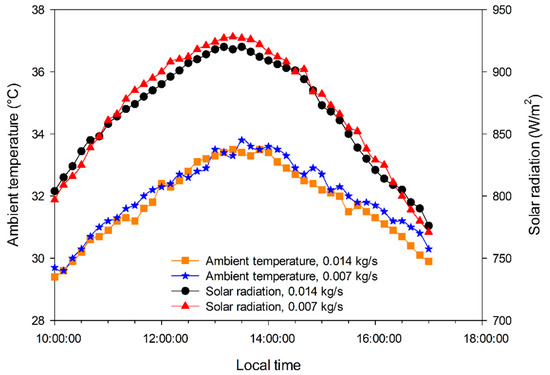
Figure 6.
Change in environmental conditions over time.
The variation in outlet temperatures of air over drying time can be found in Figure 7. The average outlet air temperature was attained as 52.9 and 54.4 °C for the PVT with TESU and PVT with NeTESU, respectively, in the tests performed at high air velocity. For a lower air velocity, outlet air temperatures were attained as 59.8 and 61.9 °C, respectively. The highest instantaneous outlet temperature value was obtained in the PVT with NeTESU as 67.50 °C at 13:20 (experiment performed at a lower flow rate). Similar trends in outlet temperature value were achieved by some studies that analyzed PVT collectors [77,78]. In addition, the mean obtained useful thermal energy rate for the PVT with TESU was between 206 and 294 W. For the PVT with NeTESU, useful gain thermal energy values were attained in the range of 221–315 W. Adding nanoparticles in the system improved the useful thermal energy in the range of 7.14–7.28%.
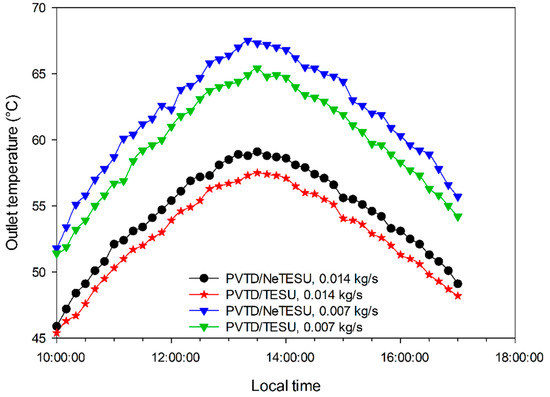
Figure 7.
Change in outlet temperature values over time.
Change in the thermal yield of PVT collectors over time is demonstrated in Figure 8. Mean thermal efficiencies for the PVT with TESU and PVTD with NeTESU were achieved as 65.2% and 69.9%, respectively, in the experiment conducted at a higher velocity. At low air velocity, these values were obtained as 45.6% and 48.9%, respectively. Additionally, the change in electrical efficiencies of PVT collectors over time is illustrated in Figure 9. Mean electrical efficiencies for the PVT with TESU and PVTD with NeTESU were obtained as 12.9% and 13.7%, respectively, in the test performed at a higher velocity. At a low flow rate, these metrics were achieved as 11.2% and 11.8%, respectively. As seen, enhancing the velocity and utilizing nano-doped PCM improved the electrical yield by 22.32%. Integrating nanoparticles into the system enhanced the thermal conductivity of the storage system and led to improvements in both thermal and electrical efficiencies. Gholampour et al. [79] experimentally investigated an unglazed PVT collector, and electrical and thermal efficiencies were enhanced by enhancing the air velocity. Additionally, similar behaviors of thermal and electrical efficiencies were attained in some works about hybrid PVT collectors [80,81].
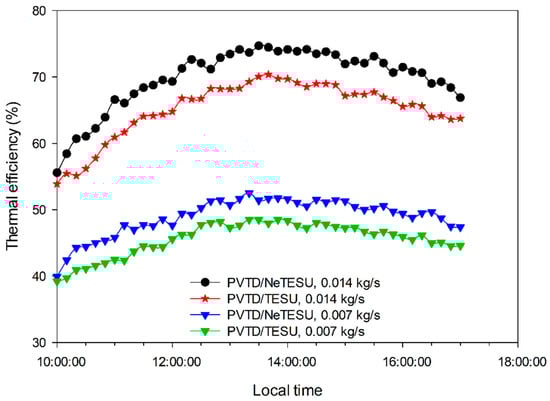
Figure 8.
Change in thermal efficiency values over local time.
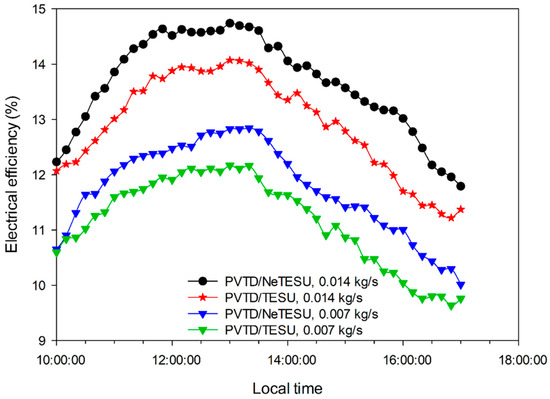
Figure 9.
Change in electrical efficiency values over time.
Average overall energetic efficiency values for the PVT with TESU and PVT with NeTESU were attained as 83.51% and 78.11%, respectively, in the test performed at a higher flow rate. These values were attained as 62.79% and 59.62%, respectively, in the experiment performed at a lower flow rate. By using nanoparticles in the TESU, the overall energetic efficiency values of the PVT air collector were improved by 6.91% and 6.97%, respectively, in the tests performed at higher and lower flow rates. Both modifying the TESU with nanoparticles and enhancing the flow rate improved the overall energetic efficiency by 40.07%.
Figure 10 presents the variation in the performance ratio over time. This metric is generally employed as a warranty value for PV power plant projects. The average performance value was found to be 0.79 and 0.84 for the PVT with TESU and PVT with NeTESU, respectively, in the tests performed at a higher velocity. For a lower velocity, performance ratio values were attained as 0.68 and 0.72, respectively. Moreover, mean normalized power output efficiency values for nano-modified and unmodified PVTs were attained between 62.79 and 72.61% and 59.62 and 68.65%, respectively. As seen, both the performance ratio and normalized power output efficiencies were improved by integrating nanoparticles into the TESU. In the literature, some surveys analyzed conventional and PCM-assisted PV systems and significantly improved the electrical performance by utilizing PCMs [56,82,83]. Different from available works, Al2O3 nano-doped PCM was utilized to enhance the effectiveness of a PVT air collector.
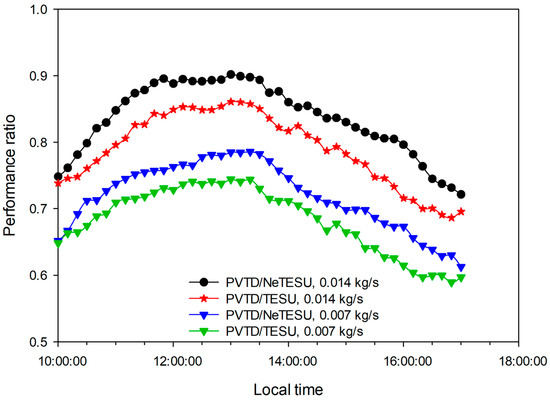
Figure 10.
Change in performance ratio values over time.
The change in moisture contents over time is depicted in Figure 11. The obtained drying process time values for PVTD/TESU and PVTD/NeTESU are 200 and 170 min, respectively, in the test performed at high velocity. These metrics were observed as 330 and 270 min, respectively, in the test performed at low velocity. As seen, utilizing nanoparticles in the system reduced the drying period by between 15 and 22%. Additionally, it can be indicated that the flow rate of air has a crucial influence on the drying time. Increasing the flow rate decreased the drying time by approximately 37–39%. Similar drying behavior can be seen in similar works available in the literature. In a work published by Khanlari et al. [50], a four-flow PV-assisted dehumidification system has been analyzed. Their outcomes showed that drying time was decreased by 21–47% by enhancing the flow rate. Similar drying trends were obtained by some surveys that surveyed solar drying applications [84,85,86].
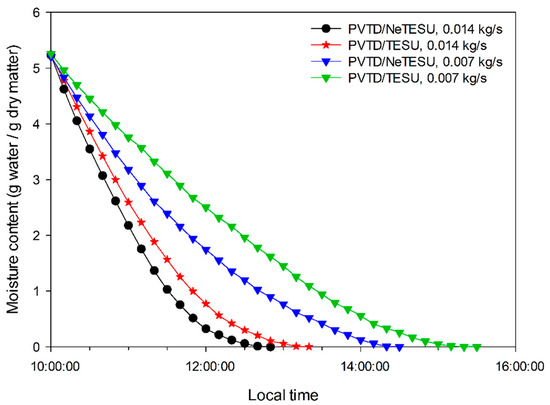
Figure 11.
Change in moisture content values over time.
Drying rate (DR) is a widely utilized performance indicator in solar dehumidification applications. The time-dependent change in DR values is given in Figure 12. The obtained mean DR values for PVTD/TESU and PVTD/NeTESU are 0.00130 and 0.00181 gwater·gdry matter−1·min−1, respectively, in the experiment conducted at a higher velocity. Drying rate values were obtained as 0.00048 and 0.00074 gwater·gdry matter−1·min−1, respectively, in drying test performed at a lower velocity. The moisture content of the drying products is higher during the first period of the drying process. Therefore, it is easier to remove water from the product during this period. However, reducing the moisture content of the product by elapsing time induced a reduction in the DR values. Similar findings were attained by works analyzing solar drying systems performed at flow rates similar to those in this study. Tuncer et al. [67] and Afshari et al. [51] both surveyed sustainable dryers and attained DR values quite similar to those in the current work.
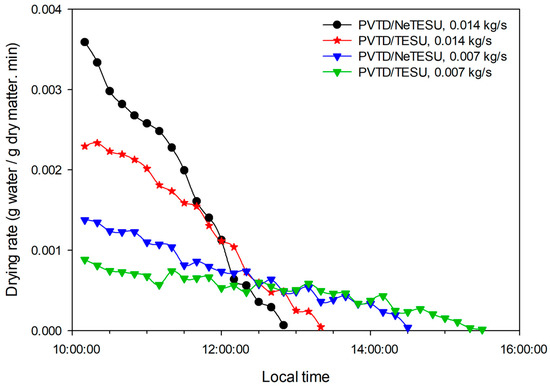
Figure 12.
Change in drying rates over local time.
In this work, the exergetic efficiency metric was analyzed on electrical and thermal aspects [52]. The change in thermal exergy yield values of PVT heaters is given in Figure 13. Mean thermal exergy efficiencies for the PVT with TESU and PVTD with NeTESU were achieved as 8.99% and 8.00%, respectively, in the test conducted at high velocity. Additionally, these metrics were achieved as 7.56% and 6.72%, respectively, in the experiment performed at 0.007 kg·s−1. In one work, Abuşka and Şevik [55] investigated grooved solar air heating systems and achieved an exergy efficiency value between 1 and 7%. In another work, Nayak and Tiwari [87] analyzed a PVT collector to improve the performance of a greenhouse dryer. They attained a thermal exergy efficiency of approximately 4%. In another research, Jahromi et al. [88] analyzed a PVT collector under various climatic conditions and found the thermal exergy efficiency value to be between 9.6 and 9.7%.
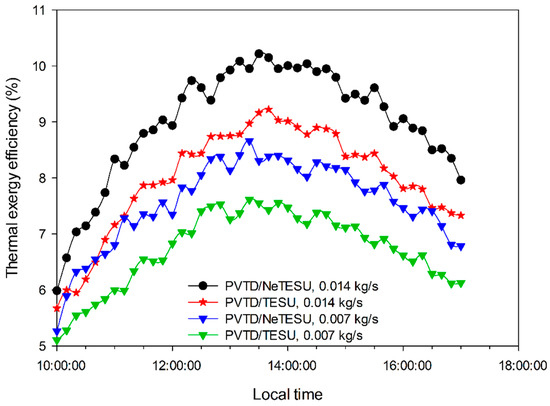
Figure 13.
Change in thermal exergy efficiency values over time.
The change in overall exergy yield over time is given in Figure 14. Total exergy yield is defined as the sum of electrical and thermal efficiency values. The overall exergy efficiencies for the PVT with TESU and PVT with NeTESU were achieved between 12.49 and 14.67% and 13.64 and 16.06%, respectively. In a previous study, a copper oxide nanoparticle-enhanced TESU has been utilized in a PVT collector and compared with conventional and paraffin-based TESU-modified systems [37]. Average overall exergy efficiency values were obtained in the range of 10.52–15.44%. In addition, mean electrical exergy efficiencies were obtained as 6.68% and 7.06%, respectively, in the test performed at high velocity in the current study. At a lower velocity, these values were achieved as 5.77% and 6.08%, respectively. Mean sustainability index values for the hybrid collectors with and without nano-doped modification were attained between 1.16 and 1.19 and 1.14 and 1.16, respectively.
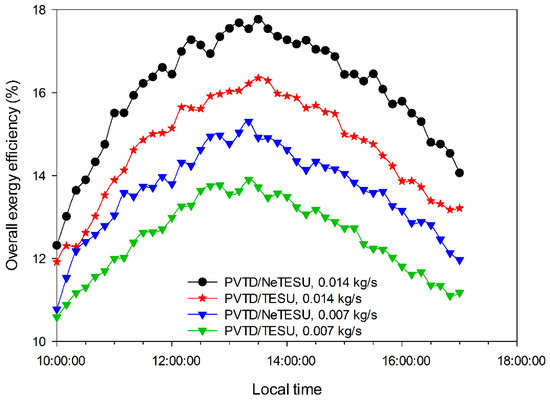
Figure 14.
Change in overall exergy efficiency values over local time.
Variation in exergetic efficiencies of the drying room over local time is depicted in Figure 15. Mean exergetic efficiency values of the drying room for PVTD/TESU and PVTD/NeTESU were found to be 51.29% and 54.26%, respectively, in the test performed at high velocity. In the survey conducted at low velocity, these values were attained as 48.33% and 49.85%, respectively. The exergetic efficiency of the drying room is related to inflow and outflow temperature values of the drying room. In the first step of the dehumidification process, the temperature difference of the dryer was high because of the high water content of the product at the initial stage. Therefore, the exergetic efficiency value of the drying room was lower at the beginning stage of the process. In the last step of the process, the water content of the drying product is lower in comparison to the initial stage, and the inlet and outlet temperature values are close to one other, which allows us to achieve a superior exergy efficiency value. The main reason for this issue is the reduction in the difference between outflow and inflow temperature values of the drying chamber. Kesavan et al. [89] analyzed a solar dehumidifying application and found an exergy yield of the drying room between 3 and 87%. Additionally, Panwar [90] analyzed the exergy yield of the drying room of a solar dehumification system and obtained a value between 23 and 73%. In a different research, Karthikeyan and Murugavelh [91] surveyed a tunnel dehumidifier and attained an exergy yield of the drying room in the range of 23–73%. Moreover, similar behavior for the drying room’s exergy efficiency can be found in some recent studies that analyzed various solar drying systems [62,92,93,94,95].
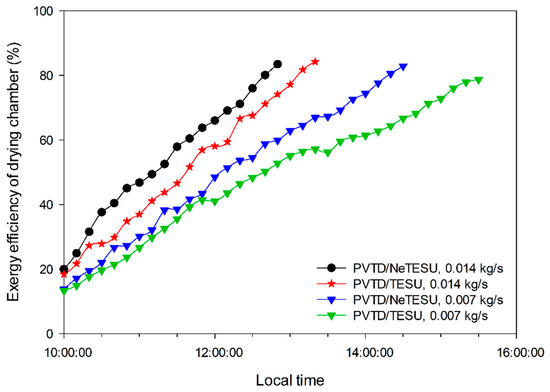
Figure 15.
Change in exergy yield of drying chamber over time.
Time-dependent variation in the sustainability index and waste exergy ratio values are given in Figure 16 and Figure 17, respectively. In the dehumidifying test performed at low velocity, the obtained mean SI values for PVTD/TESU and PVTD/NeTESU are 2.57 and 2.64, respectively. Mean SI values of the drying chamber for PVTD/TESU and PVTD/NeTESU were calculated as 2.2% and 2.44, respectively, at low velocity. In addition, average WER metrics for PVTD/TESU and PVTD/NeTESU were achieved between 0.48 and 0.51 and 0.45 and 0.50, respectively. While the highest SI value was found in the nano-enhanced system at a high air flow rate, the WER value obtained was the lowest. Similar values were observed in some studies that analyzed solar dehumidifying processes available in academic literature. Ndukwu et al. [96] analyzed a hybrid dehumidificator and obtained SI and WER values between 2.3 and 6.11 and 0.05 and 0.94, respectively. Akpinar [97] analyzed the pepper drying process in a solar dehumidifier and attained an SI between 0.39 and 6.16. In a different work, Mugi and Chandramohan [62] designed and experimentally tested an indirect solar dryer and attained SI and WER values between 3.69 and 5.1 and 0.41 and 0.44, respectively.
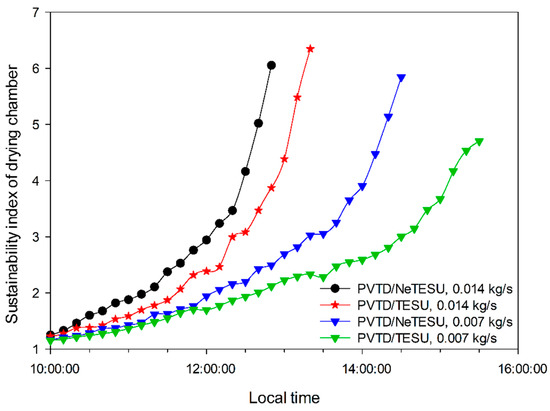
Figure 16.
Change in SI values of drying chamber over time.
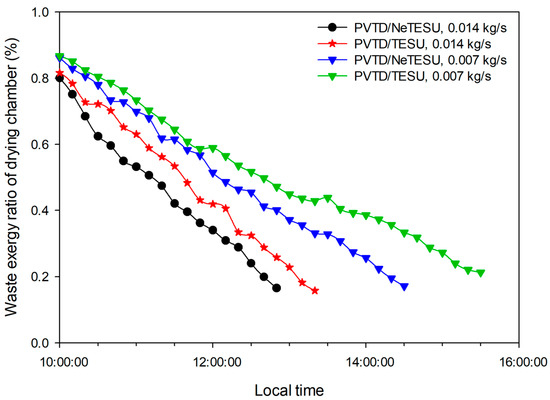
Figure 17.
Change in WER values of drying chamber over time.
Photographs of undried and dried samples are presented in Figure 18. Additionally, results of the present study were compared with similar papers that analyzed different types of solar dehumidificators as shown in Table 3. As it clearly seen, attained results in the current work are quite comparable with similar papers. It should be indicated that selected studies for comparing the obtained results were operated at similar flow rate values.
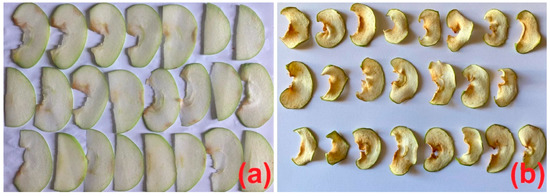
Figure 18.
Photographs of fresh and dried samples: (a) fresh samples, (b) dried samples.
Table 3.
Comparison of attained results with similar works in academic literature.
5.2. System Identification Results
The model coefficients for the analyzed systems are presented in Table 4. To assess the model quality, residual analysis is used. The whiteness test and the independence test are considered. In the first test, the residual autocorrelation function lies inside the confidence interval, and it shows the uncorrelated residuals. In the second test, the correlation of the residuals with past inputs is performed, and for a good model, it should be uncorrelated. The autocorrelation of the residuals and cross correlation between the input and output data set for channels and are shown in Figure 19. These can be used for assessment of model quality. The residual autocorrelation function lies within the confidence interval for a good model, and it shows that the residuals are uncorrelated.
Table 4.
Model coefficients for the analyzed PVTD systems.
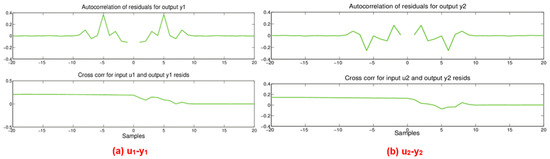
Figure 19.
Autocorrelation of the residuals and crosscorrelation of the residuals with the input for two different channels; u1-y1 (a), u2-y2 (b).
Further assessment of model quality can be achieved by using the fit values, which are given as
where and are the experimental data and identified model data, respectively. The model fits to the data set for the energy and exergy efficiency values of the MIMO model are shown in Figure 20. The dynamic characteristics of the efficiencies for the base and nano-enhanced system are very well captured with the MIMO dynamic system. The fits between the experimental data and dynamic model are above 85%.
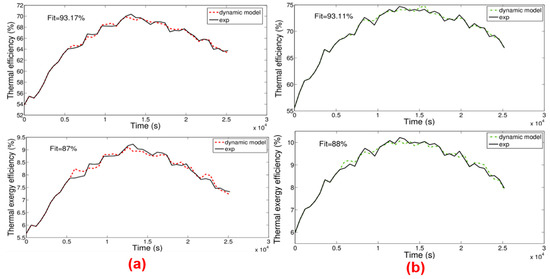
Figure 20.
Comparison of empirical and dynamic model efficiency values of collectors: (a) PVTD-TESU, (b) PVTD-NeTESU.
6. Conclusions
In this work, two hybrid PVT air collectors with different types of (paraffin-based and nano-doped paraffin-based) thermal energy storage units have been designed, fabricated and experimentally surveyed in a drying application. The main findings of the current survey are listed as below:
- The drying time was decreased by 5–22% by employing a nano-integrated thermal storage unit.
- The mean electrical efficiency was raised by 22.32% by upgrading the air velocity and adding nano-sized particles into the thermal storage unit.
- By using nanoparticles in the TESU, the overall energetic efficiency values of the PVT air collector were improved by 6.91% and 6.97%, respectively, in the tests performed at higher and lower flow rates. Both modifying the TESU with nanoparticles and enhancing the flow rate improved the overall energetic efficiency by 40.07%.
- The total exergy efficiencies for the PVT collector with TESU and PVT air collector with NeTESU were obtained in the ranges of 12.49–14.67% and 13.64–16.06%, respectively. In addition, mean electrical exergy yield values were achieved as 6.68% and 7.06%, respectively, in the test performed at a higher velocity value.
- The average sustainability index and waste exergy ratio of the drying chamber for PVTD/TESU were found to be between 2.26 and 2.57 and 0.48 and 0.51, respectively. These values for PVTD/NeTESU were obtained as 2.44–2.64 and 0.45–0.50, respectively.
- A multi-input multi-output dynamic model was obtained by using the system identification method for the developed PVT collectors considering energetic and exergetic efficiencies as multiple outputs of systems. The dynamic characteristics of the systems were well captured with dynamic models, and a modeling accuracy above 85% was achieved.
The findings of this work indicated that modifying the thermal energy storage component with nano additives significantly upgraded the electrical, thermal and drying effectiveness of a PVT air collector based indirect solar drying system. Moreover, future studies can include investigations of the effect of different types of nanoadditive modifications in the thermal storage component on the effectiveness of the PVT air collector and the solar drying system. Additionally, various nanoparticle concentration ratios can be tested to determine the optimum configuration. It should be indicated that the present work contains pilot-scale PVT drying systems. For real-time applications, various size arrangements, load capacities and nanoparticle ratios should be analyzed in detail. To improve the performance of the modeling, nonlinear system identification with different model structures can be considered.
Author Contributions
Conceptualization, C.Ş. and F.S..; methodology, C.Ş. and F.S.; software; C.Ş., F.S. and H.F.Ö.; validation, C.Ş., F.S. and H.F.Ö.; formal analysis, C.Ş., F.S. and H.F.Ö.; investigation, C.Ş.; data curation, C.Ş. and F.S..; writing—original draft preparation, C.Ş., F.S. and H.F.Ö.; writing—review and editing, C.Ş., F.S. and H.F.Ö.; visualization, C.Ş. and F.S.; supervision, F.S. All authors have read and agreed to the published version of the manuscript.
Funding
This work was supported by the Scientific Research Project Coordination Unit (BAP) of Manisa Celal Bayar University under grant no. 2020-088, which is gratefully acknowledged.
Institutional Review Board Statement
Not applicable.
Informed Consent Statement
Not applicable.
Data Availability Statement
Not applicable.
Acknowledgments
This work was supported by the Scientific Research Project Coordination Unit (BAP) of Manisa Celal Bayar University under grant no. 2020-088, which is gratefully acknowledged.
Conflicts of Interest
The authors declare no conflict of interest.
Nomenclature
| area (m2) | |
| specific heat capacity (kJ·kg−1·K−1) | |
| hydraulic diameter of the air channel (m) | |
| drying rate (gwater.gdry matter−1·min−1) | |
| energy (W) | |
| exergy (W) | |
| solar irradiation intensity (W·m−2) | |
| effective solar irradiance (W) | |
| heat transfer coefficient (W·m−2·K−1) | |
| enthalpy (kJ·kg−1) | |
| electrical current (A) | |
| conductivity (W·m−1·K−1) | |
| moisture ratio (%) | |
| mass flow rate (kg·s−1) | |
| Nusselt number | |
| electrical power (W) | |
| the function uncertainty | |
| Reynolds number | |
| entropy (kJ·kg−1·K−1) | |
| temperature (°C) | |
| electrical voltage (V) | |
| uncertainty values in the independent metrics | |
| total uncertainty (%) | |
| moisture content (gwater/gdry matter) | |
| initial moisture content (gwater/gdry matter) | |
| final dry weight (g) | |
| moisture content on dry basis (gwater/gdry matter) | |
| equilibrium moisture content (gwater/gdry matter) | |
| beginning wet weight (g) | |
| moisture content at time “t” (gwater/gdry matter) | |
| moisture content at time “t + dt” (gwater/gdry matter) | |
| Greek symbols | |
| autoregressive with exogenous input | |
| fill factor | |
| finite impulse response | |
| multi-input multi-output | |
| output error | |
| performance ratio | |
| photovoltaic thermal collector | |
| sustainability index | |
| transmission electron microscopy | |
| X-ray diffraction | |
| waste exergy ratio | |
| Greek letters | |
| absorptivity | |
| air velocity (m·s−1) | |
| transmissivity | |
| density (kg·m−3) | |
| viscosity (Pa·s) | |
| stream exergy | |
| electrical efficiency (%) | |
| normalized power output efficiency (%) | |
| thermal efficiency (%) | |
| exergy efficiency (%) | |
| Subscripts | |
| a | ambient |
| ai | air |
| c | convection |
| d | destruction |
| dc | drying chamber |
| e | effective |
| el | electrical |
| f | friction |
| i | inflow |
| l | loss |
| m | mass |
| mx | maximum |
| ms | measured |
| o | outflow |
| ov | total |
| r | radiation |
| stc | standard test conditions |
| t | thermal |
References
- Li, G. Sensible heat thermal storage energy and exergy performance evaluations. Renew. Sustain. Energy Rev. 2016, 53, 897–923. [Google Scholar] [CrossRef]
- Sezen, K.; Tuncer, A.D.; Akyuz, A.O.; Gungor, A. Effects of ambient conditions on solar assisted heat pump systems: A review. Sci. Total Environ. 2021, 778, 146362. [Google Scholar] [CrossRef]
- Ali, H.M. Recent advancements in PV cooling and efficiency enhancement integrating phase change materials based systems—A comprehensive review. Sol. Energy 2020, 197, 163–198. [Google Scholar] [CrossRef]
- Oztop, H.F.; Bayrak, F.; Hepbasli, A. Energetic and exergetic aspects of solar air heating (solar collector) systems. Renew. Sustain. Energy Rev. 2013, 21, 59–83. [Google Scholar] [CrossRef]
- Bayrak, F.; Oztop, H.F.; Selimefendigil, F. Effects of different fin parameters on temperature and efficiency for cooling of photovoltaic panels under natural convection. Sol. Energy 2019, 188, 484–494. [Google Scholar] [CrossRef]
- Khanlari, A.; Güler H, Ö.; Tuncer, A.D.; Şirin, C.; Bilge, Y.C.; Yılmaz, Y.; Güngör, A. Experimental and numerical study of the effect of integrating plus-shaped perforated baffles to solar air collector in drying application. Renew. Energy 2020, 145, 1677–1692. [Google Scholar] [CrossRef]
- Fan, W.; Kokogiannakis, G.; Ma, Z. A multi-objective design optimisation strategy for hybrid photovoltaic thermal collector (PVT)-solar air heater (SAH) systems with fins. Sol. Energy 2018, 163, 315–328. [Google Scholar] [CrossRef]
- Fudholi, A.; Zohri, M.; Rukman NS, B.; Nazri, N.S.; Mustapha, M.; Yen, C.H.; Mohammad, M.; Sopian, K. Exergy and sustainability index of photovoltaic thermal (PVT) air collector: A theoretical and experimental study. Renew. Sustain. Energy Rev. 2019, 100, 44–51. [Google Scholar] [CrossRef]
- Li, G.; Hwang, Y.; Radermacher, R. Cold thermal energy storage materials and applications toward sustainability. In Energy Solutions to Combat Global Warming; Springer: Cham, Switzerland, 2017; pp. 67–117. [Google Scholar]
- Li, G. Energy and exergy performance assessments for latent heat thermal energy storage systems. Renew. Sustain. Energy Rev. 2015, 51, 926–954. [Google Scholar] [CrossRef]
- Li, G.; Zheng, X. Thermal energy storage system integration forms for a sustainable future. Renew. Sustain. Energy Rev. 2016, 62, 736–757. [Google Scholar] [CrossRef]
- Tuncer, A.D.; Khanlari, A.; Aytaç, İ.; Çiftçi, E.; Sözen, A.; Variyenli H, İ. Passive thermal management of photovoltaic panel by using phase change material-filled aluminum cans: An experimental study. Heat Transf. Res. 2022, 53, 73–86. [Google Scholar] [CrossRef]
- Fiorentini, M.; Cooper, P.; Ma, Z.; Robinson, D.A. Hybrid model predictive control of a residential HVAC system with PVT energy generation and PCM thermal storage. Energy Procedia 2015, 83, 21–30. [Google Scholar] [CrossRef]
- Ahmadi, R.; Monadinia, F.; Maleki, M. Passive/active photovoltaic-thermal (PVT) system implementing infiltrated phase change material (PCM) in PS-CNT foam. Sol. Energy Mater. Sol. Cells 2021, 222, 110942. [Google Scholar] [CrossRef]
- Carmona, M.; Bastos, A.P.; García, J.D. Experimental evaluation of a hybrid photovoltaic and thermal solar energy collector with integrated phase change material (PVT-PCM) in comparison with a traditional photovoltaic (PV) module. Renew. Energy 2021, 172, 680–696. [Google Scholar] [CrossRef]
- Fu, Z.; Liang, X.; Li, Y.; Li, L.; Zhu, Q. Performance improvement of a PVT system using a multilayer structural heat exchanger with PCMs. Renew. Energy 2021, 169, 308–317. [Google Scholar] [CrossRef]
- Li, G.; Hwang, Y.; Radermacher, R. Review of cold storage materials for air conditioning application. Int. J. Refrig. 2012, 35, 2053–2077. [Google Scholar] [CrossRef]
- Li, G.; Hwang, Y.; Radermacher, R.; Chun, H.H. Review of cold storage materials for subzero applications. Energy 2013, 51, 1–17. [Google Scholar] [CrossRef]
- Al-Waeli, A.H.; Chaichan, M.T.; Sopian, K.; Kazem, H.A.; Mahood, H.B.; Khadom, A.A. Modeling and experimental validation of a PVT system using nanofluid coolant and nano-PCM. Sol. Energy 2019, 177, 178–191. [Google Scholar] [CrossRef]
- Kazemian, A.; Khatibi, M.; Maadi, S.R.; Ma, T. Performance optimization of a nanofluid-based photovoltaic thermal system integrated with nano-enhanced phase change material. Appl. Energy 2021, 295, 116859. [Google Scholar] [CrossRef]
- Manigandan, S.; Kumar, V. Comparative study to use nanofluid ZnO and CuO with phase change material in photovoltaic thermal system. Int. J. Energy Res. 2019, 43, 1882–1891. [Google Scholar] [CrossRef]
- Siahkamari, L.; Rahimi, M.; Azimi, N.; Banibayat, M. Experimental investigation on using a novel phase change material (PCM) in micro structure photovoltaic cooling system. Int. Commun. Heat Mass Transf. 2019, 100, 60–66. [Google Scholar] [CrossRef]
- Veeramanipriya, E.; Sundari, A.R.U. Performance evaluation of hybrid photovoltaic thermal (PVT) solar dryer for drying of cassava. Sol. Energy 2021, 215, 240–251. [Google Scholar] [CrossRef]
- Tiwari, S.; Tiwari, G.N.; Al-Helal, I.M. Performance analysis of photovoltaic–thermal (PVT) mixed mode greenhouse solar dryer. Sol. Energy 2016, 133, 421–428. [Google Scholar] [CrossRef]
- Mortezapour, H.; Ghobadian, B.; Minaei, S.; Khoshtaghaza, M.H. Saffron drying with a heat pump–assisted hybrid photovoltaic–thermal solar dryer. Dry. Technol. 2012, 30, 560–566. [Google Scholar] [CrossRef]
- Nayak, S.; Kumar, A.; Mishra, J.; Tiwari, G.N. Drying and testing of mint (Mentha piperita) by a hybrid photovoltaic-thermal (PVT)-based greenhouse dryer. Dry. Technol. 2011, 29, 1002–1009. [Google Scholar] [CrossRef]
- Tiwari, S.; Tiwari, G.N. Energy and exergy analysis of a mixed-mode greenhouse-type solar dryer, integrated with partially covered N-PVT air collector. Energy 2017, 128, 183–195. [Google Scholar] [CrossRef]
- Çiftçi, E.; Khanlari, A.; Sözen, A.; Aytaç, İ.; Tuncer, A.D. Energy and exergy analysis of a photovoltaic thermal (PVT) system used in solar dryer: A numerical and experimental investigation. Renew. Energy 2021, 180, 410–423. [Google Scholar] [CrossRef]
- Gupta, A.; Das, B.; Biswas, A.; Mondol, J.D. Sustainability and 4E analysis of novel solar photovoltaic-thermal solar dryer under forced and natural convection drying. Renew. Energy 2022, 188, 1008–1021. [Google Scholar] [CrossRef]
- Tiwari, S.; Sahdev, R.K.; Kumar, M.; Chhabra, D.; Tiwari, P.; Tiwari, G.N. Environmental and economic sustainability of PVT drying system: A heat transfer approach. Environ. Prog. Sustain. Energy 2021, 40, e13535. [Google Scholar] [CrossRef]
- Gupta, A.; Biswas, A.; Das, B.; Reddy, B.V. Development and testing of novel photovoltaic-thermal collector-based solar dryer for green tea drying application. Sol. Energy 2022, 231, 1072–1091. [Google Scholar] [CrossRef]
- Hao, W.; Zhang, H.; Liu, S.; Lai, Y. Design and prediction method of dual working medium solar energy drying system. Appl. Therm. Eng. 2021, 195, 117153. [Google Scholar] [CrossRef]
- Gürel, A.E.; Ağbulut, Ü.; Ergün, A.; Ceylan, İ.; Sözen, A.; Tuncer, A.D.; Khanlari, A. A detailed investigation of the temperature-controlled fluidized bed solar dryer: A numerical, experimental, and modeling study. Sustain. Energy Technol. Assess. 2022, 49, 101703. [Google Scholar] [CrossRef]
- Kırbaş, İ.; Tuncer, A.D.; Şirin, C.; Usta, H. Modeling and developing a smart interface for various drying methods of pomelo fruit (Citrus maxima) peel using machine learning approaches. Comput. Electron. Agric. 2019, 165, 104928. [Google Scholar] [CrossRef]
- Dhalsamant, K. Development, validation, and comparison of FE modeling and ANN model for mixed-mode solar drying of potato cylinders. J. Food Sci. 2021, 86, 3384–3402. [Google Scholar] [CrossRef]
- Abdenouri, N.; Zoukit, A.; Salhi, I.; Doubabi, S. Model identification and fuzzy control of the temperature inside an active hybrid solar indirect dryer. Sol. Energy 2022, 231, 328–342. [Google Scholar] [CrossRef]
- Selimefendigil, F.; Şirin, C. Energy and exergy analysis of a hybrid photovoltaic/thermal-air collector modified with nano-enhanced latent heat thermal energy storage unit. J. Energy Storage 2022, 45, 103467. [Google Scholar] [CrossRef]
- Selimefendigil, F.; Şirin, C.; Ghachem, K.; Kolsi, L. Exergy and environmental analysis of an active greenhouse dryer with Al2O3 nano-embedded latent heat thermal storage system: An experimental study. Appl. Therm. Eng. 2022, 217, 119167. [Google Scholar] [CrossRef]
- Loni, R.; Asli-Ardeh, E.A.; Ghobadian, B.; Najafi, G.; Bellos, E. Effects of size and volume fraction of alumina nanoparticles on the performance of a solar organic Rankine cycle. Energy Convers. Manag. 2019, 182, 398–411. [Google Scholar] [CrossRef]
- Schuller, M.; Shao, Q.; Lalk, T. Experimental investigation of the specific heat of a nitrate–alumina nanofluid for solar thermal energy storage systems. Int. J. Therm. Sci. 2015, 91, 142–145. [Google Scholar] [CrossRef]
- Mondragón, R.; Sánchez, D.; Cabello, R.; Llopis, R.; Juliá, J.E. Flat plate solar collector performance using alumina nanofluids: Experimental characterization and efficiency tests. PLoS ONE 2019, 14, e0212260. [Google Scholar] [CrossRef]
- Malik, D.R. Evaluation of Composite Alumina Nanoparticle and Nitrate Eutectic Materials for Use in Concentrating Solar Power Plants. Ph.D. Thesis, Texas A & M University, College Station, TX, USA, 2010. [Google Scholar]
- Kanti, P.K.; Chereches, E.I.; Minea, A.A.; Sharma, K.V. Experiments on thermal properties of ionic liquid enhanced with alumina nanoparticles for solar applications. J. Therm. Anal. Calorim. 2022, 147, 13027–13038. [Google Scholar] [CrossRef]
- Tariq, S.L.; Ali, H.M.; Akram, M.A.; Janjua, M.M.; Ahmadlouydarab, M. Nanoparticles enhanced Phase Change Materials (NePCMs)-A Recent Review. Appl. Therm. Eng. 2020, 176, 115305. [Google Scholar] [CrossRef]
- Al-Waeli, A.H.A.; Sopian, K.; Chaichan, M.T.; Kazem, H.A.; Ibrahim, A.; Mat, S.; Ruslan, M.H. Evaluation of the nanofluid and nano-PCM based photovoltaic thermal (PVT) system: An experimental study. Energy Convers. Manag. 2017, 151, 693–708. [Google Scholar] [CrossRef]
- Singh, D.K.; Suresh, S.; Singh, H.; Rose, B.A.J.; Tassou, S.; Anantharaman, N. Myoinositol based nano-PCM for solar thermal energy storage. Appl. Therm. Eng. 2017, 110, 564–572. [Google Scholar] [CrossRef]
- Teng, T.P.; Yu, C.C. Characteristics of phase-change materials containing oxide nano-additives for thermal storage. Nanoscale Res. Lett. 2012, 7, 611. [Google Scholar] [CrossRef] [PubMed]
- Karaağaç, M.O.; Ergün, A.; Ağbulut, Ü.; Gürel, A.E.; Ceylan, İ. Experimental analysis of CPV/T solar dryer with nano-enhanced PCM and prediction of drying parameters using ANN and SVM algorithms. Sol. Energy 2021, 218, 57–67. [Google Scholar] [CrossRef]
- Ansari, S.A.; Husain, Q. Immobilization of Kluyveromyces lactis β galactosidase on concanavalin A layered aluminium oxide nanoparticles—Its future aspects in biosensor applications. J. Mol. Catal. B Enzym. 2011, 70, 119–126. [Google Scholar] [CrossRef]
- Khanlari, A.; Sözen, A.; Afshari, F.; Tuncer, A.D. Energy-exergy and sustainability analysis of a PV-driven quadruple-flow solar drying system. Renew. Energy 2021, 175, 1151–1166. [Google Scholar] [CrossRef]
- Afshari, F.; Tuncer, A.D.; Sözen, A.; Çiftçi, E.; Khanlari, A. Experimental and numerical analysis of a compact indirect solar dehumidification system. Sol. Energy 2021, 226, 72–84. [Google Scholar] [CrossRef]
- Kazemian, A.; Taheri, A.; Sardarabadi, A.; Ma, T.; Passandideh-Fard, M.; Peng, J. Energy, exergy and environmental analysis of glazed and unglazed PVT system integrated with phase change material: An experimental approach. Sol. Energy 2020, 201, 178–189. [Google Scholar] [CrossRef]
- Zare, D.; Minaei, S.; Zadeh, M.M.; Khoshtaghaza, M.H. Computer simulation of rough rice drying in a batch dryer. Energy Convers. Manag. 2006, 47, 3241–3254. [Google Scholar] [CrossRef]
- Granstrom, M.; Petritsch, K.; Arias, A.C.; Lux, A.; Andersson, M.R.; Friend, R.H. Laminated fabrication of polymeric photovoltaic diodes. Nature 1998, 395, 257–260. [Google Scholar] [CrossRef]
- Abuşka, M.; Şevik, S. Energy, exergy, economic and environmental (4E) analyses of flat-plate and V-groove solar air collectors based on aluminium and copper. Sol. Energy 2017, 158, 259–277. [Google Scholar] [CrossRef]
- Wongwuttanasatian, T.; Sarikarin, T.; Suksri, A. Performance enhancement of a photovoltaic module by passive cooling using phase change material in a finned container heat sink. Sol. Energy 2020, 195, 47–53. [Google Scholar] [CrossRef]
- Sardarabadi, M.; Hosseinzadeh, M.; Kazemian, A.; Passandideh-Fard, M. Experimental investigation of the effects of using metal-oxides/water nanofluids on a photovoltaic thermal system (PVT) from energy and exergy viewpoints. Energy 2017, 138, 682–695. [Google Scholar] [CrossRef]
- Park, S.R.; Pandey, A.K.; Tyagi, V.V.; Tyagi, S.K. Energy and exergy analysis of typical renewable energy systems. Renew. Sustain. Energy Rev. 2014, 30, 105–123. [Google Scholar] [CrossRef]
- Chow, T.T.; Pei, G.; Fong, K.F.; Lin, Z.; Chan AL, S.; Ji, J. Energy and exergy analysis of photovoltaic–thermal collector with and without glass cover. Appl. Energy 2009, 86, 310–316. [Google Scholar] [CrossRef]
- Kuzgunkaya, E.H.; Hepbasli, A. Exergetic evaluation of drying of laurel leaves in a vertical ground-source heat pump drying cabinet. Int. J. Energy Res. 2007, 31, 245–258. [Google Scholar] [CrossRef]
- Akpinar, E.K. Drying of mint leaves in a solar dryer and under open sun: Modelling, performance analyses. Energy Convers. Manag. 2010, 51, 2407–2418. [Google Scholar] [CrossRef]
- Mugi, V.R.; Chandramohan, V.P. Energy and exergy analysis of forced and natural convection indirect solar dryers: Estimation of exergy inflow, outflow, losses, exergy efficiencies and sustainability indicators from drying experiments. J. Clean. Prod. 2021, 282, 124421. [Google Scholar] [CrossRef]
- Ghasemkhani, H.; Keyhani, A.; Aghbashlo, M.; Rafiee, S.; Mujumdar, A.S. Improving exergetic performance parameters of a rotating-tray air dryer via a simple heat exchanger. Appl. Therm. Eng. 2016, 94, 13–23. [Google Scholar] [CrossRef]
- Kumar, R.; Praveen, P.; Gupta, S.; Saikiran, J.; Bharj, R.S. Performance evaluation of photovoltaic module integrated with phase change material-filled container with external fins for extremely hot climates. J. Energy Storage 2020, 32, 101876. [Google Scholar] [CrossRef]
- Selimefendigil, F.; Şirin, C.; Öztop, H.F. Improving the performance of an active greenhouse dryer by integrating a solar absorber north wall coated with graphene nanoplatelet-embedded black paint. Sol. Energy 2022, 231, 140–148. [Google Scholar] [CrossRef]
- Ceylan, İ.; Gürel, A.E. Solar-assisted fluidized bed dryer integrated with a heat pump for mint leaves. Appl. Therm. Eng. 2016, 106, 899–905. [Google Scholar] [CrossRef]
- Tuncer, A.D.; Sözen, A.; Afshari, F.; Khanlari, A.; Şirin, C.; Gungor, A. Testing of a novel convex-type solar absorber drying chamber in dehumidification process of municipal sewage sludge. J. Clean. Prod. 2020, 272, 122862. [Google Scholar] [CrossRef]
- Selimefendigil, F.; Şirin, C. Experimental investigation of a parabolic greenhouse dryer improved with copper oxide nano-enhanced latent heat thermal energy storage unit. Int. J. Energy Res. 2022, 46, 3647–3662. [Google Scholar] [CrossRef]
- Kalogirou, S.A. Applications of artificial neural-networks for energy systems. Appl. Energy 2020, 67, 17–35. [Google Scholar] [CrossRef]
- Mellit, A.; Kalogirou, S.A. ANFIS-based modelling for photovoltaic power supply system: A case study. Renew. Energy 2011, 36, 250–258. [Google Scholar] [CrossRef]
- Varol, Y.; Koca, A.; Oztop, H.F.; Avci, E. Forecasting of thermal energy storage performance of Phase Change Material in a solar collector using soft computing techniques. Expert Syst. Appl. 2010, 37, 2724–2732. [Google Scholar] [CrossRef]
- Voyant, C.; Notton, G.; Kalogirou, S.; Nivet, M.L.; Paoli, C.; Motte, F.; Fouilloy, A. Machine learning methods for solar radiation forecasting: A review. Renew. Energy 2017, 105, 569–582. [Google Scholar] [CrossRef]
- Selimefendigil, F.; Oztop, H.F. Identification of pulsating flow effects with CNT nanoparticles on the performance enhancements of thermoelectric generator (TEG) module in renewable energy applications. Renew. Energy 2020, 162, 1076–1086. [Google Scholar] [CrossRef]
- Ljung, L. Perspectives on system identification. Annu. Rev. Control. 2010, 34, 1–12. [Google Scholar] [CrossRef]
- Giannakis, G.B.; Serpedin, E. A bibliography on nonlinear system identification. Signal Process. 2001, 81, 533–580. [Google Scholar] [CrossRef]
- Selimefendigil, F.; Sujith, R.I.; Polifke, W. Identification of heat transfer dynamics for non-modal analysis of thermoacoustic stability. Appl. Math. Comput. 2011, 217, 5134–5150. [Google Scholar] [CrossRef]
- Chaibi, Y.; Malvoni, M.; El Rhafiki, T.; Kousksou, T.; Zeraouli, Y. Artificial neural-network based model to forecast the electrical and thermal efficiencies of PVT air collector systems. Clean. Eng. Technol. 2021, 4, 100132. [Google Scholar] [CrossRef]
- Widyolar, B.; Jiang, L.; Brinkley, J.; Hota, S.K.; Ferry, J.; Diaz, G.; Winston, R. Experimental performance of an ultra-low-cost solar photovoltaic-thermal (PVT) collector using aluminum minichannels and nonimaging optics. Appl. Energy 2020, 268, 114894. [Google Scholar] [CrossRef]
- Gholampour, M.; Ameri, M.; Sheykh Samani, M. Experimental study of performance of Photovoltaic–Thermal Unglazed Transpired Solar Collectors (PV/UTCs): Energy, exergy, and electrical-to-thermal rational approaches. Sol. Energy 2014, 110, 636–647. [Google Scholar] [CrossRef]
- Tiwari, A.; Dubey, S.; Sandhu, G.S.; Sodha, M.S.; Anwar, S.I. Exergy analysis of integrated photovoltaic thermal solar water heater under constant flow rate and constant collection temperature modes. Appl. Energy 2009, 86, 2592–2597. [Google Scholar] [CrossRef]
- Evola, G.; Marletta, L. Exergy and thermoeconomic optimization of a water-cooled glazed hybrid photovoltaic/thermal (PVT) collector. Sol. Energy 2014, 107, 12–25. [Google Scholar] [CrossRef]
- Khanna, S.; Reddy, K.S.; Mallick, T.K. Effect of climate on electrical performance of finned phase change material integrated solar photovoltaic. Sol. Energy 2018, 174, 593–605. [Google Scholar] [CrossRef]
- Velmurugan, K.; Karthikeyan, V.; Korukonda, T.B.; Poongavanam, P.; Nadarajan, S.; Kumarasamy, S.; Wongwuttanasatian, T.; Sandeep, D. Experimental studies on photovoltaic module temperature reduction using eutectic cold phase change material. Sol. Energy 2020, 209, 302–315. [Google Scholar] [CrossRef]
- Téllez, M.C.; Figueroa, I.P.; Téllez, B.C.; Vidaña, E.C.L.; Ortiz, A.L. Solar drying of Stevia (Rebaudiana bertoni) leaves using direct and indirect technologies. Sol. Energy 2018, 159, 898–907. [Google Scholar] [CrossRef]
- Lakshmi, D.V.N.; Muthukumar, P.; Layek, A.; Nayak, P.K. Performance analyses of mixed mode forced convection solar dryer for drying of stevia leaves. Sol. Energy 2019, 188, 507–518. [Google Scholar] [CrossRef]
- Lakshmi, D.V.N.; Muthukumar, P.; Nayak, P.K. Experimental investigations on active solar dryers integrated with thermal storage for drying of black pepper. Renew. Energy 2021, 167, 728–739. [Google Scholar] [CrossRef]
- Nayak, S.; Tiwari, G.N. Energy and exergy analysis of photovoltaic/thermal integrated with a solar greenhouse. Energy Build. 2008, 40, 2015–2021. [Google Scholar] [CrossRef]
- Jahromi, S.N.; Vadiee, A.; Yaghoubi, M. Exergy and economic evaluation of a commercially available PV/T collector for different climates in Iran. Energy Procedia 2015, 75, 444–456. [Google Scholar] [CrossRef]
- Kesavan, S.; Arjunan, T.V.; Vijayan, S. Thermodynamic analysis of a triple-pass solar dryer for drying potato slices. J. Therm. Anal. Calorim. 2019, 136, 159–171. [Google Scholar] [CrossRef]
- Panwar, N.L. Experimental investigation on energy and exergy analysis of coriander (Coriadrum sativum L.) leaves drying in natural convection solar dryer. Appl. Sol. Energy 2014, 50, 133–137. [Google Scholar] [CrossRef]
- Karthikeyan, A.K.; Murugavelh, S. Thin layer drying kinetics and exergy analysis of turmeric (Curcuma longa) in a mixed mode forced convection solar tunnel dryer. Renew. Energy 2018, 128, 305–312. [Google Scholar] [CrossRef]
- Madhankumar, S.; Viswanathan, K.; Wu, W. Energy, exergy and environmental impact analysis on the novel indirect solar dryer with fins inserted phase change material. Renew. Energy 2021, 176, 280–294. [Google Scholar] [CrossRef]
- Tagnamas, Z.; Lamsyehe, H.; Moussaoui, H.; Bahammou, Y.; Kouhila, M.; Idlimam, A.; Lamharrar, A. Energy and exergy analyses of carob pulp drying system based on a solar collector. Renew. Energy 2021, 163, 495–503. [Google Scholar] [CrossRef]
- Bhardwaj, A.K.; Kumar, R.; Kumar, S.; Goel, B.; Chauhan, R. Energy and exergy analyses of drying medicinal herb in a novel forced convection solar dryer integrated with SHSM and PCM. Sustain. Energy Technol. Assess. 2021, 45, 101119. [Google Scholar] [CrossRef]
- Rabha, D.K.; Muthukumar, P.; Somayaji, C. Energy and exergy analyses of the solar drying processes of ghost chilli pepper and ginger. Renew. Energy 2017, 105, 764–773. [Google Scholar] [CrossRef]
- Ndukwu, M.C.; Simo-Tagne, M.; Abam, F.I.; Onwuka, O.S.; Prince, S.; Bennamoun, L. Exergetic sustainability and economic analysis of hybrid solar-biomass dryer integrated with copper tubing as heat exchanger. Heliyon 2020, 6, e03401. [Google Scholar] [CrossRef] [PubMed]
- Akpinar, E.K. The effects of some exergetic indicators on the performance of thin layer drying process of long green pepper in a solar dryer. Heat Mass Tran. 2019, 55, 299–308. [Google Scholar] [CrossRef]
- Khanlari, A.; Afshari, F.; Sözen, A.; Tuncer, A.D.; Kusun, B. Numerical and experimental investigation of a solar absorber extension tube with turbulators for upgrading the performance of a solar dryer. Int. J. Numer. Methods Heat Fluid Flow 2022, 32, 3104–3131. [Google Scholar] [CrossRef]
- Eltawil, M.A.; Azam, M.M.; Alghannam, A.O. Solar PV powered mixed-mode tunnel dryer for drying potato chips. Renew. Energy 2018, 116, 594–605. [Google Scholar] [CrossRef]
- Rani, P.; Tripathy, P.P. Drying characteristics, energetic and exergetic investigation during mixed-mode solar drying of pineapple slices at varied air mass flow rates. Renew. Energy 2021, 167, 508–519. [Google Scholar] [CrossRef]


Disclaimer/Publisher’s Note: The statements, opinions and data contained in all publications are solely those of the individual author(s) and contributor(s) and not of MDPI and/or the editor(s). MDPI and/or the editor(s) disclaim responsibility for any injury to people or property resulting from any ideas, methods, instructions or products referred to in the content. |
© 2023 by the authors. Licensee MDPI, Basel, Switzerland. This article is an open access article distributed under the terms and conditions of the Creative Commons Attribution (CC BY) license (https://creativecommons.org/licenses/by/4.0/).