Article

Study on Temporal and Spatial Characteristics of Fuzhou Built-Up Area Based on Remote Sensing Data of Nighttime Light

1
College of Environment and Safety Engineering, Fuzhou University, Fuzhou 350108, China
2
The Academy of Digital China (Fujian), Fuzhou 350108, China
*
Author to whom correspondence should be addressed.
Sustainability 2023, 15(3), 2423; https://doi.org/10.3390/su15032423
Submission received: 12 December 2022 / Revised: 18 January 2023 / Accepted: 26 January 2023 / Published: 29 January 2023
(This article belongs to the Section Sustainable Urban and Rural Development)

Abstract

:
It is of great significance to grasp the spatio-temporal characteristics and expansion mechanism of urban built-up areas for formulating urban development strategy. This paper takes the built-up area of Fuzhou as the study area, uses multi-temporal Landsat images and remote sensing data of nighttime light (NTL) as the main data sources, and extracts the built-up area of NTL images with a higher spatial resolution comparison method. It discusses the development trends of the Fuzhou built-up area from 2000 to 2021 from the perspectives of temporal and spatial evolution characteristics and spatial morphology evolution and analyzes the relationship between population factors, economic factors, natural conditions, policy factors, and urban expansion. The results show that the urbanization level of Fuzhou is gradually improving, and the compounded nighttime light index (CNLI) increases from 0.0105 in 2000 to 0.0635 in 2021. The trend of expansion speed and expansion intensity is consistent, showing the changing trend of first fast and then slow, then accelerating and then slowing down. The expansion direction presents the trend of “expanding eastward, advancing southward and expanding westward”, the spatial form tends to be irregular, and the migration range of the center of gravity is not significant. Population factors, economic factors, and expansion are positively correlated and closely related, and natural conditions and policy guidance affect the direction and mode of the expansion of the built-up area. The above results indicate that the overall urban development of Fuzhou shows an upward trend, which is consistent with the planned urbanization development trend of Fuzhou.

1. Introduction

Urbanization refers to the phenomenon of population concentration in cities, which includes many aspects such as society, economy, and space [1]. The expansion of urban land is an important manifestation of urbanization, which brings about environmental pollution and imbalance in regional development while boosting regional economic development [2]. Therefore, in order to make rational use of resources and avoid a series of problems caused by urbanization, it is particularly important to analyze and study urban expansion.
The application of remote sensing technology to do urbanization research has greater advantages and convenience, making up for the disadvantage that statistical data are not conducive to dynamic monitoring. Nighttime light remote sensing can create a unique view centered on human activities and find potential patterns of human activities from it and has a wide range of applications in monitoring urbanization, mapping poverty, assessing light pollution, etc. [3,4,5]. In 1978, Croft [6] first used DMSP/OLS data to extract urban built-up areas and conducted a series of related studies, in which the NTL data needed to be corrected for processing. Ma et al. [7] evaluated four DMSP/OLS saturation correction methods and showed that the linear regression model and cubic regression model improved the correlation between NTL data and socioeconomic variables. Li and Zhou [8] proposed a stepwise calibration method to generate global DMSP/OLS time series data from 1992 to 2013, which maximized the global sum of NTL. Mukherjee et al. [9] proposed an algorithm for the inter-calibration of DMSP/OLS time series images using a semi-automatic PIF recognition procedure, which relied heavily on data and thus minimized human errors introduced by manual selection methods. However, due to the low spatial resolution, the accuracy of built-up areas extracted based on NTL data is average, and the detailed information on built-up areas is insufficient. Landsat image has a higher spatial resolution, and the accuracy of the built-up areas obtained is also higher, but it has the problem of “different spectra in the same thing and foreign bodies in the same spectrum”. Therefore, combining NTL data and Landsat images to extract built-up areas has outstanding advantages, which can not only remove the interference of bare land and small villages but also can obtain more accurate built-up area data and reduce the dependence on statistical data. Henderson et al. [10] used Landsat TM images to extract urban boundaries of San Francisco, Lhasa, and Beijing for the first time, and compared them with DMSP/OLS radiometric correction lighting data, reducing the dependence on statistical data and obtained higher accuracy results. Lan et al. [11] used multi-temporal Landsat data and NTL data to extract built-up areas and analyze the temporal and spatial dynamic changes in urban patterns in Guangxi. Mi et al. [12] used MODIS land cover data to help determine the scope of the central city. Pandey et al. [13] assessed urban growth in India based on DMSP and SPOT vegetation datasets. Li and Chen [14] evaluated the spatio-temporal development patterns of five urban clusters in China using NPP-VIIRS. Stokes and Seto [15] analyzed the spatial and temporal characteristics of India and the USA based on multi-temporal land, population, and NTL, and classified urban development types. The Vegetation Adjusted NTL Urban Index (VANUI), based on MODIS and DMSP/OLS, can be used to study the characteristics and structure of the city [16]. Zheng et al. [17] used the enhanced nighttime light urban index (ENUI) combining NPP-VIIRS data and Landsat images to extract urban areas and to analyze the characteristics of urban expansion in the Guangdong–Hong Kong–Macao Greater Bay Area.
Based on NTL data and Landsat images, this paper studies the spatial and temporal characteristics of the Fuzhou built-up area from 2000 to 2021 and tries to analyze the relationship between NTL data and the socio-economic development in this region. It can reveal the development characteristics and driving mechanisms of urban expansion in Fuzhou, deepen the understanding of the laws of human activities, and thus provide efficient auxiliary decision-making for urban planning, which is very important for urban development and coordinated regional development.
The structure of this paper is as follows: the second part shows the pre-processing process of different types of remote sensing data and their results; the third part is the research methods adopted in this paper; the fourth part is the experimental results and analysis; the fifth part discusses the influence factors and driving factors on urban expansion; the sixth part is the conclusion.

2. Study Area and Dataset
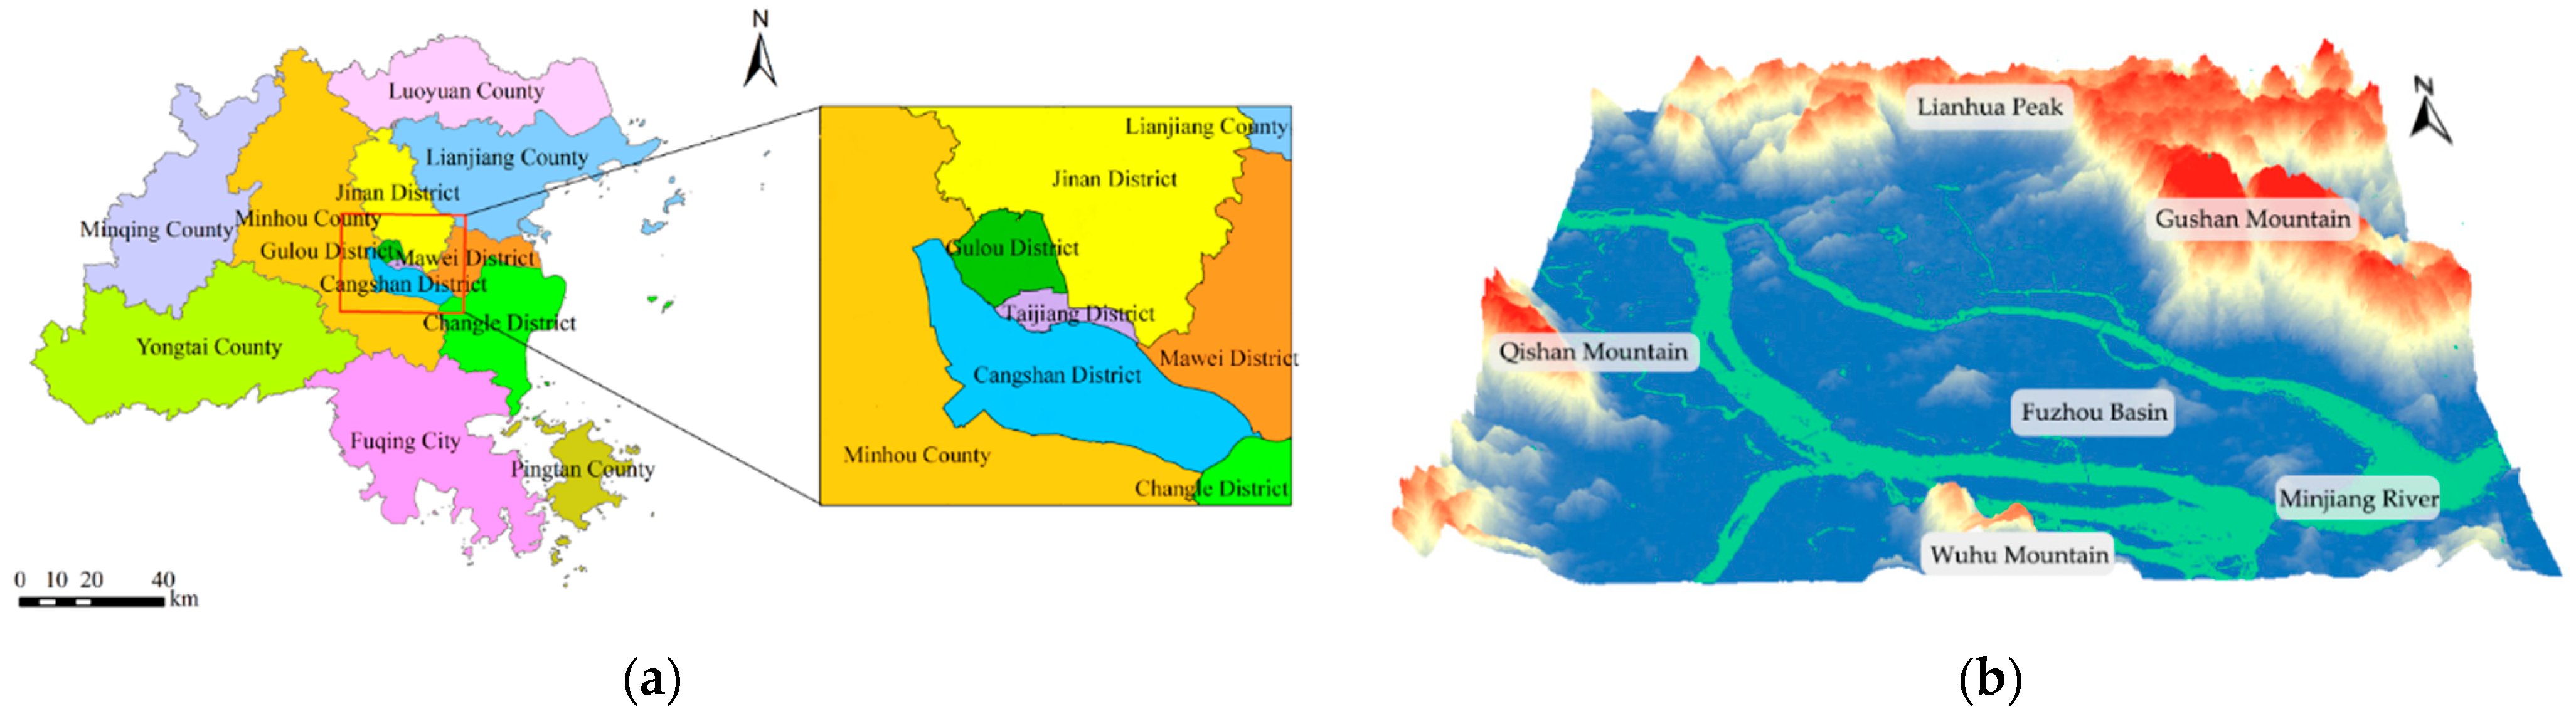
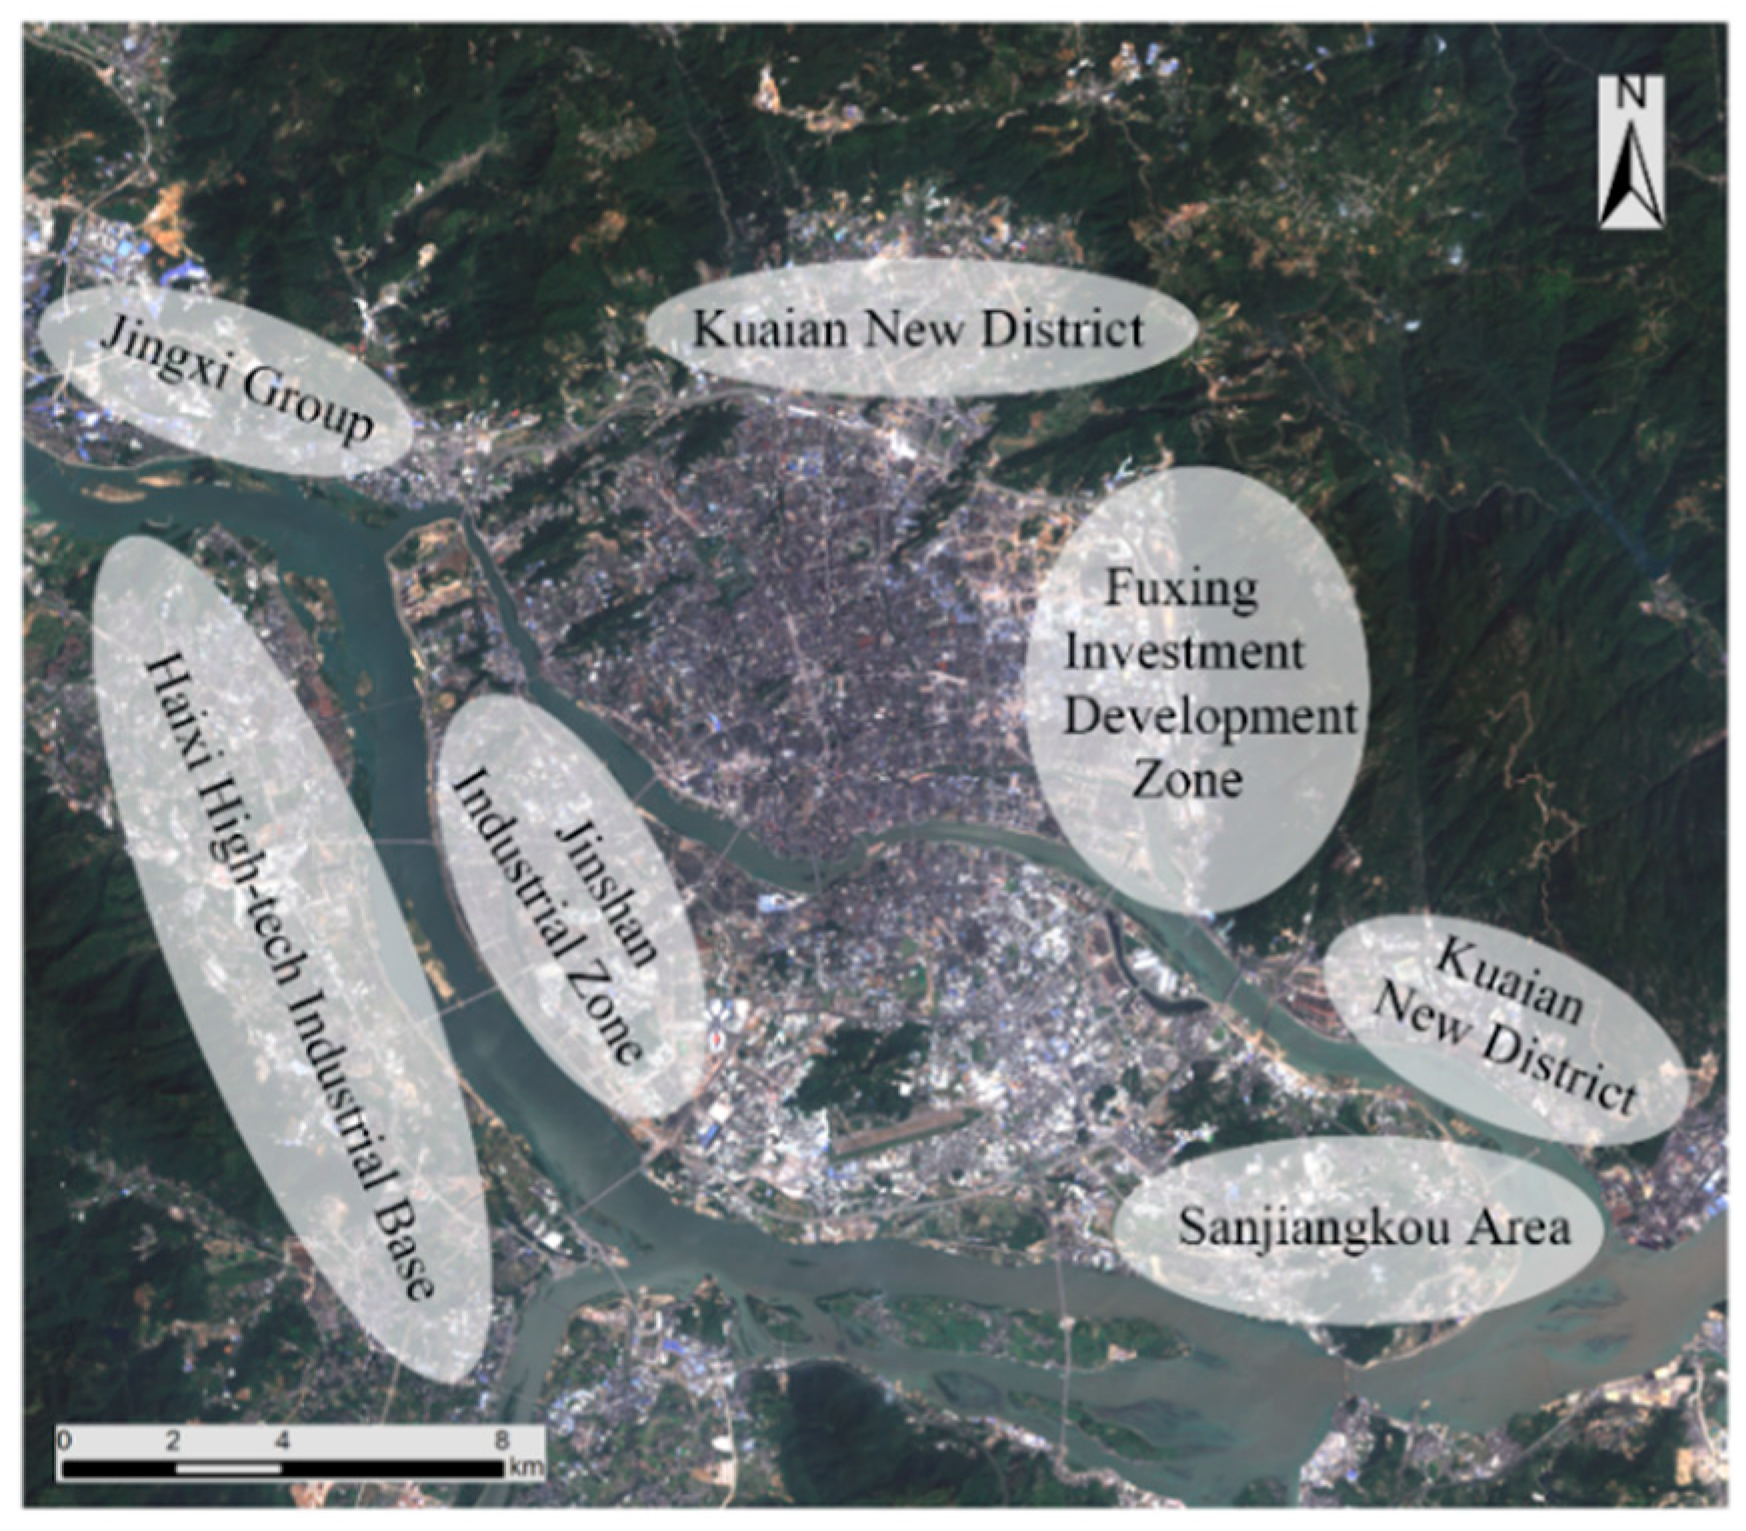
2.1. Study Area

Fuzhou, as the capital city of Fujian Province, is located at the eastern end of Central Fujian and the west bank of Taiwan Strait, with a latitude and longitude range of 25°15′~26°39′ N and 118°08′~120°31′ E. In this paper, the built-up area of Fuzhou City was selected as the study area (Figure 1a). Most of the urban areas are located in the plain area of the lower reaches of the Minjiang River. The basin is surrounded by mountains and hills, with Lianhua Peak in the north, Wuhu Mountain in the south, Qishan Mountain on the left, and Gushan Mountain in the east. The topography of the study area is shown in Figure 1b. The climate of Fuzhou is subtropical maritime monsoon climate, warm and humid, rich in rain and heat, with an average annual temperature of 16~20 °C and annual precipitation of 900~2100 mm, which is suitable for crop growth. Fuzhou is rich in vegetation types, mainly including evergreen broad-leaved forest, red-leaved forest, coastal sandy forest, shrubs, and so on.

2.2. Dataset

The Landsat images selected in this paper were obtained from Geospatial Data Cloud and the United States Geological Survey (USGS). Based on the research purpose, the following points should be noted when selecting data: firstly, to avoid uncertainties caused by the cross-use of different satellite data, satellite data with a longtime span should be selected as much as possible. Secondly, in order to avoid the interference of cloud amount and other factors on the experimental results, it is required that the images are clearly visible and cloudless. Finally, remote sensing images need to be comparable, and data are generally selected for the same month. If corresponding data are not available for some years, data for adjacent months of the same year or data for adjacent years of the same month are used instead. The specific information on remote sensing images selected in this paper is shown in Table 1.
NTL data can capture nighttime city lights and fire spots, which is widely used in urban expansion research, urbanization level estimation, and other fields. NTL data can be obtained from the National Oceanic and Atmospheric Administration (NOAA). Details of the NTL selected in this paper are shown in Table 2.

2.3. Data Preprocessing

2.3.1. Landsat Image

Sensors will be interfered by many factors when recording electromagnetic wave characteristics of ground objects, and the difference between illumination and atmospheric conditions will affect the image quality [18]. Therefore, it is generally necessary to carry out radiation correction before using remote sensing images. In this paper, the Illumination and Atmospheric Correction Model (IACM) was chosen for the atmospheric correction of TM and ETM+ images, and the Illumination Correction Model (ICM) was used for the atmospheric correction of OLI images.

2.3.2. DMSP/OLS

In order to make a perfect match between Landsat images and NTL data, DMSP/OLS data were projected as the spatial reference coordinate system WGS_1984_UTM_zone_50N of Landsat images. Since the downloaded DMSP/OLS data are the global image, the image grid becomes smaller with increasing latitude [19], and resampling must be performed. To fully retain the advantages of Landsat’s resolution and avoid excessive sawtooth in the cropped NTL data, the DMSP/OLS was resampled to 30 m. It is worth noting that the DMSP/OLS images have a luminance maximum of 62, neither of which exceeds 63. The brightness of NTL should be greater than 0. Based on the cropped images of the study area, a raster calculator was used to obtain the pixels with DN > 0. Avoiding the degradation of data continuity due to the different radiation performance of different sensors, this paper adopted the correction model proposed by Zou et al. [20] for the mutual correction processing of images, and its correction regression model is as follows:
D N f = a × D N 2 + b × D N + c
where DNf is the pixel value after correction, DN is the pixel value after correction, a, b, c are the regression parameters, and the parameter values are shown in Table 3.
Different detection performance of different sensors may cause differences between images in the same year. To avoid radiation distortion caused by this, this paper used the method of average light intensity to realize image correction of multiple sensors in the same year. The specific formula is as follows:
D N ( n , i ) = { 0 D N ( n , i ) a = 0   or   D N ( n , i ) b = 0 ( D N ( n , i ) a + D N ( n , i ) b ) 2 Others
where DN(n,i) is the brightness value of the pixel i of the image in the year n after correction. D N ( n , i ) a and D N ( n , i ) b are the brightness values of the pixel i of the image of sensor a and sensor b in the year n, respectively.
According to the development characteristics of urbanization, the bright value pixels detected in the previous year’s image should be kept as bright value pixels in the next year’s image. Based on this, the following formula was adopted to correct each other between years:
D N ( n , i ) = { 0 D N ( n , i ) 0 D N ( n 1 , i ) D N ( n + 1 , i ) > 0   and   D N ( n 1 , i ) > D N ( n , i ) D N ( n , i ) Others
where DN(n−1,i), DN(n,i), and DN(n+1,i) are the pixel values of the pixel i in the corrected image in the year n−1, n, and n+1, respectively.
The corrected data are represented by floating-point data. In order to facilitate later data processing and analysis, it is necessary to convert floating-point raster data into integer raster data. According to the above steps, the DMSP/OLS data of each year were corrected, and the comparison chart of DMSP/OLS data before and after the correction was obtained (Figure 2).

2.3.3. NPP-VIIRS

NPP-VIIRS data have superb detection sensitivity to nighttime light, the faint bright of non-built-up areas light sometimes appears in the image as high noise, and the area with bright light will be much larger than the real area of the built-up area. Therefore, in addition to projection transformation, resampling, and cropping of NPP-VIIRS data, outlier processing is also required. The cities with faster development have higher values of NTL. The better developed regions in China, such as Beijing, Shanghai, and Guangzhou, were selected as the study sample areas, and the peak value of light brightness in the region was taken as the maximum threshold. If the light brightness value of the image in the study area exceeded the maximum threshold, the pixel was assigned as the maximum threshold. The formula is as follows:
D N i = { D N max D N i > D N max D N i D N i D N max
where DNi is the brightness value of the pixel i in the image, DNmax is the maximum threshold.
In NPP-VIIRS data, there may be pixel abrupt change, that is, the pixel brightness value of the next month is less than that of the previous month. Formula (3) was used to correct the NPP-VIIRS data in 2015 and 2021.

2.3.4. Calibration between DMSP/OLS and NPP-VIIRS Data Sets
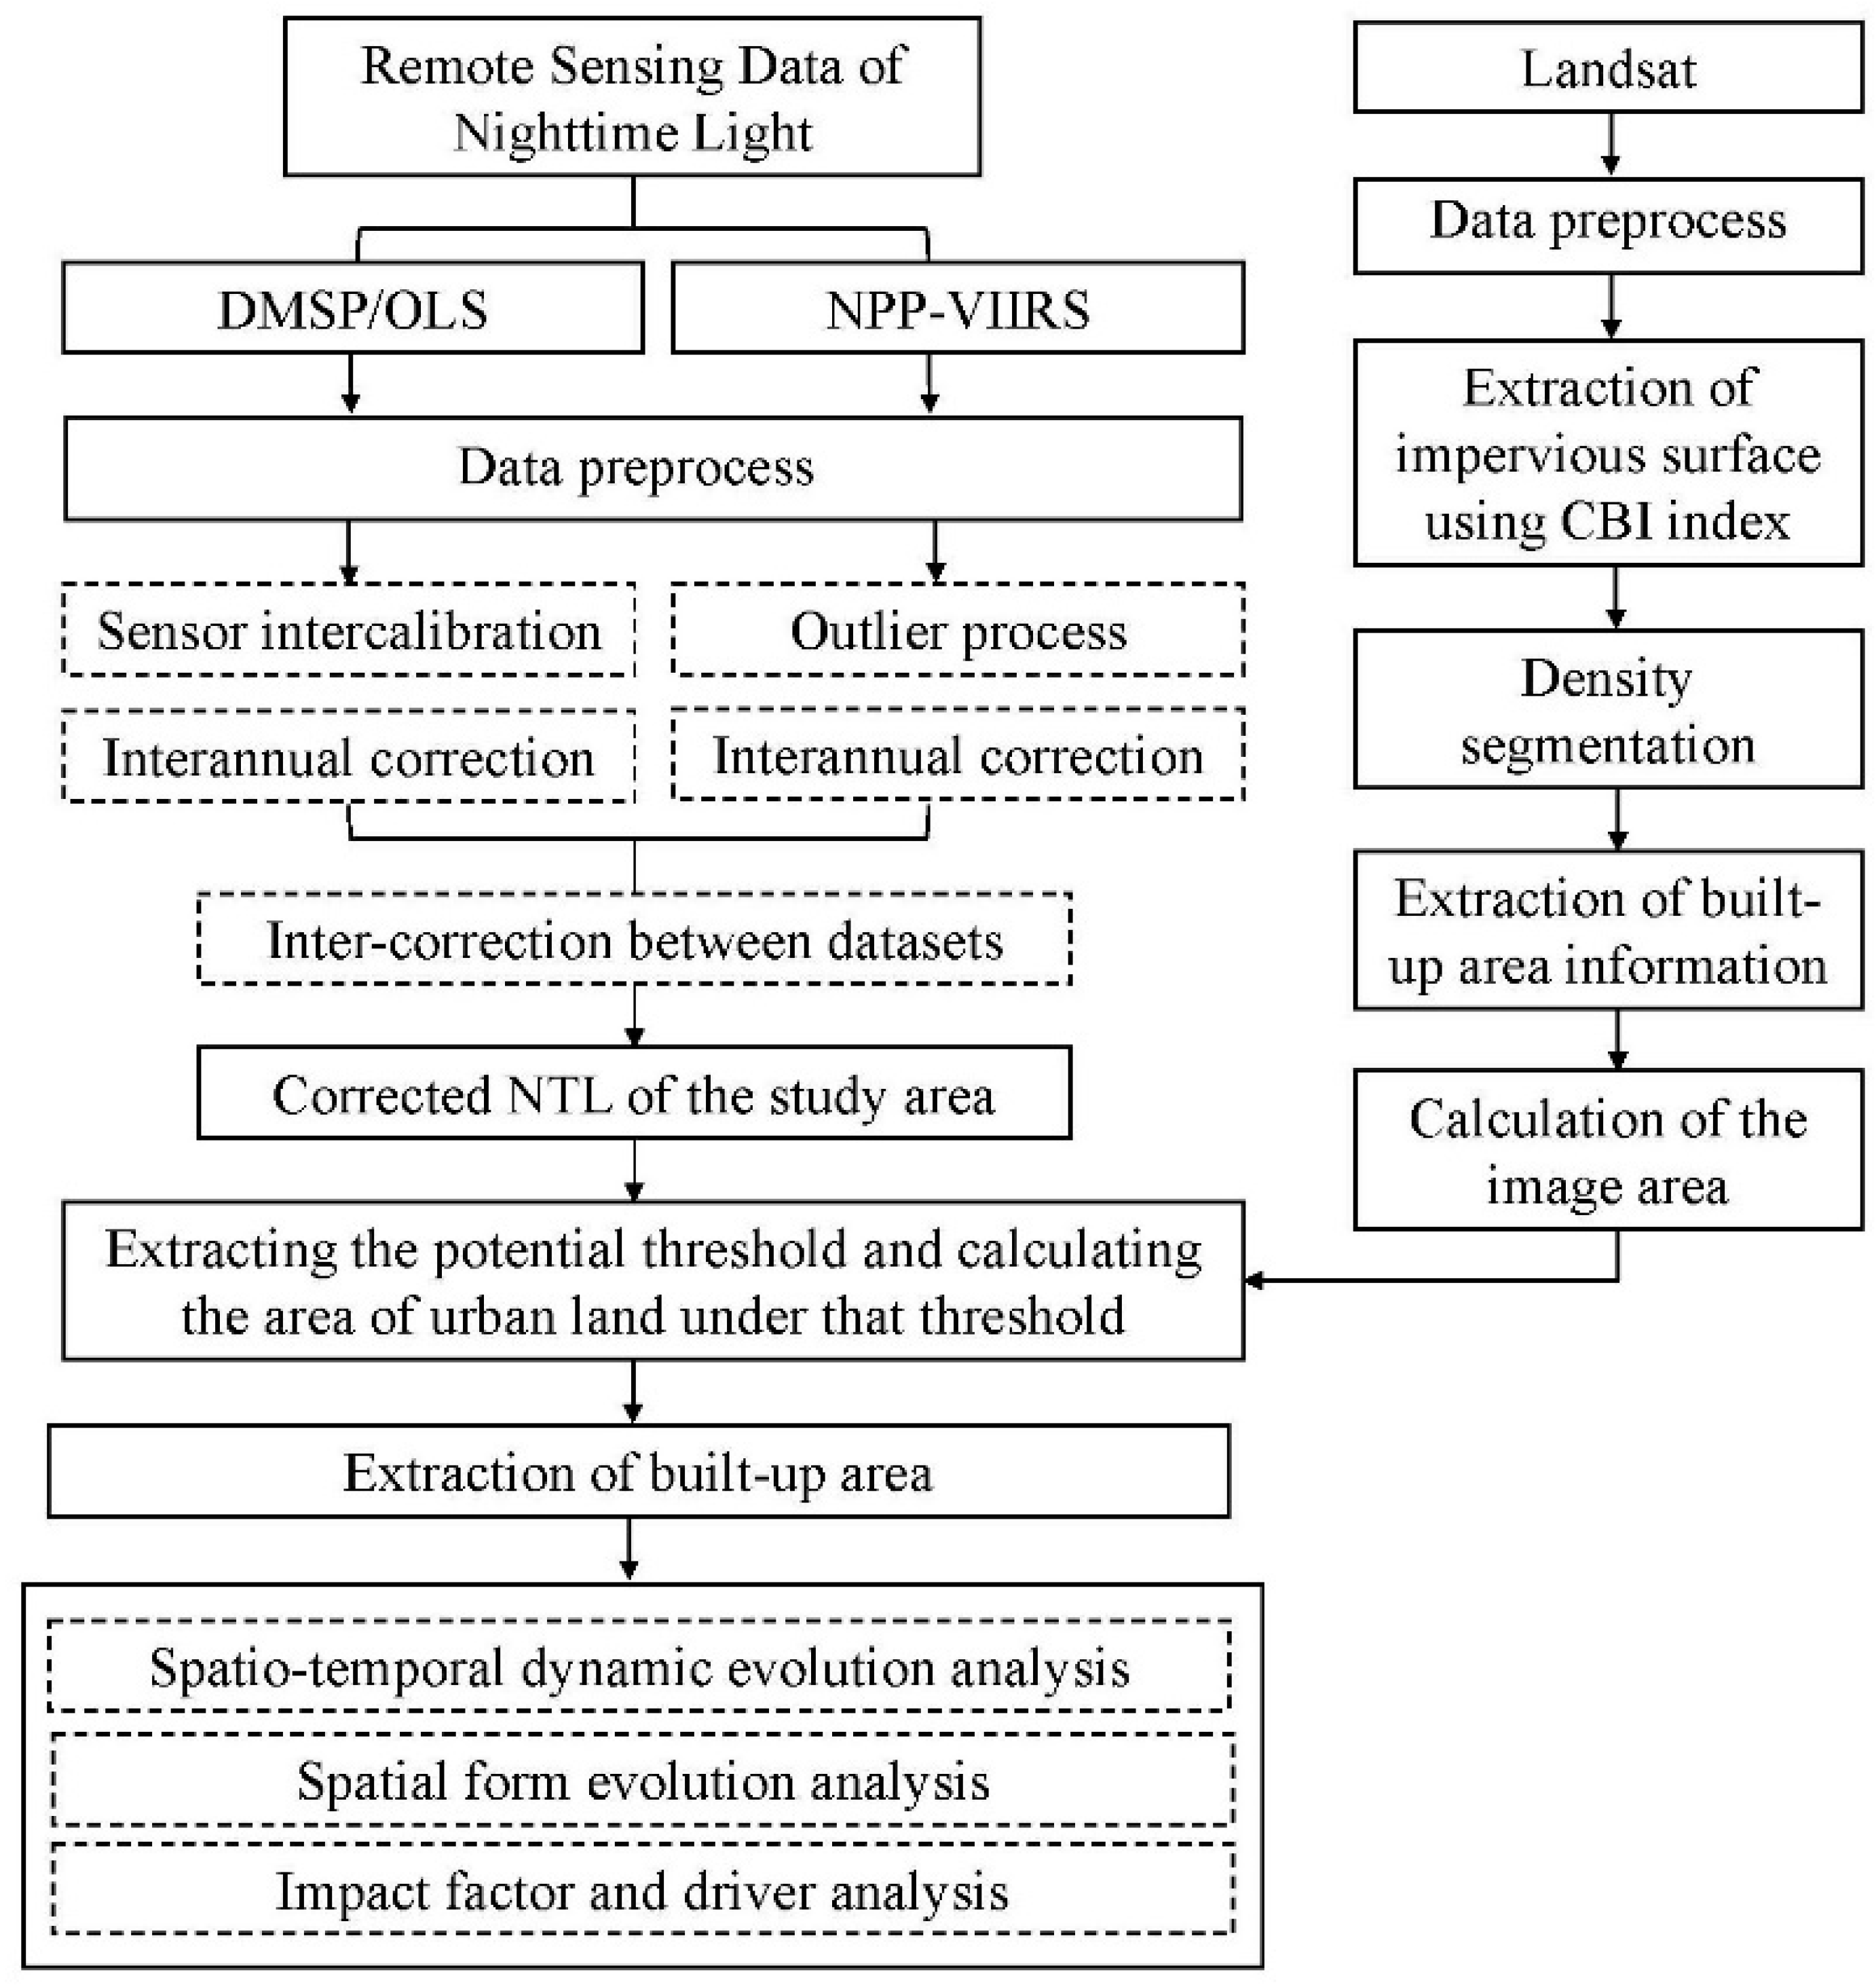
Different datasets need to be corrected to be comparable and the method proposed by Guan et al. [21] was used for image consistency correction of DMSP-OLS and NPP-VIIRS. The formulas are as follows:
N P P log = ln ( N P P + 1 )
y = A 1 + ( A 2 A 1 ) [ p 1 + 10 ( log x 01 x ) h 1 + 1 p 1 + 10 ( log x 02 x ) h 2 ]
where NPP represents the original radiometric value of the NPP-VIIRS image; NPPlog represents the log-transformed radiometric value of the image. The constant 1 is added to avoid the invalid values generated by the logarithmic transformation. y is the calibration value of NPP-VIIRS with DMSP-OLS consistency correction; x is NPPlog; A1, A2, logx01, logx02, h1, h2, and p are the model parameters with values of −31.5988, 190.6737, 0.2857, 1.9352, −3.1132, 0.4410, and 0.0290, respectively.
The corrected images also need to be converted into integer raster data. Figure 3 shows the comparison of NPP-VIIRS data before and after correction.

3. Research Methods

To study the spatio-temporal characteristics of built-up areas, this paper extracts built-up areas based on remote sensing data of nighttime light using the urban areas extracted from Landsat data as auxiliary data. Based on this, analyzes the spatio-temporal dynamic evolution and spatial form changes, and further discusses the driving factors and impact factors of urbanization. The technical route is shown in Figure 4.

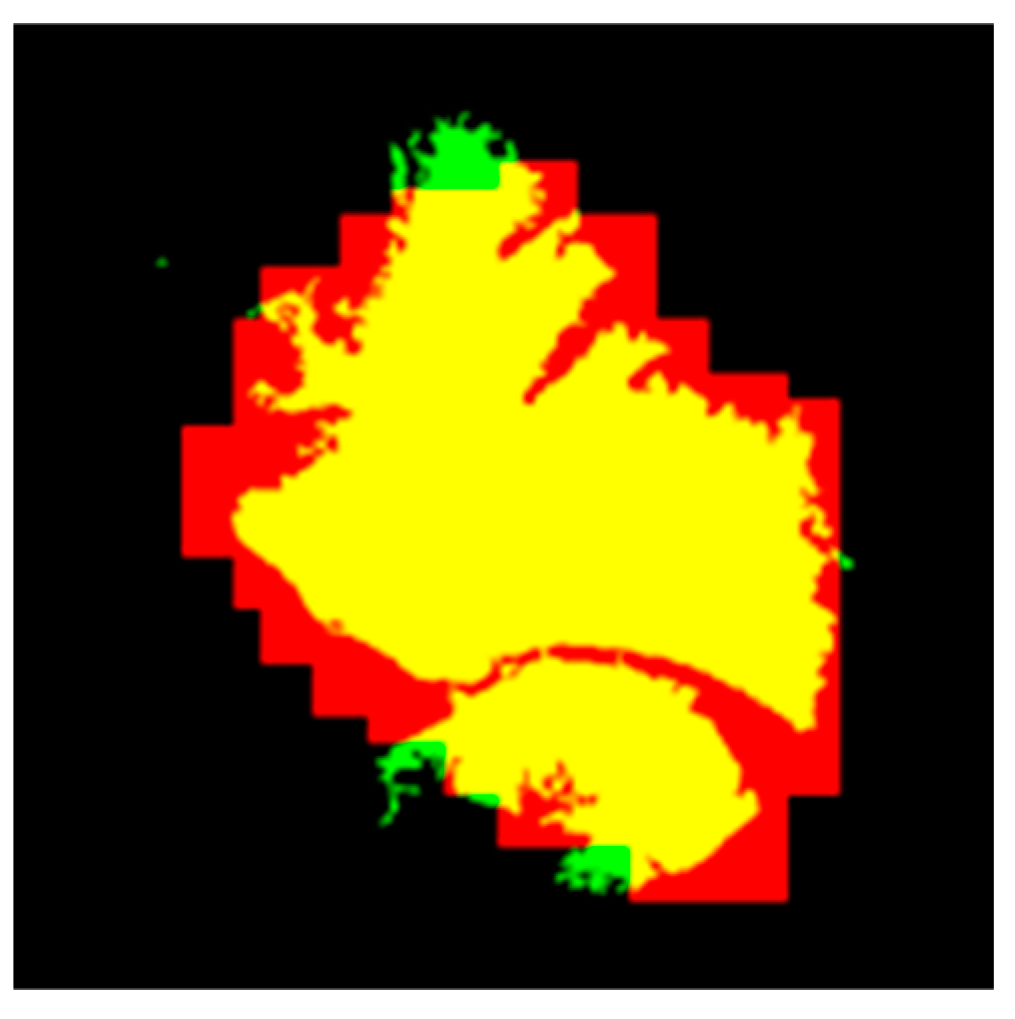
3.1. Extraction of Urban Built-Up Area Based on NTL Data

The brightness value of NTL data reflects the situation of human activities. The higher the value, the higher the probability that the region is a built-up area. The following methods were used to help determine the threshold of the NTL built-up area. Firstly, the brightness values of NTL images were sorted from high to low. Additionally, Formulas (7) and (8) were used to determine an extraction threshold. Then, using Equation (9) to set the part of the grayscale value not less than the extraction threshold to 1 and the rest to 0.
| S ( n - 1 ) A | < | S ( n ) A | < | S ( n + 1 ) A |
S ( n ) = C o u n t ( n ) × R
V A L U E = { 1 V A L U E n 0 V A L U E < n
where n is the brightness value threshold of the built-up area. S(n) is the extraction area with a threshold value. A is the built-up area obtained by Landsat. Count(n) is the cumulative number of pixels with a threshold value not less than n. R is the spatial resolution of the image, that is, the ground area represented by a single pixel. VALUE is the pixel gray value.

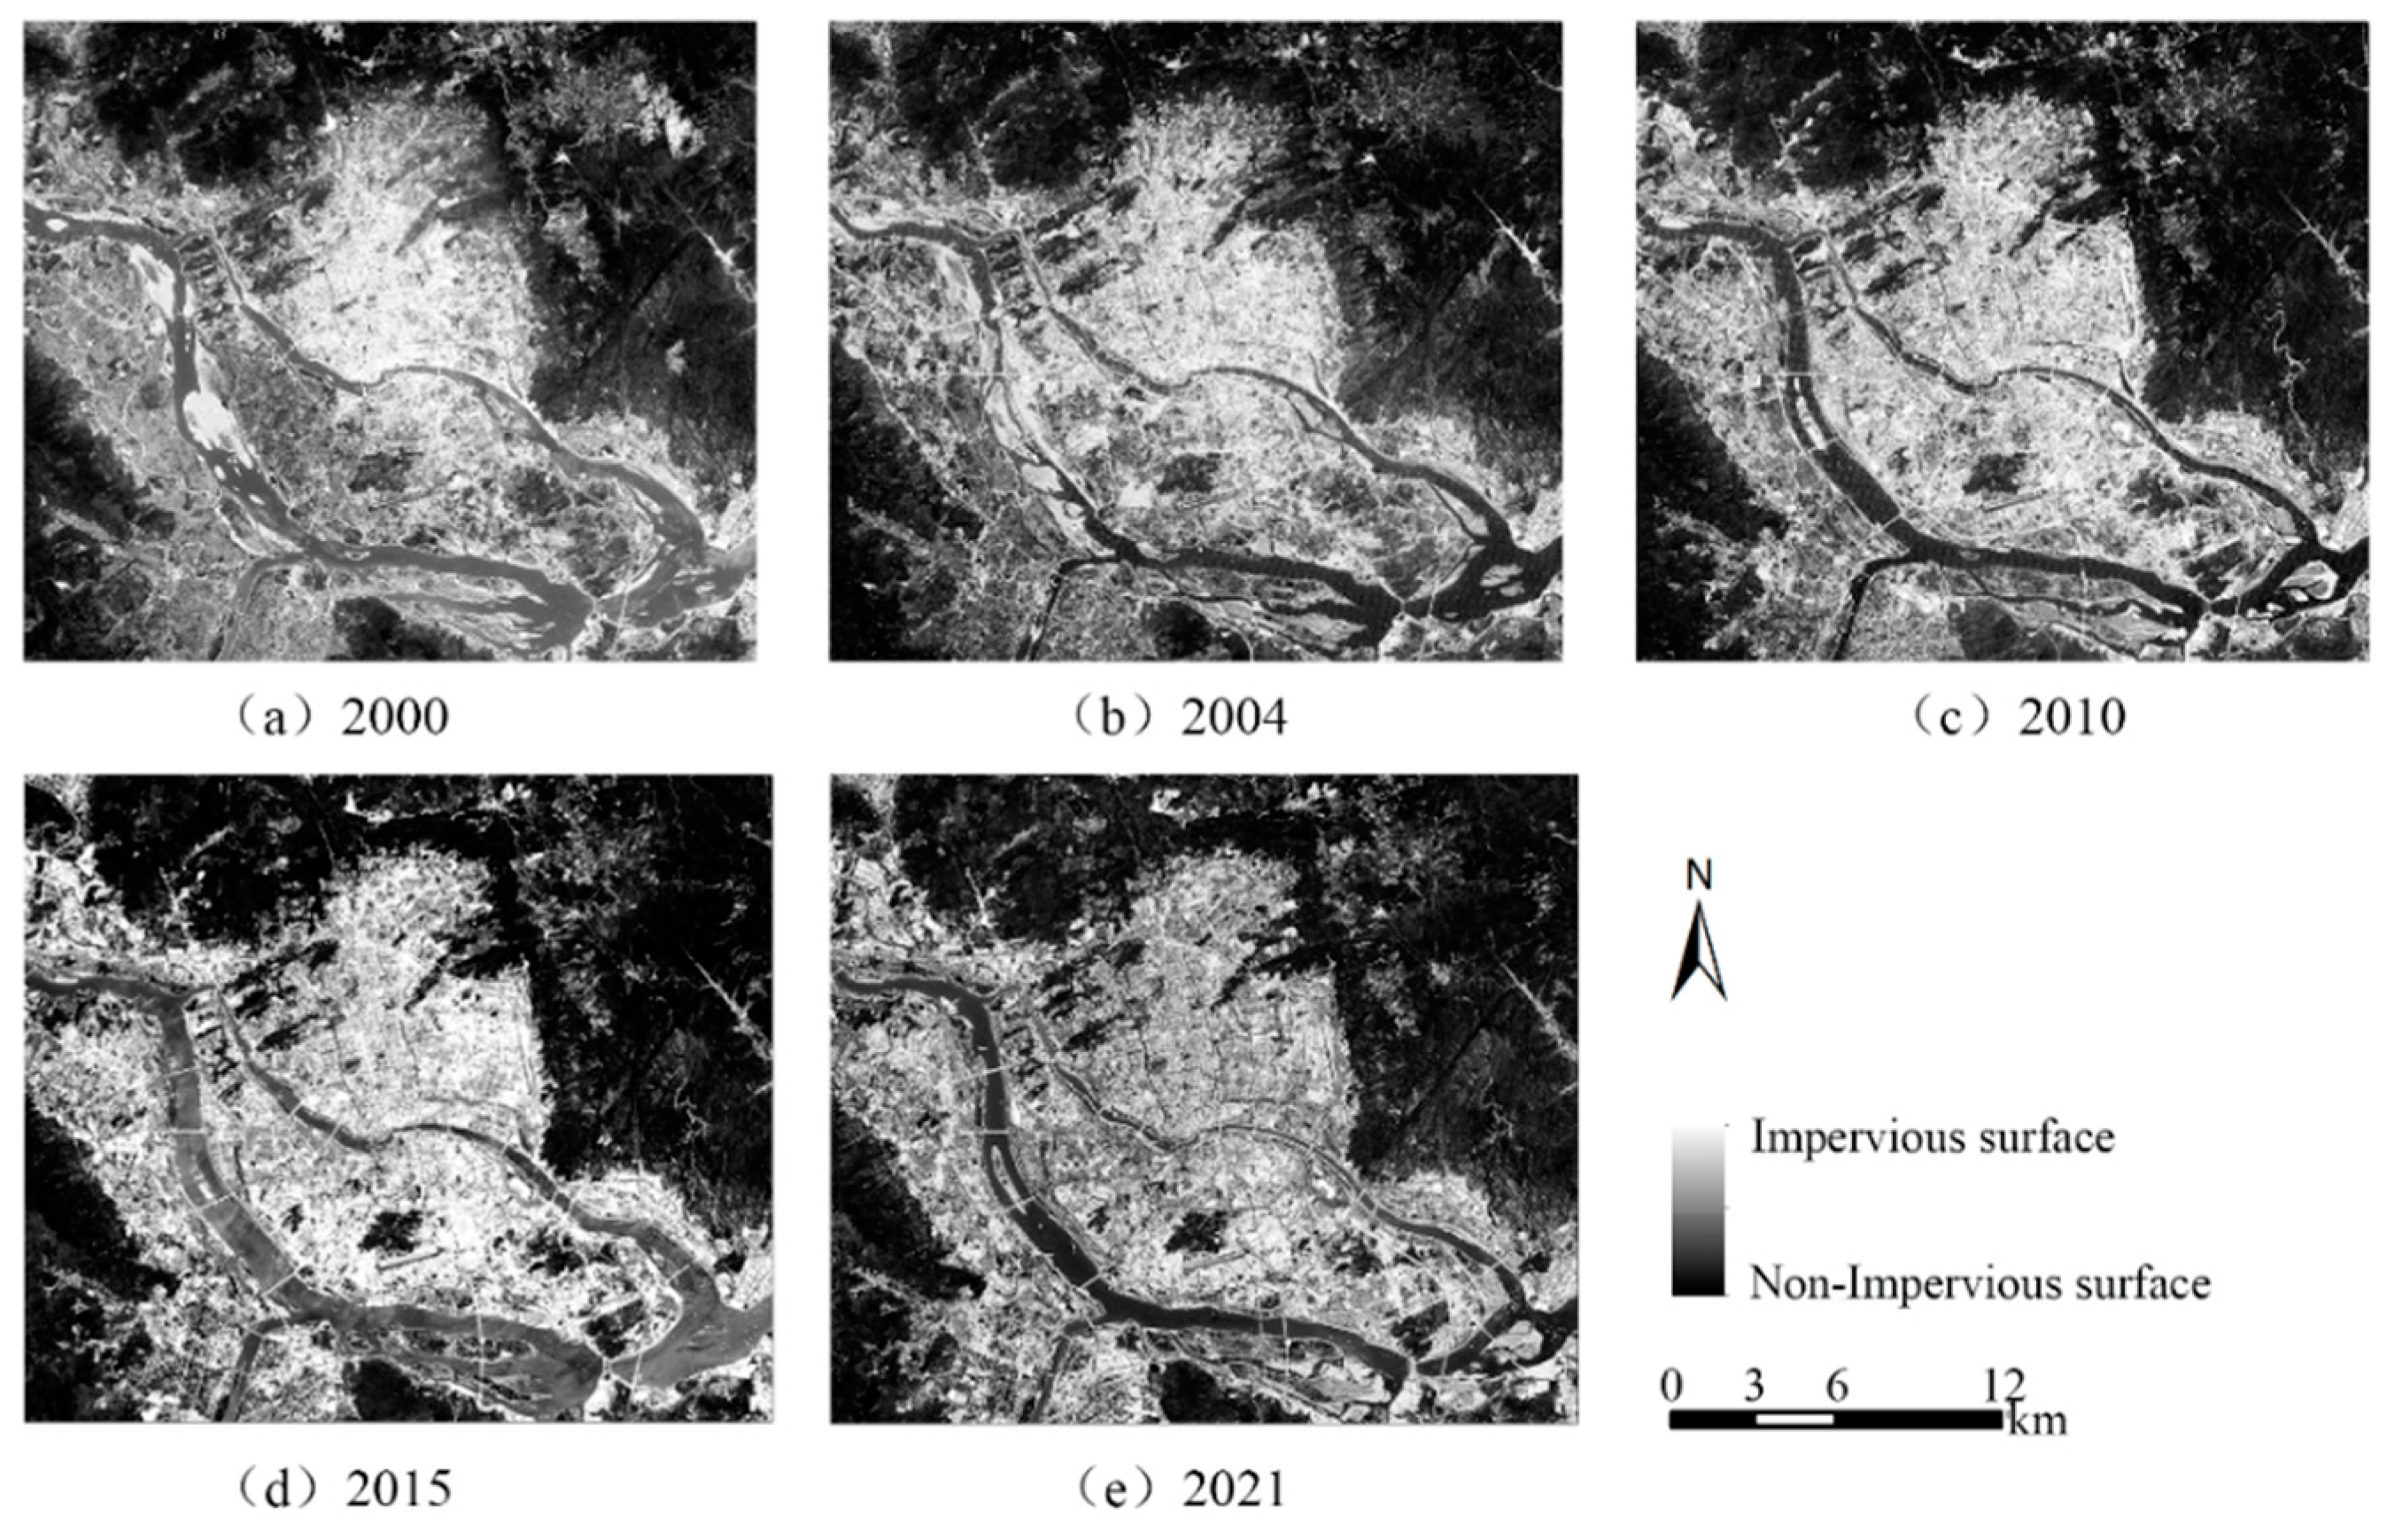
3.2. Urban Built-Up Area Extraction Based on Landsat Image

When the Normalized Difference Build-up Index (NDBI) [22] and Normalized Difference Impervious Surface Index (NDISI) [23] are used to extract impervious surfaces from different Landsat sensors, the extraction accuracy is easily affected by the spectral quantization interval of the sensors, and the difference between the calculated results of impervious surface and that of vegetation and water is small and difficult to distinguish. In this paper, a composite built-up index (CBI) [24] is used to enhance impervious surface information in remotely sensed imagery. The CBI is based on NDBI, Normalized Differential Vegetation Index (NDVI) [25], and Modified Normalized Difference Water Index (MNDWI) [26], and experiments on impervious surface extraction of different sensor images and areas with different land cover types were carried out by using CBI, NDBI, and NDISI. The results show that CBI has good robustness, which is less affected by the type of ground objects and sensors, and CBI is more suitable for areas with high water and vegetation coverage.

3.3. Spatio-Temporal Dynamic Evolution Analysis

Studying the spatial and temporal dynamic evolution of urban expansion is conducive to understanding the current situation of urban development, mastering the speed of urban development, avoiding the waste of resources and environmental damage, and contributing to the formulation of urban development strategies.

3.3.1. Nighttime Light Index Analysis

Composite nighttime light index (CNLI) takes into account the characteristics of regional expansion and aggregation and can objectively reflect the spatial pattern of urbanization and its development and change. CNLI is actually the ratio of the total brightness value of light pixels in the area to the maximum possible total brightness value, and the calculation formula is as follows:
C N L I = i = K D N M ( D N i × n i ) D N M × N
where DNi is the pixel value of the pixel i in the region. ni is the total number of pixels of the pixel value in the region. K is the threshold for removing errors. DNM is the maximum pixel value that the image may reach. N is the total number of pixels.

3.3.2. Analysis of Expansion Speed and Strength

In order to show the speed and strength of urban built-up area expansion in Fuzhou in different years, this paper used the average annual expansion rate (V) and expansion intensity index (I) to analyze the expansion of the urban built-up area. The calculation formulas are as follows:
V = Δ A Δ T
where ΔA is the expanded area of urban built-up area, ΔT is the time interval. The larger V means the faster the expansion speed.
I = Δ U Δ T × S × 100
where S is the total area of urban land in the region. ΔU is the expanded area for the built-up area. ΔT is the time interval, and the larger I is, the greater the expansion strength.

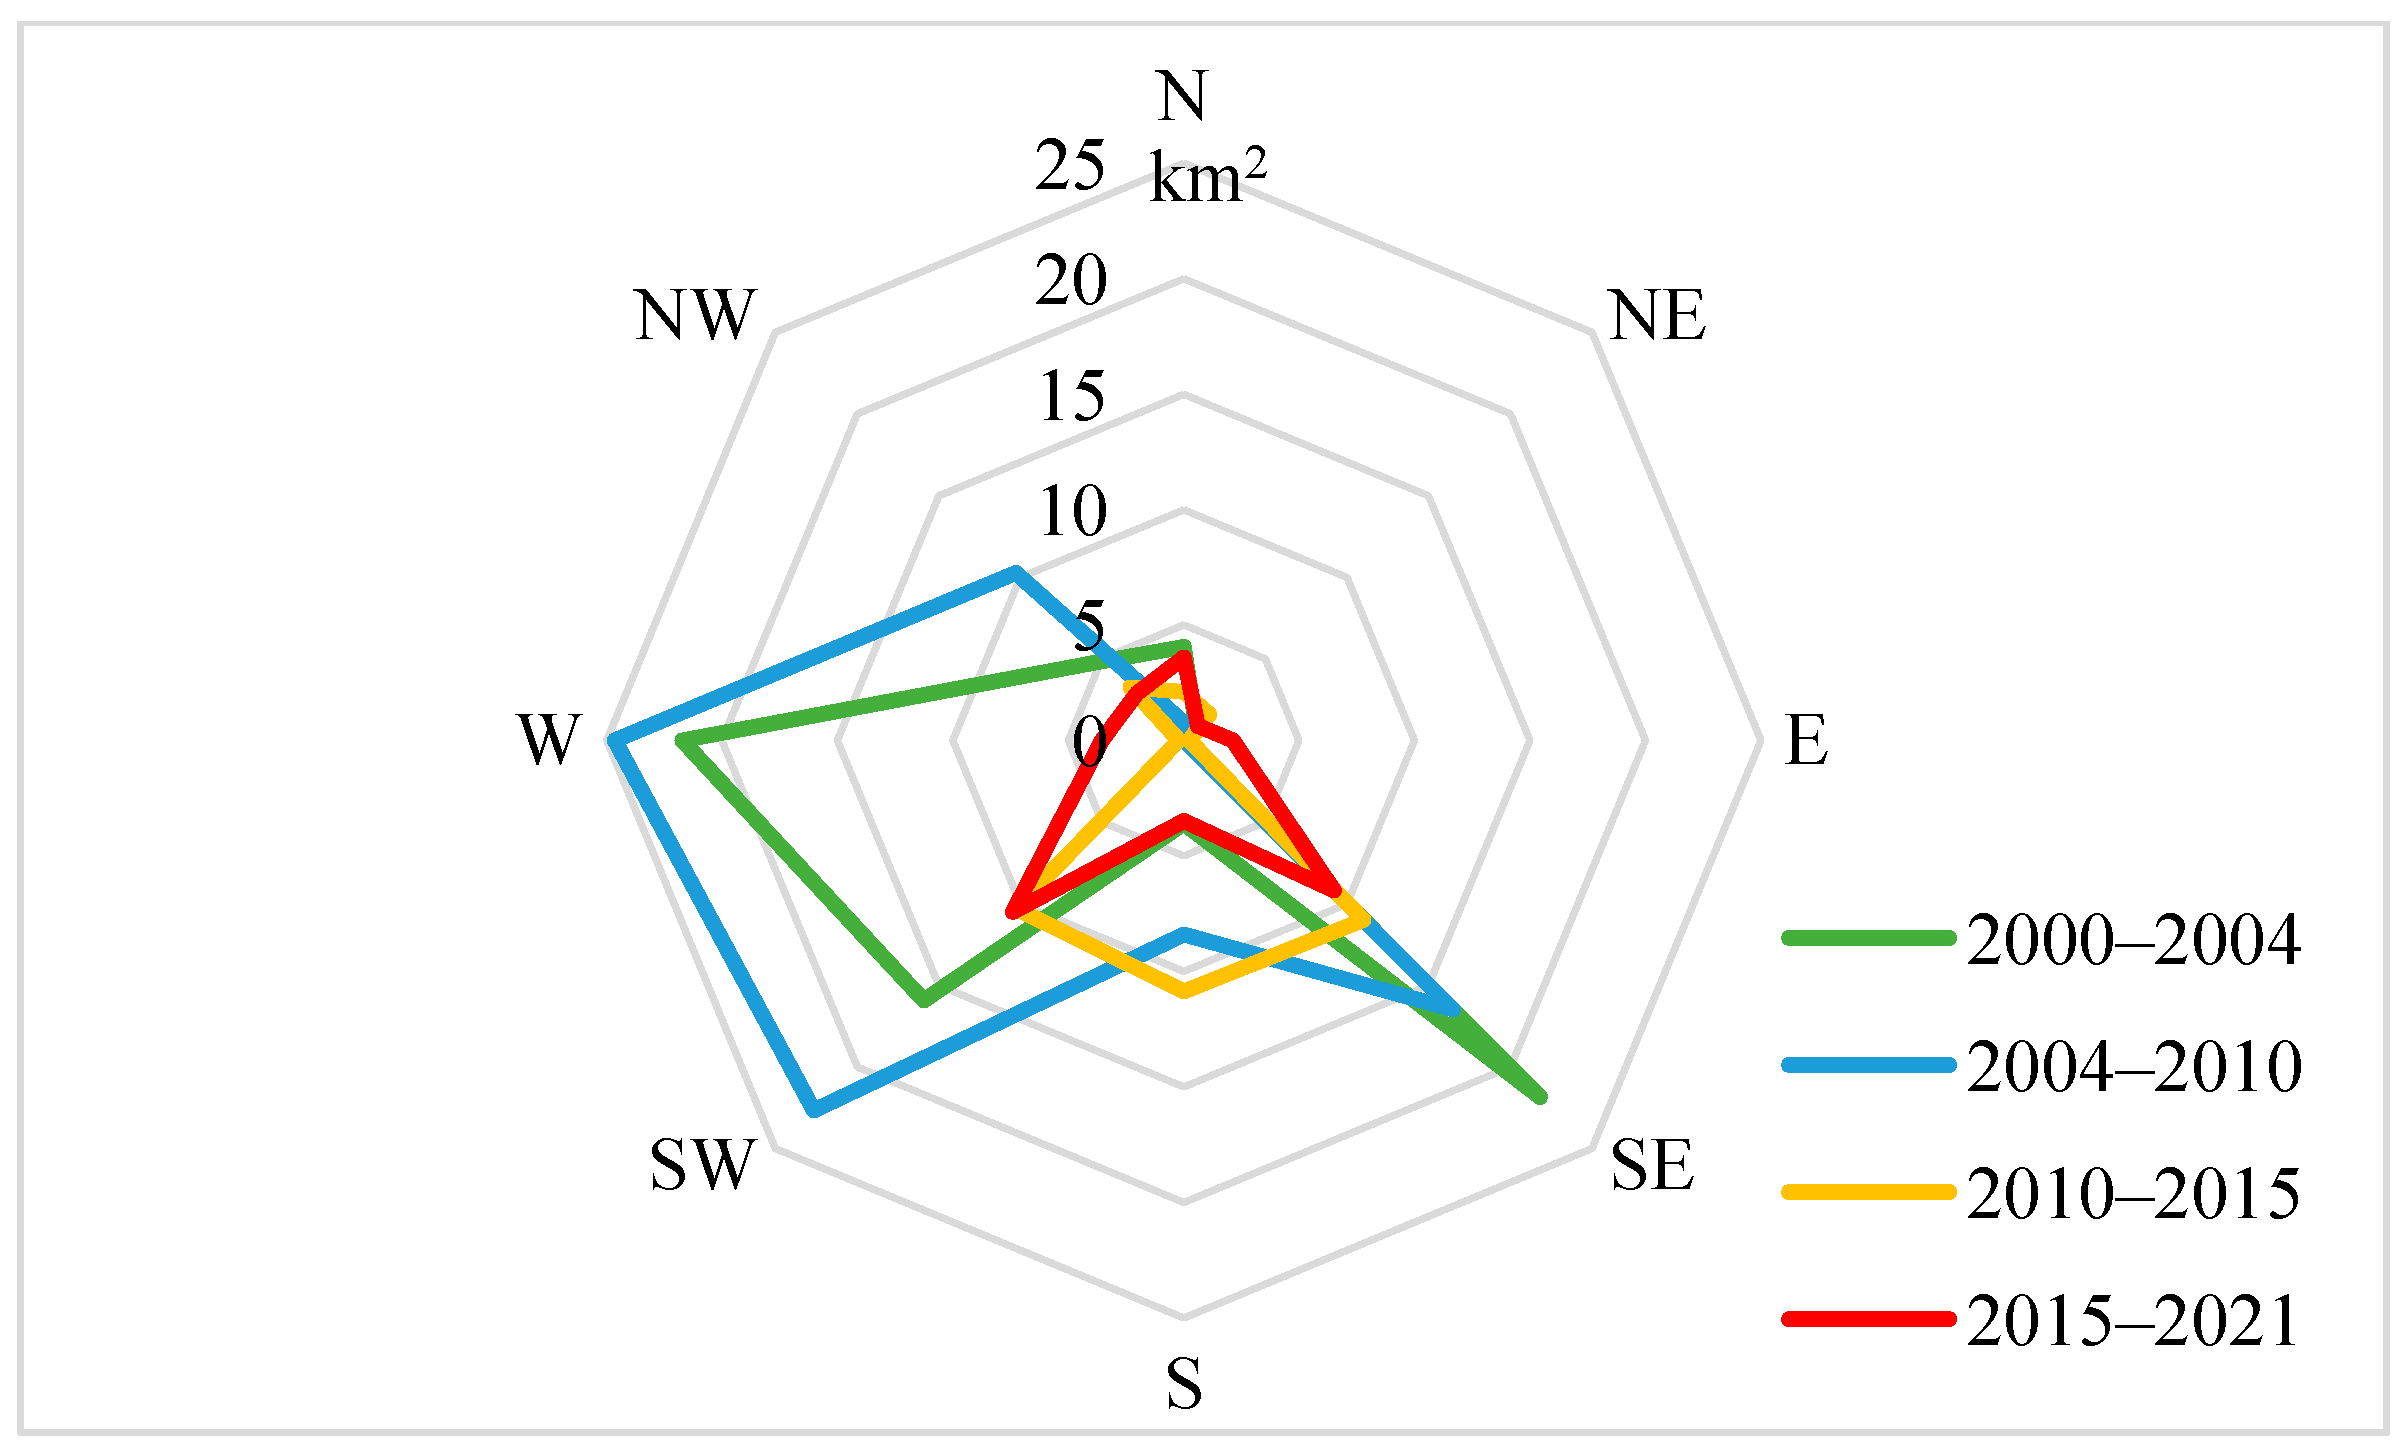
3.3.3. Analysis of Expansion Direction

The expansion direction of the built-up area reflects the change in regional economic development, and the analysis of the expansion direction of the built-up area is helpful to the formulation of relevant urban planning. This paper took the center of gravity of the built-up area in 2000 as the center to divide the built-up area in each year into eight equal parts and counted the built-up area in eight directions in each year.

3.4. Analysis of Spatial Form Evolution

The analysis of urban spatial morphology is helpful to understand the urban development model and the complexity of urban land use.

3.4.1. Fractal Dimension Analysis

Fractal dimension is often used to express the complexity of urban land use and the irregularity of spatial form. The larger its value, the more complex urban land use, and the more irregular spatial form, and the urban space is dominated by outward development. A small fractal dimension means that urban land use is simple, spatial form is regular, and urban space is mainly developed by internal filling. The calculation formula is as follows:
D t = 2 ln ( P t / 4 ) ln A t
where t is the year, Dt is the fractal dimension index in year t. Pt is the perimeter of the built-up area in year t. At is the built-up area in year t.

3.4.2. Compactness Analysis

Compactness is often used to indicate the spatial pattern of urban land, and its value is generally [0, 1], the larger the value, the higher the land utilization rate in the city, the more compact the urban space, and the more circular the urban form. On the contrary, when the value tends to 0, it means that the land utilization rate in the city is low, the spatial structure is scattered, and the urban form is long and narrow. The formula for calculating compactness is as follows:
C t = 2 π A t P t
where Ct is the compactness index in year t. At is the built-up area in year t. Pt is the perimeter of the built-up area in year t.

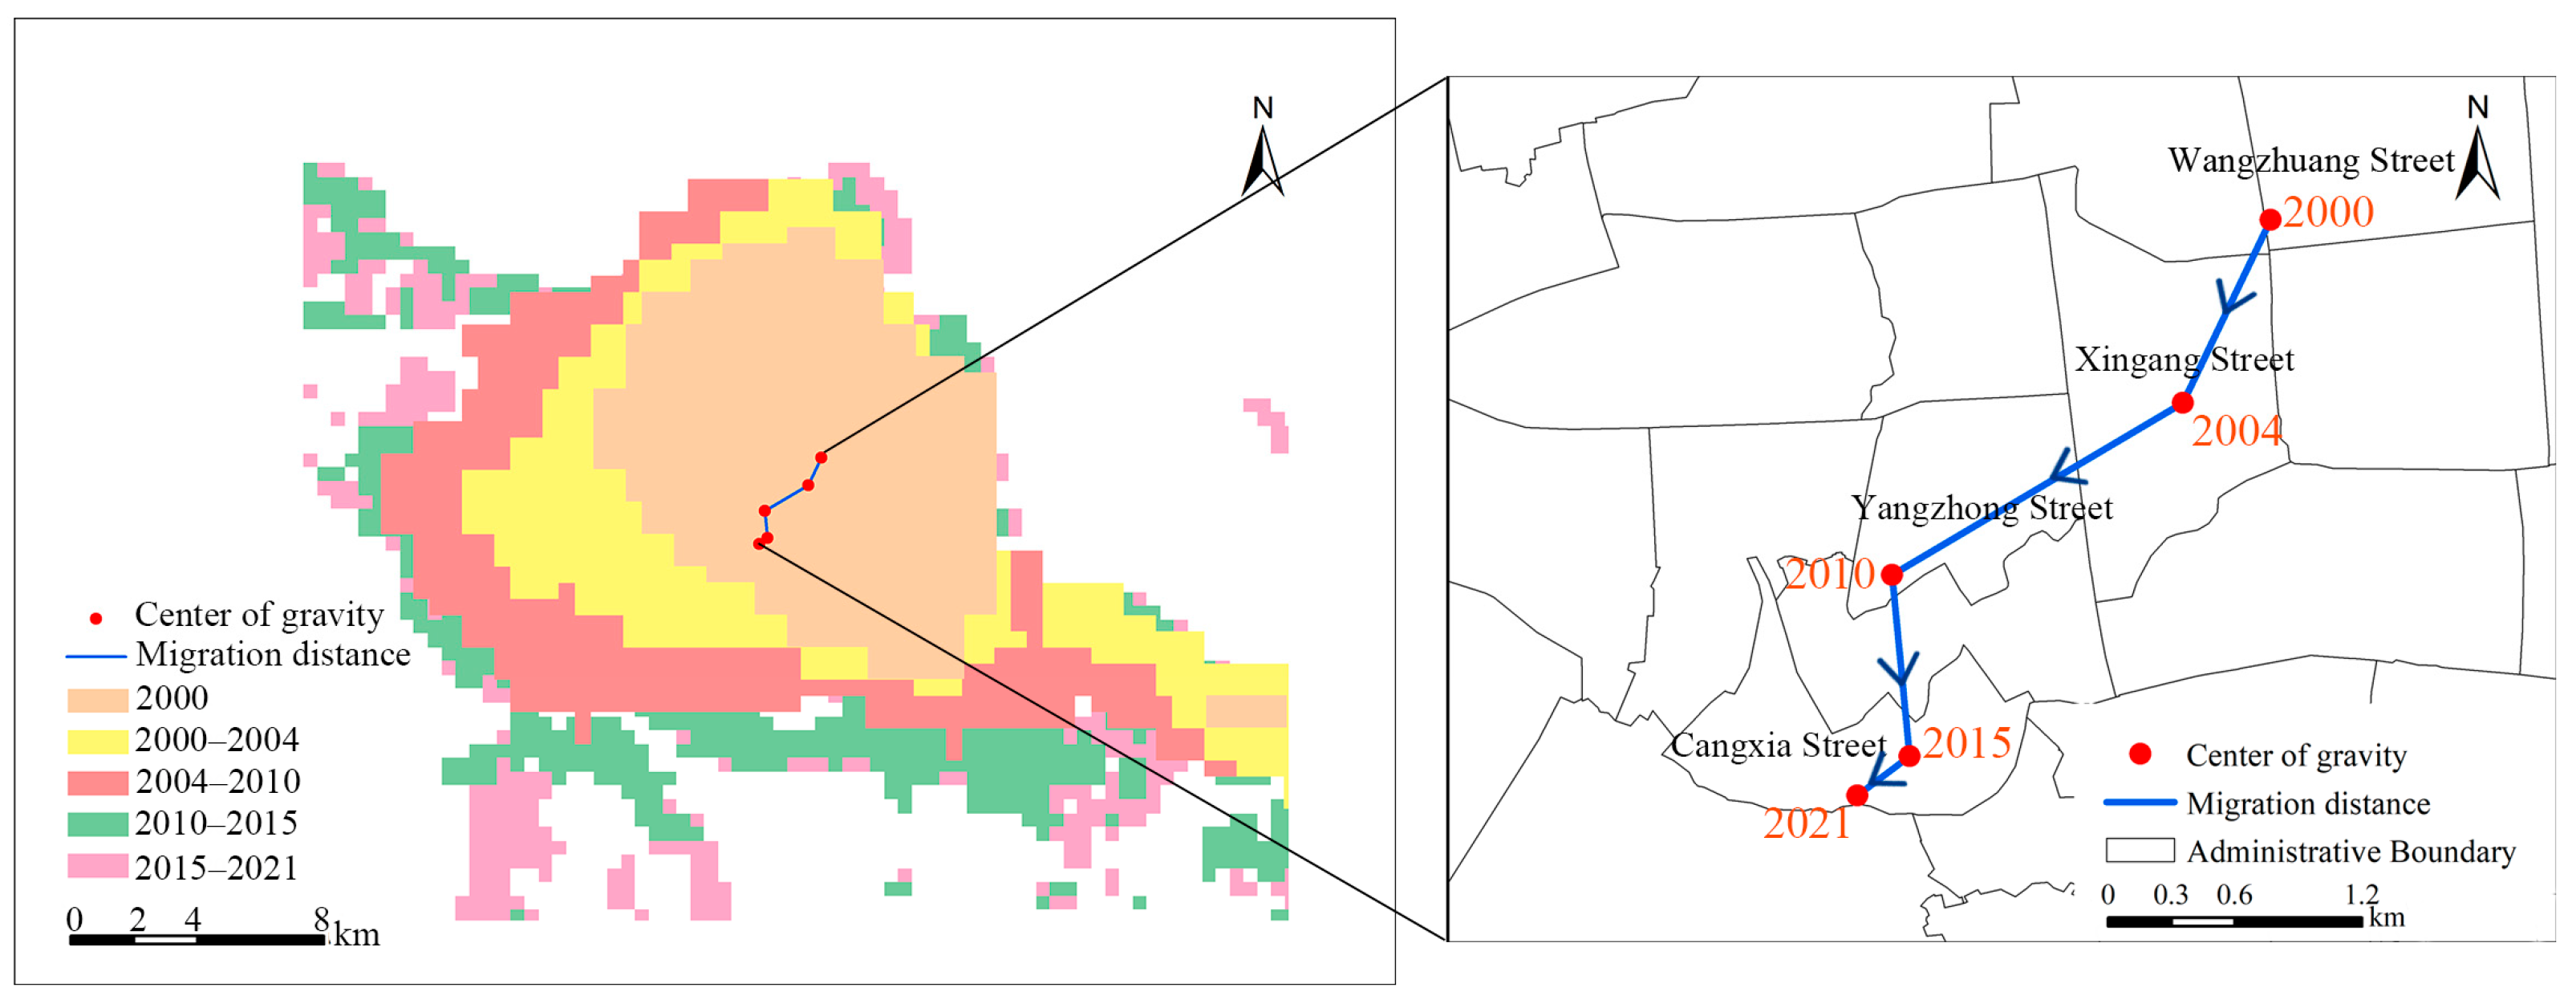
3.4.3. Analysis of Center of Gravity Shift

The center of gravity of the built-up area will change with the development of the city. This paper described the direction and distance of urban expansion by calculating the center of gravity of the built-up area in each year. The distance formula and angle formula are as follows:
D a b = ( X b X a ) 2 + ( Y b Y a ) 2
where Dab is the distance from the center of gravity of the built-up area in year a to year b. Xa and Xb are the horizontal coordinates of the center of gravity of the built-up area in year a and year b, respectively. Ya and Yb are the vertical coordinates of the center of gravity of the built-up area in year a and year b, respectively.
= { arctan ( | Δ Y / Δ X | ) Δ X 0 π arctan ( | Δ Y / Δ X | ) Δ X < 0
where is the included angle between the migration direction of the center of gravity of the built-up area and the due east direction. ΔX is the change in the horizontal coordinate of the center of gravity of the built-up area during the study period. ΔY is the change in the horizontal coordinate of the center of gravity of the built-up area during the study period.

4. Experiment and Conclusion

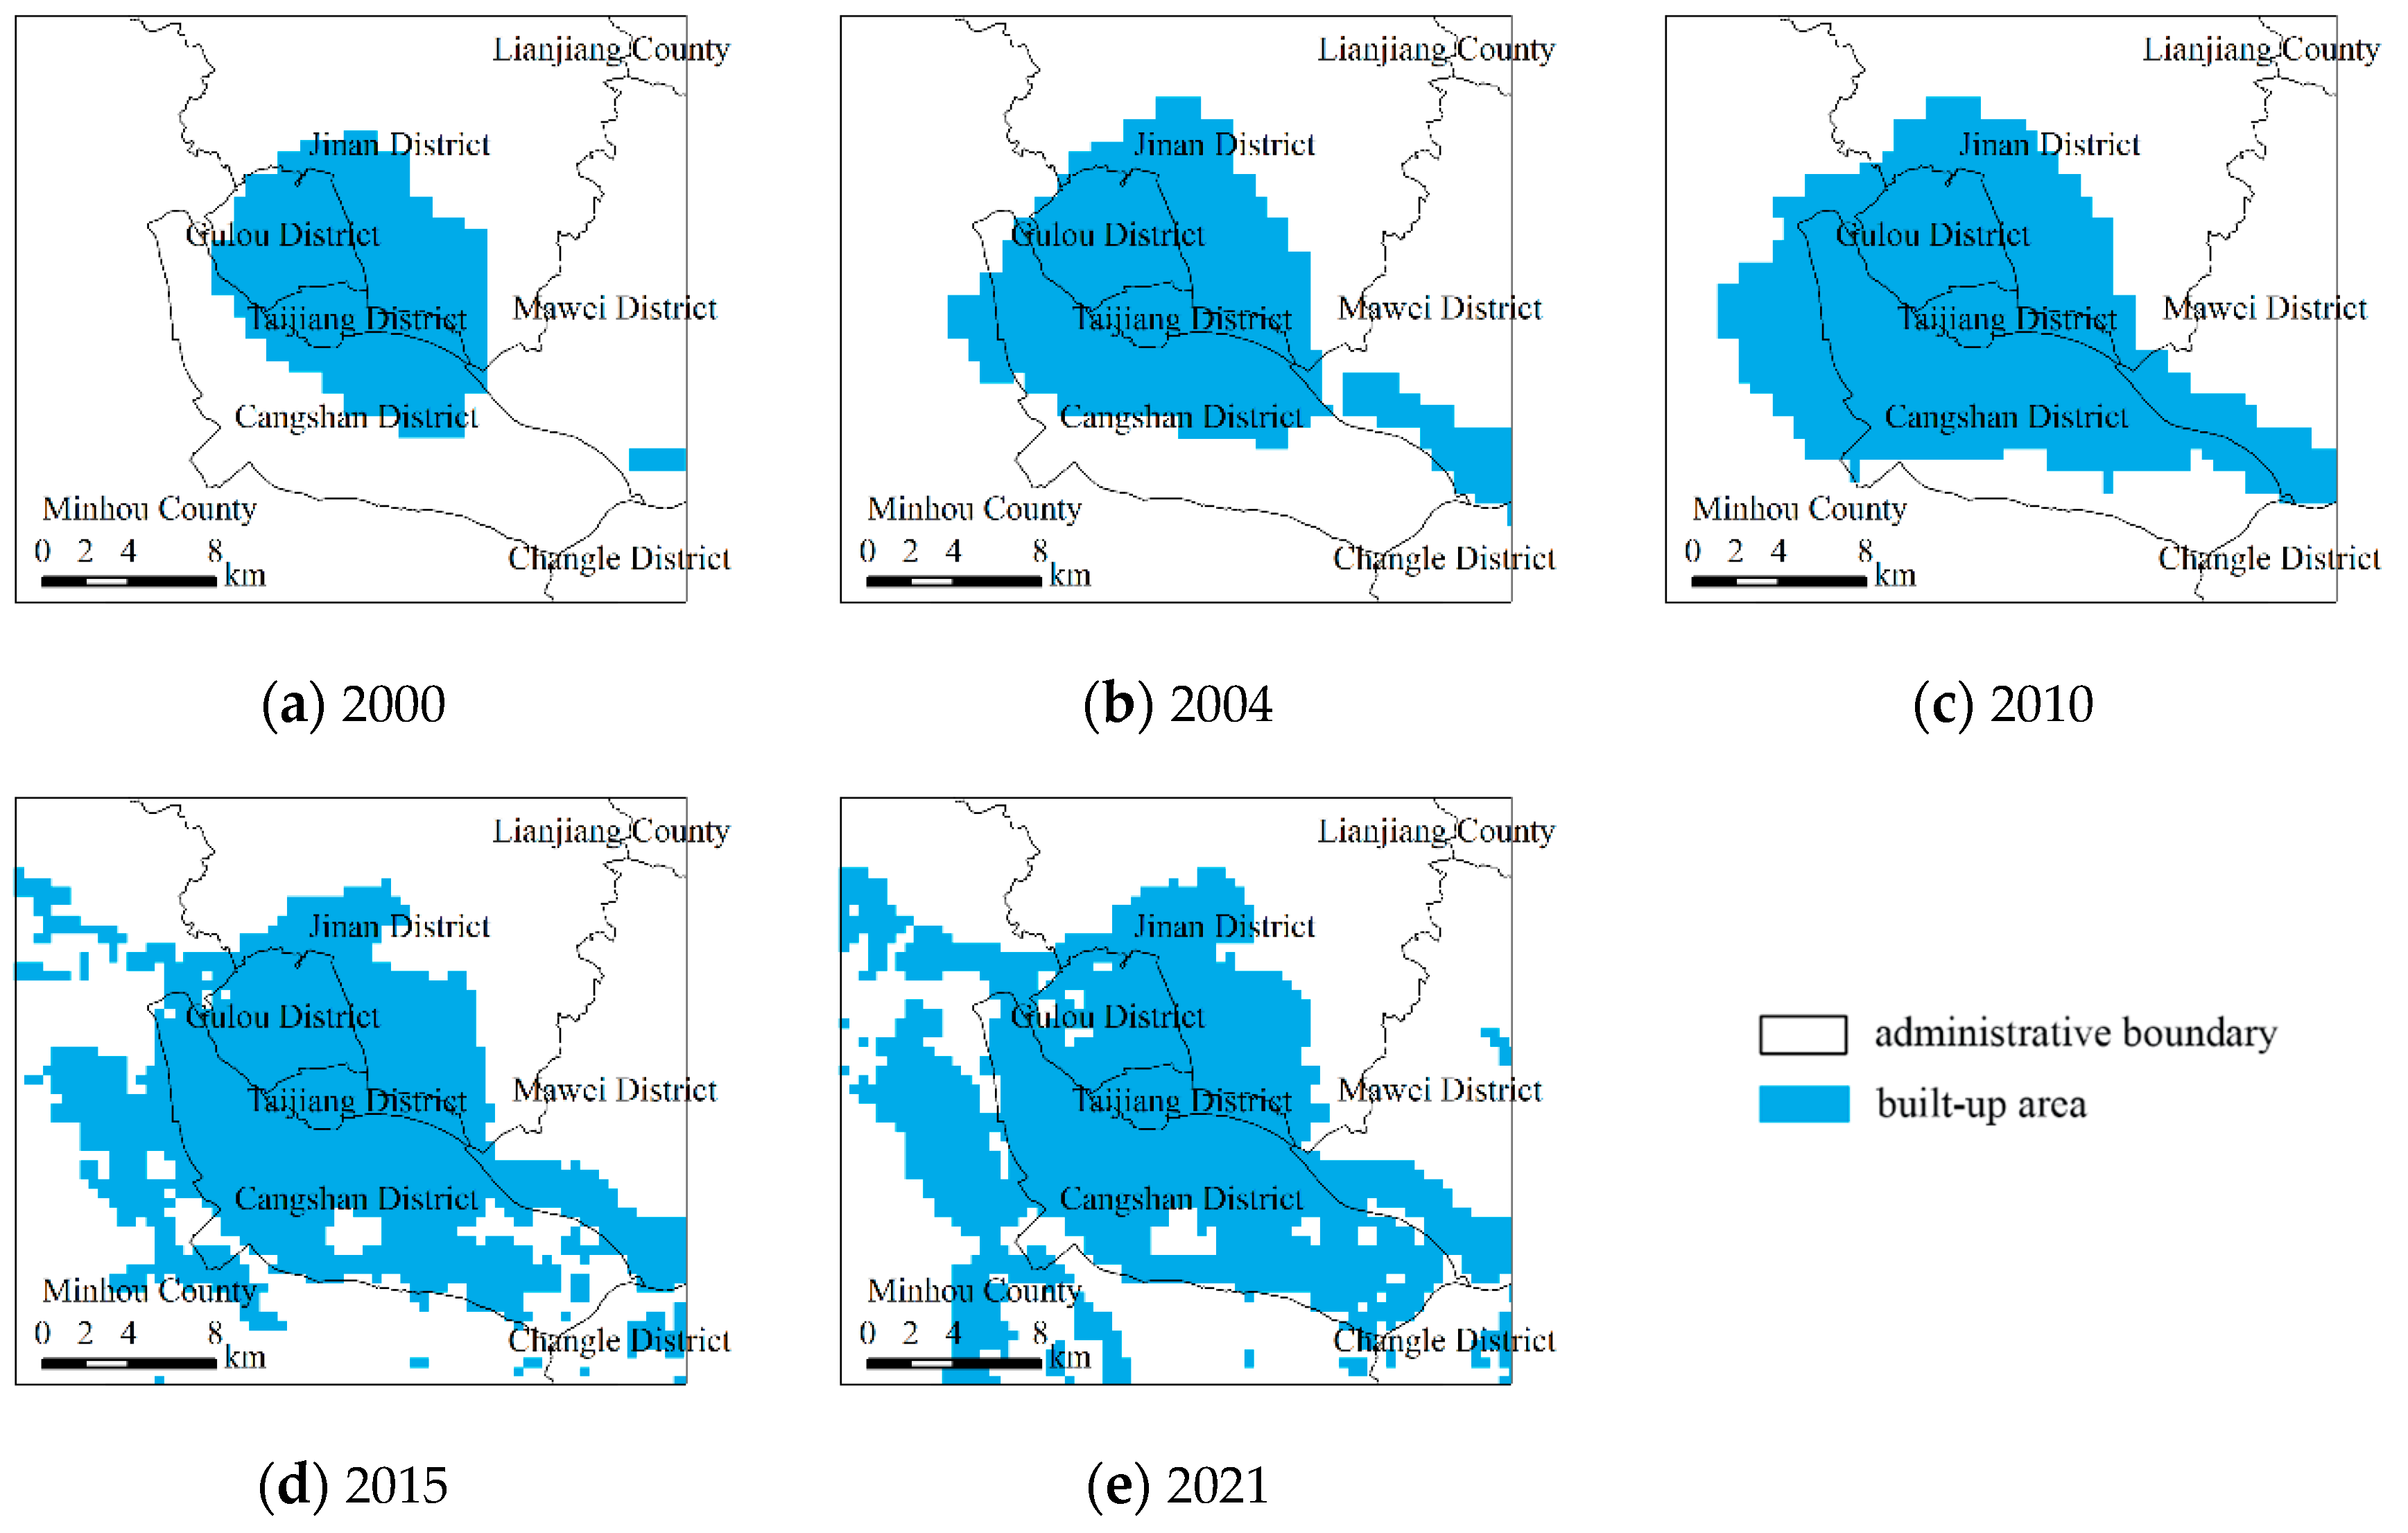
4.1. Extraction Results of Built-Up Area

The results of extracting impervious surfaces in each year by CBI are shown in Figure 5.
On the basis of impervious surface, morphological corrosion treatment, void removal treatment and improvement of built-up area were carried out to extract built-up area (Figure 6), and finally the built-up area images of each year were obtained (Figure 7).
As shown in Figure 8, the red area is the built-up area extracted based on NTL data, the green area is the built-up area extracted based on Landsat image, and the yellow area is the overlapping part of the two. Through visual interpretation, it can be found that the built-up area outline extracted based on NTL data basically covers the built-up area, and the extraction effect is well. The verification accuracy of each year is shown in Table 4. From the table, it can be seen that the error rate of each year is less than 4%, and the extraction accuracy meets the requirements.
For the convenience of later analysis, the NTL brightness data in the built-up area was obtained by multiplying the binary image. According to the above steps, the built-up area images of NTL in each year were extracted (Figure 9), and the temporal and spatial change map of the Fuzhou built-up area based on NTL data can be obtained by superimposing them (Figure 10).

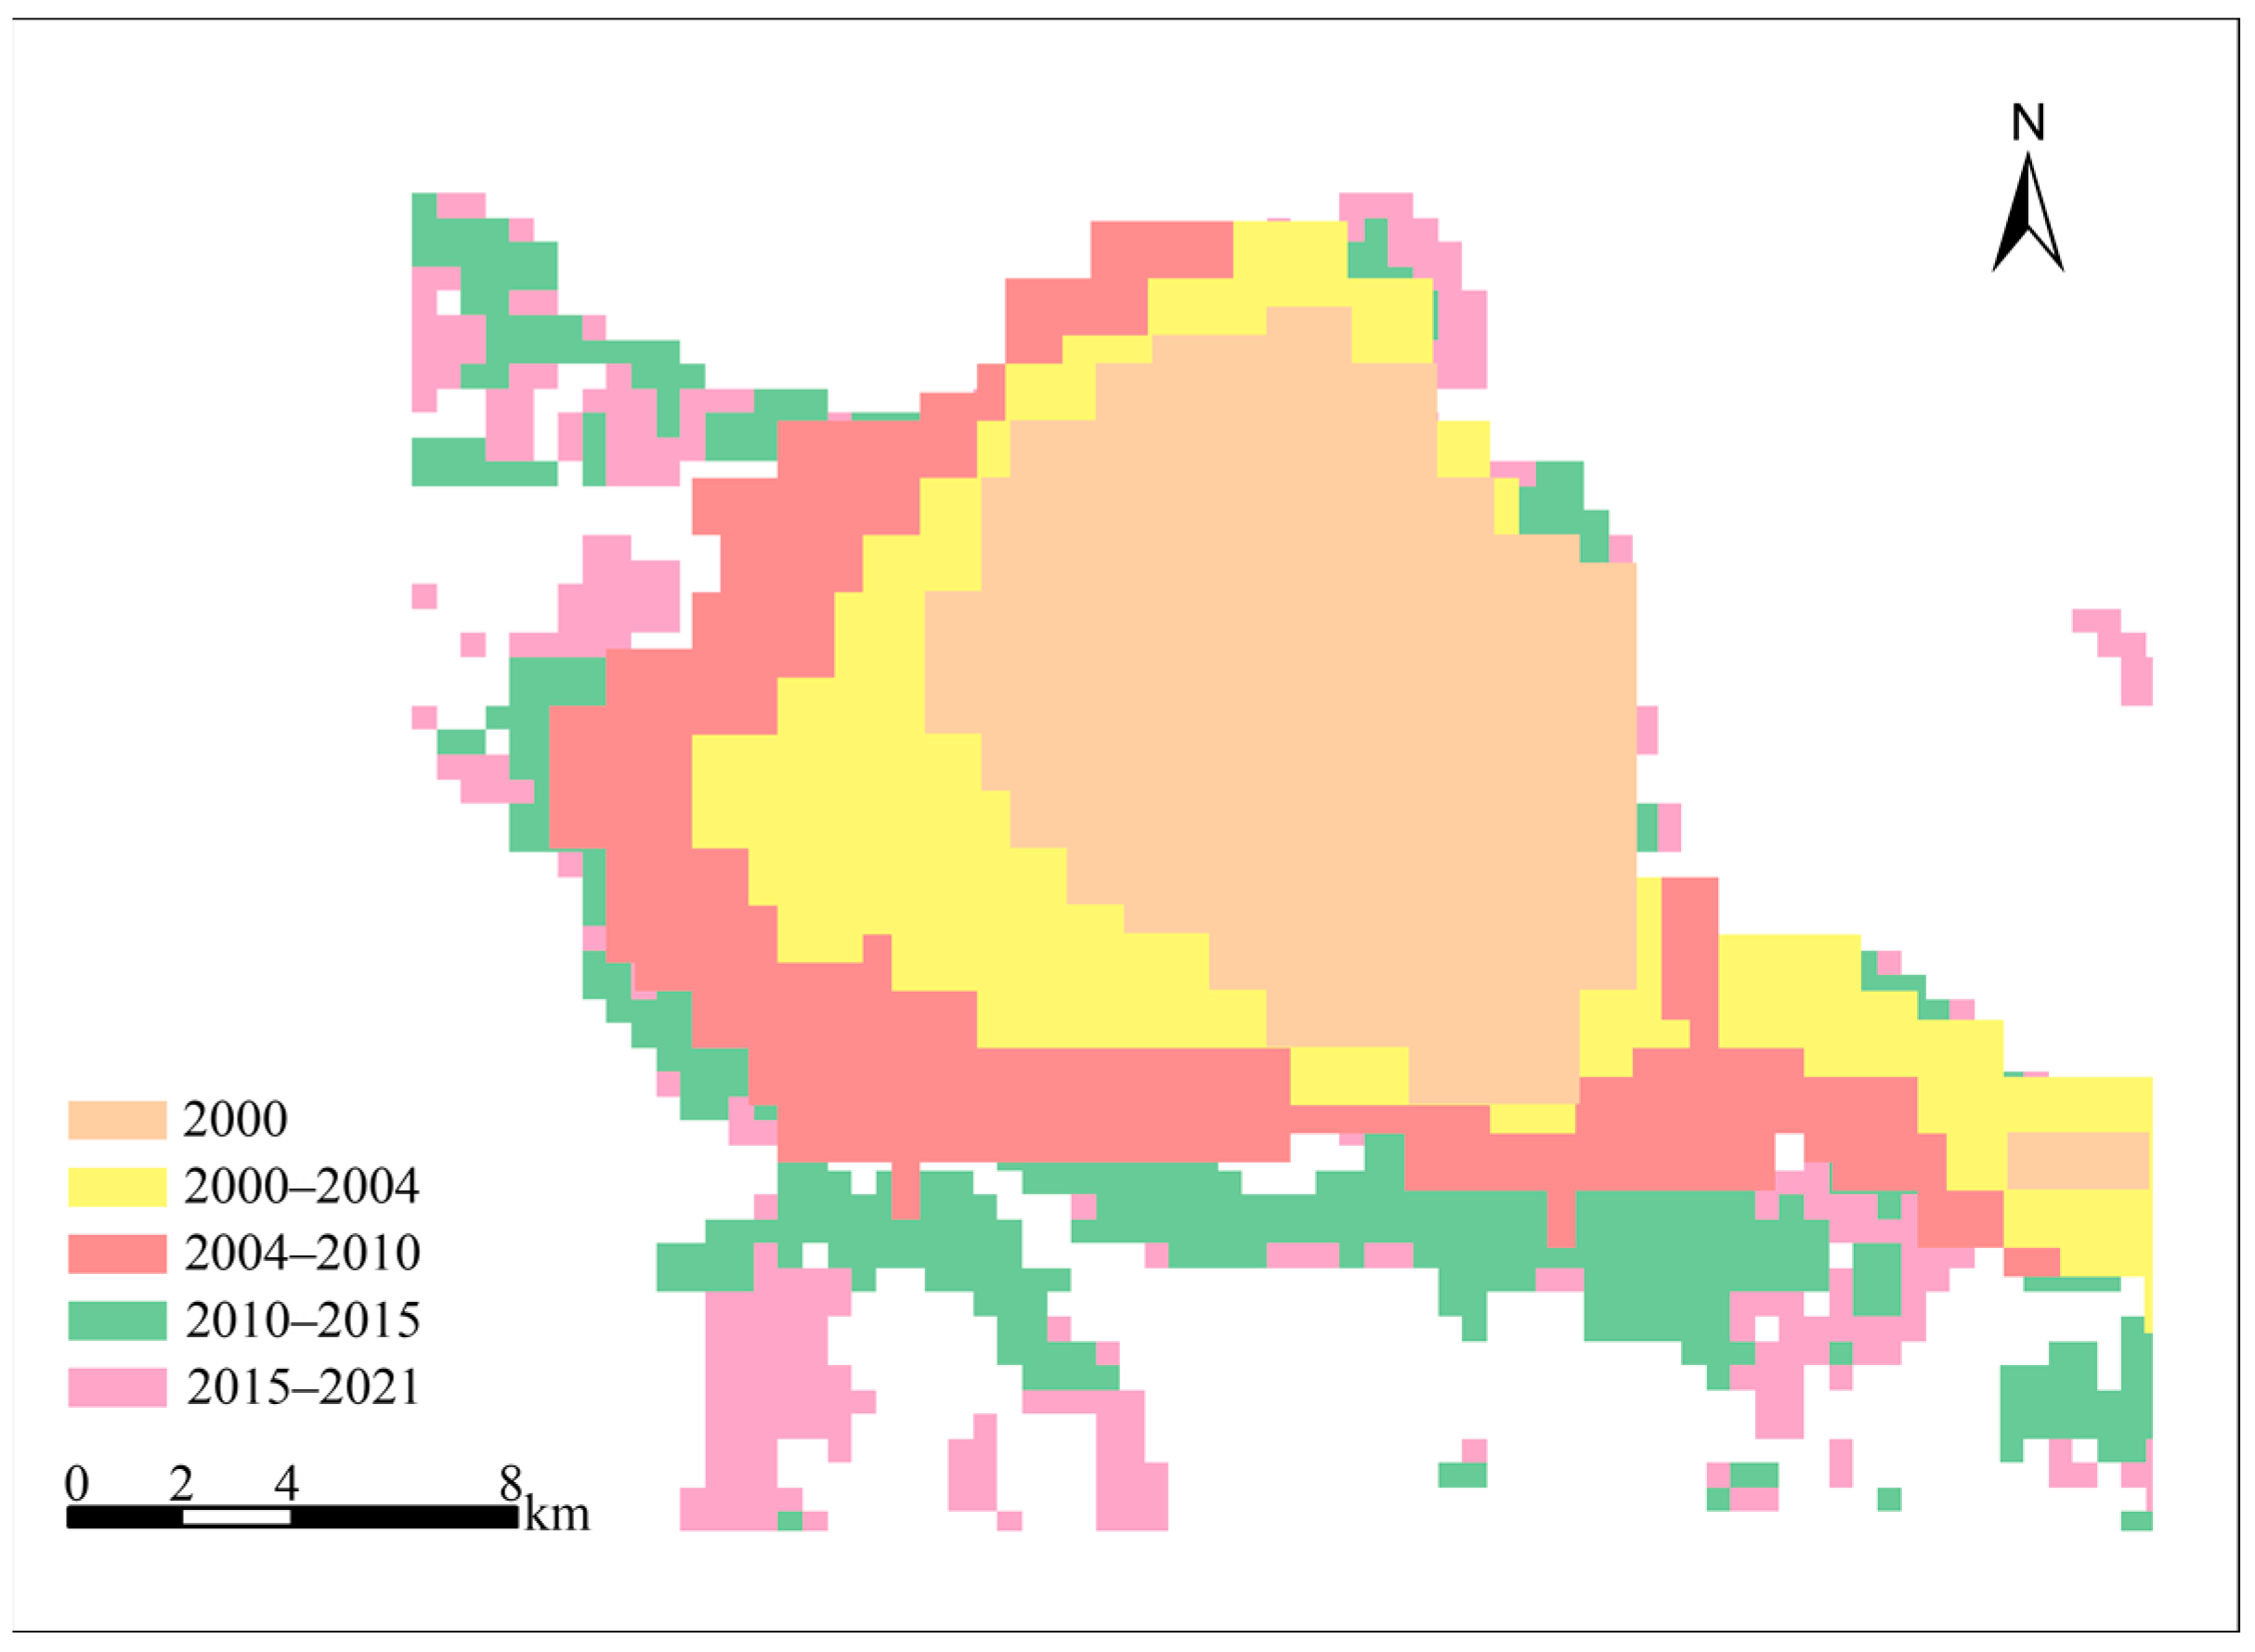
4.2. Results of Spatio-Temporal Dynamic Development

The results obtained according to Equation (10) are shown in Figure 11. The rising nighttime light index represents the continuous improvement of the overall urbanization level of Fuzhou from 2000 to 2021. Among them, the urbanization level from 2000 to 2004 grows slowly, which is due to the fact that Fuzhou is still in the early stage of development, lacking the corresponding financial ability to carry out a large number of urban construction projects, and lacking municipal facilities and public facilities. Since then, the urbanization level has been steadily improving in each year, among which the urbanization growth is the fastest from 2015 to 2021. At this stage, the municipal facilities and public facilities in the built-up area of Fuzhou are relatively perfect, and the economy is developing rapidly, so the urbanization level is high.
Analysis of Figure 12 shows that the changing trend of expansion speed (Equation (11)) and expansion intensity (Equation (12)) of the Fuzhou built-up area is basically consistent, showing a trend from fast to slow, then accelerating and then slowing down. Among them, the expansion speed from 2000 to 2004 is 16.3924 km2 per year, which is the fastest expansion period. After that, the expansion speed slowed down by 7.2787 from 2004 to 2010 and then increased to 15.8010 km2 a year from 2010–2015. The overall fluctuation range of expansion intensity is smaller than that of expansion speed and fluctuates between 1.0780 and 1.9389.
The results in Section 3.3.3 are shown in Figure 13. It shows that the built-up area of Fuzhou mainly expands to the west, southwest and southeast, and the least expands to the east and northeast. The urban expansion shows the trend of “expanding eastward, advancing southward and expanding westward”, which is related to Fuzhou’s geographical location, government policies, and other factors. Fuzhou is dominated by basins and surrounded by mountains. The overall terrain inclines from west to east. From 1976 to 1986, Fuzhou mainly expanded to the north but was soon blocked by Lianhua Peak in the north. From 1986 to 1996, Fuzhou mainly expanded to the east, but only to the foot of Gushan Mountain [27]. Therefore, after 1996, the built-up area of Fuzhou will mainly expand in the west and south, which is consistent with the conclusion of this paper.
From 2000 to 2004, the built-up area of Fuzhou expanded by 21.73 km2 to the west, 15.93 km2 to the southwest, and 21.82 km2 to the southeast, mainly because Fuzhou accelerated the construction of Jinshan and Gushan, basically completed the Fuzhou section of Sanfu Expressway and the third phase of the Second Ring Road, and further improved the urban road network structure. From 2004 to 2010, it expanded 24.66 km2 to the west, 22.6 km2 to the southwest, and 10.28 km2 to the northwest, which is the period with the largest expansion area in the above directions. At this stage, Minhou University Town and Jinshan New District took shape, and successively implemented the construction of key projects such as Minjiang Avenue, Pushang Bridge, and Fuzhou-Xiamen Railway. From 2010 to 2015, it mainly expanded to the south, with an expanded area of 10.87 km2, accelerating the construction of Metro Line 1, Sanjiangkou, and other projects. From 2015 to 2021, it expanded by 10.47 km2 to the southwest and 9.17 km2 to the southeast. During this period, Fuzhou accelerated the construction of Binhai New Area, “Fuzhou at Sea” and other major projects, and promoted the construction of Fuzhou as a modern international metropolis.
Fuzhou, as one of the key development cities in the economic zone on the west coast of Taiwan, has grasped the development opportunity well, which makes the economic development steadily improve and the urbanization level continuously improve. The infrastructure of Minhou University City, Nantai Island, Qingkou Automobile City, Kuai’an, and other places has been continuously improved, which makes the built-up area expand continuously in space, which is in line with the development strategy of “expanding eastward, advancing southward and expanding westward”.

4.3. Results of Spatial Morphology Evolution

The results obtained according to Equations (13) and (14) are shown in Figure 14. The fractal dimension of the Fuzhou built-up area shows an overall upward trend, which shows that the urban land use in Fuzhou built-up area tends to be complicated and the spatial morphology tends to be irregular from 2000 to 2021, mainly externally oriented development. The fractal dimension in 2000 is 1.06, which is the lowest year in the study period, indicating that the urban land use in Fuzhou is relatively simple and the spatial form is relatively regular at this time. Compared with 2004, the fractal dimension in 2010 decreased by 0.06, which demonstrates that 2010 is an internal development compared with 2004. Between 2010–2015 is the period of the fastest rising fractal dimension, manifesting that this stage is mainly outward development, and the complexity of urban spatial form is deepening rapidly. The fractal dimension in 2021 is close to that of 2015, with little change.
The overall compactness of the built-up area in Fuzhou shows a downward trend, which shows that the spatial form of the built-up area in Fuzhou tends to be narrow and long during 2000–2021. The compactness of the Fuzhou built-up area in 2000 is 0.77, which is the closest year to 1 in the study period, indicating that the urban space at this time is relatively compact and the spatial form is relatively round. The compactness in 2010 increased by 0.06 compared with that in 2004, which is mainly due to the fact that the Fuzhou built-up area paid equal attention to axial expansion and internal filling in the process of expansion. From 2010 to 2015, the compactness decreased fastest, demonstrating that the spatial structure of cities and towns tends to be scattered and the urban form changes obviously in this stage. There is little difference in fractal dimension between 2021 and 2015, and the change range of spatial form is relatively gentle.
The results in Section 3.4.3 are shown in Table 5. The center of gravity of the built-up area shifted by 0.9605 km in the direction of 25.65° south by west from 2000 to 2004. From 2004 to 2010, the center of gravity of the built-up area shifted by 1.6015 km along the direction of 59.40° from south to west, which is the period with the largest offset distance of the center of gravity. From 2010 to 2015, the center of gravity of the built-up area shifted by 0.8621 km along the direction of 5.57° south to east. From 2015 to 2021, the center of gravity of the built-up area shifted by 0.3106 km along the direction of 53.25° from south to west, which is the shortest shift distance of the center of gravity.
From Figure 15, it is clear that the development route of the urban center of gravity in Fuzhou built-up area in 2000, 2004, 2010, 2015, and 2021 is Wangzhuang Street in Jin’an District-Xingang Street in Taijiang District-Yangzhong Street in Taijiang District-Cangxia Street in Taijiang District-Cangxia Street in Taijiang District. On the whole, the center of gravity of the Fuzhou built-up area has not changed much. In 2000, the center of gravity of the built-up area was in Jin’an District, then in Taijiang District, and in 2015 and 2021, the center of gravity was in Cangxia Street of Taijiang District.

5. Discussion

The built-up area obtained by remote sensing extraction only represents the impervious surface area, which cannot represent the human socio-economic condition better, so the built-up area of Fuzhou is further obtained by using remote sensing data of nighttime light on the basis of impervious surface. Since the resolution of the NTL data is much larger than that of the Landsat images, some rivers are extracted as built-up areas in the NTL data. Nevertheless, the results show that the errors of both are within 4%, validating the validity of the built-up area extraction. In future research, if the resolution of the NTL data can be improved, it is believed that the accuracy of extracting the built-up area can be further improved. The analysis in Part IV shows that the development of the built-up area is consistent with the plan, indicating the reliability of the article’s conclusions. Urbanization is influenced by a variety of factors. To better provide a reference for urban planning, this paper explores its relationship with urbanization in terms of both driving forces and impact factors.

5.1. Driving Forces

The grey relational analysis method was used to calculate the relationship between 12 indicators including population factors, economic factors, social factors, and the built-up area, and the results are shown in Table 6. The results show that population factors and economic factors have a strong correlation with the expansion of built-up areas, while social factors have relatively little influence on the expansion of built-up areas. Therefore, this paper divided the indicators with a correlation degree greater than 0.85 into population factors and economic factors and discussed their relationship with the expansion of built-up areas, respectively.

5.1.1. Population Factors

Population growth has a direct impact on urban land expansion. With the increase in urban population, cities need to develop more construction land for work, life, and study, which will expand the scope of built-up areas. With the development of Fuzhou, its population is also growing, and the urban population has increased from 1,484,900 in 2000 to 6,146,600 in 2021. According to the calculation, the annual increase rate of the urban population in Fuzhou in the past 21 years is 14.95%, while the annual increase rate of the built-up area in this period is 13.85%. The ratio of the annual increase rate of the population to the annual increase rate of urban land use is 1:0.93, which is close to the reasonable ratio of 1:1.12 stipulated in the Comprehensive Report of Urban Land Use Forecast in 2000, indicating that the urban development of Fuzhou is relatively healthy. The population and the built-up area from 2000 to 2021 were fitted (Figure 16), and the results show that they are positively correlated and closely related. According to the development goal of Fuzhou, the population of Fuzhou will reach 10 million by 2030. According to the trend method, the built-up area of Fuzhou will reach 559.04 km2 by then. At present, Fuzhou is making every effort to build “Fuzhou by the Sea” and develop into an international metropolis. In this process, the area of construction land will inevitably be expanded. Therefore, how to reasonably control the speed of urban development and make the population, land, and environment develop harmoniously is an inevitable problem and a major challenge for Fuzhou to formulate development strategies.

5.1.2. Economic Factors

Economic development factors, such as economic growth and industrial structure adjustment, have an impact on the type and area of urban land use, which leads to the change in urban spatial structure. Fuzhou is not only the economic and cultural center on the west side of the Straits but also the gateway of the Maritime Silk Road. With the support of its superior geographical position, reform and opening up, and the construction of the west coast, Fuzhou’s economy has developed obviously, and its economic strength has been continuously enhanced.
The regression equation y = 0.642x1 + 0.524x2 + 0.472x3 + 0.619 (R2 = 0. 981) is obtained by taking the per capita GDP (x1), the average wage of employees (x2) and the regional GDP (x3) in Table 6 as independent variables and the built-up area as dependent variables. The results show that the above three evaluation indexes all promote the expansion of built-up areas, among which the per capita GDP plays the most significant role. With the increase in income and the change in ideas, people are no longer satisfied with eating and wearing warm clothes but pursue a higher quality living environment and spiritual enjoyment. Therefore, the corresponding facilities such as entertainment, transportation, fitness, and education are constantly increasing and improving, and the area of built-up area is also showing a rapid expansion trend. Economic growth and the expansion of built-up areas are positively correlated and closely related. Economic development promotes the construction and improvement of commercial land and supporting facilities and directly affects urban expansion.
Different industrial structures have different demands for urban land types, which will directly affect the form, scale, and location of urban development. According to the development law of urbanization, the industrial center of gravity of cities generally shifts from the primary industry to the secondary industry and then to the tertiary industry. Due to the theory of differential land rent and the improvement of environmental protection awareness, industrial land is gradually transferred to suburbs with low land rent and small population, while the replaced central city is developed into commercial land and residential land, realizing the transformation of land use types and forming new industrial agglomeration. When the industrial structure is relatively stable, the urban land use type and spatial pattern are also relatively stable. Figure 17 shows that the proportion of primary industry is decreasing year by year, from 15.42% in 2000 to 5.6% in 2021, which indicates that with the development of urbanization, a large amount of agricultural land is gradually converted into construction land. The proportion of the secondary industry is characterized by stages, showing a trend of increasing first and then decreasing. From 2000 to 2004, the secondary industry contributed the most to the economic growth of Fuzhou, which showed that Fuzhou vigorously developed its industry at this stage, and the rise of industrial parks such as the Fuxing Investment Development Zone and Xindian District also confirmed this view. After 2004, the proportion of the tertiary industry surpassed the primary industry and the secondary industry, demonstrating that with the increasingly prominent environmental problems brought by industrial development, Fuzhou began to adjust its industrial structure, and the tertiary industry developed rapidly. The tertiary industry became the main driving force to promote economic development, which was consistent with the development of the Jingxi Group and the High-tech Industrial Park in this period.

5.2. Impact Factors

5.2.1. Natural Conditions

Cities are built on the basis of the natural environment. Terrain, climate, soil, hydrology, and other factors will affect the expansion of cities. For example, the decrease in precipitation will affect the growth of vegetation, resulting in a decrease in vegetation coverage. Fuzhou is located in a low latitude region, and its climate belongs to the subtropical marine monsoon climate, which is suitable for the growth of subtropical cash crops, and its crops can reach two or three crops a year. Zonal soils such as laterite and terracotta provide good soil conditions for economic forestry such as palm, bamboo, and citrus. There are many kinds of characteristic products such as fruits and vegetables, tea, and aquatic products, which sell well all over the world. A wide variety of high-quality crops have accelerated the economic growth of Fuzhou to a certain extent, and also laid a foundation for the development of Fuzhou.
Topographic conditions affect the spatial structure of cities by influencing the form of urban expansion. Fuzhou is surrounded by mountains and rivers, and its landform is mostly estuary basin, with high terrain in northwest and low terrain in southeast. Most of the urban areas are located in the plain area of the lower reaches of Minjiang River, surrounded by mountains and hills. Therefore, the early expansion of Fuzhou was quickly blocked by Lianhua Peak in the north and the foothills of Gushan Mountain in the east. After 1996, the built-up area of Fuzhou mainly expanded in the west and south. Minjiang River, as the mother river of Fuzhou, runs through Fuzhou’s urban area, which makes Fuzhou’s development have the characteristics of “blending rivers and cities and developing along the Yangtze River”. In addition, with the establishment of the bridge across the river, the originally scattered urban groups are gradually connected together, realizing the rapid development of the city.

5.2.2. Policy Guidance

Government decision-making and planning guidance affect the expansion of built-up areas. Fuzhou, as a key city in the economic zone on the west side of the Taiwan Straits, actively builds new districts, adjusts its industrial structure, and promotes the built-up areas of Fuzhou to expand outward. The group distribution in Fuzhou is shown in Figure 18. Kuaian New District is the product of the government’s support for the construction of high-tech industrial zones. Fuzhou Urban Master Plan (1995–2010) proposed building a new entrepreneurial district and a high-tech industrial park for overseas students in the Kuaian area. With the introduction of a large number of high-tech talents and the settlement of companies, the Kuaian area has expanded rapidly, making the old city connected with Mawei District, and the built-up area of Fuzhou developed to the south. Under the influence of this plan, Fuxing Investment Development Zone was also developing and expanding, advancing to the foot of Gushan Mountain, while Xindian District mainly developed light industry, which developed rapidly. Influenced by Fuzhou Master Plan (2011–2020), Jingxi Group, Haixi High-tech Industrial Base, Jinshan Industrial Zone, and other places have developed rapidly. Among them, Jingxi Group took recreation and health new city as its development orientation, Haixi High-tech Industrial Base focused on building modern high-tech technology parks and business centers, and Jinshan Industrial Zone had become an important part of Fuzhou’s central city.
Under the influence of macro-policies, Fuzhou will make overall plans for population, industry, and land use, reduce the environmental pressure in densely populated areas by rationally diverting population agglomeration, further optimize the industrial structure, focus on developing the tertiary industry and stimulate economic growth. The Master Plan of Fuzhou New Area (2015–2030) proposed that Fuzhou New Area will take the “three seas” of the strait, sea silk, and ocean as the main line of development, and focus on building a travel traffic circle, improving the density of road network, enhancing the function of the comprehensive transportation hub, focusing on Sanjiangkou, Minjiang Estuary and Binhai New Area to expand the space and promote the development of urban coastal areas along the network.
Urban planning, as the main means of government intervention, controls, and guides the development and construction of cities to a certain extent. Understanding the current level of urbanization can provide aid in decision-making when formulating economic development strategies, adjusting the focus of development in a timely manner, and avoiding an imbalance between economic development and urban construction.

6. Conclusions

For a better understanding of urban expansion, this paper extracts built-up areas based on NTL data using the urban areas extracted from Landsat images as auxiliary data and explores the changes in the spatial and temporal characteristics of the Fuzhou built-up area. The correlation between 12 indicators including demographic, social, and economic factors and the expansion of built-up areas is investigated by using gray correlation analysis, and the driving force of each indicator is discussed.
The urbanization level of Fuzhou is gradually improving. In the past 21 years, the compound nighttime light index of Fuzhou has increased from 0.0105 to 0.0635, an increase of 0.053. The trend of expansion speed and expansion intensity of the Fuzhou built-up area is consistent, showing the changing trend of first fast and then slow, then accelerating and then slowing down. The built-up area of Fuzhou is mainly developed by extension, and the spatial form tends to be irregular. Restricted by geographical conditions, the early urban expansion of Fuzhou was hindered by Lianhua Peak in the north and the foothills of Gushan Mountain in the east. Therefore, the expansion of the built-up area in Fuzhou showed a trend of “expanding eastward, advancing southward, and expanding westward” during the study period.
Population growth and economic growth are positively and closely related to the expansion of built-up areas, and natural conditions and policy guidance affect the mode and direction of urban expansion. The results of the grey relational analysis show that population factors and economic factors have a strong correlation with the expansion of built-up areas, while social factors have relatively little influence on the expansion of built-up areas. Selecting natural conditions and policy factors as the influencing factors of urban built-up area expansion in Fuzhou, the results indicate that climate, topography, and other conditions affect the urban spatial structure by influencing vegetation coverage and urban expansion form, and government decision-making and planning guidance affect the direction and mode of urban built-up area expansion.

Author Contributions

Conceptualization, Y.G.; methodology, Y.G.; validation, F.Z.; formal analysis, F.Z.; writing—original draft, F.Z.; writing—review and editing, Y.G.; supervision, Y.G. All authors have read and agreed to the published version of the manuscript.

Funding

This research was funded by Nature Science Foundation of Fujian, China, grant number 2019J01649, and Opening Fund of Key Laboratory of Geohazard Prevention of Hilly Mountains, Ministry of Natural Resources (Fujian Key Laboratory of Geohazard Prevention), China, grant number FJKLGH2021K002.

Institutional Review Board Statement

Not applicable.

Informed Consent Statement

Not applicable.

Data Availability Statement

For experimental data, please contact [email protected].

Acknowledgments

The authors would like to thank USGS and Geospatial Data Cloud for providing Landsat data, and NOAA for providing DMSP/OLS data and NPP-VIIRS data. We are also grateful to the reviewers and editors for their valuable comments and edits in this article.

Conflicts of Interest

The authors declare no conflict of interest.

References

  1. Zhang, T.; Liang, J.; Song, J. Summarization of studies on measuring of urbanization in China. Urban Dev. Stud. 2022, 2, 36–41. [Google Scholar]
  2. Fang, C. The urbanization and urban development in China after the reform and opening-up. Econ. Geogr. 2009, 29, 19–25. [Google Scholar]
  3. Zhang, X.; Li, P. A temperature and vegetation adjusted NTL urban index for urban area mapping and analysis. ISPRS J. Photogramm. 2018, 135, 93–111. [Google Scholar] [CrossRef]
  4. Levin, N.; Kyba, C.C.M.; Zhang, Q.; Alejandro, S.M.; Roman, M.O.; Li, X.; Portnov, B.A.; Molthan, A.L.; Jechow, A.; Miller, S.D.; et al. Remote sensing of night lights: A review and an outlook for the future. Remote Sens. Environ. 2020, 237, 111443. [Google Scholar] [CrossRef]
  5. Xu, J.; Song, J.; Li, B.; Liu, D.; Cao, X. Combining night time lights in prediction of poverty incidence at the county level. Appl. Geogr. 2021, 135, 102552. [Google Scholar] [CrossRef]
  6. Croft, T.A. Nighttime Images of the Earth from Space. Sci. Am. 1978, 239, 86–101. [Google Scholar] [CrossRef]
  7. Ma, L.; Wu, J.; Li, W.; Peng, J.; Liu, H. Evaluating Saturation Correction Methods for DMSP/OLS Nighttime Light Data: A Case Study from China’s Cities. Remote Sens. 2014, 6, 9853–9872. [Google Scholar] [CrossRef] [Green Version]
  8. Li, X.; Zhou, Y. A Stepwise Calibration of Global DMSP/OLS Stable Nighttime Light Data (1992–2013). Remote Sens. 2017, 9, 637. [Google Scholar] [CrossRef] [Green Version]
  9. Mukherjee, S.; Srivastav, S.K.; Gupta, P.K.; Hamm, N.A.S.; Tolpekin, V.A. An Algorithm for Inter-calibration of Time-Series DMSP/OLS Night-Time Light Images. Proc. Natl. Acad. Sci. India Sect. A Phys. Sci. 2017, 87, 721–731. [Google Scholar] [CrossRef]
  10. Henderson, M.; Yeh, E.T.; Gong, P.; Elvidge, C.; Baugh, K. Validation of urban boundaries derived from global night-time satellite imagery. Int. J. Remote Sens. 2003, 24, 595–609. [Google Scholar] [CrossRef]
  11. Lan, W.; Fu, B.; He, H.; Liu, M.; Gao, E.; Fan, D. Spatiotemporal dynamics of urban patterns in Guangxi based on multi-temporal night-light and optical remote sensing data. J. Guilin Univ. Technol. 2022, 2, 1–18. [Google Scholar]
  12. Mi, X.; Bai, Y.; Tan, X.; Lu, N.; Peng, G.; Shao, Q. A new method for urban center extraction based on DMSP/OLS data. J. Geo-Inf. Sci. 2013, 15, 225–261. [Google Scholar]
  13. Pandey, B.; Joshi, P.K.; Seto, K.C. Monitoring urbanization dynamics in India using DMSP/OLS night time lights and SPOT-VGT data. Int. J. Appl. Earth. Obs. 2013, 23, 49–61. [Google Scholar] [CrossRef]
  14. Li, K.; Chen, Y. A Genetic Algorithm-based urban cluster automatic threshold method by combining VIIRS DNB, NDVI, and NDBI to monitor urbanization. Remote Sens. 2018, 10, 277. [Google Scholar] [CrossRef]
  15. Stokes, E.C.; Seto, K.C. Characterizing urban infrastructural transitions for the Sustainable Development Goals using multi-temporal land, population, and nighttime light data. Remote Sens. Environ. 2019, 234, 111430. [Google Scholar] [CrossRef]
  16. Zhang, Q.; Schaaf, C.; Seto, K.C. The vegetation adjusted NTL urban index: A new approach to reduce saturation and increase variation in nighttime luminosity. Remote Sens. Environ. 2013, 129, 32–41. [Google Scholar] [CrossRef]
  17. Zheng, Y.; He, Y.; Zhou, Q.; Wang, H. Quantitative Evaluation of Urban Expansion using NPP-VIIRS Nighttime Light and Landsat Spectral Data. Sustain. Cities Soc. 2022, 76, 103338. [Google Scholar] [CrossRef]
  18. Xu, H. Image-based normalization Technique used for Landsat TM/ETM+ Imagery. Geomat. Inf. Sci. Wuhan Univ. 2007, 01, 62–66. [Google Scholar]
  19. Elvidge, C.D.; Ziskin, D.; Baugh, K.E.; Tuttle, B.T.; Ghosh, T.; Pack, D.W.; Erwin, E.H.; Zhizhin, M. A Fifteen Year Record of Global Natural Gas Flaring Derived from Satellite Data. Energies 2009, 2, 595–622. [Google Scholar] [CrossRef]
  20. Zou, J.; Chen, Y.; Tian, J.; Wang, T. Construction of the calibration model for DMSP/OLS nighttime images based on ArcGIS. J. Geomat. 2014, 39, 33–37. [Google Scholar] [CrossRef]
  21. Guan, J.; Li, D.; Wang, Y.; Wang, X. DMSP-OLS and NPP-VIIRS night light image correction in China. Bull. Surv. Mapp. 2021, 9, 1–8. [Google Scholar] [CrossRef]
  22. Zha, Y.; Gao, J.; Ni, S. Use of normalized difference built-up index in automatically mapping urban areas from TM imagery. Int. J. Remote Sens. 2003, 24, 583–594. [Google Scholar] [CrossRef]
  23. Xu, H. Analysis of Impervious Surface and its Impact on Urban Heat Environment using the Normalized Difference Impervious Surface Index (NDISI). Photogramm. Eng. Remote Sens. 2010, 76, 557–565. [Google Scholar] [CrossRef]
  24. Zhang, F.; Gao, Y. Composite Extraction Index to Enhance Impervious Surface Information in Remotely Sensed Imagery. Egypt. J. Remote Sens. Space Sci. 2023, 26, 141–150. [Google Scholar] [CrossRef]
  25. Kriegler, F.J.; Malila, W.A.; Nalepka, R.F.; Richardson, W. Preprocessing Transformations and Their Effects on Multispectral Recognition. Remote Sens Environ. 1969, VI, 97–132. [Google Scholar]
  26. Xu, H. Modification of normalised difference water index (NDWI) to enhance open water features in remotely sensed imagery. Int. J. Remote Sens. 2006, 27, 3025–3033. [Google Scholar] [CrossRef]
  27. Xu, H. Urban Expansion Process in the Center of the Fuzhou Basin, Southeast China in 1976–2006. Sci. Geogr. Sin. 2011, 31, 351–357. [Google Scholar] [CrossRef]
Figure 1. Introduction to the study area. (a) Geographical location map of the study area. (b) Topographical map of the study area.
Sustainability 15 02423 g001
Figure 2. Comparison of DMSP/OLS data before and after correction.
Sustainability 15 02423 g002
Figure 3. Comparison of VPP-NIIRS data before and after correction.
Sustainability 15 02423 g003
Figure 4. Technology roadmap.
Sustainability 15 02423 g004
Figure 5. Extraction results of impervious surface in each year.
Sustainability 15 02423 g005
Figure 6. Extraction of built-up area based on impervious surface (taking 2000 as an example).
Sustainability 15 02423 g006
Figure 7. Extraction results of built-up areas in each year.
Sustainability 15 02423 g007
Figure 8. Accuracy verification of built-up area based on NTL data extraction (taking 2000 as an example).
Sustainability 15 02423 g008
Figure 9. Extraction results of built-up areas in each year of NTL data.
Sustainability 15 02423 g009
Figure 10. Temporal and spatial change map of built-up area based on NTL data.
Sustainability 15 02423 g010
Figure 11. Dynamic evolution analysis of CNLI in Fuzhou built-up area.
Sustainability 15 02423 g011
Figure 12. Analysis of expansion speed and expansion strength of built-up area in Fuzhou.
Sustainability 15 02423 g012
Figure 13. Analysis of expansion direction of built-up area in Fuzhou.
Sustainability 15 02423 g013
Figure 14. Spatial morphology evolution map of built-up area in Fuzhou.
Sustainability 15 02423 g014
Figure 15. Migration roadmap of center of gravity.
Sustainability 15 02423 g015
Figure 16. Fitting map of population and built-up area in Fuzhou.
Sustainability 15 02423 g016
Figure 17. Changes in the proportion of three major industries in Fuzhou.
Sustainability 15 02423 g017
Figure 18. Schematic diagram of Fuzhou development area.
Sustainability 15 02423 g018
Table 1. Remote sensing image data information.
SatelliteSensorsImage DateSpatial Resolution (m)Radiation Resolution (bit)
Landsat7ETM+2000-05-0415, 30, 608
Landsat5TM2004-10-3030, 1208
Landsat5TM2010-10-3130, 1208
Landsat8OLI2015-09-2715, 30, 10016
Landsat8OLI2021-09-2715, 30, 10016
Table 2. Nighttime light data information.
SatelliteSensorsImage DateSensor TypeSpatial ResolutionDescriptionLocation
DMSPOLS2000F151 kmAnnual synthetic dataGlobal
DMSPOLS2004F151 kmAnnual synthetic dataGlobal
DMSPOLS2010F181 kmAnnual synthetic dataGlobal
NPPVIIRS2015-09/500 mMonthly synthetic data75N/60E
NPPVIIRS2021-09/500 mMonthly synthetic data75N/60E
Table 3. Regression model parameters of multi-sensor mutual correction.
SensorYearabcR2
F1420000.00320.84171.93650.8498
F1520000.00650.54523.70700.8095
F152004−0.00701.39111.18710.9021
F162004−0.00070.99631.37300.8576
F1820100.00860.25853.51620.8716
Table 4. Verification of extraction accuracy of built-up area.
YearArea of Built-Up Area Extracted from Landsat Image (km2)Area of Built-Up Area Extracted from NTL Data (km2)Error ValueError Rate (%)
200091.338688.8600−2.4786−2.79%
2004156.9080154.4535−2.4545−1.59%
2010211.5900220.04468.45463.84%
2015290.5950295.33234.73731.60%
2021356.9980358.27291.27490.36%
Table 5. Calculation results of center of gravity migration in built-up area of Fuzhou.
YearX (km)Y (km)Offset Distance (km)Offset Angle (°)
2000731.87262885.9664//
2004731.45682885.10050.9605115.65
2010730.07842884.28521.6015149.40
2015730.16202883.42730.862184.43
2021729.91312883.24140.3106143.25
Table 6. Grey correlation coefficient and correlation value of built-up area in Fuzhou from 2000 to 2021.
Classification IndicatorsCategory20002004201020152021RelevanceRelevance Ranking
GDP per capita (CNY)Economic10.97030.95260.87760.69710.89951
The proportion of tertiary industry (%)Economic10.93660.89290.83180.79500.89132
Resident population (10 thousand people)Population10.93500.89130.83410.79180.89043
Average wage of employees (CNY)Economic10.99170.92570.80430.68930.88224
The proportion of secondary industry (%)Economic10.93580.88550.82040.76480.88135
GDP (CNY 100 million)Economic10.98260.93000.80300.57190.85756
The proportion of primary industry (%)Economic10.91060.84610.78170.73540.85487
Total retail sales of social consumer goods (CNY 100 million)Social10.98860.83150.63160.52300.79498
Year-end deposit balances of financial institutions (CNY 100 million)Social10.94440.74350.57460.43460.73949
Financial revenue (CNY 100 million)Social10.93980.74770.53100.41990.727710
Financial expenditures (CNY 100 million)Social10.99620.79510.33330.42710.710411
Total social fixed investment (CNY 100 million)Social10.96600.59280.38100.36710.661412
Disclaimer/Publisher’s Note: The statements, opinions and data contained in all publications are solely those of the individual author(s) and contributor(s) and not of MDPI and/or the editor(s). MDPI and/or the editor(s) disclaim responsibility for any injury to people or property resulting from any ideas, methods, instructions or products referred to in the content.

