Article

Thermodynamic Investigation and Study of Kinetics and Mass Transfer Mechanisms of Oily Wastewater Adsorption on UIO-66–MnFe2O4 as a Metal–Organic Framework (MOF)

by
Abdelfattah Amari
1,2,
Heba Saed Kariem Alawameleh
3,
Mubeen Isam
4,
Mohammed Abdul Jaleel Maktoof
5,
Haitham Osman
1,
Balamurugan Panneerselvam
6,* and
Maciej Thomas
7,*
1
Department of Chemical Engineering, College of Engineering, King Khalid University, Abha 61411, Saudi Arabia
2
Research Laboratory of Processes, Energetics, Environment and Electrical Systems, National School of Engineers of Gabes, Gabes University, Gabes 6072, Tunisia
3
Department of Basic Scientific Sciences, Al-Huson College, Al-Balqa Applied University, P.O. Box 50, Al-Huson 21510, Jordan
4
Building and Construction Techniques Engineering, Al-Mustaqbal University College, Hillah 51001, Iraq
5
Department of Computer Science, Al-Turath University College, Baghdad 10070, Iraq
6
Department of Community Medicine, Saveetha Medical College, SIMATS, Chennai 602105, India
7
Faculty of Environmental Engineering and Energy, Cracow University of Technology, Warszawska 24, 31-155 Cracow, Poland
*
Authors to whom correspondence should be addressed.
Sustainability 2023, 15(3), 2488; https://doi.org/10.3390/su15032488
Submission received: 22 December 2022 / Revised: 21 January 2023 / Accepted: 25 January 2023 / Published: 30 January 2023
(This article belongs to the Special Issue Drinking Water and Wastewater Resilience)

Abstract

:
Hitherto, a considerable amount of research has been carried out to investigate the equilibrium condition of adsorption process; nevertheless, there is no comprehensive study to evaluate the surface adsorption properties of MOFs. Therefore, the adsorption mechanism and equilibrium capacity of MOFs have not been fully understood. Furthermore, the mass transfer mechanism is still unknown and so it is not possible to predict the adsorption process using MOFs. In this work, a new metal–organic framework (MOF) named UIO-66–MnFe2O4 was synthesized as an adsorbent for oily wastewater treatment. In this way the effects of temperature, amount of adsorbent, adsorption time, pH, and pollutant initial concentration were studied in the treatment of oily wastewater using the UIO-66-MnFe2O4 MOF through the adsorption process. Furthermore, to examine the process of surface adsorption, different adsorption kinetic models (pseudo-first-order, pseudo-second-order, and Elovich) have been performed for the removal of oily pollutants on MOF adsorbents and the surface adsorption mechanism has been discussed carefully. Moreover, to investigate the mass transfer mechanism of oily pollutants in the surface adsorption process, different mass transfer models (Weber and Morris, liquid film diffusion, and Bangham and Burt) have been investigated on porous adsorbents, and finally the mass transfer mechanism of the adsorption process has been proposed.

1. Introduction

With the expansion of urbanization and industrialization of human societies in the past few decades, many challenges have arisen, including global climate change [1], environmental pollution, and the reduction of natural resources [2]. Nowadays, the existence of serious and dangerous pollution in the environment has attracted a lot of attention [3]. One of these environmental concerns is oil pollution in water [4]. The presence of oily substances in water sources as potential pollutants can lead to damage to the aquatic ecosystem [5] and cause environmental hazards for humans and aquatic organisms [6]. The non-biodegradability [7], high toxicity, and chemical stability of these oily substances are obvious obstacles that have added to the previous concerns [8]. There are many strategies for modifying water pollution control, including decomposition [9,10], filtration [11], ion exchange [12], ionic liquid [13], and membrane process [14]; however, one of the most effective and cheapest methods of oil pollution treatment is the use of surface adsorption. During the last few decades, different high contact surface and high porosity materials have been used to remove environmental pollutants in the adsorption process, including bio-adsorbent material [15], carbon actives, zeolites, mesoporous silicas, and Metal–Organic Frameworks (MOFs) [16]. In recent years, MOFs have been commonly used to adsorb hazardous organic pollutants from wastewater owing to their high porosity and high specific area of the surface [17], which are the most important parameters of adsorbent selection [18].
The MOFs which are obtained by coordination bonds connecting to clusters/metal ions and organic ligands [19] have attracted much attention owing to their high porosity [20], high thermal [21] and chemical stability [22], and ability to adjust their structure and application [23,24,25].
During thermal decomposition, MOFs can be transformed into porous carbons, metal-based compounds in the form of oxides/carbides/phosphides and metal sulfides [26], which are important for adsorption [27] and storage applications [28]. The performance of these MOFs has already been studied in green projects such as the adsorption of carbon, the treatment of harmful gases [29], and the removal of oil pollutants from water [30]. Recently, the thermal conversion of MOFs into carbon-based materials and metal oxides in one-dimensional [31] and two-dimensional morphologies [32] have been well defined and have received much attention due to their special applications in the storage of gases [33]. In general, controlling the chemical synthesis procedure, such as starting chemicals (metal precursors and organic ligands) [34], synthesis conditions (temperature, pH value, concentration, etc.) [35], and synthesis method (hydrothermal method, microwave radiation, etc.), can easily adjust the MOF’s structure and properties [36].
In the process of surface adsorption, the most important factor in selecting an adsorbent is regeneration ability [37]. Among the different materials, there is a particular preference for MOFs due to their surface modifiability [38]. Among the improvements that can be made to surface interactions, electrostatic interactions are the most important [39].
MOF applications in water purification processes can be categorized into two major classes: (i) the treatment of organic substances such as pesticides [40], oil [41], dyes [42], and herbicides [43,44]; and (ii) the treatment of heavy metals [45]. In 2015, Li et al. [46] applied aluminum nitrate, aluminum oxide, alumina, and boehmite to synthesize MIL-53(Al) in order to perform dimethyl phthalate treatment. Moreover, Khan et al. [47] studied the adsorption of diethyl phthalate (DEP) and phthalic acid (PA) by ZIF-8, UiO-66(Zr) and NH2-UiO-66(Zr) MOFs. In 2021, Xue et al. [48] investigated the adsorption properties of porphyrinic Zr-MOF in the removal of water-soluble organic dyes.
Jing et al. [49] studied a synthesized hydrophobic hierarchical MOF (HZIF-8) as an adsorbent for oil in water emulsion; it showed extraordinary performance in oil adsorption. In 2019, Gao et al. [50] developed a strategy to synthesize the MOF-based materials and showed that synthesized MOFs contain an efficiently separate petroleum ether, toluene, chloroform, and n-hexane with high oil-in-water emulsion separation performance. The comparative study of MOFs based on the literature review was listed in Table 1.
On the other hand, designing a process and correlating a phenomenon are the most important parts of a process [26]. In fact, in order to better understand the process, mathematical modeling is a valuable tool that can be used to investigate operational parameters [35]. By developing a strong process model, the effect of the process’s parameters on its efficiency can be correlated [60]. Hitherto, considerable research has been carried out to investigate the equilibrium condition of the adsorption process; nevertheless, there is no comprehensive study to evaluate MOFs’ surface adsorption properties [61]. Therefore, the adsorption mechanism and equilibrium capacity of MOFs have not been fully understood [37]. Additionally, the mass transfer mechanism is still unknown and therefore it is not possible to predict the adsorption process using MOFs [62].
In this study, to correlate the process of surface adsorption, different adsorption kinetic models have been considered for the treatment of oily wastewater on MOF adsorbents. In this way, the measured experimental data have been correlated by different kinetic models and the correlations compared with each other. Finally, the surface adsorption mechanism has been discussed carefully. Moreover, to study the mass transfer mechanism of oily pollutants in the surface adsorption process, different mass transfer models on porous adsorbents have been investigated; then, the obtained experimental data have been correlated using the mass transfer models, and finally the mass transfer mechanism of the adsorption process has been proposed.

2. Materials and Methods

The synthesis of MnFe2O4 was carried out using the co-precipitation method [63], so that first 16.218 gm of FeCl3·6H2O was reacted with 5.937 gm of (MnCl)2·4H2O with a molar ratio of Fe:Mn = 2:1. In order to adjust the pH to the desired value, the NaOH solution (2M) was used. The solution was stirred at 85 ± 1 °C in an oven with nitrogen atmosphere. After changing the color of the solution, the precipitated MnFe2O4 was removed using a magnet. Then, the produced particles were washed twice using deionized water and dried using an oven at 95 °C for 12 h. Finally, the particles were heated to 560 ± 1 °C for 4 h in a furnace. The forming reaction of MnFe2O4 from MnCl2 and FeCl3 is as follows:
M n C l 2 + 2 F e C l 3 + 8 N a O H M n F e 2 O 4 + 8 N a C l + 4 H 2 O
For the synthesis of the final MOF, the pre-synthesized MnFe2O4 substance was added to the synthesized UIO-66 compound. In order to synthesize the UIO-66 initially 0.636 gm of ZrCl4 salt and 0.408 gm of dicarboxylic benzene (H2BDC) with 0.21 gm of previously obtained MnFe2O4 were dissolved in 300 gm of DMF solvent by a stirrer for 24 h. For chemical activation, the obtained solution was washed twice using dimethyl and placed in chloroform for 3 days, and the synthesized crystals were placed in an oven at a temperature of 200 ± 1 °C for 24 h, as mentioned elsewhere [64].
In order to obtain the adsorption experimental data, 35 mg of the obtained MOF was added to 150 mL of oil-in-water emulsion containing different initial concentrations of pollutant with continuous stirring in a dark place at different process conditions (temperature, pH, and adsorption time). The substances were analyzed using a UV spectrophotometer to measure the amount of residual pollutant in the sample [64,65].
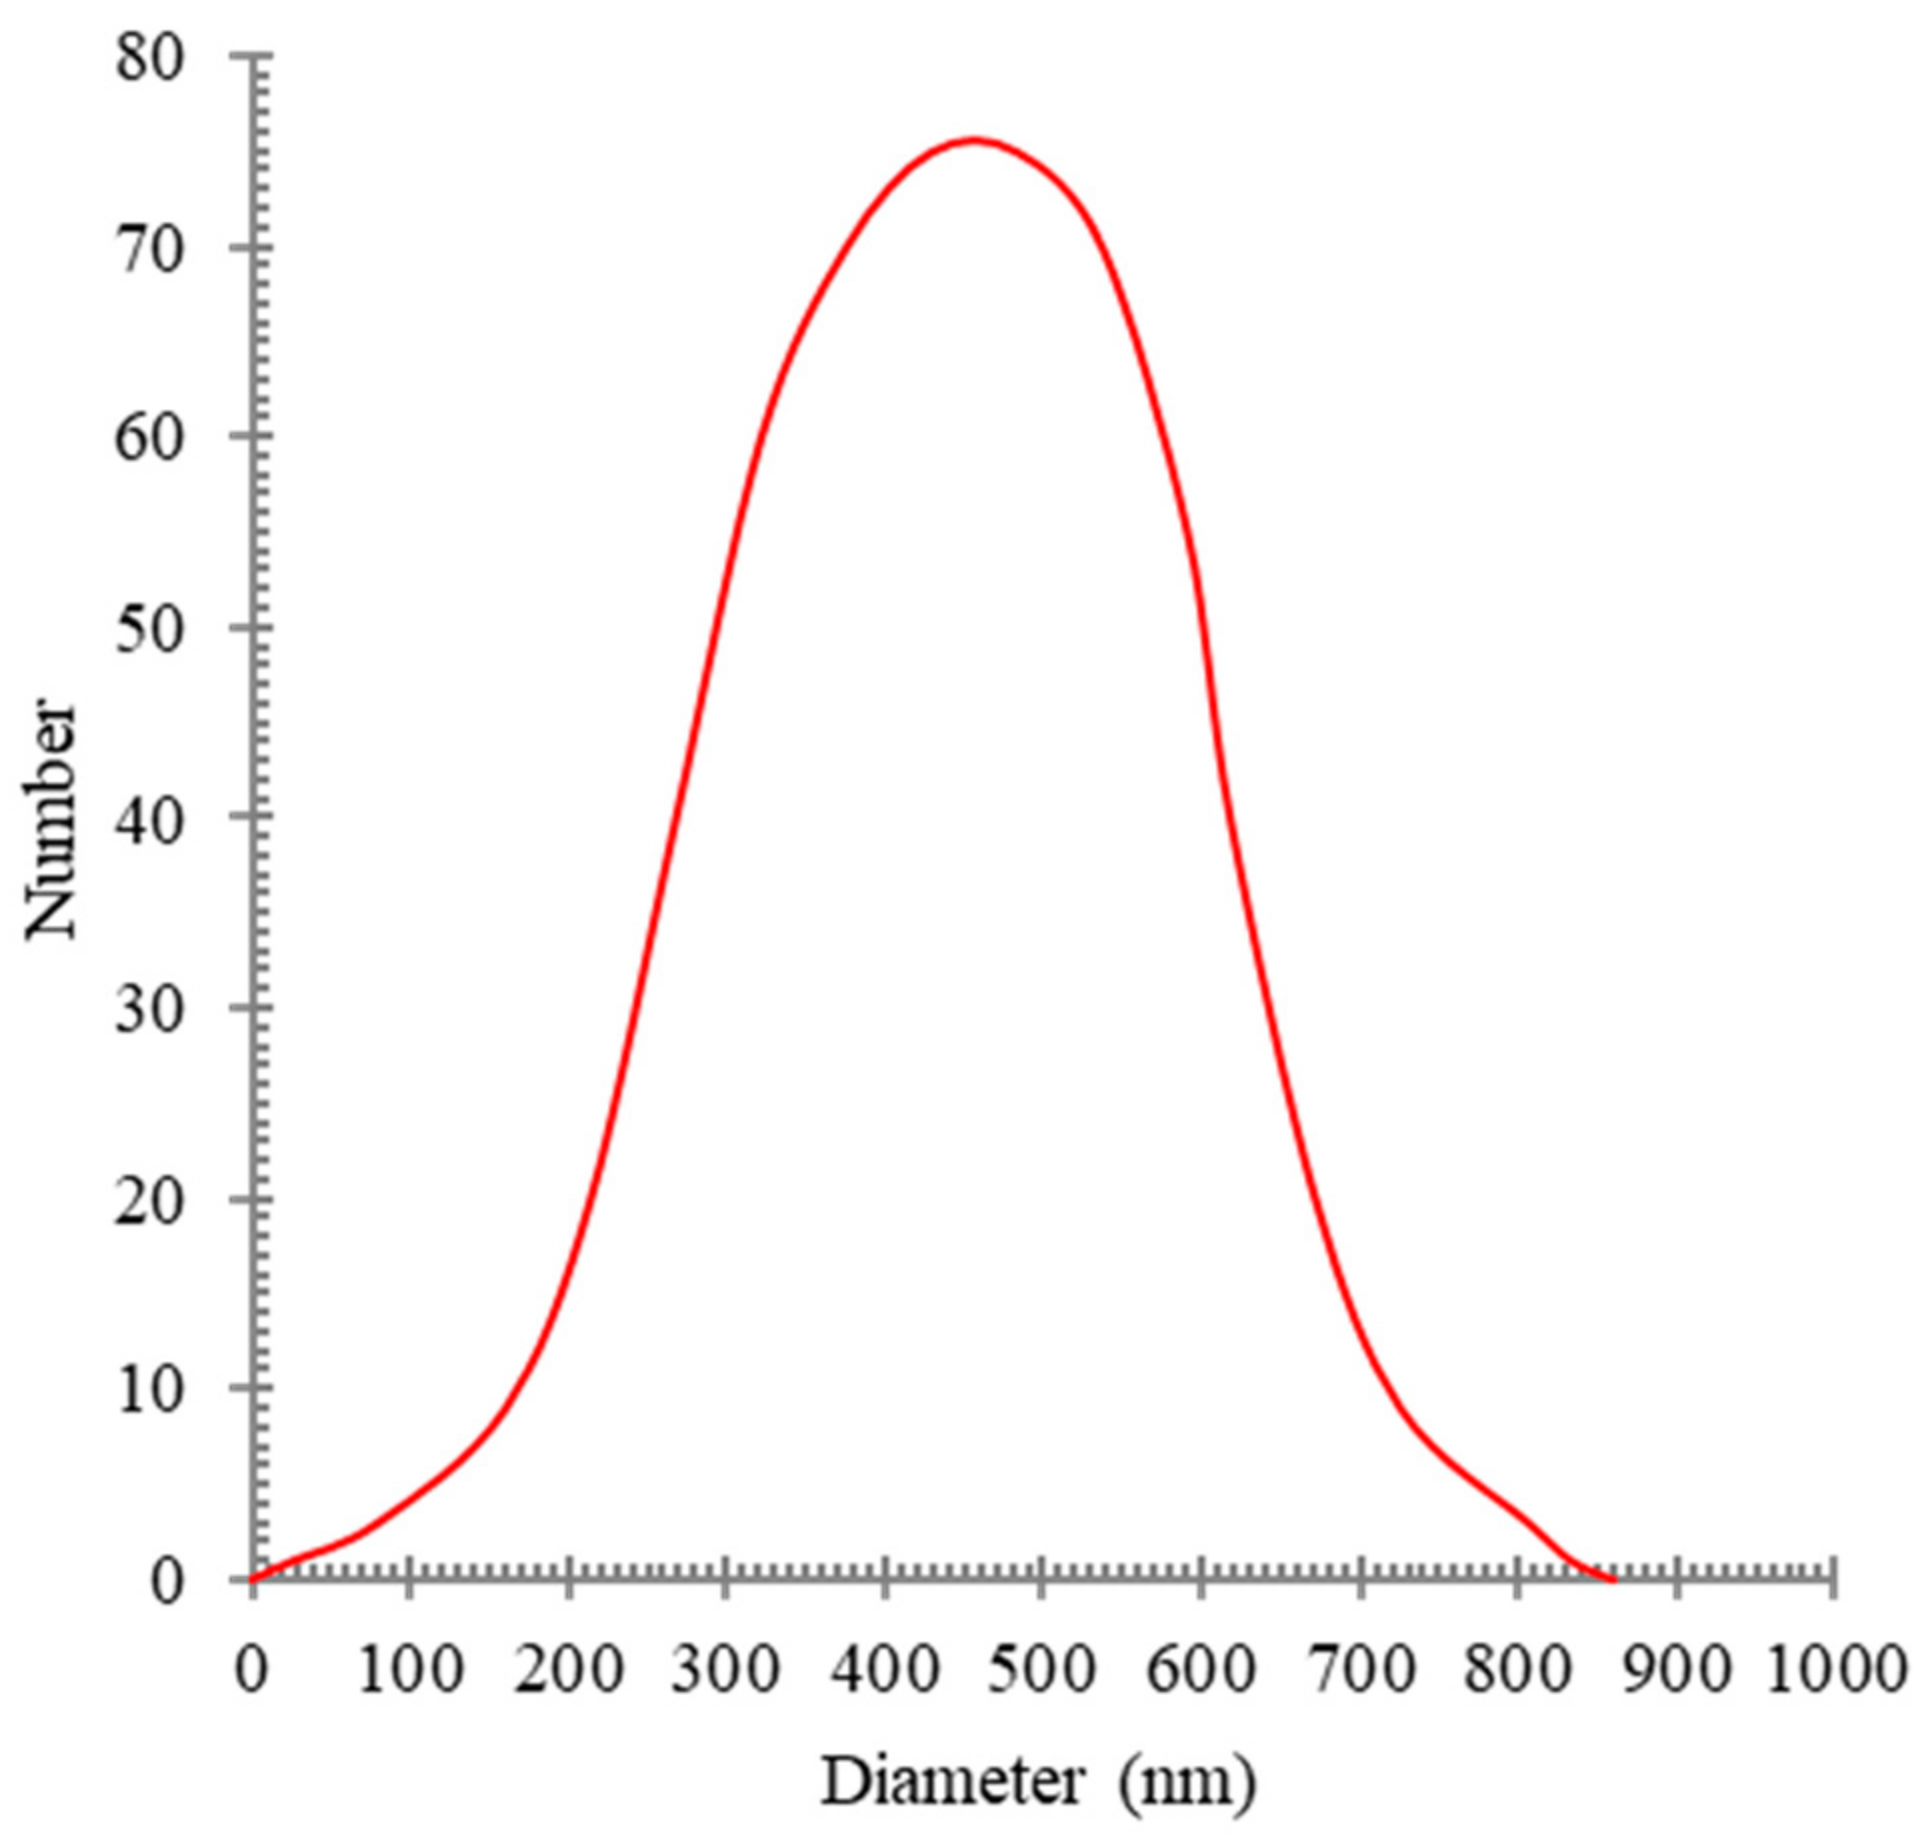
The quality of the synthesized adsorbents in the treatment of oily wastewater was performed by producing a water–oil emulsion with a certain amount of gasoline. For the synthesis of the mentioned emulsion, first a certain amount of the pollutant was poured into double-distilled water and the desired emulsion was obtained using Tween80 as an emulsifier. The concentration of oil in the prepared feeds for different analysis was constant and was adjusted to 2000 mg/L (equivalent to 6400 ppm based on COD calculations). After adding Tween80 emulsifier to the system with a concentration of 100 mg/L, a high-speed homogenizer was applied to prepare an emulsion with high stability.
This homogenizing operation was performed for 30 min at 12,000 rpm. In order to measure the distribution of oil particle sizes in water, a DLS analysis (BeNano90) was performed. The synthesized oily wastewater particle sizes are shown in Figure 1.

3. Adsorption Isotherm Models

The adsorption mechanism can be determined using isotherm models; in other words, the isotherms can be used to optimize the required adsorbent amount in a process. When the adsorbent is placed in contact with a pollutant, the concentration of the pollutant on the surface of the adsorbent increases until reaching thermodynamic equilibrium and then stabilizes at an equilibrium point, which is known as the adsorption isotherm and which is the primary basis for the design of adsorption systems. These equilibrium data can be applied to compare different adsorbents, as well as to design and optimize chemical processes [66]. To investigate the behavior of adsorbents in pollutant removal different adsorption models can be used, such as Langmuir (Lg), Freundlich (Fl), and Temkin (Tk) isotherms [67].
The Lg model was the first kinetically oriented theory presented for surface adsorption on a flat surface. In this theory, a continuous molecular mass transfer on the surface occurs so that the rate of accumulation of molecules on the surface remains equal to zero in the equilibrium state [68].
One of the assumptions used in the Lg model is that the surface adsorption energy is constant and has the same value in all sites. In other words, the adsorbent surface is assumed to be homogeneous. According to this model, each adsorption site can adsorb one molecule, at most.
The linear equation of Lg isotherm model is presented in Equation (2), where qm is the maximum adsorption capacity, Ce is the concentration at equilibrium state, qe is the equilibrium adsorbent concentration, and Kl is the Lg constant that is related to the strength of molecule adsorption on the adsorbent surface. Therefore, the larger Kl is, the more surface is covered with adsorbed molecules [69]. As can be seen from Equation (2), a linear plot of Ce/qe versus Ce can be used to check the Lg model validity in terms of experimental data reproduction.
C e q e = C e q m + 1 K l q m
To describe the equilibrium data, the Fl isotherm can also be applied; it is presented as Equation (3), where n and KF are temperature-dependent constants of the Fl isotherm. As it can be understood from Equation (3), by plotting lnqe in terms of lnCe and calculating the intercept and the slope, the constants of the equation can be presented; consequently, n and KF can be calculated [70].
ln q e = ln C e n ln K F
KF represents the irreversibility of the process, and it is obvious that if n = 1 the Fl equation will be linear, and that the larger the n value the more the isotherm deviates from the linear state and will have a non-linear behavior [71]. In this model, it is assumed that the surface is non-uniform in terms of energy distribution, and the sites with equal surface energy are placed next to each other. It is also assumed that each molecule is adsorbed on just one site [68].
The linearized Tk isotherm is shown in Equation (4), where R is the universal gas constant, KT and b are adjustable parameters, and T is the temperature. As it can be seen, the constants of the equation can be presented by plotting qe in terms of lnCe and calculating the intercept and the slope [68].
q e = R T b ln C e + ln K T

4. Kinetics

To correlate the surface adsorption process, some kinetic models have been developed by different researchers and have been applied to correlate the experimentally obtained data [72,73,74]. To investigate the kinetic adsorption mechanism, in this work, the pseudo-first-order (PFO), pseudo-second-order (PSO), and Elovich (ELO) models were applied. The pseudo-first-order kinetic model is based on physical adsorption; nevertheless, a chemical reaction is assumed in the pseudo-second order model [75].
The equation of the PFO model is given in Equation (5) and the PSO model is presented in Equation (6), where K1 and K2 are the constant coefficients of the PFO and the PSO models, respectively [76].
log q e q = log c K 1 2.303
t q = K 1 K 2 q e 2 + 1 t × q e
In kinetic process correlating, the oil adsorbent particles interact with the available active sites on the MOF adsorbent and form an unstable adsorbent–adsorbent complex, which subsequently becomes the final stable product [77]. Equation (7) describes the reaction mechanism of the mentioned phenomena, where M is the MOF adsorbent and S is the solute.
M + S k 2 k 1 M S * k 4 k 3 M S
The reaction rate for MS*, which is an unstable intermediate complex, as well as the reversible reaction product, MS, are presented in Equations (8) and (9), where K1, K2, K3 and K4 are the rate constants for the reversible reactions [77].
d M S * d t = k 1 M S k 2 M S * k 3 M S * + k 4 M S
d M S d t = k 3 M S * k 4 M S
The intermediate complex compound, MS*, is an unstable molecule with a short lifetime which immediately turns into the MS as product. Due to the presence of an intermediary complex with a short lifetime, it can be assumed that the MS* concentration is negligible [76]. Therefore, the rate of the intermediary complex concentration must be zero according to Equation (10) [78]:
d M S * d t = k 1 M S k 2 M S * k 3 M S * + k 4 M S 0
In surface adsorption, the initial concentration of the adsorbent (S0) is equal to the total concentration of the active sites of the adsorbent (S) which are free; therefore, the site of the reacted complex, and the sites of the adsorbent which are occupied, can be related as Equation (11) [78].
S 0 = S + M S * + M S
As the occupied adsorbent sites do not become active adsorption sites without recovery and purification operations, the rate of the reverse reaction of K4[MS] is insignificant in the operation of surface adsorption; in other words, the rate of the reverse reaction is almost zero [78]. Therefore, [MS*] can be rewritten as Equation (12), where α = (K2 + K3)/K1.
M S * = M α + M S 0 M S
Finally, the adsorption rate in the [MS] form is rewritten as Equation (13).
d M S d t = k 3 M α + M S 0 M S
For high concentrations of [M] and low concentrations of [MS], it can be found that [MS] = 0 and α + [M] = [M]; Therefore, the adsorption rate equation can be simplified as follows [78]:
d M S d t = k 3 S 0
One of the assumptions in the PSO model is that the surface adsorption is the rate-restricting step and the adsorbent is related to the active sites on the surface of the adsorbent which are free [79]. Based on Equation (15), when the solution concentration is low, the PSO kinetic model is associated with the surface adsorption phenomenon, where qt, ks2, and qe are the adsorption capacity at t, the equilibrium rate constant, and the equilibrium adsorption capacity, respectively [78].
q t = q e 2 · k s 2 · t q e · k s 2 · t + 1
The ELO model can also be applied for the chemical adsorption phenomenon. The ELO model is shown in Equation (16), where α is the initial rate of the process of the surface adsorption and β is the constant of desorption [80].
q t = β ln α β + β ln t

5. Mass Transfer

The mass transfer study, as one of the most important phenomena in the process of the surface adsorption, is the key parameter in a deep understanding of adsorption. The surface adsorption of oily pollutants on the adsorbent can be described as a three-step process [81]:
(1)
Liquid Film Diffusion (LF) or Extra-Particle Diffusion model; where oil particles diffuse from the boundary layer of liquid film to the adsorbent surface.
(2)
Intra-Particle Diffusion model; where the diffusion of oil molecules occurs beneath the surface, inside the pores, or a combination of both.
(3)
Surface Chemical Reaction; where oil molecules are adsorbed by electrostatic interaction and hydrogen bonding.
As the third step is a very fast one in the surface adsorption process, among these three, the first and second steps can control the adsorption rate. It should be noted that these three steps play a role in the reaction mechanism separately or in combination [82].
As mentioned, in the LF (extra-particle diffusion) model, the oil molecules’ mass transfer from the liquid bulk to the adsorbent surface controls the rate; in the present study, due to the fact that increasing the stirring speed increases the solution agitation, and mixing between the adsorbent and the adsorbent in the discontinuous surface adsorption process, the thickness of the film boundary layer begins to decrease. As a result, the effect of extra-particle diffusion at high mixing rates can be ignored [83].
In the intra-particle diffusion model, which is also known as the Weber and Morris (WM) model, the mass transfer of oil particles to the inner part of the synthesized adsorbent is determined using the intra-particle diffusion coefficient [84]. The WM model is based on the second law of Fick’s mass transfer theory and is applied to investigate the mechanism of the surface mass transfer to the adsorbent pores. This model is expressed according to Equation (17) and is applied to measure the coefficient of diffusion inside the adsorbent pores [85].
ln 1 q t q e = k d t
Usually, the diffusion of the particles inside the pores can control the adsorption process. In these situations, using the Bangham and Burt (BB) model can be useful [77]. It should be noted that using the BB model can be applied whether the surface adsorption is rate-controlled by diffusion inside the pores or not. This model is presented in Equation (18), where Ci is the initial concentration, qt is the adsorption capacity at t, m is the adsorbent mass, and V is the solution volume. Moreover, kb and α are the BB equation constants [86].
log log C i C i q t m = log k b m 2.303 V + α · log ( t )

6. Results and Discussion

6.1. Characterization

Figure 2 shows the X-ray diffraction (XRD) for the MnFe2O4, UIO-66, and the synthesized UIO-66–MnFe2O4 metal–organic frameworks (MOFs), which was performed in order to investigate the structure of the obtained adsorbent. The MnFe2O4 peaks in the range of 30 to 45 (at 2θ = 31, 36, 43, and 58) prove the formation of MnFe2O4. The peaks in the range of 5 to 10 (at 2θ = 6 and 8) show the presence of UIO-66. The FTIR analysis results are displayed in Figure 3. The peaks at 1551 cm−1 and 1453 cm−1 show carbon–oxygen bonds and the peaks at 1251 cm−1 indicate the benzene structure in UIO-66.
The BET surface area analysis and porosimeter system (China, TMAX-3H-2000PS1) equipment was utilized to measure the surface area and the porosity of the obtained samples. The values of 783 m2/gm and 1061 m2/gm were obtained using BET for the surface area of the obtained UIO-66-MnFe2O4 MOF samples and UIO-66, respectively. The porosity was measured as 87% using the nitrogen adsorption–desorption isotherm at a temperature of 77 °C.
To analyze the surface of the obtained adsorbent, a scanning electron microscope (SEM, FEI Altura 810) was utilized. Figure 4 shows the SEM image of the UIO-66–MnFe2O4 microcrystal adsorbent surface. The EDX spectrum of the synthesized adsorbent sample is presented in Table 2. The results show that the particle sizes of UIO-66–MnFe2O4 MOF crystals vary from 8 to 23 μm.

6.2. Pollutant Initial Concentration Effect

In order to measure the initial concentration effect of the oil pollutant and its capacity in adsorption on the synthesized adsorbent, the amount of the oil pollutant initial concentration from 200 to 2000 (mol/L) was examined. The experimentally obtained data of the effect of the initial concentration of oil pollution according to the percentage of pollution treatment are depicted in Figure 5.
As can be seen from Figure 5, a high amount of oil pollution can be adsorbed by using a small amount of adsorbent. It should be considered that the high concentration of the pollutant in the solution may saturate the adsorbent-free sites. By increasing the concentration of pollution from a certain limit, it can be seen that the treatment percentage decreases, which can be attributed to the decrease in the effective adsorbed surface due to the active site saturation [87,88]. It should be mentioned that this change is extremely small and can be observed in a small amount with very accurate measurements; Therefore, the analyses show that the mutual effect between the initial concentration of the pollution and the desired adsorbent is significant; therefore, the change of the pollution initial concentration has a remarkable effect on the process of surface adsorption in terms of pollutant removal percentage [89].
The previously mentioned kinetic equations were evaluated using the experimentally obtained data for pollutant adsorption by the synthesized adsorbent. The PFO, PSO, and ELO model parameters in various concentrations from 200 to 2000 mg/L are shown in Table 3.
Figure 6 shows the correlation diagram of the PFO, PSO, and ELO models with the experimentally obtained data. As can be seen, the PFO model with an average of R2 = 0.989 has the most agreement with the experimentally obtained data and is closer to the y = x line. It is worth noting that the average R2 for the PSO and ELO models is 0.757 and 0.961, respectively.
The WM, LF, and BB mass transfer models for the process of surface adsorption of oil molecules in different concentrations from 200 to 2000 mg/L on the adsorbent are shown in the Table 4.
In order to investigate the mechanism of the adsorption, three different adsorption isotherm models, Fl, Lg, and Tk isotherms, were correlated and the parameters of the isotherms were determined using the linearized experimental data. The isotherm parameters are available in Table 5.
Figure 7 shows the initial concentration effect on the adsorption of Pollutant wastewater. All cases show a decrease in removal efficiency with an increase in temperature, which can be attributed to the fact that the adsorption process is an exothermic reaction.

6.3. pH Effect

The most important of the parameters that can strongly influence the adsorption procedure is the pH of the wastewater solution because it has a remarkable effect on the ionization and the surface charge of the adsorbent [90]. The experimental data in Figure 8 show the effect of the pH value on adsorption.
To determine the pH’s effect on the process of adsorption, the adsorption process was performed at pH = 2 to 10. It was found that at low or high pH values the rate of adsorption is low. In other words, the pH value has an optimum level in the adsorption rate as pH = 6. This phenomenon can be attributed to the fact that varying the pH value of the sample can improve the surface characteristics, which increases the capacity of adsorption [91].
Table 6 shows the correlated parameters of the ELO, PSO, and PFO kinetic models using the obtained experimental data. As can be understood, the PFO model with an average of R2 = 0.990 has the closest agreement with the experimentally obtained data. It is worth noting that the average R2 for PSO and ELO models is 0.790 and 0.937, respectively.
The WM, LF, and BB mass transfer models for the process of surface adsorption of oil molecules on the adsorbent are shown in the Table 7 at different pH values. As can be understood, all the WM, LF, and BB models have almost the same R2 value as 0.937, 0.918, and 0.924, respectively.
Three different isotherm models of adsorption processes, i.e., the Tk, Fl, and Lg isotherms, were also applied to correlate the adsorption; in this manner, the parameters of isotherm models were determined through the linearized experimentally obtained data at different pH values, as presented in Table 8.

6.4. Adsorption Time Effect

The time of contact to reach the equilibrium state depends on the structure and the characteristics of the adsorbent [92]. To investigate the effect of the contact time on the adsorbent, a period of 200 min was considered for the experiments. As can be seen from Figure 9, the rate of the adsorption process is very high in the first contact, which can be attributed to the high specific surface and active areas of the adsorbent.
As can be understood from Figure 9, the process of adsorption in terms of adsorption rate can be considered in two steps. In the first, adsorption is achieved in a short time period with a high adsorption rate, while in the second, the adsorption process is achieved in a longer time period with a lower adsorption rate [93]. The high adsorption rate in the first step is because of the presence of more free sites on the adsorbent surface, which are quickly filled by the adsorbed substance.

6.5. Effect of Adsorbent Amount

To investigate the effect of the adsorbent amount on the process of adsorption, different amounts of adsorbent were exposed to the pollutant. Figure 10 shows the effect of the amount of adsorbent on the treatment of oil impurities in the wastewater [94]. As can be seen from Figure 10, it is clear that a low amount of adsorbent is unable to remove the pollutant completely, which is related to the number of available active sites; however, by increasing the adsorbent amount, 100% of pollutant adsorption can be achieved.
The correlated parameters of the PSO, ELO, and PFO kinetic models are listed in Table 9. As can be understood, the PFO model with an average of R2 = 0.989 has the closest agreement with the experimentally obtained data and is closer to the x = y line (see Figure 11). It is worth noting that the average R2 for PSO and ELO models is 0.775 and 0.990, respectively.
The correlated parameters of the WM, LF, and BB models for the process of surface adsorption of oil molecules on the adsorbent are presented in the Table 10.
Three different adsorption isotherm models, Fl, Tk, and Lg isotherms, were used to correlate the adsorption process; the correlated isotherm parameters that were determined through the linearized experimentally obtained data are listed in Table 11.

6.6. Temperature Effect

Figure 12 shows the effect of temperature on the percentage of adsorption treatment of oil impurities in the wastewater. As can be seen from Figure 12, it is clear that at very low temperatures adsorption is also low and that it can be increased by increasing the temperature [95].
The correlated parameters of the ELO, PSO, and PFO kinetic models are shown in Table 12. As can be understood, the PFO model with an average of R2 = 0.996 has the closest agreement with the experimentally obtained data and is closer to the x = y line (see Figure 13). It is worth noting that the average R2 for the PSO and ELO models is 0.920 and 0.995, respectively.
The different mass transfer models (WM, LF, and BB) for the process of surface adsorption of oil molecules on the adsorbent are shown in Table 13.
The parameters of Tk, Fl, and Lg isotherms were correlated using the linearized experimentally obtained data. The isotherm parameters are presented in Table 14.

7. Conclusions

Hitherto, a considerable amount of research has been carried out to investigate the equilibrium condition of the adsorption process; nevertheless, there is no comprehensive study to evaluate the surface adsorption properties of MOFs. Therefore, the adsorption mechanism and equilibrium capacity of MOFs have not been fully understood. Moreover, the mass transfer mechanism is still unknown and therefore it is not possible to predict the process using MOFs. In this work, the UIO-66–MnFe2O4 MOF was synthesized as a novel high-performance metal–organic framework adsorbent, and its applications in oily wastewater treatment were studied. The study was performed in four phases, experimental, thermodynamic, kinetic, and mass transfer.
To correlate the process of surface adsorption, different adsorption kinetic models have been applied for the treatment of oil pollutant on MOF adsorbents. Finally, the surface adsorption mechanism has been discussed carefully. Moreover, the mass transfer mechanism of oily pollutants in the surface adsorption process has been investigated using different mass transfer models on porous adsorbents; then, the experimentally obtained data have been correlated with different models of mass transfer, and finally the mass transfer mechanism of the process has been presented. In this way the effects of temperature, amount of adsorbent, adsorption time, pH, and pollutant initial concentration have been studied in the treatment of oily wastewater in the experimental phase. This work is the first step in the analysis of mass transfer and the kinetics of the process of surface adsorption, which can be used to predict the properties of the adsorbent and the process of surface adsorption. In the future, with the expansion of mass transfer and kinetic models and the simultaneous investigation of these two phenomena, it is suggested that the possibility of predicting the adsorption process in other MOFs be investigated.

Author Contributions

For Conceptualization, A.A. and H.O.; methodology, software, A.A. and H.S.K.A.; validation, A.A.; investigation, A.A.; resources, H.O.; data curation, H.S.K.A.; writing—original draft preparation, A.A. and M.I.; supervision, A.A., M.A.J.M. and H.S.K.A.; project administration, A.A., B.P. and M.T.; funding acquisition, A.A. All authors have read and agreed to the published version of the manuscript.

Funding

This research was funded by the Deanship of Scientific Research at King Khalid University under grant number RGP.2/182/43.

Institutional Review Board Statement

Not applicable.

Informed Consent Statement

Not applicable.

Data Availability Statement

Not applicable.

Acknowledgments

The authors extend their appreciation to the Deanship of Scientific Research at King Khalid University for funding this work through Research Groups Program under grant number RGP.2/182/43.

Conflicts of Interest

The authors declare no conflict of interest.

References

  1. Hamta, A.; Dehghani, M.R. Application of Polyethylene Glycol Based Aqueous Two-Phase Systems for Extraction of Heavy Metals. J. Mol. Liq. 2017, 231, 20–24. [Google Scholar] [CrossRef]
  2. Ge, D.; Yuan, H.; Xiao, J.; Zhu, N. Insight into the Enhanced Sludge Dewaterability by Tannic Acid Conditioning and PH Regulation. Sci. Total Environ. 2019, 679, 298–306. [Google Scholar] [CrossRef] [PubMed]
  3. Vardhan, K.H.; Kumar, P.S.; Panda, R.C. A Review on Heavy Metal Pollution, Toxicity and Remedial Measures: Current Trends and Future Perspectives. J. Mol. Liq. 2019, 290, 111197. [Google Scholar] [CrossRef]
  4. Pan, D.; Chen, H. Border Pollution Reduction in China: The Role of Livestock Environmental Regulations. China Econ. Rev. 2021, 69, 101681. [Google Scholar] [CrossRef]
  5. Xu, Z.; Wang, J.; Li, H.; Wang, Y. Coating Sponge with Multifunctional and Porous Metal-Organic Framework for Oil Spill Remediation. Chem. Eng. J. 2019, 370, 1181–1187. [Google Scholar] [CrossRef]
  6. Liu, W.; Huang, F.; Liao, Y.; Zhang, J.; Ren, G.; Zhuang, Z.; Zhen, J.; Lin, Z.; Wang, C. Treatment of CrVI-Containing Mg(OH)2 Nanowaste. Angew. Chem. 2008, 120, 5701–5704. [Google Scholar] [CrossRef]
  7. Dalapati, R.; Nandi, S.; Gogoi, C.; Shome, A.; Biswas, S. Metal–Organic Framework (MOF) Derived Recyclable, Superhydrophobic Composite of Cotton Fabrics for the Facile Removal of Oil Spills. ACS Appl. Mater. Interfaces 2021, 13, 8563–8573. [Google Scholar] [CrossRef]
  8. Alardhi, S.M.; AlJaberi, F.Y.; AlSaedi, L.M. Studying the Treatability of Different Types of Nanoparticles for Oil Content Removal from Oily Wastewater Produced from Refinery Process. Egypt J. Chem. 2020, 63, 4963–4973. [Google Scholar] [CrossRef]
  9. Yang, Y.; Wang, S.; Wen, H.; Ye, T.; Chen, J.; Li, C.; Du, M. Nanoporous Gold Embedded ZIF Composite for Enhanced Electrochemical Nitrogen Fixation. Angew. Chem. Int. Ed. 2019, 58, 15362–15366. [Google Scholar] [CrossRef]
  10. Jiang, H.; Zahmatkesh, S.; Yang, J.; Wang, H.; Wang, C. Ultrasound-Enhanced Catalytic Degradation of Simulated Dye Wastewater Using Waste Printed Circuit Boards: Catalytic Performance and Artificial Neuron Network-Based Simulation. Environ. Monit. Assess. 2023, 195, 144. [Google Scholar] [CrossRef]
  11. Guan, Q.; Zeng, G.; Song, J.; Liu, C.; Wang, Z.; Wu, S. Ultrasonic Power Combined with Seed Materials for Recovery of Phosphorus from Swine Wastewater via Struvite Crystallization Process. J. Environ. Manag. 2021, 293, 112961. [Google Scholar] [CrossRef]
  12. Fu, D.; Mazza, G. Optimization of Processing Conditions for the Pretreatment of Wheat Straw Using Aqueous Ionic Liquid. Bioresour. Technol. 2011, 102, 8003–8010. [Google Scholar] [CrossRef]
  13. Wan, Z.; Zhang, T.; Liu, Y.; Liu, P.; Zhang, J.; Fang, L.; Sun, D. Enhancement of Desulfurization by Hydroxyl Ammonium Ionic Liquid Supported on Active Carbon. Environ. Res. 2022, 213, 113637. [Google Scholar] [CrossRef]
  14. Zahmatkesh, S.; Amiri, M.K.; Zaferani, S.P.G.; Emami, M.R.S.; Hajiaghaei-Keshteli, M.; Albaqami, M.D.; Tighezza, A.M.; Shafahi, M.; Han, N. Machine Learning Modeling of Polycarbonate Ultrafiltration Membranes at Different Temperatures, Al2O3 Nanoparticle Volumes, and Water Ratios. Chemosphere 2022, 313, 137424. [Google Scholar] [CrossRef]
  15. Al-Jaaf, H.J.; Ali, N.S.; Alardhi, S.M.; Albayati, T.M. Implementing Eggplant Peels as an Efficient Bio-Adsorbent for Treatment of Oily Domestic Wastewater. Desalin. Water Treat. 2022, 245, 226–237. [Google Scholar] [CrossRef]
  16. Thorarinsdottir, A.E.; Harris, T.D. Metal–Organic Framework Magnets. Chem. Rev. 2020, 120, 8716–8789. [Google Scholar] [CrossRef]
  17. Jun, B.-M.; Heo, J.; Taheri-Qazvini, N.; Park, C.M.; Yoon, Y. Adsorption of Selected Dyes on Ti3C2Tx MXene and Al-Based Metal-Organic Framework. Ceram. Int. 2020, 46, 2960–2968. [Google Scholar] [CrossRef]
  18. Dias, E.M.; Petit, C. Towards the Use of Metal–Organic Frameworks for Water Reuse: A Review of the Recent Advances in the Field of Organic Pollutants Removal and Degradation and the next Steps in the Field. J. Mater. Chem. A Mater. 2015, 3, 22484–22506. [Google Scholar] [CrossRef] [Green Version]
  19. Fathy, N.A.; El-Shafey, O.I.; Khalil, L.B. Effectiveness of Alkali-Acid Treatment in Enhancement the Adsorption Capacity for Rice Straw: The Removal of Methylene Blue Dye. Int. Sch. Res. Not. 2013, 2013, 208087. [Google Scholar] [CrossRef] [Green Version]
  20. Qin, L.; Liang, F.; Li, Y.; Wu, J.; Guan, S.; Wu, M.; Xie, S.; Luo, M.; Ma, D. A 2D Porous Zinc-Organic Framework Platform for Loading of 5-Fluorouracil. Inorganics 2022, 10, 202. [Google Scholar] [CrossRef]
  21. Zheng, M.; Chen, J.; Zhang, L.; Cheng, Y.; Lu, C.; Liu, Y.; Singh, A.; Trivedi, M.; Kumar, A.; Liu, J. Metal Organic Framework as an Efficient Adsorbent for Drugs from Wastewater. Mater. Today Commun. 2022, 31, 103514. [Google Scholar] [CrossRef]
  22. Liu, J.-Q.; Chen, J.; Cheng, F.; Luo, D.; Huang, J.; Ouyang, J.; Nezamzadeh-Ejhieh, A.; Peng, Y.; Khan, M.S. Recent Advances in Ti-Based MOFs in the Biomedical Applications. Dalton Trans. 2022, 51, 14817–14832. [Google Scholar] [CrossRef]
  23. Li, X.-Y.; Song, Y.; Zhang, C.-X.; Zhao, C.-X.; He, C. Inverse CO2/C2H2 Separation in a Pillared-Layer Framework Featuring a Chlorine-Modified Channel by Quadrupole-Moment Sieving. Sep. Purif. Technol. 2021, 279, 119608. [Google Scholar] [CrossRef]
  24. Yan, X.; Chen, J.-Q.; Hu, M.-L.; Sakiyama, H.; Muddassir, M.; Liu, J.-Q. Syntheses, Structures and Mechanisms of Interactions with DNA of Two New 20-Core Silver (I) Complexes with Different Ligands. Inorg. Chim. Acta 2023, 546, 121297. [Google Scholar] [CrossRef]
  25. Qin, L.; Li, Y.; Liang, F.; Li, L.; Lan, Y.; Li, Z.; Lu, X.; Yang, M.; Ma, D. A Microporous 2D Cobalt-Based MOF with Pyridyl Sites and Open Metal Sites for Selective Adsorption of CO2. Microporous Mesoporous Mater. 2022, 341, 112098. [Google Scholar] [CrossRef]
  26. Hamta, A.; Dehghani, M.R.; Gholami, M. Novel Experimental Data on Aqueous Two–Phase System Containing PEG–6000 and Na2CO3 at T=(293.15, 303.15 and 313.15) K. J. Mol. Liq. 2017, 241, 144–149. [Google Scholar] [CrossRef]
  27. Chen, Y.; Zhang, X.; Mian, M.R.; Son, F.A.; Zhang, K.; Cao, R.; Chen, Z.; Lee, S.-J.; Idrees, K.B.; Goetjen, T.A. Structural Diversity of Zirconium Metal–Organic Frameworks and Effect on Adsorption of Toxic Chemicals. J. Am. Chem. Soc. 2020, 142, 21428–21438. [Google Scholar] [CrossRef]
  28. Li, T.; Su, T.; Wang, J.; Zhu, S.; Zhang, Y.; Geng, Z.; Wang, X.; Gao, Y. Simultaneous Removal of Sulfate and Nitrate from Real High-Salt Flue Gas Wastewater Concentrate via a Waste Heat Crystallization Route. J. Clean Prod. 2022, 382, 135262. [Google Scholar] [CrossRef]
  29. Wagner, M.; Lin, K.-Y.A.; Oh, W.-D.; Lisak, G. Metal-Organic Frameworks for Pesticidal Persistent Organic Pollutants Detection and Adsorption–A Mini Review. J. Hazard. Mater. 2021, 413, 125325. [Google Scholar] [CrossRef]
  30. Ghanbari, T.; Abnisa, F.; Daud, W.M.A.W. A Review on Production of Metal Organic Frameworks (MOF) for CO2 Adsorption. Sci. Total Environ. 2020, 707, 135090. [Google Scholar] [CrossRef]
  31. Kobielska, P.A.; Howarth, A.J.; Farha, O.K.; Nayak, S. Metal–Organic Frameworks for Heavy Metal Removal from Water. Coord. Chem. Rev. 2018, 358, 92–107. [Google Scholar] [CrossRef]
  32. Hasan, Z.; Jhung, S.H. Removal of Hazardous Organics from Water Using Metal-Organic Frameworks (MOFs): Plausible Mechanisms for Selective Adsorptions. J. Hazard. Mater. 2015, 283, 329–339. [Google Scholar] [CrossRef]
  33. Zhang, Z.; Chen, Y.; Wang, Z.; Hu, C.; Ma, D.; Chen, W.; Ao, T. Effective and Structure-Controlled Adsorption of Tetracycline Hydrochloride from Aqueous Solution by Using Fe-Based Metal-Organic Frameworks. Appl. Surf. Sci. 2021, 542, 148662. [Google Scholar] [CrossRef]
  34. Drout, R.J.; Robison, L.; Chen, Z.; Islamoglu, T.; Farha, O.K. Zirconium Metal–Organic Frameworks for Organic Pollutant Adsorption. Trends Chem. 2019, 1, 304–317. [Google Scholar] [CrossRef]
  35. Hamta, A.; Ashtiani, F.Z.; Karimi, M.; Moayedfard, S. Asymmetric Block Copolymer Membrane Fabrication Mechanism through Self-Assembly and Non-Solvent Induced Phase Separation (SNIPS) Process. Sci. Rep. 2022, 12, 771. [Google Scholar] [CrossRef]
  36. Wang, N.; Zhao, R.; Zhang, L.; Guan, X. Molecular Insights into the Adsorption of Chloride Ions in Calcium Silicate Hydrate Gels: The Synergistic Effect of Calcium to Silicon Ratio and Sulfate Ion. Microporous Mesoporous Mater. 2022, 345, 112248. [Google Scholar] [CrossRef]
  37. Bai, B.; Rao, D.; Chang, T.; Guo, Z. A Nonlinear Attachment-Detachment Model with Adsorption Hysteresis for Suspension-Colloidal Transport in Porous Media. J. Hydrol. 2019, 578, 124080. [Google Scholar] [CrossRef]
  38. Tan, Z.; Dong, B.; Xing, M.; Sun, X.; Xi, B.; Dai, W.; He, C.; Luo, Y.; Huang, Y. Electric Field Applications Enhance the Electron Transfer Capacity of Dissolved Organic Matter in Sludge Compost. Environ. Technol. 2022, 5, 1–11. [Google Scholar] [CrossRef]
  39. Chen, P.; He, X.; Pang, M.; Dong, X.; Zhao, S.; Zhang, W. Iodine Capture Using Zr-Based Metal–Organic Frameworks (Zr-MOFs): Adsorption Performance and Mechanism. ACS Appl. Mater Interfaces 2020, 12, 20429–20439. [Google Scholar] [CrossRef]
  40. Xu, Y.; Wang, H.; Li, X.; Zeng, X.; Du, Z.; Cao, J.; Jiang, W. Metal–Organic Framework for the Extraction and Detection of Pesticides from Food Commodities. Compr. Rev. Food Sci. Food Saf. 2021, 20, 1009–1035. [Google Scholar] [CrossRef]
  41. Sun, T.; Hao, S.; Fan, R.; Qin, M.; Chen, W.; Wang, P.; Yang, Y. Hydrophobicity-Adjustable MOF Constructs Superhydrophobic MOF-RGO Aerogel for Efficient Oil–Water Separation. ACS Appl. Mater. Interfaces 2020, 12, 56435–56444. [Google Scholar] [CrossRef] [PubMed]
  42. Uddin, M.J.; Ampiaw, R.E.; Lee, W. Adsorptive Removal of Dyes from Wastewater Using a Metal-Organic Framework: A Review. Chemosphere 2021, 284, 131314. [Google Scholar] [CrossRef] [PubMed]
  43. Su, Y.; Wang, S.; Zhang, N.; Cui, P.; Gao, Y.; Bao, T. Zr-MOF Modified Cotton Fiber for Pipette Tip Solid-Phase Extraction of Four Phenoxy Herbicides in Complex Samples. Ecotoxicol. Environ. Saf. 2020, 201, 110764. [Google Scholar] [CrossRef] [PubMed]
  44. Wang, C.; Kim, J.; Tang, J.; Na, J.; Kang, Y.; Kim, M.; Lim, H.; Bando, Y.; Li, J.; Yamauchi, Y. Large-scale Synthesis of MOF-derived Superporous Carbon Aerogels with Extraordinary Adsorption Capacity for Organic Solvents. Angew. Chem. 2020, 132, 2082–2086. [Google Scholar] [CrossRef]
  45. Bai, B.; Bai, F.; Li, X.; Nie, Q.; Jia, X.; Wu, H. The Remediation Efficiency of Heavy Metal Pollutants in Water by Industrial Red Mud Particle Waste. Env. Technol. Innov. 2022, 28, 102944. [Google Scholar] [CrossRef]
  46. Li, Z.; Wu, Y.; Li, J.; Zhang, Y.; Zou, X.; Li, F. The Metal–Organic Framework MIL-53 (Al) Constructed from Multiple Metal Sources: Alumina, Aluminum Hydroxide, and Boehmite. Chem.–A Eur. J. 2015, 21, 6913–6920. [Google Scholar] [CrossRef]
  47. Lin, K.-Y.A.; Chang, H.-A. Efficient Adsorptive Removal of Humic Acid from Water Using Zeolitic Imidazole Framework-8 (ZIF-8). Water Air Soil Pollut. 2015, 226, 10. [Google Scholar] [CrossRef]
  48. Xue, J.; Xu, M.; Gao, J.; Zong, Y.; Wang, M.; Ma, S. Multifunctional Porphyrinic Zr-MOF Composite Membrane for High-Performance Oil-in-Water Separation and Organic Dye Adsorption/Photocatalysis. Colloids Surf A Phys. Eng. Asp. 2021, 628, 127288. [Google Scholar] [CrossRef]
  49. Jing, P.; Zhang, S.; Chen, W.; Wang, L.; Shi, W.; Cheng, P. A Macroporous Metal–Organic Framework with Enhanced Hydrophobicity for Efficient Oil Adsorption. Chem.–A Eur. J. 2018, 24, 3754–3759. [Google Scholar] [CrossRef]
  50. Gao, M.-L.; Zhao, S.-Y.; Chen, Z.-Y.; Liu, L.; Han, Z.-B. Superhydrophobic/Superoleophilic MOF Composites for Oil–Water Separation. Inorg. Chem. 2019, 58, 2261–2264. [Google Scholar] [CrossRef]
  51. Rojas Garcia, E.; Lopez Medina, R.; May Lozano, M.; Hernández Pérez, I.; Valero, M.J.; Maubert Franco, A.M. Adsorption of Azo-Dye Orange II from Aqueous Solutions Using a Metal-Organic Framework Material: Iron-Benzenetricarboxylate. Materials 2014, 7, 8037–8057. [Google Scholar] [CrossRef] [Green Version]
  52. Yang, J.-M.; Yang, B.-C.; Zhang, Y.; Yang, R.-N.; Ji, S.-S.; Wang, Q.; Quan, S.; Zhang, R.-Z. Rapid Adsorptive Removal of Cationic and Anionic Dyes from Aqueous Solution by a Ce (III)-Doped Zr-Based Metal–Organic Framework. Microporous Mesoporous Mater. 2020, 292, 109764. [Google Scholar] [CrossRef]
  53. Zhang, X.; Zhang, N.; Gan, C.; Liu, Y.; Chen, L.; Zhang, C.; Fang, Y. Synthesis of In2S3/UiO-66 Hybrid with Enhanced Photocatalytic Activity towards Methyl Orange and Tetracycline Hydrochloride Degradation under Visible-Light Irradiation. Mater. Sci. Semicond. Process 2019, 91, 212–221. [Google Scholar] [CrossRef]
  54. Lin, K.-Y.A.; Yang, H.; Petit, C.; Hsu, F.-K. Removing Oil Droplets from Water Using a Copper-Based Metal Organic Frameworks. Chem. Eng. J. 2014, 249, 293–301. [Google Scholar] [CrossRef]
  55. Yang, C.; Kaipa, U.; Mather, Q.Z.; Wang, X.; Nesterov, V.; Venero, A.F.; Omary, M.A. Fluorous Metal–Organic Frameworks with Superior Adsorption and Hydrophobic Properties toward Oil Spill Cleanup and Hydrocarbon Storage. J. Am. Chem. Soc. 2011, 133, 18094–18097. [Google Scholar] [CrossRef]
  56. Shi, M.; Huang, R.; Qi, W.; Su, R.; He, Z. Synthesis of Superhydrophobic and High Stable Zr-MOFs for Oil-Water Separation. Colloids Surf. A Phys. Eng. Asp. 2020, 602, 125102. [Google Scholar] [CrossRef]
  57. Yang, Q.; Zhao, Q.; Ren, S.; Chen, Z.; Zheng, H. Assembly of Zr-MOF Crystals onto Magnetic Beads as a Highly Adsorbent for Recycling Nitrophenol. Chem. Eng. J. 2017, 323, 74–83. [Google Scholar] [CrossRef]
  58. Zhao, G.; Fang, Y.; Dai, W.; Ma, N. Copper-Containing Porous Carbon Derived from MOF-199 for Dibenzothiophene Adsorption. RSC Adv. 2017, 7, 21649–21654. [Google Scholar] [CrossRef] [Green Version]
  59. Su, Y.; Li, Z.; Zhou, H.; Kang, S.; Zhang, Y.; Yu, C.; Wang, G. Ni/Carbon Aerogels Derived from Water Induced Self-Assembly of Ni-MOF for Adsorption and Catalytic Conversion of Oily Wastewater. Chem. Eng. J. 2020, 402, 126205. [Google Scholar] [CrossRef]
  60. Dong, P.; Zhang, Y.; Zhu, S.; Nie, Z.; Ma, H.; Liu, Q.; Li, J. First-Principles Study on the Adsorption Characteristics of Corrosive Species on Passive Film TiO2 in a NaCl Solution Containing H2S and CO2. Metals 2022, 12, 1160. [Google Scholar] [CrossRef]
  61. Qu, M.; Liang, T.; Hou, J.; Liu, Z.; Yang, E.; Liu, X. Laboratory Study and Field Application of Amphiphilic Molybdenum Disulfide Nanosheets for Enhanced Oil Recovery. J. Pet. Sci. Eng. 2022, 208, 109695. [Google Scholar] [CrossRef]
  62. Petit, C. Present and Future of MOF Research in the Field of Adsorption and Molecular Separation. Curr. Opin. Chem. Eng. 2018, 20, 132–142. [Google Scholar] [CrossRef]
  63. Mahmoodi, N.M.; Arabloo, M.; Abdi, J. Laccase Immobilized Manganese Ferrite Nanoparticle: Synthesis and LSSVM Intelligent Modeling of Decolorization. Water Res. 2014, 67, 216–226. [Google Scholar] [CrossRef] [PubMed]
  64. Alsaiari, N.S.; Osman, H.; Amari, A.; Tahoon, M.A. The Synthesis of Metal–Organic-Framework-Based Ternary Nanocomposite for the Adsorption of Organic Dyes from Aqueous Solutions. Magnetochemistry 2022, 8, 133. [Google Scholar] [CrossRef]
  65. Wang, R.; Xu, H.; Zhang, K.; Wei, S.; Deyong, W. High-Quality Al@ Fe-MOF Prepared Using Fe-MOF as a Micro-Reactor to Improve Adsorption Performance for Selenite. J. Hazard. Mater 2019, 364, 272–280. [Google Scholar] [CrossRef]
  66. Mansoorianfar, M.; Nabipour, H.; Pahlevani, F.; Zhao, Y.; Hussain, Z.; Hojjati-Najafabadi, A.; Hoang, H.Y.; Pei, R. Recent Progress on Adsorption of Cadmium Ion from Water Systems Using Metal-Organic Frameworks (MOFs) as an Efficient Class of Porous Materials. Environ. Res. 2022, 214, 114113. [Google Scholar] [CrossRef]
  67. Al Jaberi, F.Y.; Jabbar, S.M.; Jabbar, N.M. Modeling of Adsorption Isotherms of Oil Content through the Electrocoagulation Treatment of Real Oily Wastewater. In AIP Conference Proceedings; AIP Publishing LLC: Melville, NY, USA, 2020; Volume 2213, p. 020041. [Google Scholar]
  68. Sadhu, M.; Bhattacharya, P.; Vithanage, M.; Sudhakar, P.P. Adsorptive Removal of Fluoride Using Biochar–a Potential Application in Drinking Water Treatment. Sep. Purif. Technol. 2021, 278, 119106. [Google Scholar] [CrossRef]
  69. Al-Ghouti, M.A.; Da’ana, D.A. Guidelines for the Use and Interpretation of Adsorption Isotherm Models: A Review. J. Hazard. Mater. 2020, 393, 122383. [Google Scholar] [CrossRef]
  70. Fabre, E.; Rocha, A.; Cardoso, S.P.; Brandão, P.; Vale, C.; Lopes, C.B.; Pereira, E.; Silva, C.M. Purification of Mercury-Contaminated Water Using New AM-11 and AM-14 Microporous Silicates. Sep. Purif. Technol. 2020, 239, 116438. [Google Scholar] [CrossRef]
  71. Desta, M.B. Batch Sorption Experiments: Langmuir and Freundlich Isotherm Studies for the Adsorption of Textile Metal Ions onto Teff Straw (Eragrostis Tef) Agricultural Waste. J. Thermodyn. 2013, 2013, 375830. [Google Scholar] [CrossRef] [Green Version]
  72. Han, Y.; Boateng, A.A.; Qi, P.X.; Lima, I.M.; Chang, J. Heavy Metal and Phenol Adsorptive Properties of Biochars from Pyrolyzed Switchgrass and Woody Biomass in Correlation with Surface Properties. J. Env. Manag. 2013, 118, 196–204. [Google Scholar] [CrossRef]
  73. El-Halwany, M.M. Study of Adsorption Isotherms and Kinetic Models for Methylene Blue Adsorption on Activated Carbon Developed from Egyptian Rice Hull (Part II). Desalination 2010, 250, 208–213. [Google Scholar] [CrossRef]
  74. Kajjumba, G.W.; Emik, S.; Öngen, A.; Özcan, H.K.; Aydın, S. Modelling of Adsorption Kinetic Processes—Errors, Theory and Application. Adv. Sorpt. Process Appl. 2018, 43, 1–19. [Google Scholar] [CrossRef] [Green Version]
  75. Bossy, M.; Jabir, J.-F.; Rodriguez, K.M. Instantaneous Turbulent Kinetic Energy Modelling Based on Lagrangian Stochastic Approach in CFD and Application to Wind Energy. J. Comput. Phys. 2022, 464, 110929. [Google Scholar] [CrossRef]
  76. Avcı, A.; İnci, İ.; Baylan, N. Adsorption of Ciprofloxacin Hydrochloride on Multiwall Carbon Nanotube. J. Mol. Struct. 2020, 1206, 127711. [Google Scholar] [CrossRef]
  77. Prajapati, A.K.; Mondal, M.K. Comprehensive Kinetic and Mass Transfer Modeling for Methylene Blue Dye Adsorption onto CuO Nanoparticles Loaded on Nanoporous Activated Carbon Prepared from Waste Coconut Shell. J. Mol. Liq. 2020, 307, 112949. [Google Scholar] [CrossRef]
  78. Zhou, D.; Wang, L.; Chen, X.; Wei, X.; Liang, J.; Tang, R.; Xu, Y. Reaction Mechanism Investigation on the Esterification of Rosin with Glycerol over Annealed Fe3O4/MOF-5 via Kinetics and TGA-FTIR Analysis. Chem. Eng. J. 2020, 401, 126024. [Google Scholar] [CrossRef]
  79. Liu, X.; Zhao, X.; Liu, Y.; Zhang, T. Review on Preparation and Adsorption Properties of Chitosan and Chitosan Composites. Polym. Bull. 2022, 79, 2633–2665. [Google Scholar] [CrossRef]
  80. Ahamad, K.U.; Singh, R.; Baruah, I.; Choudhury, H.; Sharma, M.R. Equilibrium and Kinetics Modeling of Fluoride Adsorption onto Activated Alumina, Alum and Brick Powder. Groundw. Sustain. Dev. 2018, 7, 452–458. [Google Scholar] [CrossRef]
  81. Zhao, B.; Jiang, H.; Lin, Z.; Xu, S.; Xie, J.; Zhang, A. Preparation of Acrylamide/Acrylic Acid Cellulose Hydrogels for the Adsorption of Heavy Metal Ions. Carbohydr. Polym. 2019, 224, 115022. [Google Scholar] [CrossRef]
  82. Zhang, X.; Yang, Y.; Lv, X.; Wang, Y.; Liu, N.; Chen, D.; Cui, L. Adsorption/Desorption Kinetics and Breakthrough of Gaseous Toluene for Modified Microporous-Mesoporous UiO-66 Metal Organic Framework. J. Hazard. Mater. 2019, 366, 140–150. [Google Scholar] [CrossRef] [PubMed]
  83. Chang, G.; Wang, G.; Li, Y.; Ma, J.; Guo, Q. Synergistic Interactions between Biochar Reacted with Steam and CO2 Originating from a Diffusion Reaction State and Intrinsic Ash. Fuel Process. Technol. 2021, 215, 106754. [Google Scholar] [CrossRef]
  84. Cabooter, D.; Song, H.; Makey, D.; Sadriaj, D.; Dittmann, M.; Stoll, D.; Desmet, G. Measurement and Modelling of the Intra-Particle Diffusion and b-Term in Reversed-Phase Liquid Chromatography. J. Chromatogr. A 2021, 1637, 461852. [Google Scholar] [CrossRef] [PubMed]
  85. Chen, Z.; Liu, B.; Feng, D.; Li, G. Adsorption Mechanism between Corn Stalk Fiber and Asphalt. Sustainability 2022, 14, 12863. [Google Scholar] [CrossRef]
  86. Kapica, J.; Pełech, R.; Przepiórski, J.; Morawski, A.W. Kinetics of the Adsorption of Copper and Lead Ions from Aqueous Solution on to WD-Ekstra Activated Carbon. Adsorpt. Sci. Technol. 2002, 20, 441–452. [Google Scholar] [CrossRef]
  87. Kale, M.J.; Christopher, P. Utilizing Quantitative in Situ FTIR Spectroscopy to Identify Well-Coordinated Pt Atoms as the Active Site for CO Oxidation on Al2O3-Supported Pt Catalysts. ACS Catal. 2016, 6, 5599–5609. [Google Scholar] [CrossRef]
  88. Liu, J.; Cheney, M.A.; Wu, F.; Li, M. Effects of Chemical Functional Groups on Elemental Mercury Adsorption on Carbonaceous Surfaces. J. Hazard. Mater. 2011, 186, 108–113. [Google Scholar] [CrossRef]
  89. Weber Jr, W.J.; Morris, J.C. Adsorption in Heterogeneous Aqueous Systems. J. Am. Water Work. Assoc. 1964, 56, 447–456. [Google Scholar] [CrossRef]
  90. Afroze, S.; Sen, T.K. A Review on Heavy Metal Ions and Dye Adsorption from Water by Agricultural Solid Waste Adsorbents. Water Air Soil Pollut. 2018, 229, 225. [Google Scholar] [CrossRef]
  91. Lin, K.; Pan, J.; Chen, Y.; Cheng, R.; Xu, X. Study the Adsorption of Phenol from Aqueous Solution on Hydroxyapatite Nanopowders. J. Hazard. Mater. 2009, 161, 231–240. [Google Scholar] [CrossRef]
  92. Crini, G.; Peindy, H.N.; Gimbert, F.; Robert, C. Removal of CI Basic Green 4 (Malachite Green) from Aqueous Solutions by Adsorption Using Cyclodextrin-Based Adsorbent: Kinetic and Equilibrium Studies. Sep. Purif. Technol. 2007, 53, 97–110. [Google Scholar] [CrossRef]
  93. Ahmad, A.L.; Sumathi, S.; Hameed, B.H. Adsorption of Residue Oil from Palm Oil Mill Effluent Using Powder and Flake Chitosan: Equilibrium and Kinetic Studies. Water Res. 2005, 39, 2483–2494. [Google Scholar] [CrossRef]
  94. Adeyemo, A.A.; Adeoye, I.O.; Bello, O.S. Metal Organic Frameworks as Adsorbents for Dye Adsorption: Overview, Prospects and Future Challenges. Toxicol. Environ. Chem. 2012, 94, 1846–1863. [Google Scholar] [CrossRef]
  95. Weber, W.J., Jr.; Morris, J.C. Kinetics of Adsorption on Carbon from Solution. J. Sanit. Eng. Div. 1963, 89, 31–59. [Google Scholar] [CrossRef]
Figure 1. The synthesized oily wastewater particle sizes of gasoline in oil–water emulsion.
Sustainability 15 02488 g001
Figure 2. The XRD pattern for synthesized UIO-66, MnFe2O4, and UIO-66–MnFe2O4 samples.
Sustainability 15 02488 g002
Figure 3. The FTIR spectra for synthesized UIO-66–MnFe2O4 MOF sample.
Sustainability 15 02488 g003
Figure 4. The SEM surface of the UIO-66-MnFe2O4 MOF sample.
Sustainability 15 02488 g004
Figure 5. The initial concentration effect of pollutant on adsorption.
Sustainability 15 02488 g005
Figure 6. The correlation diagram of the (a) pseudo-first-order, (b) pseudo-second-order, and (c) Elovich models with the experimental data.
Sustainability 15 02488 g006
Figure 7. The effect of the initial concentration of pollutant on adsorption.
Sustainability 15 02488 g007
Figure 8. The effect of the pH value of wastewater on adsorption.
Sustainability 15 02488 g008
Figure 9. The effect of time of process on surface removal.
Sustainability 15 02488 g009
Figure 10. The adsorption amount’s effect on the process of adsorption.
Sustainability 15 02488 g010
Figure 11. The correlation diagram of the (a) pseudo-first-order, (b) pseudo-second-order, and (c) Elovich models with the experimental data.
Sustainability 15 02488 g011
Figure 12. The effect of the process temperature on adsorption.
Sustainability 15 02488 g012
Figure 13. The correlation diagram of the (a) pseudo-first-order, (b) pseudo-second-order, and (c) Elovich models with the experimental data.
Sustainability 15 02488 g013
Table 1. The comparative study of MOFs based on the literature review.
MOF TypeSurface Area (m2·g−1)PollutantRemoval (%)Ref
Fe-BTC877 Orange II92[51]
Ce(III)-doped UiO-671911 Methylene blue95[52]
In2S3/UiO-66(Zr)148 tetracycline hydrochloride85[53]
HKUST-1 (CuBTC)645 Oil70[54]
FMOF-1723 cyclohexane80[55]
FMOF-1723 n-hexane50[55]
FMOF-1723 benzene95[55]
UiO-66-NH-C18570 Oil99[56]
UiO-66-NH-C18-Various oils and organic solvents67[56]
UiO-66 onto Fe3O4 particles652 2-nitroresorcinol85[57]
MOF-1991876 Dibenzothiophene76[58]
Ni-based MOF144 Different oil and organic compounds95[59]
Table 2. The EDX spectrum of the synthesized adsorbent sample.
SampleCOClFeZnZrMn
ZnFe2O4-14.6-57.329.1-23.1
Uio-6639.230.32.10.42-27.146
UIO-66-MnFe2O414.634.84.231.86.68.254.1
Table 3. The correlated parameters of different kinetic models of the surface adsorption process in concentrations from 200 to 2000 mg/L.
ModelParameters200 mg/L400 mg/L1000 mg/L1500 mg/L2000 mg/L
pseudo-first-orderKl (min−1)1.621.871.932.092.17
qm (mg/g)93182255297344
R20.9980.9930.9870.9790.991
pseudo-second-orderK2 (g/mg min)0.130.130.180.210.24
q (mg/g)206268345393457
R20.7320.7620.8180.7330.740
Elovichα121144184208249
β0.0140.0240.0350.0420.051
R20.9630.9550.9480.9520.987
Table 4. The correlated parameters of different mass transfer models of the surface adsorption process in different concentrations from 200 to 2000 mg/L.
ModelParameters200 mg/L400 mg/L1000 mg/L1500 mg/L2000 mg/L
Weber and MorrisC67152216341426
Ki (mg/g min0.5)15.318.619.120.221.6
R20.9270.9120.9140.9390.892
liquid film diffusionC−0.322−0.396−0.492−0.548−0.672
Kd (S−1)0.0120.0150.0190.0260.038
R20.9440.9230.8970.9170.920
Bangham and BurtA0.5890.4830.3270.3060.245
kb (mL/g L)0.2540.3420.4880.5630.633
R20.9940.8950.9800.9250.936
Table 5. The correlated parameters of Lg, Fl, and Tk isotherms for oil removal in different concentrations from 200 to 2000 mg/L.
ModelParameters200 mg/L400 mg/L1000 mg/L1500 mg/L2000 mg/L
LangmuirKl × 10−4 (dm3/mg)7.6784.4161.4900.9982.189
qm× 1049.668.5776.3604.2243.046
R20.9990.9940.9970.9890.998
FreundlichKF × 10−2 (dm3/g)4.8691.8231.7756.2515.221
n10.24.013.424.567.79
R20.7120.7220.9120.9230.974
TemkinKT × 10−8 (dm3/g)4.2292.0500.0090.0250.109
b× 10−72.9880.3612.4424.12310.260
R20.6920.7520.9120.9220.947
Table 6. The correlated parameters of different kinetic models of the surface adsorption process at different pH values from 2 to 10.
ModelParameterspH = 2pH = 4pH = 6pH = 8pH = 10
pseudo-first-orderKl (min−1)2.532.772.983.193.35
qm (mg/g)7291128136159
R20.9960.9940.9970.9860.983
pseudo-second-orderK2 (g/mg min)0.090.110.170.190.22
q (mg/g)159186203246293
R20.7860.8620.7180.7820.803
Elovichα98103167186204
Β0.0090.0130.0240.0310.043
R20.9710.9620.9030.9500.899
Table 7. The correlated parameters of different mass transfer models of the adsorption process at different pH values from 2 to 10.
ModelParameterspH = 2pH = 4pH = 6pH = 8pH = 10
Weber and MorrisC7392109125186
Ki (mg/g min0.5)10.917.321.523.229.5
R20.9380.9210.9690.9410.920
liquid film diffusionC−0.022−0.160−0.264−0.389−0.497
Kd (S1)0.0180.0180.0220.0290.032
R20.9340.9330.9070.9240.892
Bangham and BurtA0.4520.3630.3230.2660.235
kb (mL/g L)0.1230.2330.3480.4630.566
R20.9830.8650.9030.9030.966
Table 8. The correlated parameters of the Lg, Fl, and Tk isotherms for oil removal from wastewater.
ModelParameterspH = 2pH = 4pH = 6pH = 8pH = 10
LangmuirKl × 10−4 (dm3/mg)5.6542.1546.5784.5527.332
qm× 1048.2456.3215.3216.5688.318
R20.9990.9950.9990.9960.998
FreundlichKF × 10−2 (dm3/g)2.6543.5532.8524.5465.476
n3.235.346.329.474.57
R20.7530.7630.7850.8360.783
TemkinKT × 108 (dm3/g)3.6563.9875.6321.6896.632
b × 10−70.6223.6484.8561.6859.861
R20.5630.7060.7650.8620.725
Table 9. The correlated parameters of different kinetic models of the surface adsorption process in different adsorption amounts.
ModelParameters10 mg20 mg50 mg100 mg200 mg
pseudo-first-orderKl (min−1)2.442.522.973.293.36
qm (mg/g)79106143198263
R20.9980.9820.9760.9930.999
pseudo-second-orderK2 (g/mg min)0.160.180.230.300.41
q (mg/g)186193211236249
R20.7030.7740.7280.8630.806
Elovichα93103169193204
β0.0120.0190.0260.0390.051
R20.9790.9980.9870.9960.990
Table 10. The correlated parameters of different mass transfer models of the surface adsorption process in different adsorbent amounts.
ModelParameters10 mg20 mg50 mg100 mg200 mg
Weber and MorrisC7696128193218
Ki (mg/g min0.5)18.421.226.835.348.7
R20.9730.9620.9790.9920.966
Liquid film diffusionC−0.255−0.309−0.326−0.394−0.413
Kd (S−1)0.0050.0060.0110.0220.031
R20.9770.9630.9890.9660.893
Bangham and BurtA0.9520.7520.6920.4390.266
kb (mL/g L)0.1520.1850.2630.4650.522
R20.9970.9320.9090.9880.949
Table 11. The correlated parameters of Lg, Fl, and Tk isotherms for the removal of oil from wastewater.
ModelParameters10 mg20 mg50 mg100 mg200 mg
LangmuirKl × 104 (dm3/mg)12.52311.8459.1438.8424.543
qm× 10416.65214.31611.5338.2337.654
R20.9990.9980.9930.9930.998
FreundlichKF × 102 (dm3/g)8.3206.3123.6239.3615.646
N9.258.784.339.456.44
R20.8360.8990.9280.8520.879
TemkinKT × 108 (dm3/g)3.5649.1437.4148.9666.966
b × 10−74.6526.5456.4224.9879.920
R20.7990.9080.8960.9660.948
Table 12. The correlated parameters of different kinetic models of the surface adsorption process at different temperatures from 5 to 40 °C.
ModelParametersT = 5 °CT = 10 °CT = 20 °CT = 30 °CT = 40 °C
pseudo-first-orderKl (min−1)4.494.656.308.549.93
qm (mg/g)91125169209255
R20.9980.9920.9960.9940.999
pseudo-second-orderK2 (g/mg min)0.110.140.150.190.26
q (mg/g)196239264309362
R20.9830.8360.9210.8930.966
Elovichα4683109127161
β0.0290.0460.0680.0930.153
R20.9890.9980.9990.9960.995
Table 13. The correlated parameters of different mass transfer models of surface adsorption process at different temperatures from 5 to 40 °C.
ModelParametersT = 5 °CT = 10 °CT = 20 °CT = 30 °CT = 40 °C
Weber and MorrisC647592113129
Ki (mg/g min0.5)11.315.519.226.538.1
R20.9930.9980.9990.9920.989
Liquid film diffusionC−0.349−0.482−0.561−0.693−0.816
Kd (S−1)0.0110.0130.0200.0290.037
R20.9960.9930.9820.9940.899
Bangham and BurtA0.6220.5190.4870.4060.333
kb (mL/g L)0.0730.1210.1990.2630.305
R20.9980.9990.9830.9960.989
Table 14. The correlated parameters of Lg, Fl, and Tk isotherms for the removal of oil from wastewater at different temperatures from 5 to 40 °C.
ModelParametersT = 5 °CT = 10 °CT = 20 °CT = 30 °CT = 40 °C
LangmuirKl × 104 (dm3/mg)14.85213.65411.6539.6627.422
qm× 10418.65517.66913.48811.3567.778
R20.9970.9960.9990.9940.998
FreundlichKF × 102 (dm3/g)6.6664.9853.5652.3500.471
n8.546.555.633.122.39
R20.9930.9650.9450.9750.929
TemkinKT × 10−8 (dm3/g)5.6238.8753.4457.35611.396
b × 10−76.6806.1256.2358.4687.692
R20.9990.9820.9680.9960.982
Disclaimer/Publisher’s Note: The statements, opinions and data contained in all publications are solely those of the individual author(s) and contributor(s) and not of MDPI and/or the editor(s). MDPI and/or the editor(s) disclaim responsibility for any injury to people or property resulting from any ideas, methods, instructions or products referred to in the content.

