
Critical Standard Normalized Rapid Suppression Hydraulic Index and Its Estimation

Abstract
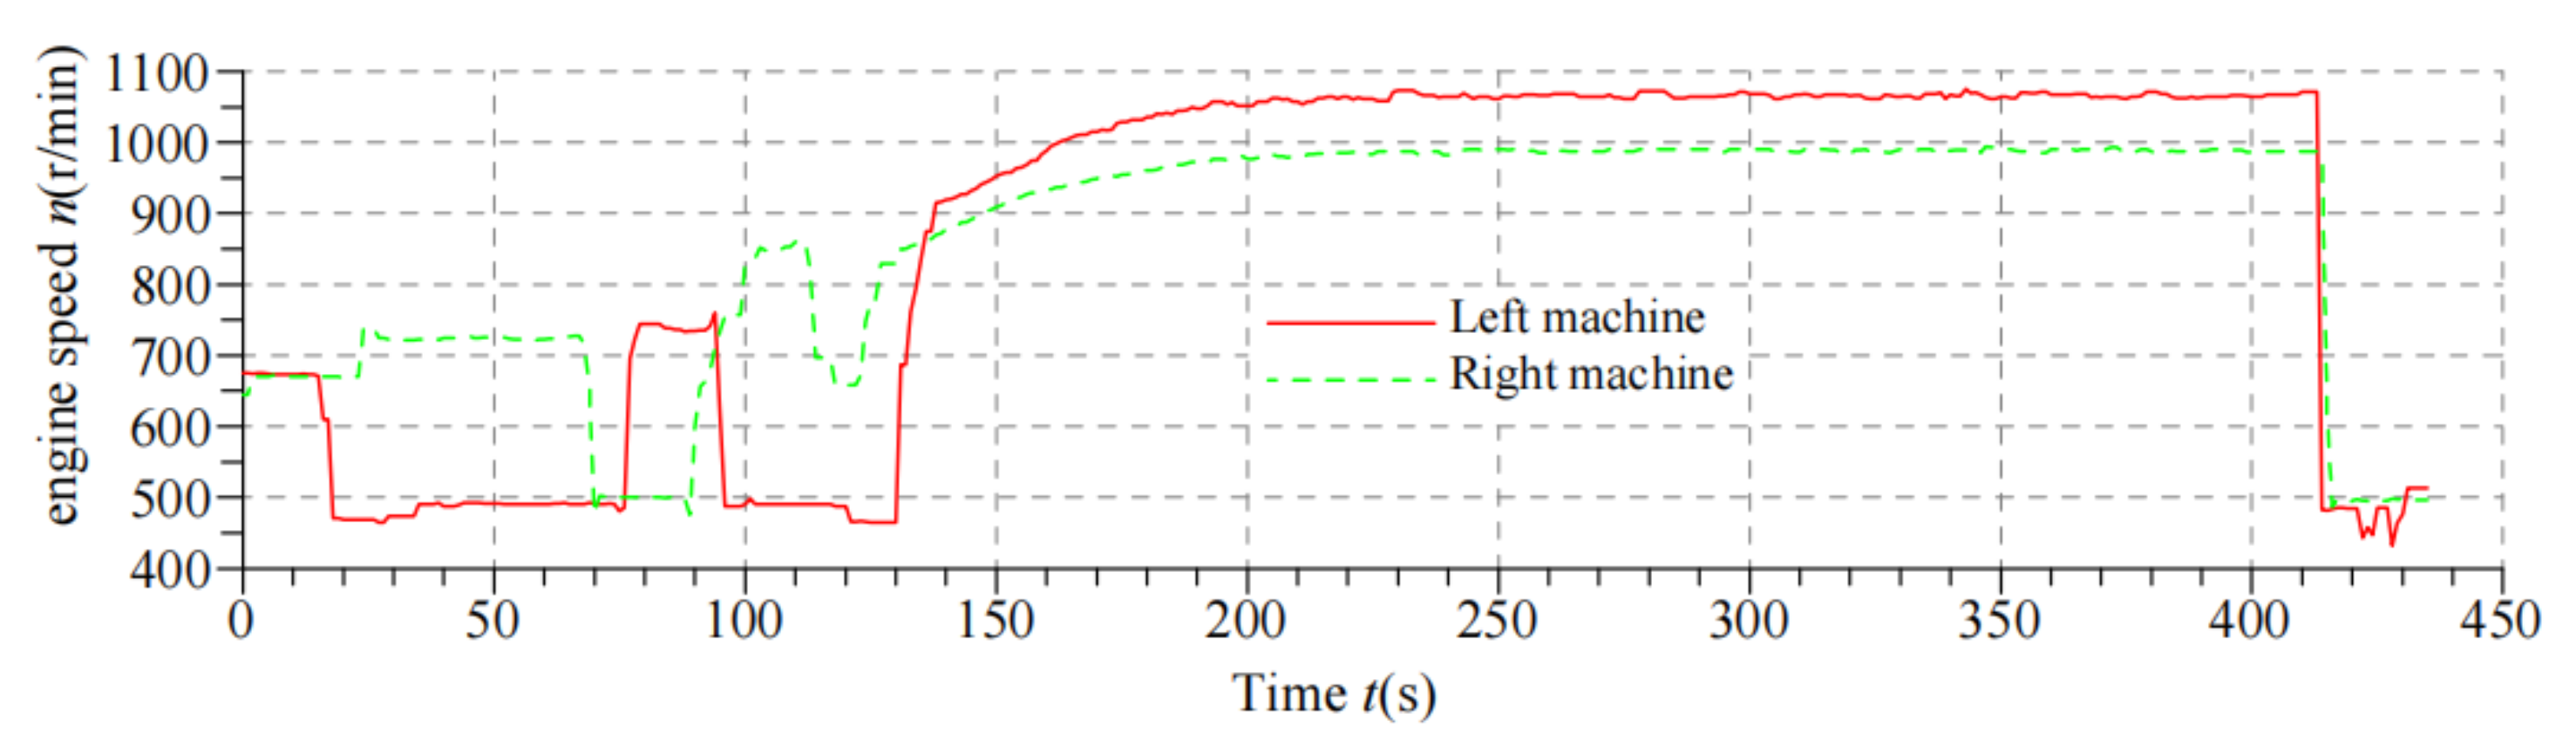
:1. Introduction
1.1. Determination Method of the Rapid Suppression Index
1.2. Expression of the Rapid Suppression Index
1.2.1. Slope Flow Index
1.2.2. Comprehensive Index of Unit Energy
1.2.3. Power Index
1.3. Research Progress the of the Rapid Suppression Index
1.4. Disadvantages of Existing Expressions
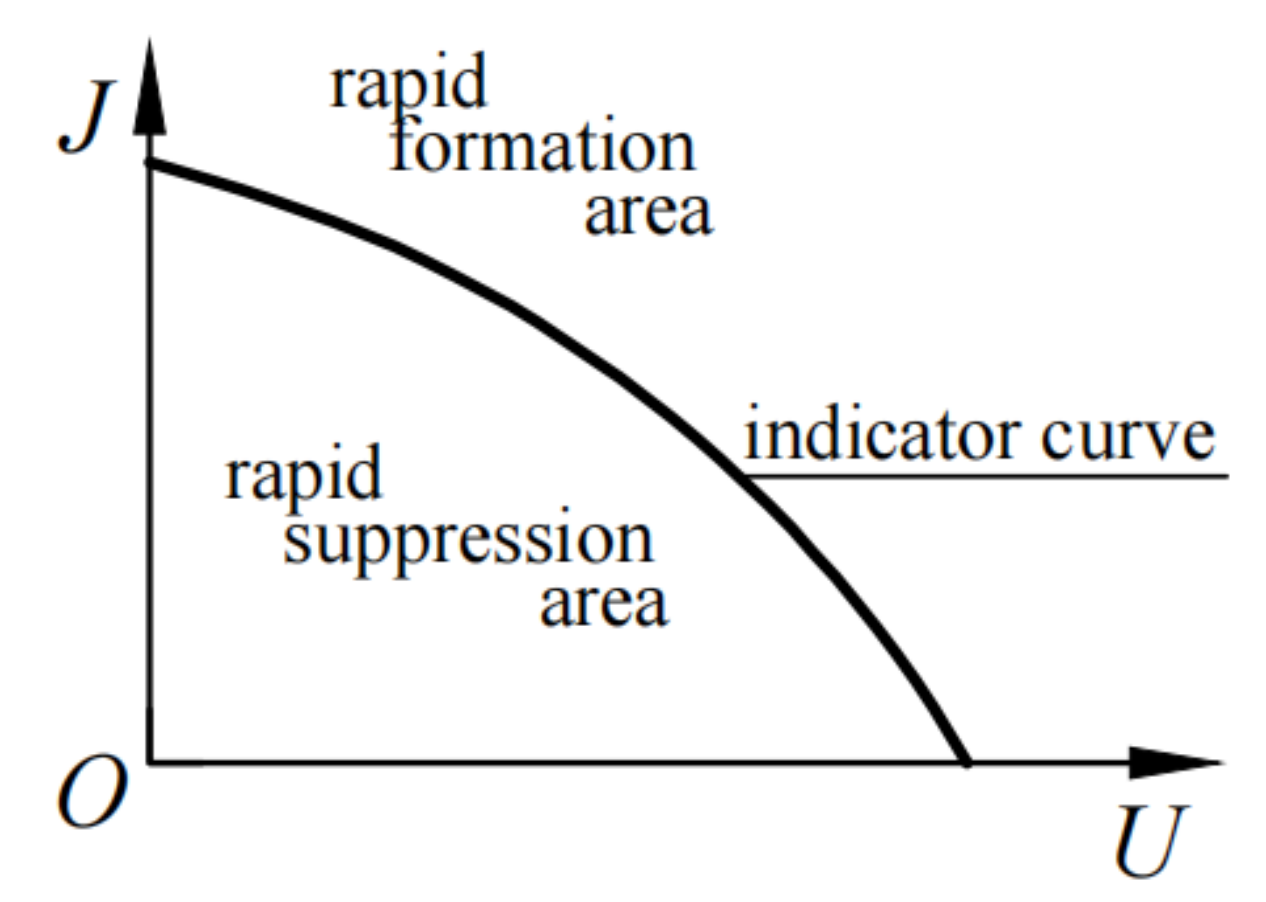
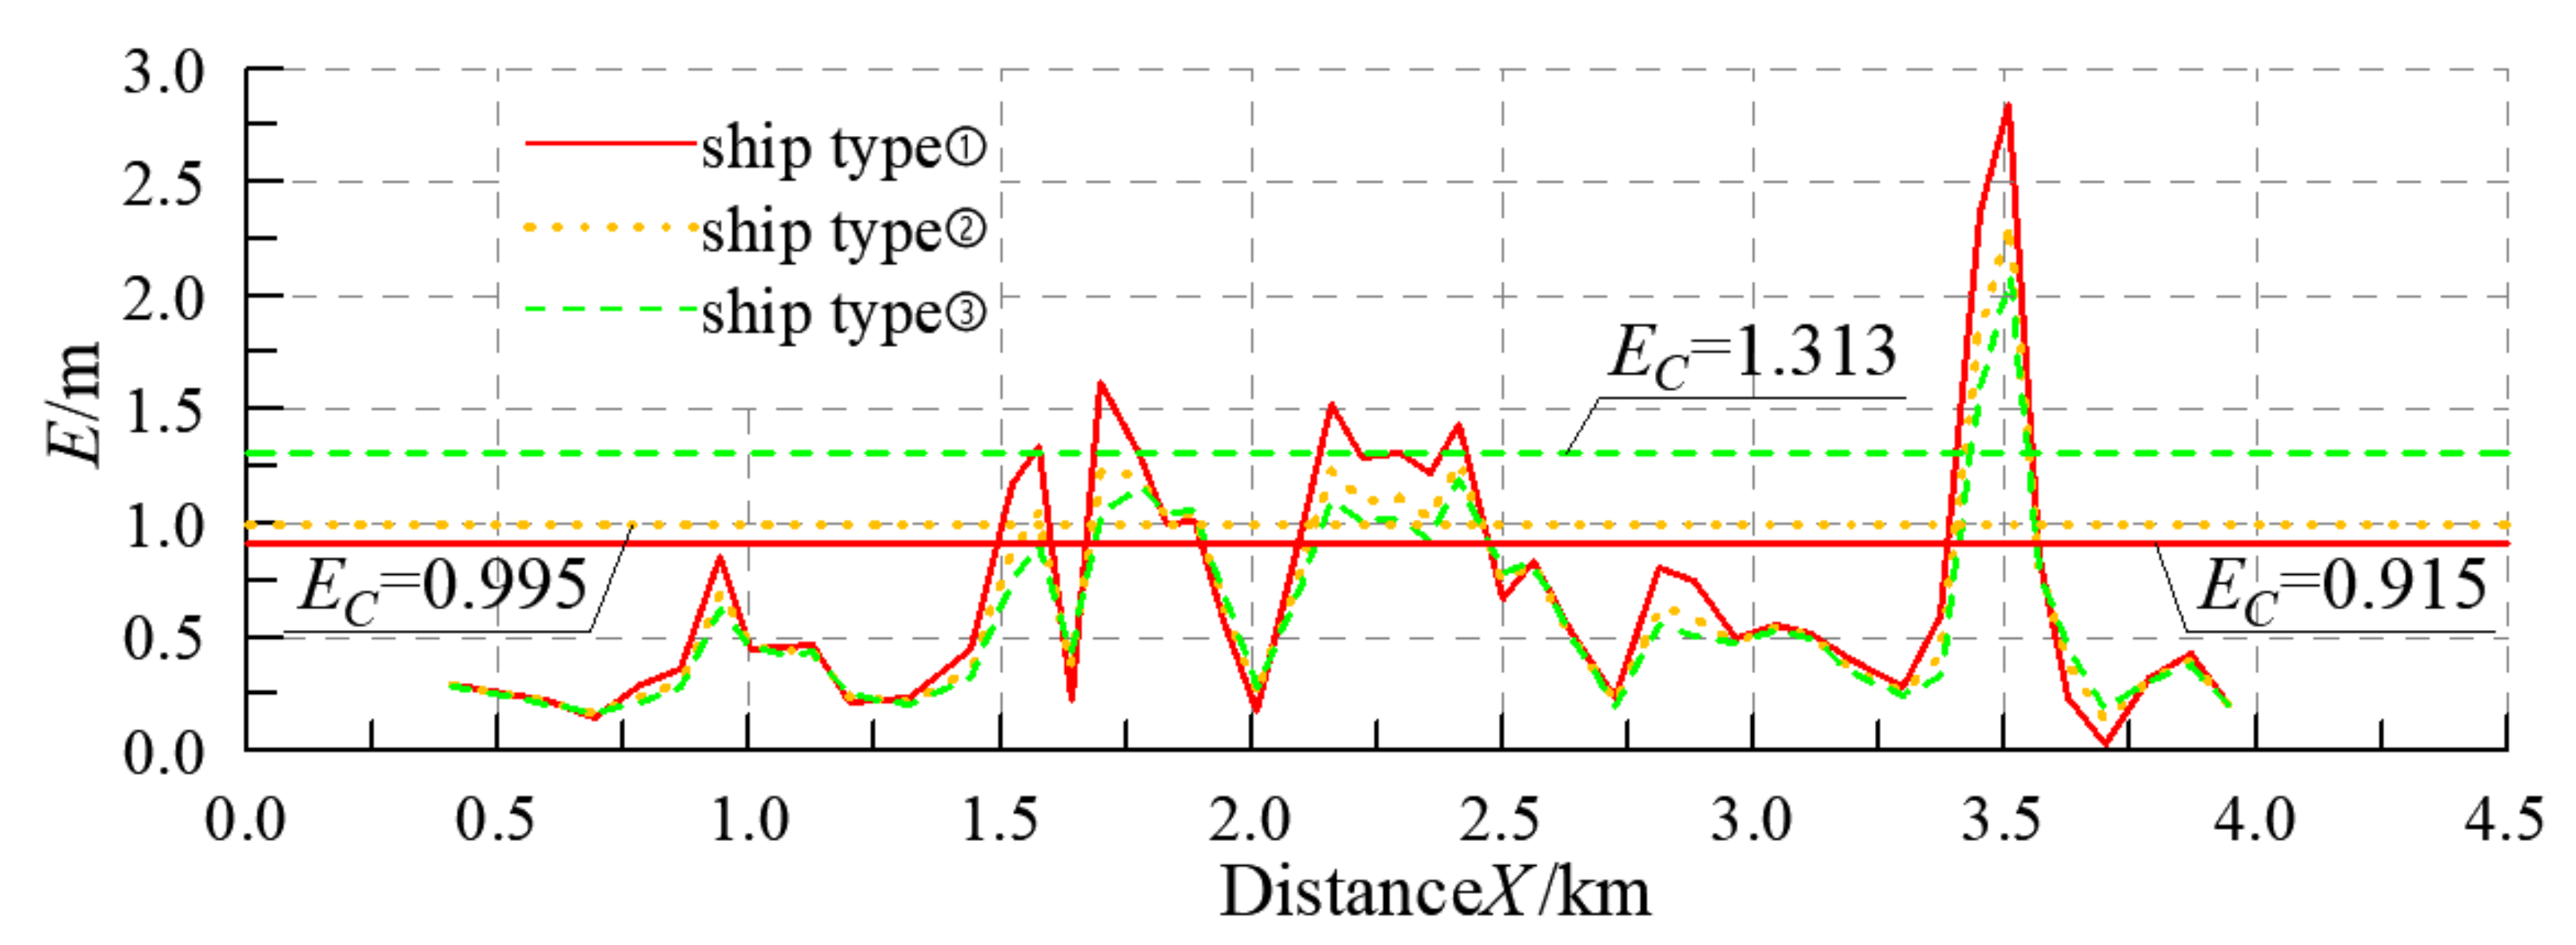
- The critical index EC is not unified, and EC is different for different ship types, which inconveniences the application. As shown in Figure 2, the critical standard EC is not unified, with multiple critical boundaries being required for comparing multiple ship types, which is chaotic, and the comparison of the ability to ascend rapids is not intuitive.
- The correlation with the slope flow index is not strong, and the corresponding relationship is inconsistent. Equation (2) specifically reflects the EC and λ indicators. Although λ corresponds to the J indicator of the slope flow indicator, EC has no corresponding item of the slope flow indicator, which is slightly less reasonable.
- The index EC expressed by unit energy has length dimensions. If it can be changed into a dimensionless index, it has more universal significance.
2. Methods
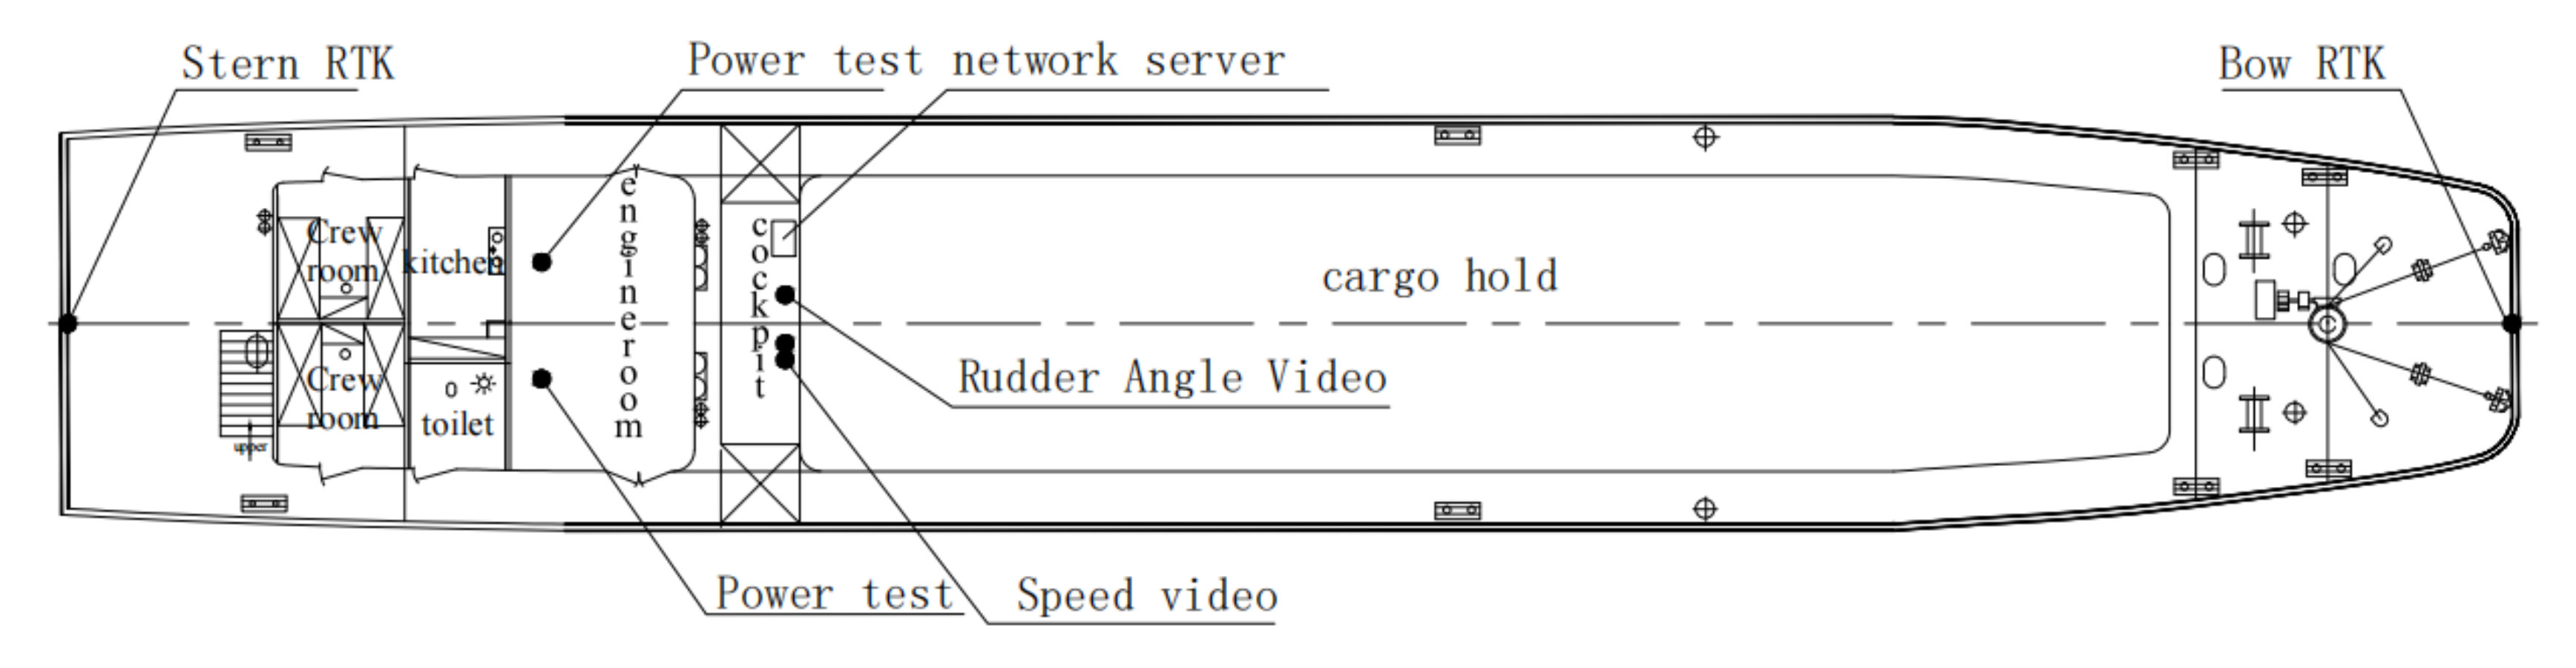
2.1. Test
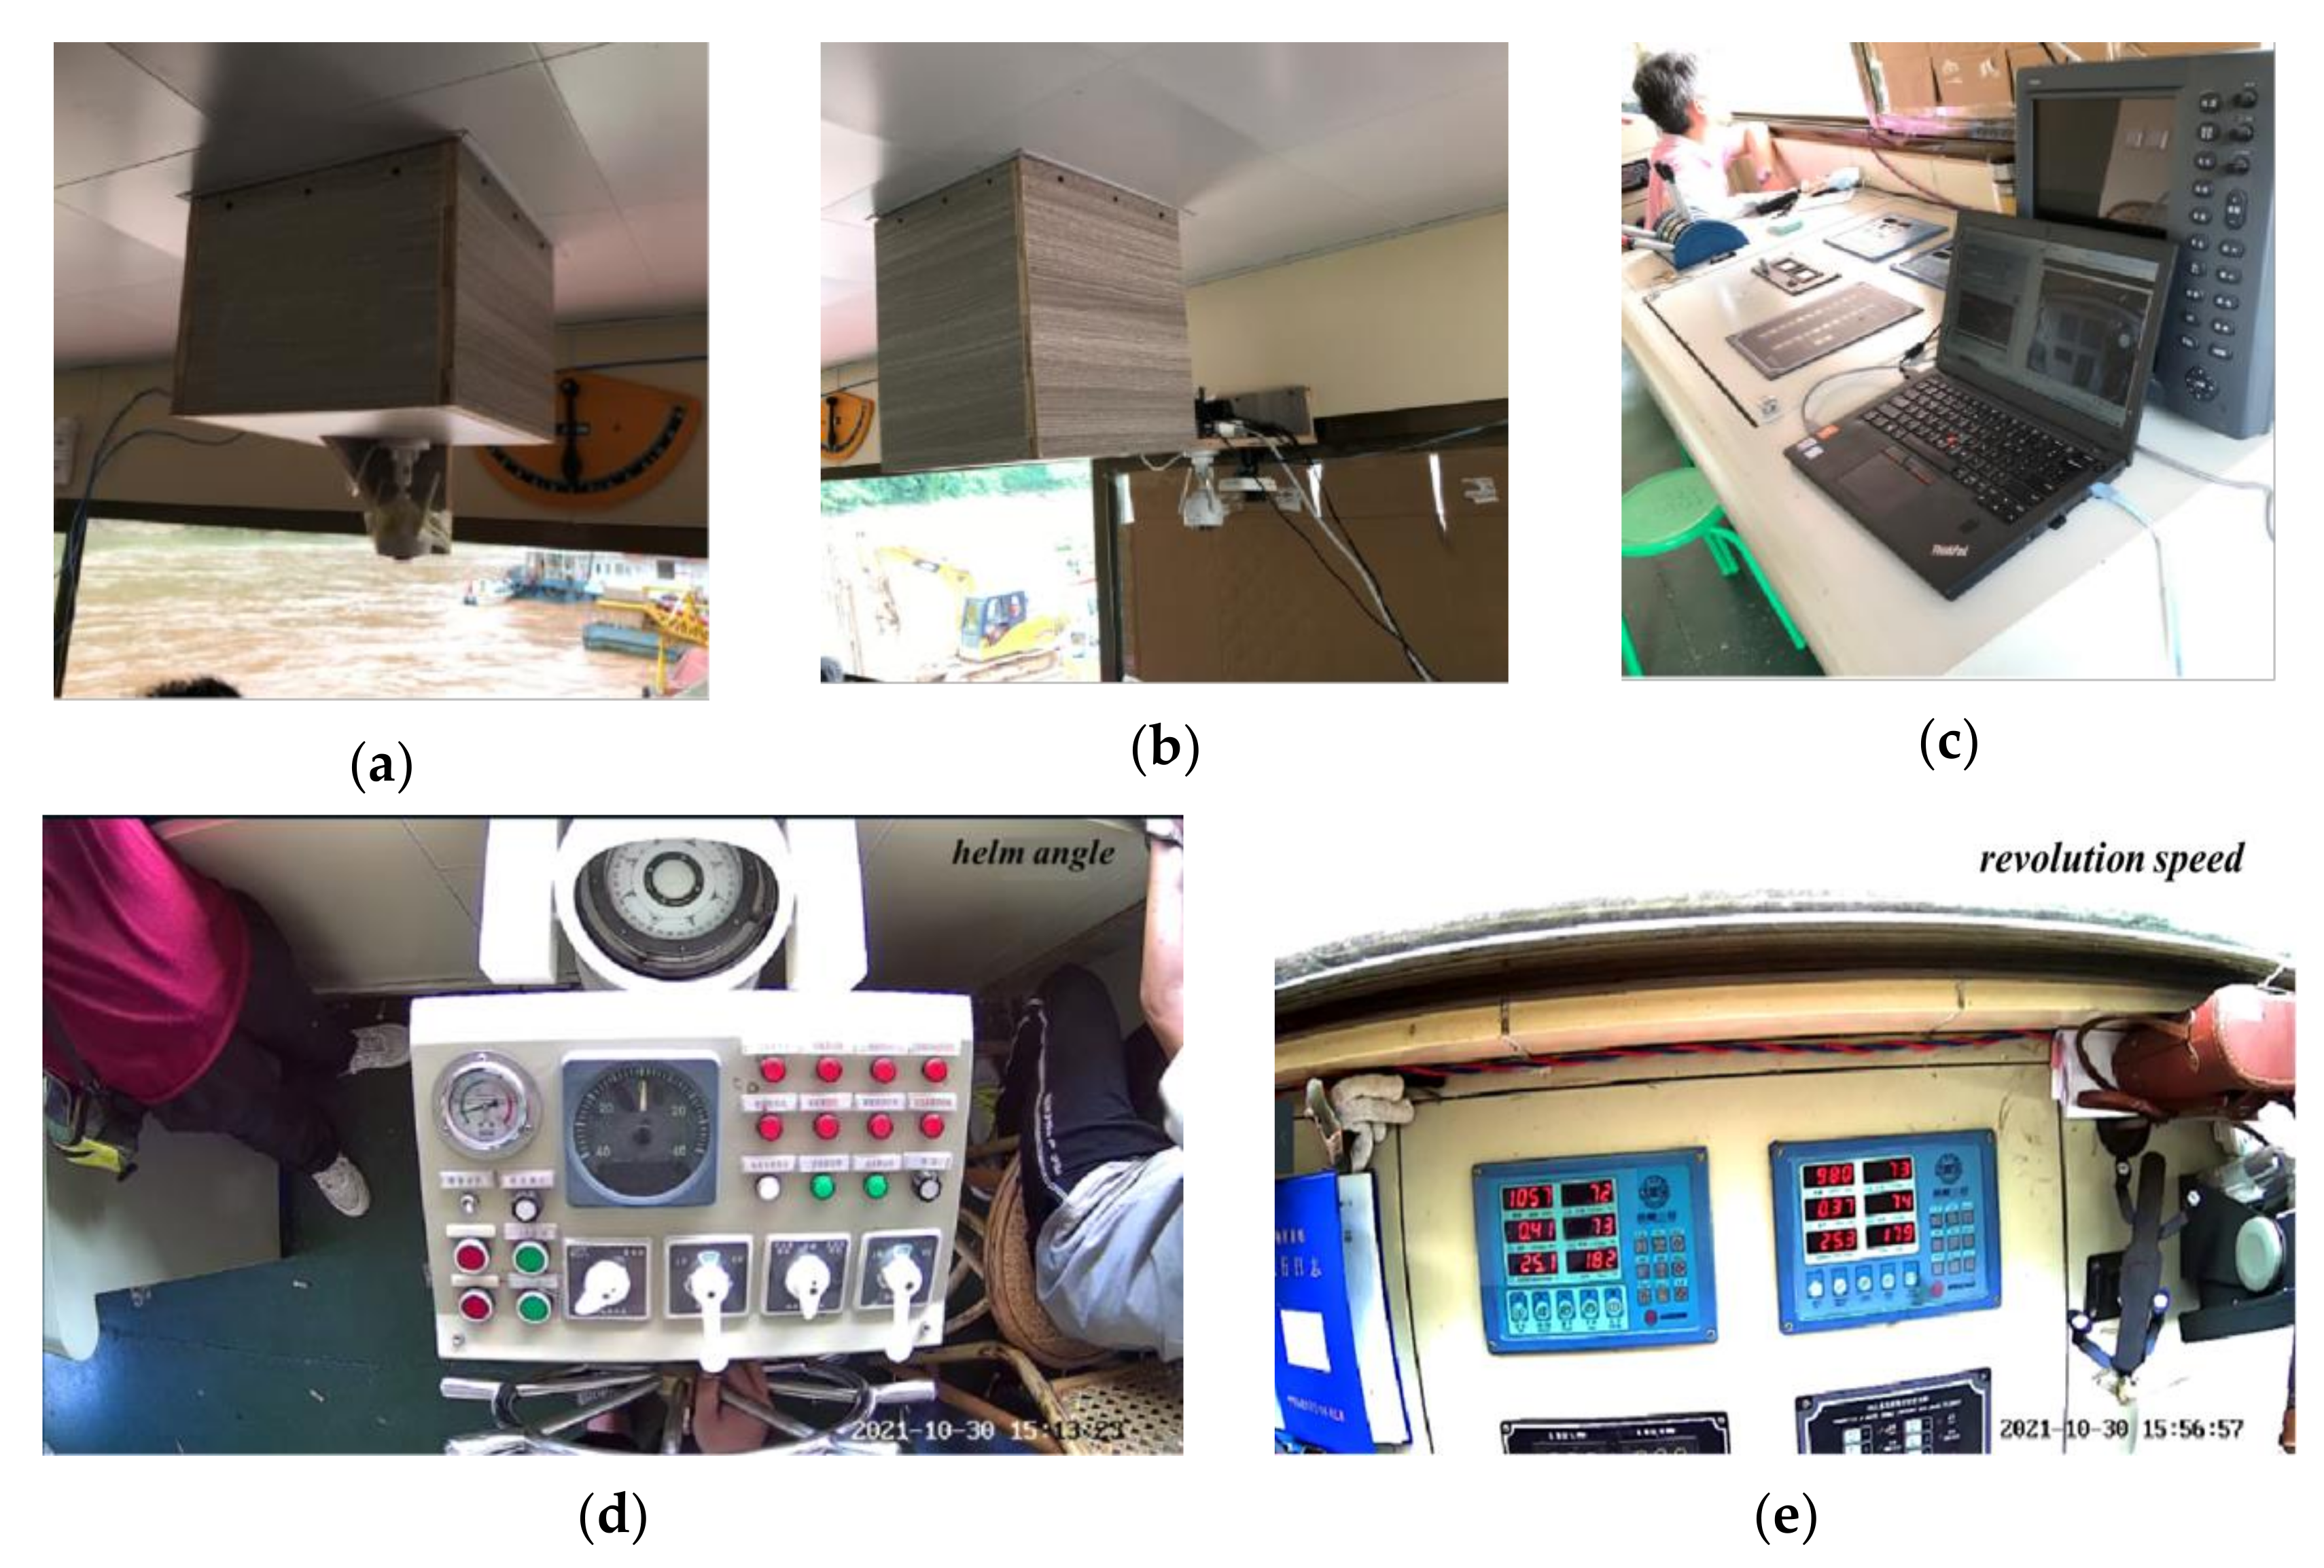
2.1.1. Still Water Speed Test
2.1.2. Rudder Angle and Engine Speed Test
2.1.3. Track and Speed Test
2.1.4. Velocity and Water Level Test
2.1.5. Wind Speed, Wind Direction and Water Temperature Test
2.2. The Theoretical Derivation of Critical Standard Normalized Rapid Suppression Index
3. Results
3.1. Test Data
3.2. The Determination of Critical Standard Normalized Rapid Suppression Hydraulic Index
4. Discussion
4.1. Application of Critical Standard Normalized Rapid Suppression Index
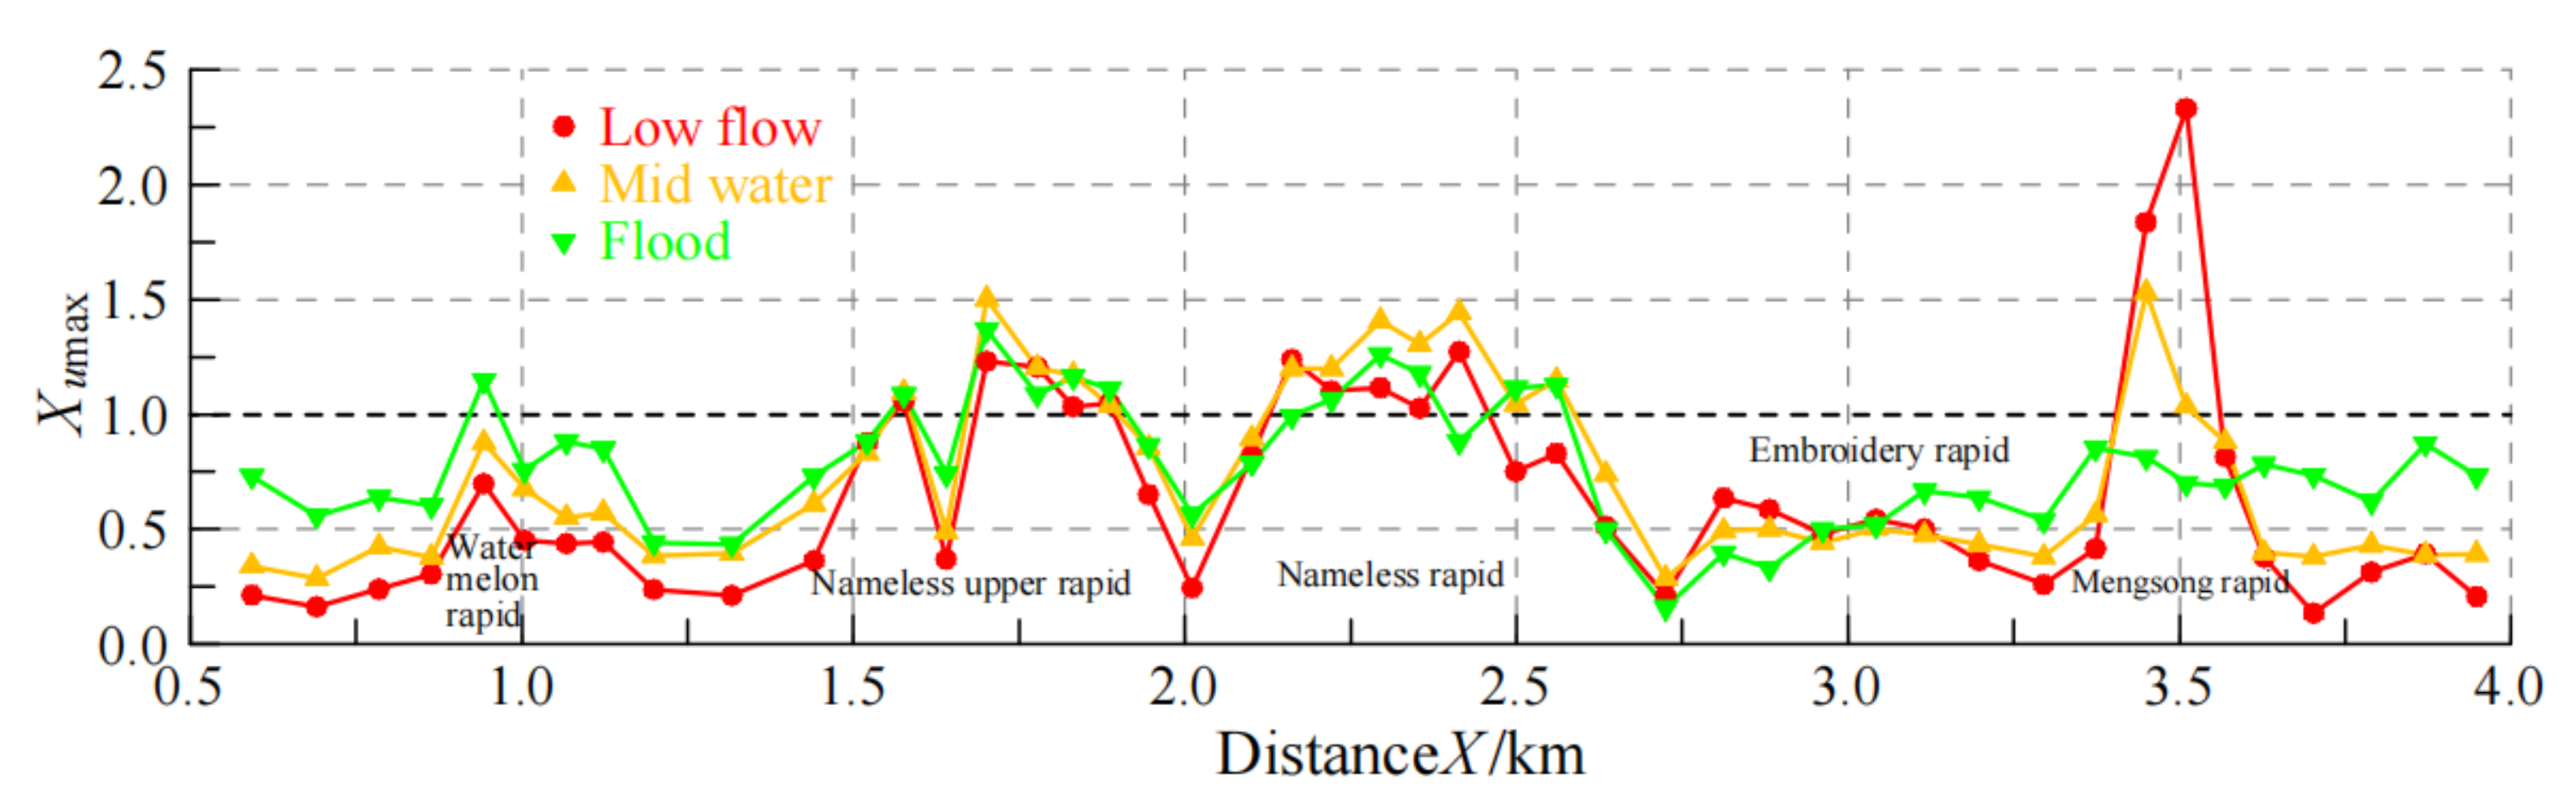
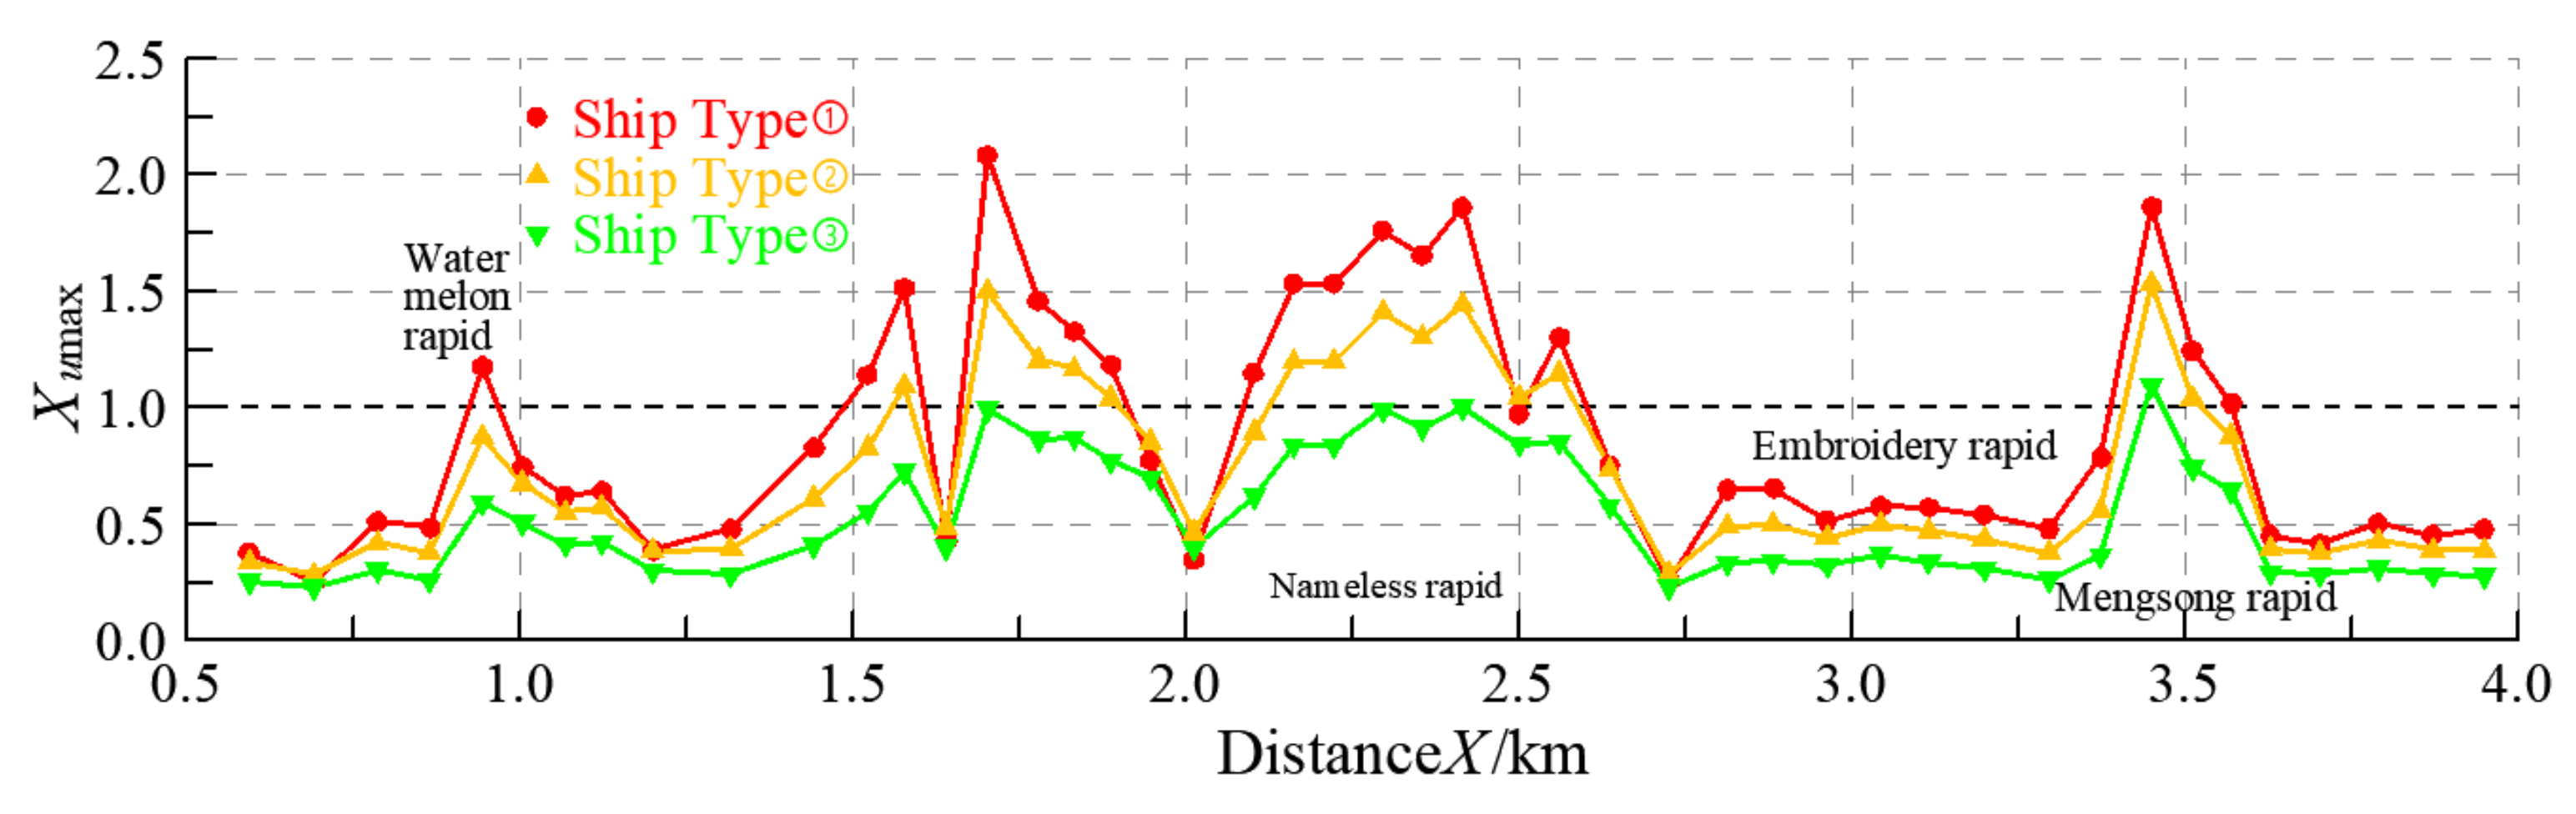
4.1.1. Analysis and Assessment of Navigation Obstruction Rapids Reach
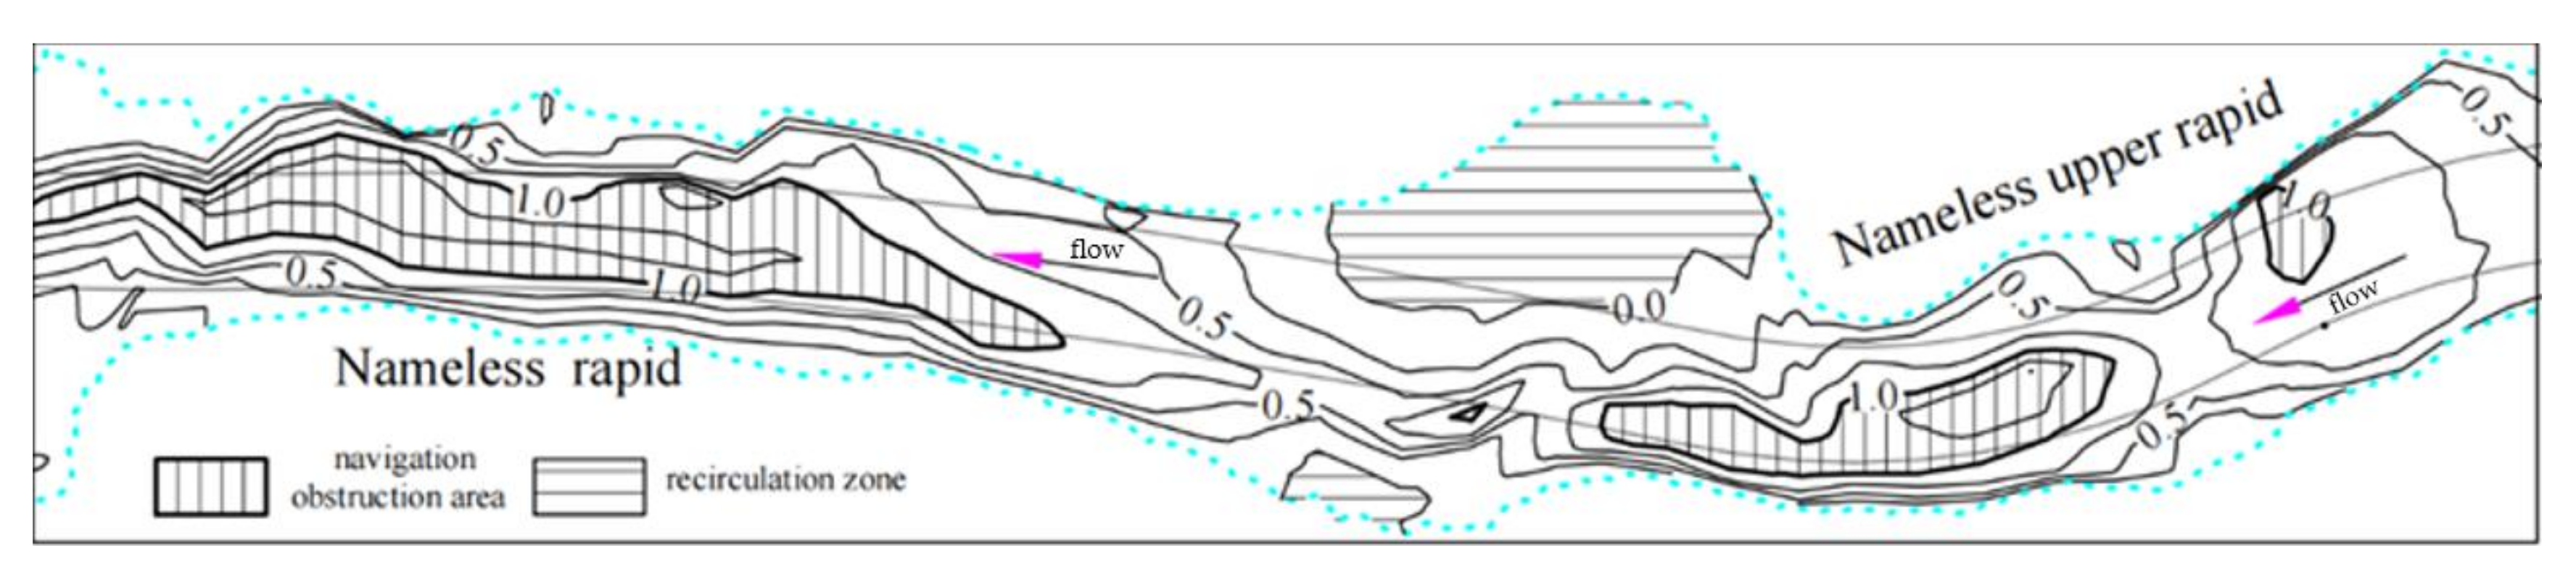
4.1.2. Analysis and Assessment of Navigation Obstruction Area
4.1.3. Comparative Analysis of Multiple Ship Types
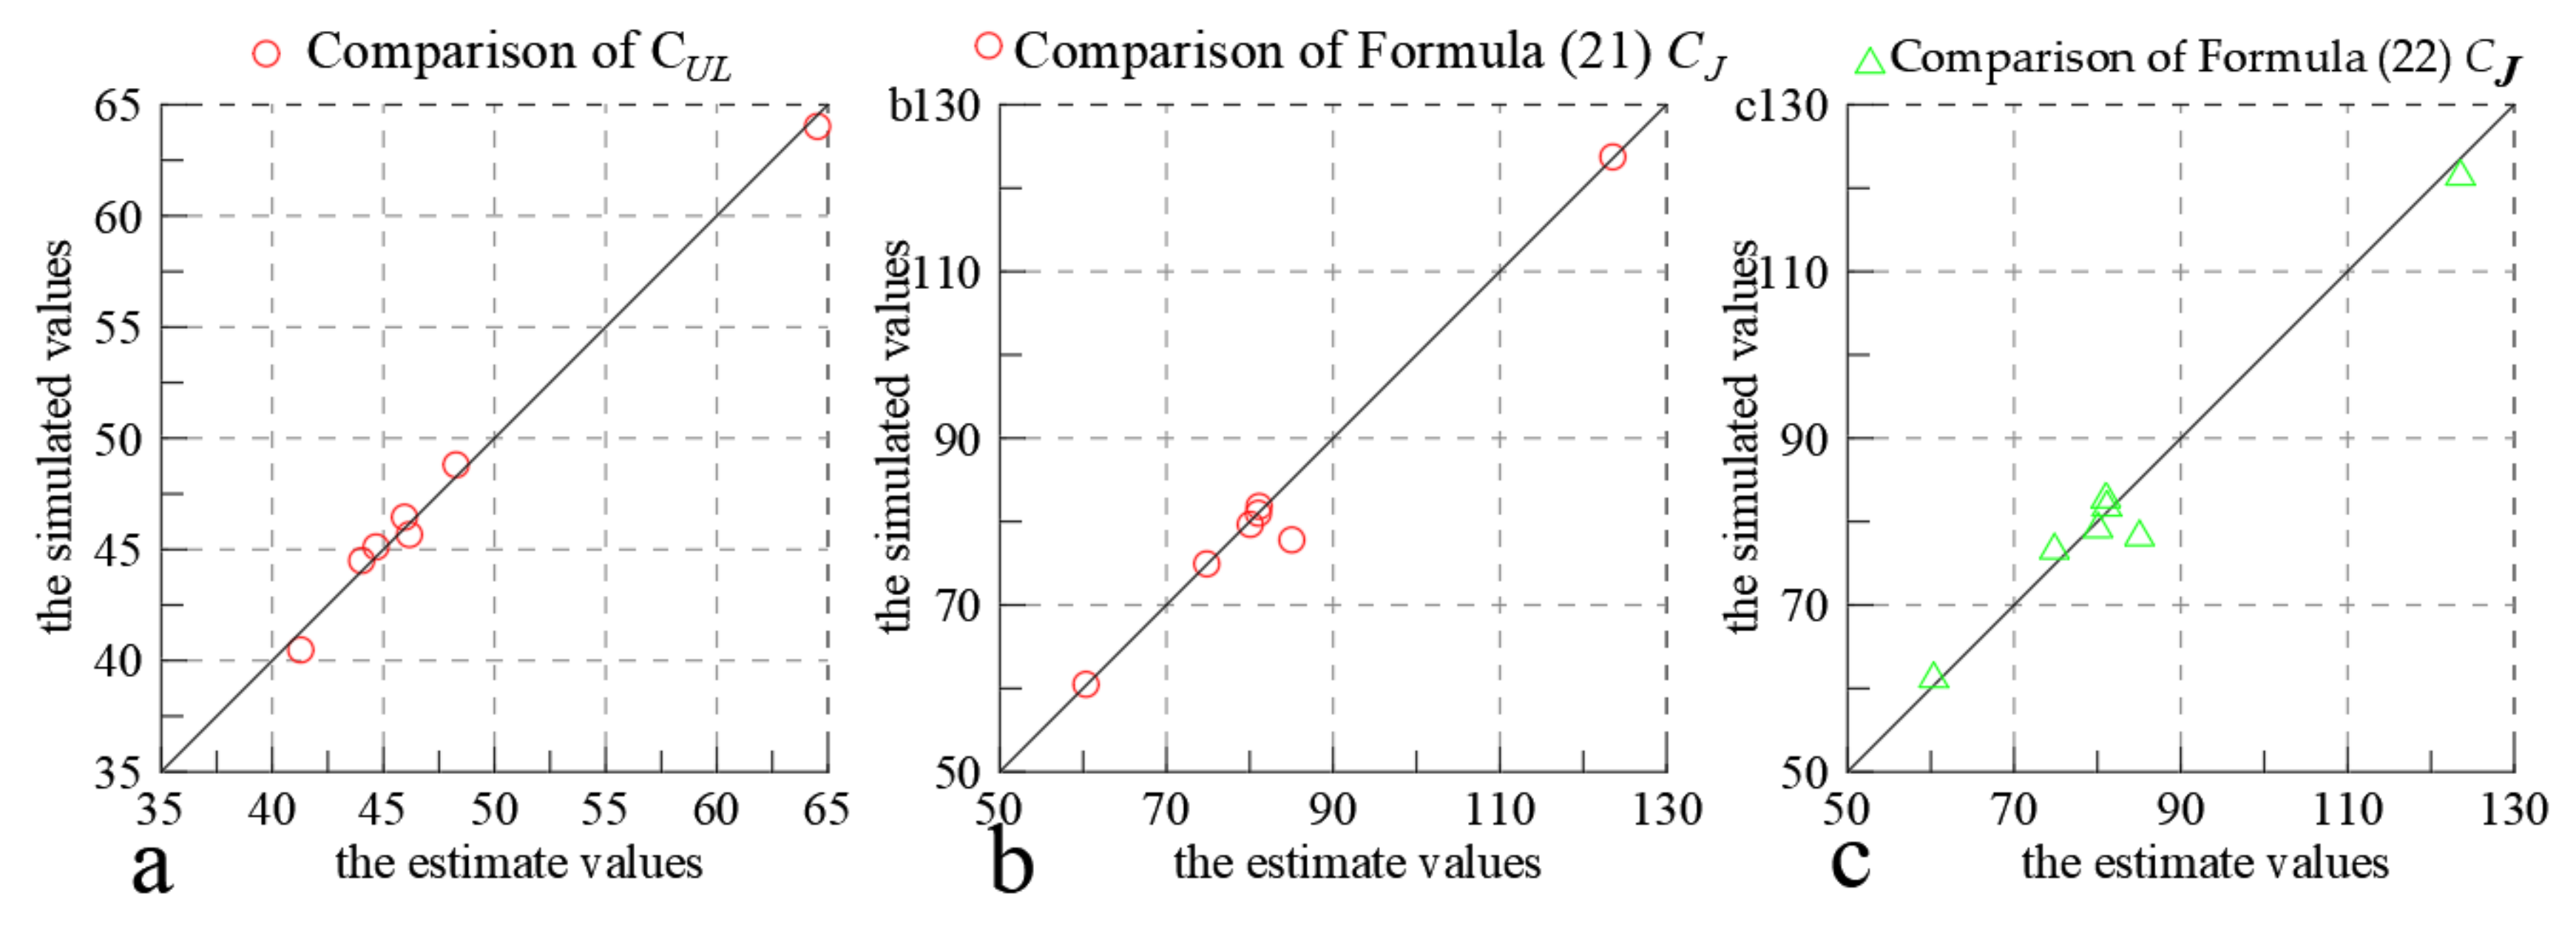
4.2. Estimate of the Flow Velocity Fraction and Water Surface Slope Fraction
4.2.1. Estimated Formula of the Flow Velocity Fraction and Slope Fraction
4.2.2. Application Scope of Estimate Formula
5. Conclusions
- (1)
- The deficiency of the existing unit energy index is that not only is the critical index EC not unified but also different ship types have different EC values, which makes it inconvenient to use. Additionally, the matching relationship of the slope flow index is not strong.
- (2)
- The dimensionless expression of the critical standard normalized rapid suppression hydraulic index was derived, which reflects the distribution of the corresponding flow propulsion and corresponding slope propulsion the total propulsion. In particular, the critical standard is unified as 1, which is no longer affected by the change in ship type, making its application convenient. The flow velocity fraction CU and slope fraction CJ are fitted through the known slope flow index and then combined into the rapid suppression index Xu, which can easily assess the rapid-forming reach and navigation obstruction area.
- (3)
- The empirical formulas for estimating the flow velocity fraction and slope fraction were established by using the main parameters of each ship type. Then, a series of slope flow indices were calculated through the expression of the critical standard normalized rapid suppression hydraulic index, which provides a reference for determining the rapid suppression hydraulic index in the absence of detailed ship type data.
Author Contributions
Funding
Institutional Review Board Statement
Informed Consent Statement
Data Availability Statement
Conflicts of Interest
References
- Zheng, J. Evaluation of Channel Regulation Project in Dewatering Section under Cascade Junction Dam. Master’s Thesis, Southeast University, Nanjing, China, 2019. [Google Scholar]
- Changjiang waterway bureau. Chuanjiang Waterway Regulation; China Communications Press: Beijing, China, 1998. [Google Scholar]
- Zu, M. History of Chuanjiang Waterway Regulation; Chinese Literature and History Press: Beijing, China, 1993. [Google Scholar]
- Yunnan Provincial Shipping History Compilation Committee. Yunnan Shipping History; Yunnan Provincial Shipping History Compilation Committee: Kunming, China, 2010. [Google Scholar]
- Three combined writing group. Mountain Channel Regulation; People’s Transportation Press: Beijing, China, 1975. [Google Scholar]
- Liu, X.; Wang, L. Research Summary of Reservoir Beach Regulation. Technol. Innov. Appl. 2015, 12, 168. [Google Scholar]
- Changjiang waterway Bureau. Waterway Engineering Manual; People’s Transportation Press: Beijing, China, 2004. [Google Scholar]
- Cao, M.; Tang, C.; Cai, G. Research on hydraulic characteristics of rock rapids with generalized experi-ments. Hydro-Sci. Eng. 2004, 12, 26–31. [Google Scholar]
- Cao, M.; Cai, G. Analyzing method and example of shoal characteristics in rock rapids. Port Waterw. Eng. 2008, 422, 110–113. [Google Scholar]
- Wu, J. Study on Wujiang River Waterway Rapids Regulation. Port Waterw. Eng. 2002, 344, 62–64. [Google Scholar]
- Xu, G.; Duan, Z.; Hu, X. Analysis and application of rapids Abating indicators. Port Waterw. Eng. 2015, 7, 108–113. [Google Scholar]
- Yang, X. Inversion Study on the Shoal Types of Hydraulic Parameter of Rapids Abating. Master’s Thesis, Chongqing Jiaotong University, Chongqing, China, 2010. [Google Scholar]
- Tian, Y. Study on Regulation of Lianjiang Beach in Changjiang River; Chongqing Jiaotong University: Chongqing, China, 2017. [Google Scholar]
- Jiao, T. Study on the Flow Characteristics and Regulation of Long Straight Rapid Shallow. Master’s Thesis, Chongqing Jiaotong University, Chongqing, China, 2018. [Google Scholar]
- Ren, K. Mathematical Model Study on waterway Regulation of Wuming Beach with Rapid and Shallow Group, Lancang river. Master’s Thesis, Chongqing Jiaotong University, Chongqing, China, 2019. [Google Scholar]
- Xu, G.; Deng, M.; Tong, S.; Cai, C. Rapids Hydraulic Engineering; People’s Transportation Press: Beijing, China, 2010. [Google Scholar]
- Cao, M. Study on the Regulation of Waterway with Rapids in Mountainous Rivers. Ph.D. Thesis, Nanjing Hydraulic Research Institute, Nanjing, China, 2005. [Google Scholar]
- Tong, S.; Xu, G.; Deng, M. Study on sailing resistance navigable hydraulic parameter to rapids shoal of Lancang River. Yangtze River 2010, 41, 67–72. [Google Scholar]
- Chen, Y.K. Ship-team sailing Resistance Computation and Analysis on the Open Channel Navigation of Three Gorges Project. Wuhan Yangtze River Sci. Res. Inst. 1993, 10, 1–9. [Google Scholar]
- Yan, W.; Jin, F.; Jiao, C.W. Study on Navigation Ship Model Duplication Tests in Still Water Ship-Pond. J. Yangtze River Sci. Res. Inst. 2005, 22, 5–7. [Google Scholar]
- Cai, C. The ways of applying AutoCAD graphics files to network. J. Chongqing Jiao Tong Univ. 2001, 20, 110–120. [Google Scholar]
- Chen, W.; Chen, G. Numerical simulation of navigation. J. Chongqing Jiao Tong Univ. 2000, 19, 102–109. [Google Scholar]
- Jiang, P.; Tong, S.; Xu, G.; Huang, G. Review and application of determination methods on navigable hydraulic index of rapids in mountainous river. Ocean. Eng. 2022, 248, 1–12. [Google Scholar] [CrossRef]
- Li, Y. Discussion on the Method of Inland ship sailing Resistance Calculation. J. Waterw. Harb. 2002, 23, 6–11. [Google Scholar]
- Yang, S.; Zhao, X.; Wang, H. On Hydraulic parameter of Rapids Abating of Pebble Rapids on the Upper Reaches of the Yangtze River. Port Waterw. Eng. 2007, 8, 78–81+92. [Google Scholar]
- Cao, M. Defined method of hydraulic parameter of rapids abating. J. Traffic Transp. Eng. 2006, 6, 80–83. [Google Scholar]
- Xu, G.; Zeng, F. Reasonable expression of hydraulic parameters of rapids abating. Port Waterw. Eng. 2010, 11, 103–106. [Google Scholar]
- Zhang, P.; Hu, J. Study on Navigable Hydraulic Parameter of 3000-ton Ships at the Rapids of Three Gorges Reservoir Area. J. Chongqing Jiao Tong Univ. (Nat. Sci.) 2012, 31, 877–880. [Google Scholar]
- Cao, M.; Li, H.; Lu, H. Discussion on methods to determine rapids suppression hydraulic indexs. Yangtze River 2004, 35, 35–37+62. [Google Scholar]
- Xu, G.; Fei, L. Determination Method of Riffle Shoal Hydraulic Parameter of Rapids Abating Index of Lancang River. J. Chongqing Jiao Tong Univ. (Nat. Sci.) 2012, 31, 1244–1247. [Google Scholar]
- Chen, M.; Wen, C.; Chen, J. Regulation of sharp-bend shoal in Lancangjiang River. Port Waterw. Eng. 2003, 359, 56–59. [Google Scholar]
- Wang, S.; Gan, J.; Zhou, G. River Regulation of Upper Yangtze for Navigation. Shuili Xuebao 1980, 4, 12–25. [Google Scholar]
- Yang, Y. Analyze on Navigation Safety of Cargo Ship; Wuhan University of Technology: Wuhan, China, 2012. [Google Scholar]
- Cao, M.; Tang, C.; Cai, G. Formation Condition and Pattern of Navigation—Obstructing Flow of Rock Rapids. Port Waterw. Eng. 2003, 357, 43–46. [Google Scholar]
- Cao, M.; Tang, C.; Cai, G. Experimental study on influencing factors ships asceding rapids and hydro-dynamic characteristics. Hydro-Sci. Eng. 2004, 2, 16–22. [Google Scholar]
- Xu, G.; Yang, X.; Yang, X. The Real Ship Test and Research Report on the Navigation Hydraulic Index of 500 Tons of Ships in the Fourth Channel Construction Project of Lancang River 244 Boundary Pillar to Lincang Port; Chongqing Jiaotong University: Chongqing, China, 2022. [Google Scholar]
- Xu, G. Physical Model Test Report on Waterway Regulation of Unknown Beach Section of Lancang River 244 Boundstone to Lincang Port 4th Waterway Construction Project; Chongqing Jiaotong University: Chongqing, China, 2017. [Google Scholar]
- Zhong, L. Fractal Characteristics of Channel Bedform Resistance. Ph.D. Thesis, Chongqing Jiaotong University, Chongqing, China, 2011. [Google Scholar]


| Number | Ship Type | Slope Flow Index | Water Discharge /m3 | Length of the Ship L/m | ||||||||
|---|---|---|---|---|---|---|---|---|---|---|---|---|
| ① | Chuanjiang 881 kw Top 1000 t Fleet | J/‰ | 1 | 2 | 3 | 1162 | 92.5 | |||||
| U/m·s−1 | 3.9 | 3.5 | 3.1 | |||||||||
| ② | Lancang River 510 kw 300 t cargo ship | J/‰ | 1 | 2 | 3 | 4 | 5 | 6 | 7 | 8 | 405 | 46.2 |
| U/m·s−1 | 4.2 | 4.0 | 3.8 | 3.6 | 3.3 | 3.0 | 2.7 | 2.4 | ||||
| ③ | Lancang River 1440 kw 500 t cargo ship | J/‰ | 1 | 2 | 3 | 4 | 5 | 6 | 7 | 8 | 731.3 | 54.4 |
| Basic Parameter | Number | Category | Load W (t) | Displacement (m3) | Length L (m) | Wide B (m) | Draft T (m) | Power PS0 (kw) | Power Load Ratio PS0/(kW/t) |
| Test 1 | 500 t Self-unloader | 434.45 | 675.267 | 52.32 | 8.6 | 1.95 | 2 × 530 | 1.57 | |
| Other parameter | Molded depth (m) | Light load displacement(m3) | Waterline length LW (m) | Waterplane area (m2) | Design speed V0 (km/h) | Rated rotation n0 (r/min) | Gearbox reduction ratio | Propeller shaft cross type | |
| 2.80 | 240.817 | 51.103 | 422.6 | 21.0 | 1200 | 3:1 | MAU4 | ||
| Pitch ratio II/D | Propeller disc area ratio | Propeller blade number | Propeller diameter D (m) | Block coefficient δ | Mid-section area coefficient β | Waterplane coefficient CW | Prismatic coefficient CP | ||
| 0.7765 | 0.50 | 4 | 1.70 | 0.788 | 0.973 | 0.962 | 0.809 | ||
| Load Conditions | Test Date/Time | Water Temperature (°C) | Wind Velocity (m/s) | Wind Direction |
|---|---|---|---|---|
| 100%W0 | 2021.10.30 p.m. | 21.0 | 0.2 | Due south |
| 75%W0 | 2021.10.31 p.m. | 20.5 | 0.4 | Due south |
| 50%W0 | 2021.11.01 a.m. | 19.0 | 0.3 | Southeast |
| Ship Number | Load G/t | Water Discharge/m3 | Length L/m | Wide B/m | Draft T/m | Power P/kW | Waterline Length LW/m | Block Coefficient δ | Remark |
|---|---|---|---|---|---|---|---|---|---|
| BT1 | 500 | 680 | 56 | 8.8 | 2.0 | 2 × 400 | 54.2 | 0.713 | Design representative cargo ship |
| BT2 | 500 | 760 | 56 | 9.8 | 2.0 | 2 × 450 | 54.2 | 0.715 | Design representative container ship |
| BT3 | 420 | 594.2 | 52.6 | 8.3 | 1.95 | 2 × 353 | 51.0 | 0.720 | Actual cargo ship |
| BT4 | 420 | 678.8 | 53.4 | 8.6 | 1.9 | 2 × 426 | 51.2 | 0.812 | Actual container ship |
| BT5 | 532 | 799 | 59.6 | 8.7 | 2.2 | 2 × 325 | 58.0 | 0.720 | Long-term planning ship |
| BT6 | 434 | 675 | 52.32 | 8.6 | 1.95 | 2 × 530 | 51.1 | 0.788 | Actual cargo ship (test ship) |
| BT7 | 320 | 445 | 46.2 | 7.6 | 1.75 | 2 × 255 | 44.0 | 0.760 | 300 t class actual cargo ship |
| Gradient J/‰ | Beach Flow Velocity U/m·s−1 | ||||||
|---|---|---|---|---|---|---|---|
| BT1 | BT2 | BT3 | BT4 | BT5 | BT6 | BT7 | |
| 0 | 4.94 | 4.85 | 4.82 | 4.63 | 4.25 | 4.96 | 4.41 |
| 1 | 4.75 | 4.68 | 4.64 | 4.48 | 3.99 | 4.83 | 4.24 |
| 2 | 4.55 | 4.48 | 4.45 | 4.31 | 3.70 | 4.69 | 4.06 |
| 3 | 4.33 | 4.26 | 4.24 | 4.12 | 3.38 | 4.53 | 3.86 |
| 4 | 4.09 | 4.03 | 4.01 | 3.92 | 3.02 | 4.37 | 3.63 |
| 5 | 3.83 | 3.77 | 3.76 | 3.70 | 2.62 | 4.19 | 3.39 |
| 6 | 3.55 | 3.49 | 3.49 | 3.47 | 2.15 | 3.99 | 3.11 |
| 7 | 3.25 | 3.19 | 3.20 | 3.20 | 1.60 | 3.78 | 2.81 |
| 8 | 2.93 | 2.88 | 2.88 | 2.93 | 1.00 | 3.55 | 2.47 |
| Ship Type | CU | CJ | L(m) | Critical Rapid Suppression Index XuC (Fitting Values) | |||||||
|---|---|---|---|---|---|---|---|---|---|---|---|
| J = 1‰ | 2‰ | 3‰ | 4‰ | 5‰ | 6‰ | 7‰ | 8‰ | ||||
| ① | 101.07 | 155.93 | 92.5 | 1.0030 | 0.9941 | 1.0030 | |||||
| ② | 46.43 | 88.49 | 46.2 | 0.9920 | 0.9965 | 1.0051 | 1.0178 | 1.0003 | 0.9919 | 0.9928 | 1.0030 |
| ③ | 41.44 | 48.08 | 54.4 | 0.9999 | 0.9999 | 0.9999 | 0.9999 | 0.9999 | 1.0000 | 1.0000 | 1.0000 |
| Parameter | BT1 | BT2 | BT3 | BT4 | BT5 | BT6 | BT7 |
|---|---|---|---|---|---|---|---|
| L/m | 56 | 56 | 52.6 | 53.4 | 59.6 | 52.32 | 46.2 |
| CU | 44.67 | 46.17 | 44.02 | 48.27 | 64.53 | 41.28 | 45.95 |
| CJ | 81.12 | 81.03 | 80.06 | 74.84 | 123.55 | 60.35 | 85.04 |
| fitting deviation/% | −0.86~0.60 | −0.99~0.68 | −0.94~0.70 | −1.15~0.77 | −0.43~0.56 | −1.07~0.76 | −1.50~0.96 |
Disclaimer/Publisher’s Note: The statements, opinions and data contained in all publications are solely those of the individual author(s) and contributor(s) and not of MDPI and/or the editor(s). MDPI and/or the editor(s) disclaim responsibility for any injury to people or property resulting from any ideas, methods, instructions or products referred to in the content. |
© 2023 by the authors. Licensee MDPI, Basel, Switzerland. This article is an open access article distributed under the terms and conditions of the Creative Commons Attribution (CC BY) license (https://creativecommons.org/licenses/by/4.0/).
Share and Cite
Liu, T.; Xu, G. Critical Standard Normalized Rapid Suppression Hydraulic Index and Its Estimation. Sustainability 2023, 15, 2661. https://doi.org/10.3390/su15032661
Liu T, Xu G. Critical Standard Normalized Rapid Suppression Hydraulic Index and Its Estimation. Sustainability. 2023; 15(3):2661. https://doi.org/10.3390/su15032661
Chicago/Turabian StyleLiu, Tianyu, and Guangxiang Xu. 2023. "Critical Standard Normalized Rapid Suppression Hydraulic Index and Its Estimation" Sustainability 15, no. 3: 2661. https://doi.org/10.3390/su15032661
APA StyleLiu, T., & Xu, G. (2023). Critical Standard Normalized Rapid Suppression Hydraulic Index and Its Estimation. Sustainability, 15(3), 2661. https://doi.org/10.3390/su15032661