Article

Factors That Influence the Livelihood Resilience of Flood Control Project Resettlers: Evidence from the Lower Yellow River, China

1
Research Center for Reservoir Resettlement, China Three Gorges University, Yichang 443002, China
2
School of Economics and Management, China Three Gorges University, Yichang 443002, China
3
Engineering Construction Center, Yellow River Henan Bureau, Zhengzhou 450003, China
*
Author to whom correspondence should be addressed.
Sustainability 2023, 15(3), 2671; https://doi.org/10.3390/su15032671
Submission received: 11 December 2022 / Revised: 31 December 2022 / Accepted: 1 January 2023 / Published: 2 February 2023

Abstract

:
Land requisition and resettlement of migrants are two major parts of flood control projects. After a large land area was allocated for flood control projects, livelihood resilience of resettlers became a great challenge. In this paper, Puyang County, Taiqian County, and Fan County, Henan Province, China, are chosen for a household survey. An index system to assess farming households’ livelihood resilience is constructed. After that, regression analysis and variance analysis are adopted to examine influencing factors of resettlers’ livelihood resilience. Results suggest the following: (1) Livelihood resilience of resettled farming households is on the whole lower than that of non-resettled farming households; (2) Response to policies, family scale, livelihood strategy, and skill training are major influencing factors of resettled farming households’ livelihood resilience; (3) Compared with other types of farming households, livelihood resilience of farming households with land expropriated is significantly different. In order to enhance resettlers’ livelihood resilience, the government should expand the application scope of follow-up support policies of reservoir resettlement, enhance capability construction of resettlement management departments, strengthen support for resettlers’ employment, combine resettlement with rural revitalization strategy, and improve the social security system for flood control project resettlers.

1. Introduction

The Yellow River is the second longest river in China, extending for 5464 km from the Qinghai–Tibet Plateau to the Bohai Sea by the way of nine provinces, including Qinghai, Sichuan, Gansu, Ningxia, Inner Mongolia, Shaanxi, Shanxi, Henan, and Shandong. Over the past 3000 years or so in the history of the Chinese nation, the Yellow River Basin remains the political, economic, and cultural center of China. Moreover, the Yellow River is also one of the rivers with the highest sediment content and most serious floods. Since the written record of the Chinese civilization, the Chinese nation has never ceased their fighting with floods and droughts of the Yellow River.
Thanks to unremitting efforts, the Chinese government has established a relatively complete flood control project system. Nevertheless, due to inadequate investment, the Lower Yellow River is still faced with problems, such as low flood control standards for some levee segments and incomplete channel training works. The risk of floods exceeding the warning line caused by extreme weathers remains. Once the levee of the Lower Yellow River is breached, the lives and property security of the people living on two sides will be seriously jeopardized. To ensure prolonged security of the Yellow River, the Chinese government started the implementation of the “13th Five-Year” flood control project of the Lower Yellow River in 2015. This project covered Henan Province and Shandong Province, and the construction scope includes levee engineering, channel training works, and wave-break forest construction [1].
Land requisition and resettlement of migrants are two major parts of flood control projects. After a large land area was allocated for flood control projects, livelihood resilience of resettlers became a great challenge. First, the land used for engineering construction caused a direct reduction in the land ownership of farming households, which was not beneficial to their long-term livelihood. Second, to make more space for engineering construction, some farming households’ houses were removed. Since compensation fees for land requisition cannot catch up with the consumer price inflation, some families with poor economic capability are faced with the shortage of housing funds. Third, the village collective land requisition and adjustment could affect the livelihood of local non-resettled farming households. Therefore, this paper proceeds from the background of flood control projects in the Lower Yellow River to examine factors influencing resettled farming households’ livelihood resilience.

2. Literature Review

Early research attempts of poverty issues mainly focused on the phenomenon of income-triggered poverty, such as a low-income level, weak spending power, and food shortages [2]. The idea of sustainable livelihood originated from methodological research of scholars represented by Sen [3] and Chambers [4] about how to address poverty issues in the 1980s and the 1990s. Apart from investigating the income-triggered poverty in the traditional sense, these scholars laid great emphasis on the poverty resulted from limited development abilities. So far, three analysis frameworks for sustainable livelihood have been established, including the sustainable livelihood analysis framework by the Department for International Development (DFID) [5], farming household livelihood security framework by the Cooperative for American Relief Everywhere (CARE) [6], and sustainable livelihood approaches by the United Nations Development Program (UNDP) [7]. Among them, the sustainable livelihood framework established by the DFID has found the widest application [8]. This framework regards impoverished farming households as groups surviving or making a life with a fragile background. These farming households have certain livelihood capitals, including natural capitals, physical capitals, financial capitals, human capitals, and social capitals, but their livelihood capitals are subject to the influence of factors, such as policies and processes.
In 1973, the ecologist, Holling [9], introduced resilience theory to the field of ecology to describe the capability of the ecosystem to cope with an external disturbance. In recent years, resilience theory has been widely applied to the field of social and ecological systems, and disaster prevention [10,11]. As an important theoretical framework that studies farming households’ response to external environmental changes, livelihood resilience has gained wide attention from scholars [12,13,14]. Scoones [15] pointed out that a resilient livelihood system is reflected not only as the utilization of its own resources to address adverse changes, but also as summary of practical experience, development of self-organization capacity, and improvement of learning capacity. Connecting the livelihood research with resilient thinking can facilitate the comprehension of the dynamic changing process of livelihood and achieve a better measurement of the livelihood system [16,17]. Speranza et al. [18] constructed a livelihood resilience theoretical framework from the perspective of buffer capacity, self-organization capacity, and learning capacity, and expounded on the measurement methods of each index. Compared with the traditional research into sustainable livelihood, livelihood resilience attaches greater emphasis on the potential capacity of the livelihood system to recover from the disturbance [19,20]. Hence, livelihood resilience theory can describe livelihood characteristics of farming households comprehensively and accurately.
Over the past few years, livelihood resilience theory has been widely used to study resettled farming households. Based on survey data of southern Shaanxi, Li et al. [21] quantitatively analyzed livelihood resilience of impoverished farming households after relocation. Liu et al. [22] constructed a livelihood resilience assessment system for impoverished farming households after relocation to analyze their livelihood resilience level and influencing factors. Ji et al. [23] used follow-up survey data of Zhenfeng County, Guizhou Province, China to comparatively analyze livelihood resilience of farming households before and after relocation. Mallick [24] made use of survey data from five coastal villages in Bangladesh to examine the influence of livelihood resilience on farming households’ migration decision making. Gautam [25] examined the drivers of seasonal migration in the context of climate change and migration’s role in food security and livelihood resilience in the district of Humla, Nepal. All the above research findings concentrate on farming households who voluntarily migrate. Little research attention has been paid to livelihood resilience of involuntary resettlers. Liu et al. [26] carried out field survey to discuss about the influence of post-disaster resettlement on livelihood resilience of rural families in China. Through a survey of five post-2004 Indian Ocean tsunami relocated villages from Indonesia, Sina et al. [27] developed a framework for measuring livelihood resilience in cases of post-disaster displacement. Li et al. [28] took farming households in Minqin County, Gansu Province who were affected by the implementation of the comprehensive restoration plan of the Shiyang River Basin to discuss about the possibility livelihood vulnerability to convert to livelihood resilience. Jiang et al. [29] used survey data of farming households in Wuhan, Hangzhou, and Jieyang to examine influencing factors of livelihood resilience of farming households after land requisition.
Resettlers of flood control projects are typically involuntary resettlers; however, research concerning their livelihood resilience is lacking. Li et al. [30] and Jia et al. [31] discussed land requisition and resettlement of migrants of flood control projects in the Lower Yellow River, but their research findings lack the evidence provided by quantitative analysis. Based on previous research findings, this paper further studies the following issues. First, an assessment index system which can reflect farming household livelihood resilience is built, combining the existing literature and the practical situations of flood control projects in the Lower Yellow River. Second, farming households’ livelihood resilience is calculated to realize inter-ground comparison of farming households’ livelihood resilience. At last, regression analysis and variance analysis are conducted to identify major factors influencing resettled farming households’ livelihood resilience.

3. Research Background, Research Area, and Data Sources

3.1. Research Background
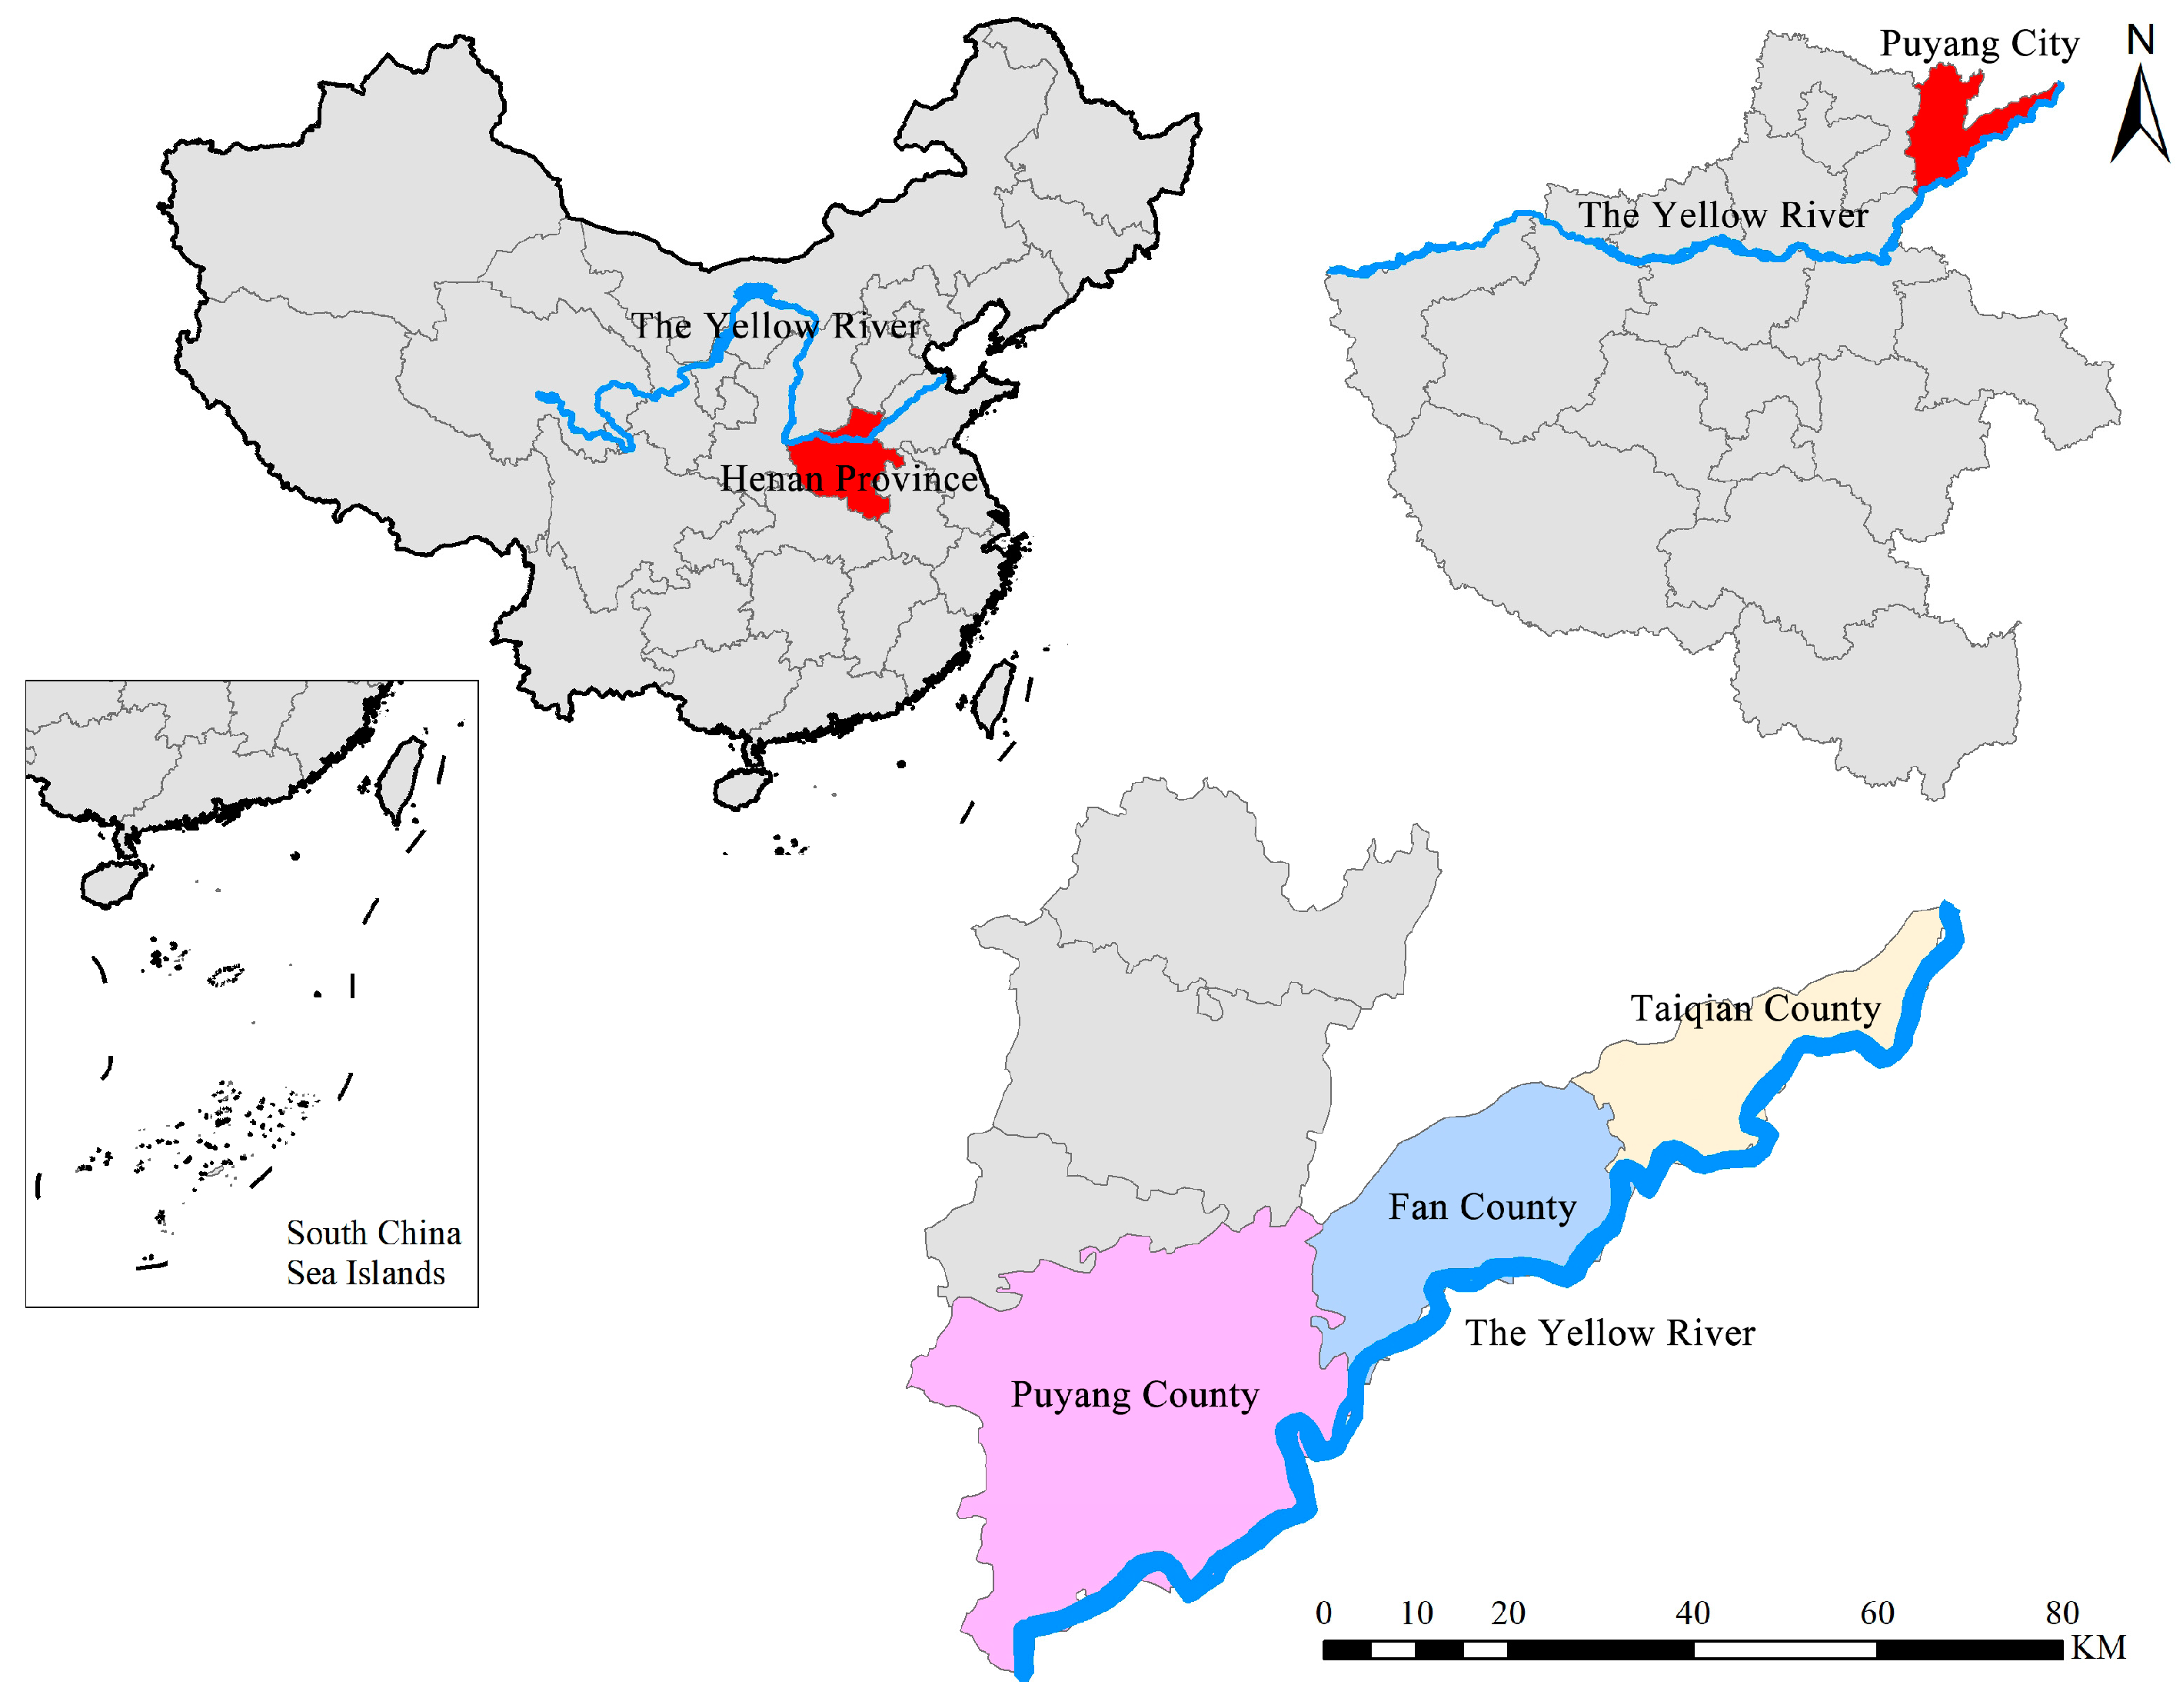
The geographical conditions of the Yellow River are complex, which have posed a great challenge to its flood control. The main challenge facing the flood control of the Yellow River is that the water and sediment are from different sources and that the water is inadequate while the sediment is too much. Around 62% of the water source for the Yellow River is contributed by upper reaches above Lanzhou; 90% of the sediment is from the middle reaches. The different sources of water and sediment have resulted in the water and sediment imbalance. Among the sediment flowing to the lower reaches, around one-fourth is deposited in the channel of the lower reaches, thus lifting up the channel of the lower reaches by 5 cm to 10 cm every year. In this way, the lower reaches have been known as the “suspending river on the ground”. The Yellow River flows from Tongguan, Shaanxi into Henan Province. The Henan section of the Yellow River is a section from the mountainous area to the plain, which is characterized by a wide channel, significant difference of height, large floodplain area, and highest population density. All these characteristics have made this section the top priority of flood control for the Yellow River.
In 2015, the Lower Yellow River flood control project (Henan section) was kicked off. This project involved 16 counties (districts) of five cities in Henan Province, including a total population of 25.97 million, a total land area of around 30,400 km2, and average population density of 857.58 person/km2. In terms of agricultural development, this project is located in the alluvial plain of the Yellow River. This area features a flat land, fertile soil, and a high land utilization rate. The main grains of the project area include wheat, corn, paddy rice, and soybeans. Economic crops include cotton, peanuts, oilseed rape, watermelons, herbal medicine, etc. As to the development of the secondary and tertiary industries, the project area combines the local resources to gradually establish a series of pillar industries dominated by characteristic processing, large-scale cultivation, and sightseeing. Regarding infrastructure development, the project area boasts a convenient and complete transport network with national highways and provincial highways playing a main role. All administrative villages are installed with telephone, radio, and television services.

3.2. Research Area

Land requisition and resettlement of migrants are important parts of the Lower Yellow River flood control project (Henan section). The permanent land requisition of this project was 3691.44 mu (1 mu = 666.667 m2), and the temporary land requisition was 17,063.71 mu. A total of 134,076.45 m2 of houses were demolished. Among them, Puyang County, Taiqian County, and Fan County under the administration of Puyang City are key areas of land requisition and resettlement of migrants. The permanent land requisition of three counties takes up 44.13% of the total; the temporary land requisition of three counties accounts for 38.10% of the total; the demolished housing area reached 76.58% of the total. Therefore, this research project adopts the three representative areas, including Puyang County, Taiqian County, and Fan County, for field survey. The research area is located to the northeast of Henan Province, and the geographical location is shown in Figure 1.

3.3. Data Sources

In 2019, our research group went to Henan Province for a field survey of Puyang County, Taiqian County, and Fan County by stratified random sampling. Below are specific steps: (1) Numbered villages and identified 13 villages by probability sampling; (2) Numbered selected villages and identified sample households via simple random sampling; (3) Carried out a door-to-door interview. If no one was in the sample household, it would be replaced by its neighbor. Finally, 200 questionnaires were issued, of which 186 valid questionnaires were collected, with abnormal value or without responses eliminated, which registered a response rate of 93%. Among the valid responses, 134 were resettled farming households, including 53 farming households with land expropriated, 53 farming households with house expropriated, 28 farming households with both land and house expropriated, and 52 non-resettled farming households. The survey covered basic situations of farming households, their land requisition and resettlement, employment and skill training, etc.
Basic situations of household samples are presented in Table 1. Those aged above 50 years old took up 68.27% of the total, indicating that heads of these farming households were generally not young. Respondents graduating from primary school or middle school took up 68.81% of the total. Those holding a degree of junior college or above accounted for only 6.99%. This suggested that the household heads had a generally low educational degree. Concerning professions of household heads, farmers took up around 68.28% of the total, suggesting that agriculture remained a way for a majority to make a living. Analyzed by the number of labors, 79.57% of families were found with two or fewer than two labors. So there were not many labors in every family.

4. Research Methods

4.1. Livelihood Resilience Assessment Index System

The concept of resilience can help understand how a person protects his livelihood more effectively under the influence of adverse changes [32]. Resettlers of flood control projects, after experiencing involuntary land requisition or resettlement, are faced with changes to their livelihood. Therefore, it is necessary to examine which core factors can influence the livelihood resilience of flood control project resettlers and how these factors can be managed and optimized. Referring to Speranza’s [18] livelihood resilience framework and combining practical situations of flood control projects in the Lower Yellow River, this paper constructs the farming household livelihood resilience assessment index system from three dimensions, including buffer capacity, self-organization capacity, and learning capacity. The aforesaid three dimensions are chosen for the following two causes. First, the three dimensions have been extensively adopted by scholars for examination of issues from different perspectives and discussions of different research objects. Second, the three dimensions are highly operable, whose corresponding indexes can be easily quantified.
Buffer capacity is defined as the capacity of the system to maintain its organizational structure and functional attributes under external disturbances [33]. From the livelihood perspective, buffer capacity means the capacity of farming households to make use of their resources to resist against livelihood risks [34]. Buffer capacity of farming households is usually indicated by five kinds of livelihood capitals, including natural capitals, physical capitals, financial capitals, human capitals and social capitals [35]. In this paper, the arable land area is chosen to represent natural capitals; the housing area and homestead area to stand for physical capitals; the per capita income to indicate financial capitals; and the number of labors and health status to represent human capitals.
Self-organization capacity refers to the impact of self-management, policy systems, and social network on their resilience [36]. Milstad [37] defined self-organization of the agricultural system as the network established by farming households or agricultural operators for mutual exchange and support, and their ability to be integrated into the local society, economy, and systems. Combining the practical situations of the survey areas, this paper chose infrastructure conditions, production conditions, and borrowing capacity to measure a farming household’s capacity of organization and production; using rural endowment insurance and non-farming employment opportunity to measure a farming household’s response to policies and social participation. After a large land area was allocated for flood control projects, resettlers might be faced with the problem of livelihood transformation. In other words, some resettlers might turn to non-farming industries. So the index of non-farming employment opportunity is more representative than the index of actual employment.
Learning capacity means the ability of individuals or organizations to create, acquire, spread, and memorize knowledge [38]. Farming households should constantly acquire new knowledge and skills from other farming households and the external environment so that they can adjust their livelihood strategies in time against external disturbances [39]. Therefore, this paper chooses educational expenditure, educational degree of household head, rural mental working experience, number of migrant workers, and length of time to work away from hometown to indicate farming households’ learning capacity.
To sum up, livelihood resilience assessment index system is shown in Table 2.

4.2. Assessing Livelihood Resilience

Assessment indexes listed in Table 2 demonstrate different dimensions and degrees of change. The maximum difference normalization method is used to process the original data. The data after processing are dimensionless, making it possible for different indexes to be compared with each other. The equation can be written as below:
X i j = x i j λ j min λ j max λ j min
where Xij denotes data in the j column of the i row after normalization; xij denotes the raw data of the j column of the i row; λjmin stands for the minimum of the raw data of the j column; λjmax represents the maximum of the raw data of the j column.
There are many assessment indexes chosen in Table 2, and these indexes are all correlated. The software, SPSS25, is employed for the principal component analysis (PCA). Several principal components are extracted to measure a farming household’s livelihood resilience. Before the PCA, feasibility analysis is conducted on factor analysis. Results show that the KMO value is 0.648, suggesting that the data have a high sampling adequacy. The value of Bartlett’s test of sphericity is 733.901, and sig = 0.000. This indicates that the data are significant on the significance level of 1%. Therefore, the data are feasible for PCA. To start with, 16 indexes are chosen for PCA, six principal components are extracted, and their accumulated variance contribution rate is 66.65%, meaning that the six principal components can explain the population variance by 66.65%. In order to make PCA results more direct, this paper combines the factor loading matrix to list indexes whose correlation coefficient is higher than 0.5.
As shown in Table 3, major factors affecting a farming household’s livelihood resilience include working away from hometown, human capitals, infrastructure conditions, and production conditions. The correlation coefficient of the number of migrant workers is 0.796. This means that the number of migrant workers is the most important factor that can influence farming households’ livelihood resilience. The correlation coefficient of the length of time to work away from hometown is higher than 0.7, which suggests that the length of time to work away from hometown plays an important role in promoting livelihood resilience. Infrastructure conditions and production conditions are two factors whose correlation coefficient is the highest among the variables of the second principal component. The correlation coefficient of the two factors are both above 0.7, which can provide solid evidence for the important role of favorable infrastructure and production services in a farming household’s livelihood resilience.
According to PCA results, the variance contribution rate is adopted as the weight and scores of six principal components as variables. The farming household livelihood resilience index can be given by the following equation:
L R I = Y k × F k
where LRI indicates the livelihood resilience index; Yk denotes the variance contribution rate of the k principal component; Fk denotes the scores of the k principal component.
The farming household livelihood resilience index can be given by the following equation:
L R I = 0.205 F 1 + 0.133 F 2 + 0.104 F 3 + 0.079 F 4 + 0.076 F 5 + 0.069 F 6

4.3. Selection of Regression Variables and Model Settings

4.3.1. Selection of Regression Variables

Referring to the literature [29,32,35,40,41] and combining field survey, this paper selects six explanatory variables to represent resettlement, family, and social factors. Land requisition and resettlement of migrants are two major parts of flood control projects. This can influence farming households’ livelihood resilience. So being resettled or not and land requisition type are chosen as the explanatory variables. Family exists as a basic decision-making unit of livelihood activities, so family characteristics can influence farming households’ livelihood resilience. Therefore, family scale, livelihood strategy, and skill training are pinpointed as explanatory variables. In addition, farming households are part of the specific economic and social structure, whose livelihood resilience is subject to the influence of policies and systems. Hence, response to policies is adopted as the explanatory variable. Major variables are explained in Table 4.

4.3.2. Settings of Regression Model

In order to explore influencing factors of farming household livelihood resilience, this paper defines the linear regression model as below:
L R I = α + β i X i + ε
where LRI denotes the farming household livelihood resilience index; α represents the constant term; βi (i = 1,2,…,5) stands for the regression coefficient of the i explanatory variable; Xi indicates all potential influencing factors of livelihood resilience, including being resettled or not, response to policies, family scale, livelihood strategy, and skill training; ε stands for disturbance.
Though flood control projects can influence resettled farming households and non-resettled farming households to different degrees, the livelihood capital losses and social environmental changes can exert a greater impact on resettled farming households than on non-resettled farming households. Therefore, it is expected that the regression coefficient of the being resettled or not is negative. The stronger the response to policies is, the faster it is to obtain government support, and the more likely the policies can positively promote livelihood resilience. The regression coefficient of the response to policies is expected to be positive. The larger the family scale is, the higher the household income is, and the more beneficial it is to respond to environmental changes. Therefore, it is expected that the regression coefficient of the family scale is positive. The more diversified the livelihood strategies are, the stronger the ability will be to resist against environmental changes. It is expected that the regression coefficient of the livelihood strategy is positive. The more frequent the skill training is, the more beneficial it is to enhance professional skills. The regression coefficient of the skill training is expected to be positive.

5. Analysis of Research Results

5.1. Analysis of Livelihood Resilience Measurement Results

In order to more directly compare the livelihood resilience differences between resettled farming households and non-resettled farming households, this paper carries out an inter-group comparison of farming household livelihood resilience. Figure 2 reveals that the livelihood resilience density curve of all farming households, resettled farming households, and non-resettled farming households is all very steep, meaning that their livelihood resilience fluctuations are not obvious but concentrate around the mean. Among them, the livelihood resilience of all farming households reaches the peak at around 0.38; the livelihood resilience of resettled farming household reaches the peak at around 0.37; the livelihood resilience of non-resettled farming household reaches the peak at around 0.41. The livelihood resilience peak of resettled farming household is all lower than that of all farming households and non-resettled farming households. It means that the livelihood resilience of resettled farming households is lower than that of non-resettled farming households on the whole.
To better recognize characteristics of farming household livelihood resilience, the K-means clustering is used to divide farming households of the research regions into three types, including farming households with a low livelihood resilience, a medium livelihood resilience, and a high livelihood resilience. The F statistics of the one-way analysis of variance is 454.360, and p value is 0.002. This means that the three types of livelihood resilience are significantly different. The average of the low livelihood resilience, medium livelihood resilience, and high livelihood resilience is 0.226, 0.379, and 0.519. The livelihood resilience distribution of farming households of different types is shown in Figure 3. Only 15.38% of non-resettled farming households have a low livelihood resilience; the medium and high resilience of non-resettled farming households take up 48.08% and 36.54%, respectively. Among resettled farming households, the low livelihood resilience accounts for 31.34% of the total, the medium and high livelihood resilience account for 41.04% and 27.61%, respectively, which are both lower than the medium and high livelihood resilience of all farming households and non-resettled farming households. The analysis suggests that the livelihood resilience of a majority of resettled farming households is of the medium or low level. The livelihood resilience structure of resettled farming households is poorer than that of non-resettled farming households.

5.2. Analysis of Regression Results

The correlation between farming household livelihood resilience and potential influencing factors is presented in Table 5. D-W test value is 1.801, meaning that data are mutually independent, which is consistent with conditions to ensure an independent linear regression. When the VIF is within 1.451, it means that the model is free of the problem of collinearity. JB test is conducted on the dependent variable. Results show that p = 0.841 > 0.05, meaning that the dependent variable follows normal distribution. Results of model verification reveal that the F statistics is 37.278 (p = 0.000 < 0.05), suggesting that the regression model constructed has statistical significance.
As shown in Model 1, resettlement factors include being resettled or not; family and social factors include family scale, livelihood strategy, and skill training. The influence of all the aforesaid variables on farming household livelihood resilience is all significant at the significance level of 10%. Among them, being resettled or not has a negative influence on farming household livelihood resilience. In other words, land or house requisition caused by flood control projects can weaken a farming household’s livelihood resilience. This finding also shows good agreement with the inter-group comparison results of farming household livelihood resilience. Family scale has a positive influence on livelihood resilience; therefore, the larger the family scale is, the stronger the household livelihood resilience is. Livelihood strategy has a positive impact on farming household livelihood resilience at the significance level of 1%. This finding can lead to the conclusion that the more diversified the livelihood strategies are, the more beneficial it is to improve farming household livelihood resilience. The influence of skill training is positive as well. This suggests that the more frequent the skill training is, the more likely it is to improve farming household livelihood resilience.
Model 2 controls resettlement, family, and social factors and then increases response towards policies to conduct a regression analysis of farming household livelihood resilience. Response to policies can reflect farming households’ acceptance of policies, which is reflected as resettled farming households’ willingness to implement relevant policies and accept management. To non-resettled farming households, response to policies refers to their acceptance of the resettlers to move to their own village group as well as their collaboration with relevant resettlement policies. Results suggest that the influence of response to policies on farming household livelihood resilience is significant at the significance level of 10%. Hence, it is apt to say that active response to policies has a positive influence on farming household livelihood resilience.

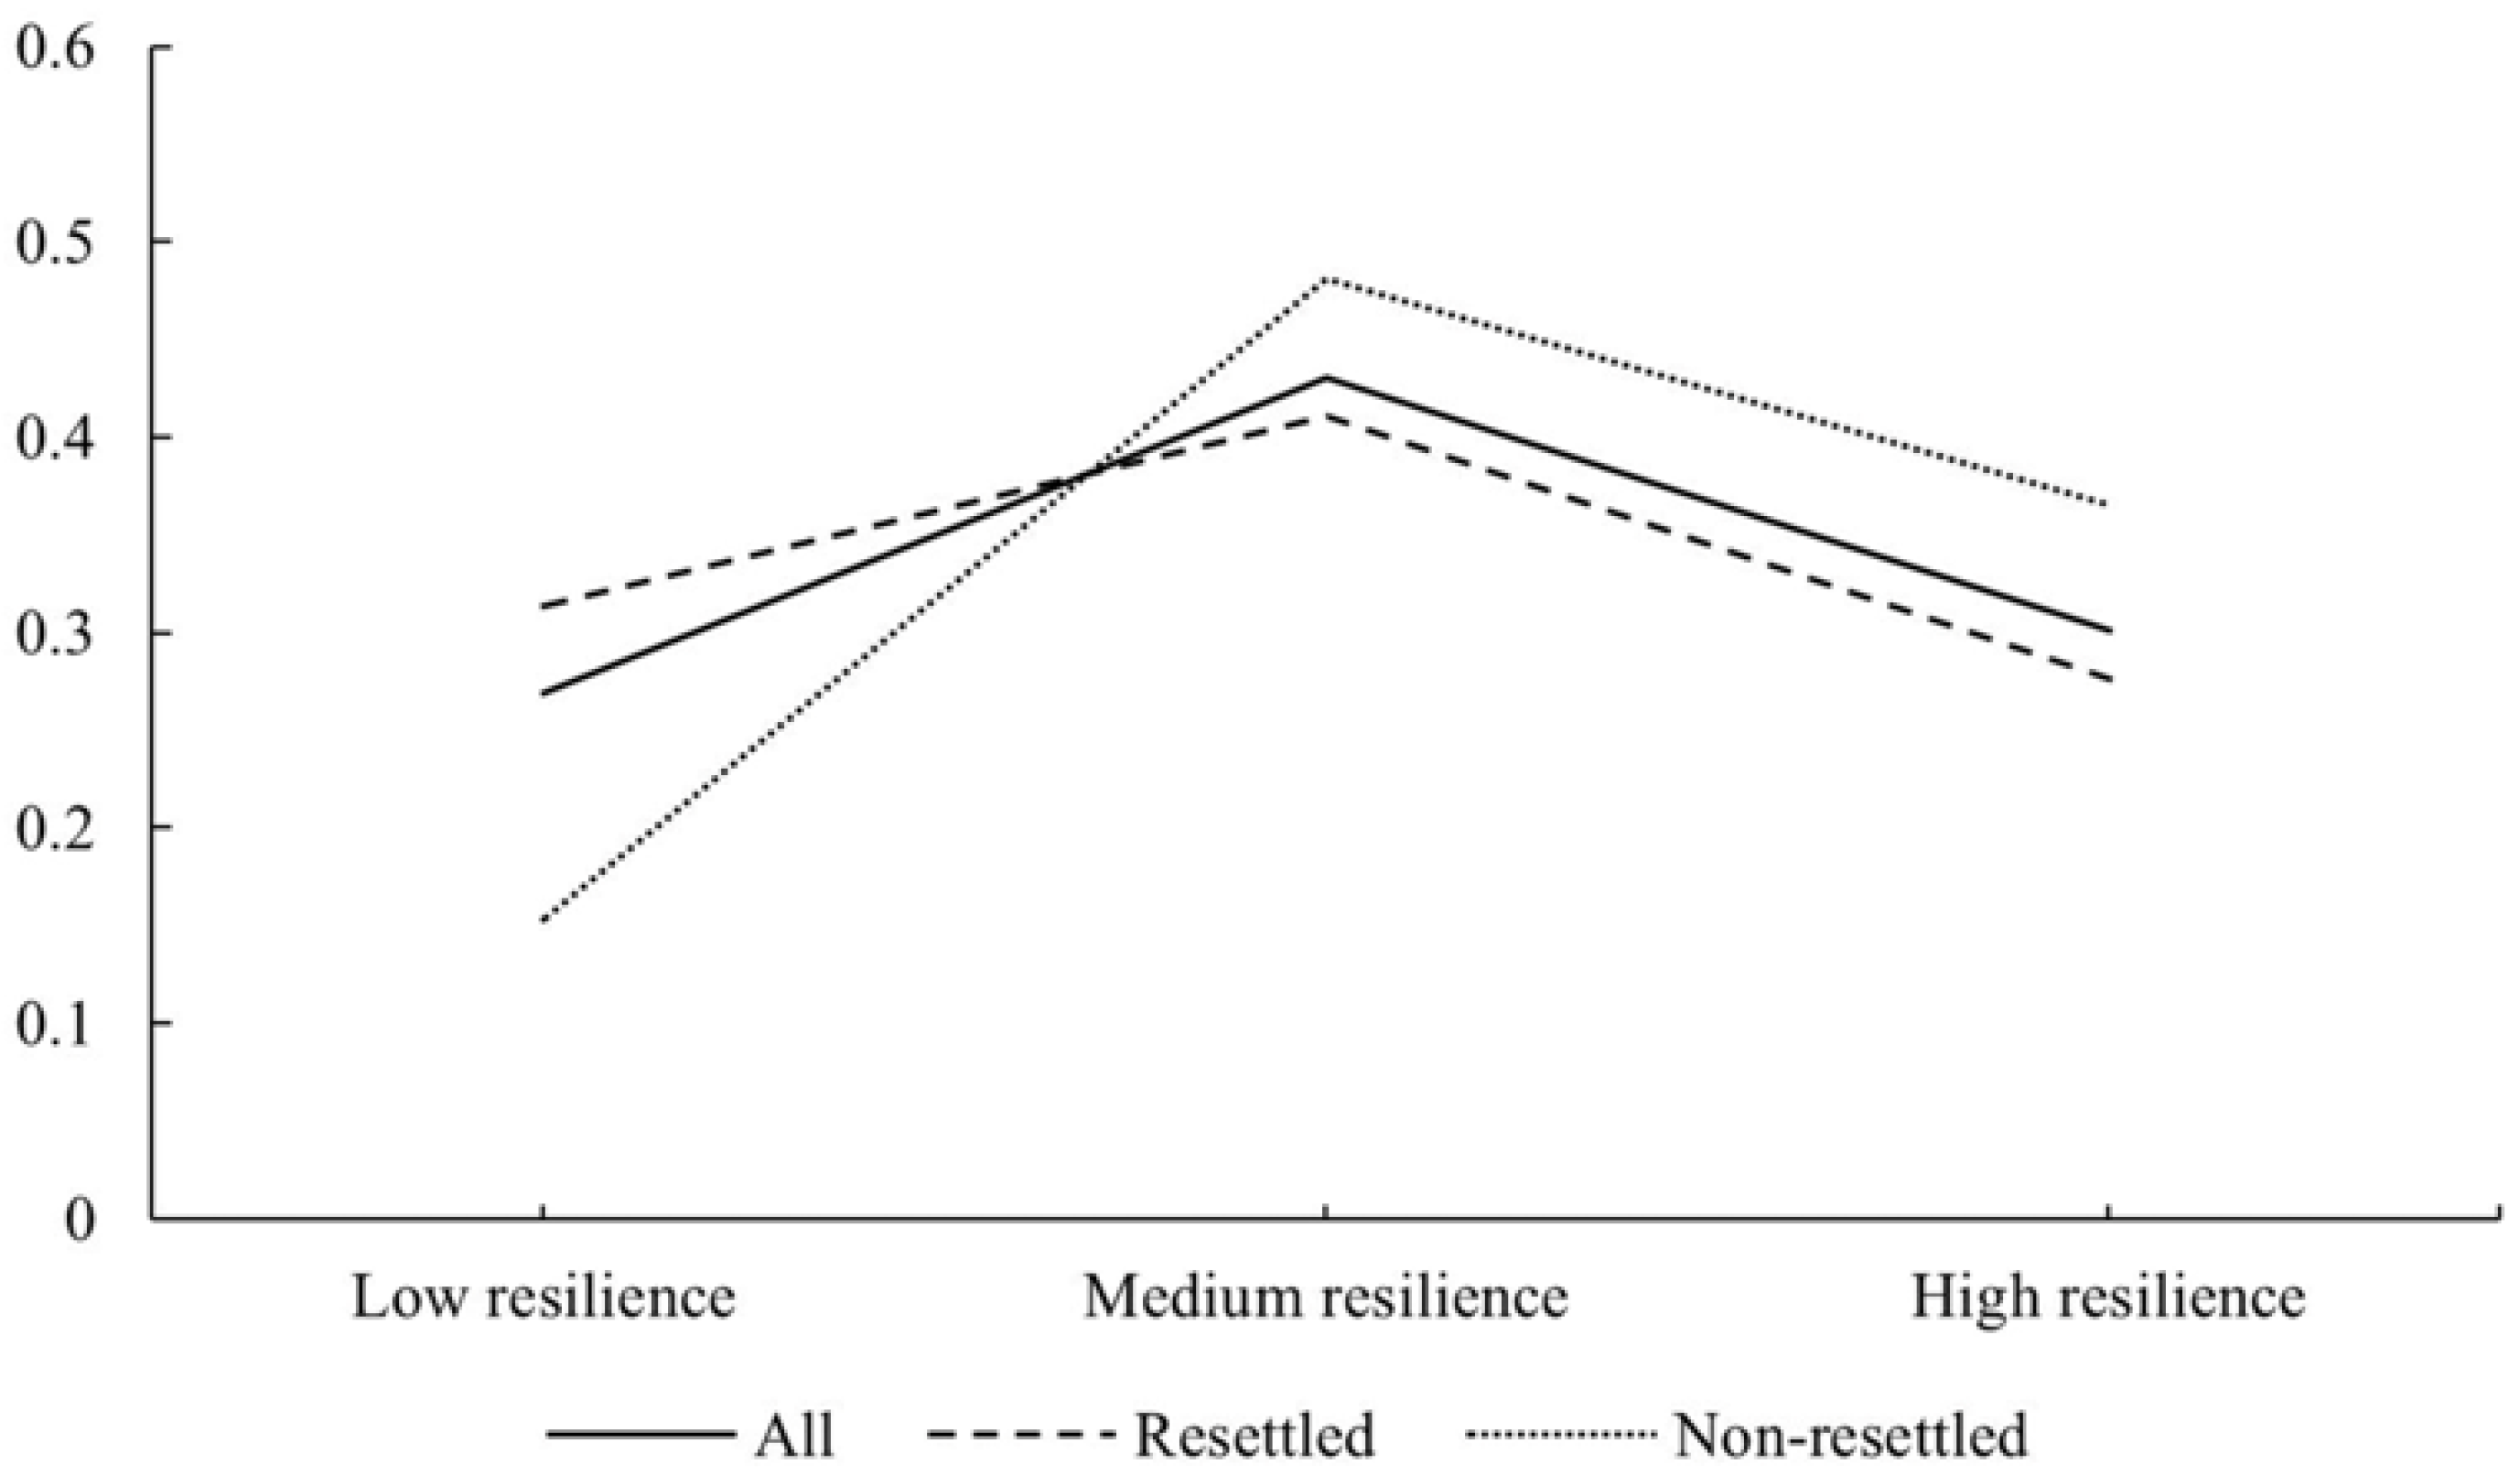
5.3. Variance Analysis

In this section, the difference of livelihood resilience between non-resettled farming households and different types of resettled farming households is examined by variance analysis. The homogeneity of variance test shows that p = 0.410 > 0.05, which satisfies the conditions of the homogeneity of variance. Thereby, variance analysis can be conducted. ANOVA results show that F statistics is 6.128, and p value is 0.001, which are far lower than the significance level. This means that the livelihood resilience between non-resettled farming households and different types of resettled farming households is significantly different.
To deepen the knowledge of the difference between non-resettled farming households and three types of resettled farming households, this paper compares them two by two. As one can notice in Table 6, the mean difference (p = 0.207) between non-resettled farming households and farming households with house expropriated fails to reach the statistical significance level. The mean difference between farming households with land expropriated and other three types of farming households is negative, being −0.051, −0.077, and −0.141, respectively, and p < 0.05. This means that the livelihood resilience of farming households with land expropriated is significantly lower than that of the other three types of farming households.

6. Major Conclusions and Policy Suggestions

6.1. Major Conclusions

Referring to the existing literature and combining practical situations of flood control projects of the Lower Yellow River, a farming household livelihood resilience assessment index system is constructed to work out the farming household livelihood resilience index. The clustering analysis is employed to divide farming household livelihood resilience into three levels, namely low, medium, and high. Additionally, inter-group comparative analysis is conducted on resettled farming households and non-resettled farming households. On that basis, regression analysis and variance analysis are adopted to discuss influencing factors of resettled farming household livelihood resilience. Results suggest: (1) Livelihood resilience of resettled farming households is on the whole lower than that of non-resettled farming households. (2) Response to policies, family scale, livelihood strategy, and skill training are major influencing factors of resettled farming households’ livelihood resilience. (3) Compared with other types of farming households, livelihood resilience of farming households with land expropriated is significantly different.

6.2. Policy Suggestions

Combining the analysis results above, the government can make efforts in the following five aspects to improve livelihood resilience of resettled farming households.

6.2.1. Expanding the Application Scope of Follow-up Support Policies of Reservoir Resettlement

According to the Regulation on Land Requisition Compensation and Resettlement of Migrants for Large and Medium Water Conservation and Power Construction Projects, follow-up support policies are applicable to resettlement caused by large and medium water conservation and power construction projects. The analysis above shows that, though land requisition and resettlement caused by large flood control projects construction have their own characteristics, there are no essential differences between these problems and resettlement problems caused by water conservation and power construction projects. A shared characteristic is that land requisition and resettlement caused by project construction have both exerted a negative impact on resettlers. So it is necessary to expand the application scope of follow-up support policies to cover flood control project resettlers as well.

6.2.2. Enhancing Capability Construction of Resettlement Management Departments

Research indicates that resettlers’ response to policies is significantly correlated with their livelihood resilience. Land requisition and resettlement leadership groups and offices set up by relevant counties and cities are still temporary management institutions. Major management personnel are designated from other departments to work concurrently for land requisition and resettlement. So, they may lack scientific and professional experience in land requisition and resettlement. This can seriously impair their working efficiency. Hence, it is necessary to enhance capability construction of resettlement management departments, improve professionalism of management personnel, innovate the ways for publicity of resettlement policies, and upgrade resettler participation mechanisms.

6.2.3. Strengthening Support for Resettlers’ Employment

Research suggests that livelihood strategy and skill training are major factors influencing resettlers’ livelihood resilience. The government should think about how to help resettlers with their employment challenges. The government can encourage resettlers to engage in projects with local characteristics, including growing local vegetables and fruits, give resettlers living under economic embarrassments access to discounted loans and petty initial funds. Additionally, spending on education and training of resettlers should be increased to turn resettlers into educated and skilled new-type farmers, and improve their self-accumulation and self-development abilities as well.

6.2.4. Combining Resettlement with Rural Revitalization Strategy

Research reveals that favorable infrastructure and production conditions can significantly improve resettlers’ livelihood resilience. Improvement of water conservancy, transport, and other infrastructure can effectively lower the production cost of resettlers and strengthen the connection between resettlers and the outside world. All this is of vital importance to the improvement of resettlers’ self-organization capacity and learning capacity. Therefore, local governments should make good use of different funds, better infrastructure and public service facilities, actively develop the modern agriculture, foster new-type agricultural operators, and explore effective channels of rural revitalization.

6.2.5. Improving the Social Security System for Flood Control Project Resettlers

The Law of the People’s Republic of China on Land Administration, amended in 2020, clearly stipulates that local governments should include farming households with land expropriated into the social security system. The current flood control project resettler social security system construction is still backward, which is still far behind resettlers’ expectations. Local governments of where flood control projects are located should extend the coverage of the social security system to farming households with land expropriated. At the same time, special attention should be paid to those who are losing their ability to work, or those living in poverty.

Author Contributions

Conceptualization, Y.D.; methodology, S.C.; formal analysis, S.C. and Y.Z.; investigation, Y.D. and X.W.; data curation, Y.D.; writing—original draft preparation, Y.D.; writing—review and editing, S.C. and Y.Z.; funding acquisition, Y.D. All authors have read and agreed to the published version of the manuscript.

Funding

This research was funded by the National Social Science Foundation of China, grant number 21&ZD183.

Institutional Review Board Statement

Not applicable.

Informed Consent Statement

Not applicable.

Data Availability Statement

Not applicable.

Acknowledgments

We gratefully acknowledge the Yellow River Henan Bureau and respondents for their support in data collection.

Conflicts of Interest

The authors declare no conflict of interest.

References

  1. Jia, J.; Zhao, D. Brief discussion on recent construction and management of flood control project at lower reaches of Yellow River. Water Conserv. Constr. Manag. 2018, 38, 7–9. [Google Scholar] [CrossRef]
  2. Su, F.; Xu, Z.; Shang, H. An overview of sustainable livelihoods approach. Adv. Earth Sci. 2009, 24, 61–69. [Google Scholar]
  3. Sen, A. Poverty and Famines: An Essay on Entitlement and Deprivation; Oxford University Press: London, UK, 1981. [Google Scholar]
  4. Chambers, R.; Conway, G. Sustainable Rural Livelihoods: Practical Concepts for the 21st Century; Institute of Development Studies: Brighton, UK, 1992. [Google Scholar]
  5. DFID. Sustainable Livelihoods Guidance Sheets; Department for International Development: London, UK, 2000. [Google Scholar]
  6. Frankenberger, T.R.; Drinkwater, M.; Maxwell, D. Operational Household Livelihood Security: A Holistic Approach for Addressing Poverty and Vulnerability; Cooperative for American Relief Everywhere: Atlanta, GA, USA, 2000. [Google Scholar]
  7. Krantz, L. The Sustainable Livelihood Approach to Poverty Reduction: An Introduction; Swedish International Development Cooperation Agency: Stockholm, Sweden, 2001. [Google Scholar]
  8. Tang, Q. Research progress and future key trends of sustainable livelihoods. Adv. Earth Sci. 2015, 30, 823–833. [Google Scholar] [CrossRef]
  9. Holling, C.S. Resilience and stability of ecological systems. Annu. Rev. Ecol. Syst. 1973, 4, 1–23. [Google Scholar] [CrossRef]
  10. Zhou, X. Measuring methods for the resilience of social ecological systems. Acta Ecol. Sin. 2017, 37, 4278–4288. [Google Scholar] [CrossRef]
  11. Manyena, S.B. The concept of resilience revisited. Disasters 2006, 30, 434–450. [Google Scholar] [CrossRef] [PubMed]
  12. Marschke, M.J.; Berkes, F. Exploring strategies that build livelihood resilience: A case from Cambodia. Ecol. Soc. 2006, 11, 709–723. [Google Scholar] [CrossRef]
  13. Noralene, U.; Takeuchi, Y.; Shaw, R. Local adaptation for livelihood resilience in Albay, Philippines. Environ. Hazards-Hum. Policy Dimens. 2011, 10, 139–153. [Google Scholar] [CrossRef]
  14. Forster, J.; Lake, I.R.; Watkinson, A.R.; Gill, J.A. Marine dependent livelihoods and resilience to environmental change: A case study of Anguilla. Mar. Policy 2014, 45, 204–212. [Google Scholar] [CrossRef]
  15. Scoones, I. Livelihoods perspectives and rural development. J. Peasant Stud. 2009, 36, 171–196. [Google Scholar] [CrossRef]
  16. Sallu, S.M.; Twyman, C.; Stringer, L.C. Resilient or vulnerable livelihoods? Assessing livelihood dynamics and trajectories in rural Botswana. Ecol. Soc. 2010, 15, 299–305. [Google Scholar] [CrossRef]
  17. Maleksaeidi, H.; Karami, E.; Zamani, G.H.; Moghaddam, K.R.; Hayati, D.; Masoudi, M. Discovering and characterizing farm households’ resilience under water scarcity. Environ. Dev. Sustain. 2016, 18, 499–525. [Google Scholar] [CrossRef]
  18. Speranza, C.I.; Wiesmann, U.; Rist, S. An indicator framework for assessing livelihood resilience in the context of social-ecological dynamics. Glob. Environ. Chang. 2014, 28, 109–119. [Google Scholar] [CrossRef]
  19. Nuorteva, P.; Keskinen, M.; Varis, O. Water, livelihoods and climate change adaptation in the Tonle Sap Lake area, Cambodia: Learning from the past to understand the future. J. Water Clim. Chang. 2010, 1, 87–101. [Google Scholar] [CrossRef]
  20. He, R.; Liu, S.; Chen, G.; Xie, F.; Yang, X.; Liang, L. Research progress and tendency of sustainable livelihoods for peasant household in China. Prog. Geogr. 2013, 32, 657–670. [Google Scholar] [CrossRef]
  21. Li, C.; Gao, M.; Li, S.; Lei, H. Impact of rural households’ livelihood resilience on multidimensional poverty: Evidence from the poverty alleviation relocation areas in Shaanxi Province. China Popul. Resour. Env. 2021, 31, 150–160. [Google Scholar] [CrossRef]
  22. Liu, W.; Li, J.; Xu, J. Evaluation of rural household’s livelihood resilience of the relocation and settlement project in contiguous poor areas. Arid Land Geogr. 2019, 42, 673–680. [Google Scholar] [CrossRef]
  23. Ji, T.; Zhou, Z.; Niu, Z.; Zhang, J. Comparative analysis of farmers’ livelihood resilience before and after relocation for poverty alleviation: A case study in the relocation site in Zhexiang Town of Zhenfeng County, Guizhou Province. J. Ecol. Rural Environ. 2022, 38, 1406–1414. [Google Scholar] [CrossRef]
  24. Mallick, B. The nexus between socio-ecological system, livelihood resilience, and migration decisions: Empirical evidence from Bangladesh. Sustainability 2019, 11, 3332. [Google Scholar] [CrossRef]
  25. Gautam, Y. Seasonal migration and livelihood resilience in the face of climate change in Nepal. Mt. Res. Dev. 2017, 37, 436–445. [Google Scholar] [CrossRef]
  26. Liu, W.; Li, J.; Xu, J. Effects of disaster-related resettlement on the livelihood resilience of rural households in China. Int. J. Disaster Risk Reduct. 2020, 49, 101649. [Google Scholar] [CrossRef]
  27. Sina, D.; Chang-Richards, A.Y.; Wilkinson, S.; Potangaroa, R. A conceptual framework for measuring livelihood resilience: Relocation experience from Aceh, Indonesia. World Dev. 2019, 117, 253–265. [Google Scholar] [CrossRef]
  28. Li, Y.; Chen, W. From livelihood vulnerability to livelihood resilience: A case study of Minqin Oasis. J. Poyang Lake 2015, 7, 19–26. [Google Scholar]
  29. Jiang, Y.; Huang, J. Study on the effect of land-lost farmers’ livelihood resilience and influencing factors. Stat. Decis. 2020, 36, 62–67. [Google Scholar] [CrossRef]
  30. Li, S.; Li, J.; Fan, W.; Yuan, P. Exploration of land acquisition compensation and its relevant issues for the flood control works of the Lower Yellow River. Yellow River 2014, 36, 45–47. [Google Scholar] [CrossRef]
  31. Jia, J.; Wang, X.; Ge, W.; Duan, Y.; Zhang, Y. Implement and Management of Land Requisition Compensation and Migrant Resettlement of the Lower Yellow River Flood Control Project (Henan Section); The Yellow River Water Conservancy Press: Zhengzhou, China, 2020. [Google Scholar]
  32. Wen, T.; Shi, Y.; Yang, X.; Wang, T. The resilience of farmers’ livelihoods and its influencing factors in semiarid region of the Loess Plateau: A case study of Yuzhong County. Chin. J. Agric. Resour. Reg. Plan. 2018, 39, 172–182. [Google Scholar] [CrossRef]
  33. Carpenter, S.; Walker, B.; Anderies, J.M.; Abel, N. From metaphor to measurement: Resilience of what to what? Ecosystems 2001, 4, 765–781. [Google Scholar] [CrossRef]
  34. Adger, W.N.; Kelly, P.M. Social vulnerability to climate change and the architecture of entitlements. Mitig. Adapt. Strateg. Glob. Chang. 1999, 4, 253–266. [Google Scholar] [CrossRef]
  35. He, Y.; Zhang, J.; Qiao, X.; Zhang, Q. Rural households’ livelihood resilience in poor mountainous areas under the background of targeted poverty alleviation: A case study of Qinba mountain areas in Henan Province. J. Arid Land Resour. Environ. 2020, 34, 53–59. [Google Scholar] [CrossRef]
  36. Fuchs, C. The antagonistic self-organization of modern society. Stud. Political Econ. A Social. Rev. 2004, 73, 183–209. [Google Scholar] [CrossRef]
  37. Milestad, R.; Darnhofer, I. Building farm resilience: The prospects and challenges of organic farming. J. Sustain. Agric. 2003, 22, 81–97. [Google Scholar] [CrossRef]
  38. Kim, D.H. The link between individual and organizational learning. Sloan Manag. Rev. 1993, 35, 41–62. [Google Scholar] [CrossRef]
  39. Cooper, S.J.; Wheeler, T. Adaptive governance: Livelihood innovation for climate resilience in Uganda. Geoforum 2015, 65, 96–107. [Google Scholar] [CrossRef]
  40. Ji, J.; Hong, X.; Zhu, Y. Study on the measurement of tea farmers’ livelihood resilience and influencing factors: A case study of Anxi County. J. Tea Sci. 2021, 41, 132–142. [Google Scholar] [CrossRef]
  41. Bu, S.; Ma, J.; Zhuo, M.; Pan, H.; Liu, H. Research progress and enlightenment of livelihood resilience. Geogr. Geo-Inf. Sci. 2021, 37, 74–79. [Google Scholar] [CrossRef]
Figure 1. The location of the research area.
Sustainability 15 02671 g001
Figure 2. Inter-group comparison of farming household livelihood resilience.
Sustainability 15 02671 g002
Figure 3. Distribution of livelihood resilience of different types of farming households.
Sustainability 15 02671 g003
Table 1. Basic information of household samples.
VariablesPopulation/PersonPercentage/%
Age of household head20–393016.13
40–492915.59
50–595328.49
≥607439.78
Educational degree of household headIlliterate2714.52
Primary school5831.18
Middle school7037.63
Senior high school189.68
Junior college and above136.99
Profession of household headFarmer12768.28
Worker189.68
Village cadre84.30
Others1910.22
Unemployed147.53
Number of labors≤17741.40
27138.17
32111.29
≥4179.14
Table 2. Farming household livelihood resilience assessment index system.
DimensionsIndexesIllustrationsAverageStandard Deviation
Buffer capacityArable land areaHousehold arable land area (mu).2.0371.945
Housing areaHousehold housing area (m2).158.974119.330
Homestead areaHousehold homestead area (m2).340.672159.117
Per capita incomeRatio of annual total household income to total population (yuan).17144.49040749.340
Number of laborsHousehold population aged 16 to 65 years old and with the ability to work (person).1.7041.178
Health statusWhen the percentage of household medical expenses in expenditure is above 50%, then the health status value is 1; when the percentage ranges from 20% to 50%, the health status value is 2; when below 20%, the health status value is 3.2.5480.750
Self-organization capacityInfrastructure conditionsChanges in water supply, electricity use and traffic status before and after resettlement. (Becoming better = 1; Almost the same = 0; Becoming worse = −1). Infrastructure conditions = (water supply + electricity use + traffic status)/3.0.2510.418
Production conditionsChanges in community services and other production conditions before and after resettlement. (Becoming better = 1; Almost the same = 0; Becoming worse = −1.) Production conditions = (community services + other production conditions)/2.0.2370.390
Borrowing capacityCapacity to borrow funds from channels, including banks, relatives, and friends. (Yes = 1; No = 0.)0.3390.475
Rural endowment insuranceWhether farming households voluntarily participate in rural endowment insurance. (Yes = 1; No = 0.)0.3440.476
Non-farming employment opportunityNumber of channels to acquire non-farming employment. (Human resource companies, introduction of relatives and friends, government organizations, self-employment, mass election, etc.)1.4090.860
Learning capacityEducational expenditureHousehold expenditure of the last year for education (yuan).4750.6457689.122
Educational degree of household headEducational degree of household head. (Illiterate = 0; Primary school = 1; Middle school = 2; Senior high school = 3; Junior college and above = 4.)1.6341.068
Rural mental working experienceWhether family members have been doing mental jobs in rural areas, such as village cadres, rural teachers, and principals of professional cooperative. (Yes = 1; No = 0.)0.1240.330
Number of migrant workersNumber of migrant workers of the last year (person).1.2470.977
Length of time to work away from hometownThe longest working hours of migrant workers of the last year (month).6.9094.350
Table 3. PCA results.
Principal ComponentsCorrelation CoefficientEigenvalueVariance Contribution Rate (%)Accumulated Variance Contribution Rate (%)
F1Number of migrant workers0.7963.28020.5020.50
Length of time to work away from hometown0.785
Health status0.615
Number of labors0.595
Educational degree of household head0.564
Educational expenditure0.559
F2Infrastructure conditions0.8122.13313.3333.83
Production conditions0.731
Borrowing capacity0.550
F3Rural mental work experience0.7381.65810.3644.20
Non-farming employment opportunity0.652
F4Rural endowment insurance0.5151.2627.8952.09
F5Arable land area0.5551.2227.6459.72
F6Production conditions0.5101.1086.9266.65
Table 4. Major variables and illustrations.
DimensionsVariablesIllustrationsAverageStandard Deviation
Resettlement factorsBeing resettled or notResettlers are defined as farming households whose house is expropriated or whose land is expropriated. (Yes = 1; No = 0.)0.7200.450
Land requisition typeNon-expropriated = 0; Land expropriated = 1; House expropriated = 2; Both land and house expropriated = 3.1.1451.016
Family and social factorsResponse to policiesFarming households’ assessment of relevant resettlement policies. (Dissatisfied = 1; Not very satisfied = 2; Basically satisfied = 3; Relatively satisfied = 4; Very satisfied = 5.)3.5160.960
Family scaleTotal number of family members (person).4.2901.965
Livelihood strategyWhether a farming household has a non-farming job. (Yes = 1; No = 0.)0.7630.426
Skill trainingNumber of family members participating in skill training over the recent four years (person).0.4090.574
Notes: Land requisition type is a categorical variable, which is suitable for variance analysis.
Table 5. Regression analysis results of farming household livelihood resilience.
VariablesModel 1VIF (Model 1)Model 2VIF (Model 2)
Response to policies 0.013 *1.041
Being resettled or not−0.025 *1.042−0.0241.046
Family scale0.010 **1.3870.010 **1.389
Livelihood strategy0.152 ***1.4360.156 ***1.451
Skill training0.024 **1.0770.021 *1.097
Constant0.230 *** 0.181 ***
Sample size186 186
R20.452 0.462
F-statistic37.278 30.866
Notes: ***, ** and * represent p < 0.01, p < 0.05 and p < 0.1, respectively.
Table 6. Variance analysis results of farming household livelihood resilience.
(I) Land Requisition Type(J) Land Requisition TypeMean Difference (I–J)Standard Errorp Value
Non-resettledLand expropriated0.051 **0.0240.033
House expropriated−0.0250.0200.207
Both land and house expropriated−0.089 ***0.0330.008
Land expropriatedNon-resettled−0.051 **0.0240.033
House expropriated−0.077 ***0.0240.002
Both land and house expropriated−0.141 ***0.0360.000
House expropriatedNon-resettled0.0250.0200.207
Land expropriated0.077 ***0.0240.002
Both land and house expropriated−0.064 *0.0330.057
Both land and house expropriatedNon-resettled0.089 ***0.0330.008
Land expropriated0.141 ***0.0360.000
House expropriated0.064 *0.0330.057
Notes: ***, ** and * represent p < 0.01, p < 0.05 and p < 0.1, respectively.
Disclaimer/Publisher’s Note: The statements, opinions and data contained in all publications are solely those of the individual author(s) and contributor(s) and not of MDPI and/or the editor(s). MDPI and/or the editor(s) disclaim responsibility for any injury to people or property resulting from any ideas, methods, instructions or products referred to in the content.

