1. Introduction
The Yellow River is the second longest river in China, extending for 5464 km from the Qinghai–Tibet Plateau to the Bohai Sea by the way of nine provinces, including Qinghai, Sichuan, Gansu, Ningxia, Inner Mongolia, Shaanxi, Shanxi, Henan, and Shandong. Over the past 3000 years or so in the history of the Chinese nation, the Yellow River Basin remains the political, economic, and cultural center of China. Moreover, the Yellow River is also one of the rivers with the highest sediment content and most serious floods. Since the written record of the Chinese civilization, the Chinese nation has never ceased their fighting with floods and droughts of the Yellow River.
Thanks to unremitting efforts, the Chinese government has established a relatively complete flood control project system. Nevertheless, due to inadequate investment, the Lower Yellow River is still faced with problems, such as low flood control standards for some levee segments and incomplete channel training works. The risk of floods exceeding the warning line caused by extreme weathers remains. Once the levee of the Lower Yellow River is breached, the lives and property security of the people living on two sides will be seriously jeopardized. To ensure prolonged security of the Yellow River, the Chinese government started the implementation of the “13th Five-Year” flood control project of the Lower Yellow River in 2015. This project covered Henan Province and Shandong Province, and the construction scope includes levee engineering, channel training works, and wave-break forest construction [
1].
Land requisition and resettlement of migrants are two major parts of flood control projects. After a large land area was allocated for flood control projects, livelihood resilience of resettlers became a great challenge. First, the land used for engineering construction caused a direct reduction in the land ownership of farming households, which was not beneficial to their long-term livelihood. Second, to make more space for engineering construction, some farming households’ houses were removed. Since compensation fees for land requisition cannot catch up with the consumer price inflation, some families with poor economic capability are faced with the shortage of housing funds. Third, the village collective land requisition and adjustment could affect the livelihood of local non-resettled farming households. Therefore, this paper proceeds from the background of flood control projects in the Lower Yellow River to examine factors influencing resettled farming households’ livelihood resilience.
2. Literature Review
Early research attempts of poverty issues mainly focused on the phenomenon of income-triggered poverty, such as a low-income level, weak spending power, and food shortages [
2]. The idea of sustainable livelihood originated from methodological research of scholars represented by Sen [
3] and Chambers [
4] about how to address poverty issues in the 1980s and the 1990s. Apart from investigating the income-triggered poverty in the traditional sense, these scholars laid great emphasis on the poverty resulted from limited development abilities. So far, three analysis frameworks for sustainable livelihood have been established, including the sustainable livelihood analysis framework by the Department for International Development (DFID) [
5], farming household livelihood security framework by the Cooperative for American Relief Everywhere (CARE) [
6], and sustainable livelihood approaches by the United Nations Development Program (UNDP) [
7]. Among them, the sustainable livelihood framework established by the DFID has found the widest application [
8]. This framework regards impoverished farming households as groups surviving or making a life with a fragile background. These farming households have certain livelihood capitals, including natural capitals, physical capitals, financial capitals, human capitals, and social capitals, but their livelihood capitals are subject to the influence of factors, such as policies and processes.
In 1973, the ecologist, Holling [
9], introduced resilience theory to the field of ecology to describe the capability of the ecosystem to cope with an external disturbance. In recent years, resilience theory has been widely applied to the field of social and ecological systems, and disaster prevention [
10,
11]. As an important theoretical framework that studies farming households’ response to external environmental changes, livelihood resilience has gained wide attention from scholars [
12,
13,
14]. Scoones [
15] pointed out that a resilient livelihood system is reflected not only as the utilization of its own resources to address adverse changes, but also as summary of practical experience, development of self-organization capacity, and improvement of learning capacity. Connecting the livelihood research with resilient thinking can facilitate the comprehension of the dynamic changing process of livelihood and achieve a better measurement of the livelihood system [
16,
17]. Speranza et al. [
18] constructed a livelihood resilience theoretical framework from the perspective of buffer capacity, self-organization capacity, and learning capacity, and expounded on the measurement methods of each index. Compared with the traditional research into sustainable livelihood, livelihood resilience attaches greater emphasis on the potential capacity of the livelihood system to recover from the disturbance [
19,
20]. Hence, livelihood resilience theory can describe livelihood characteristics of farming households comprehensively and accurately.
Over the past few years, livelihood resilience theory has been widely used to study resettled farming households. Based on survey data of southern Shaanxi, Li et al. [
21] quantitatively analyzed livelihood resilience of impoverished farming households after relocation. Liu et al. [
22] constructed a livelihood resilience assessment system for impoverished farming households after relocation to analyze their livelihood resilience level and influencing factors. Ji et al. [
23] used follow-up survey data of Zhenfeng County, Guizhou Province, China to comparatively analyze livelihood resilience of farming households before and after relocation. Mallick [
24] made use of survey data from five coastal villages in Bangladesh to examine the influence of livelihood resilience on farming households’ migration decision making. Gautam [
25] examined the drivers of seasonal migration in the context of climate change and migration’s role in food security and livelihood resilience in the district of Humla, Nepal. All the above research findings concentrate on farming households who voluntarily migrate. Little research attention has been paid to livelihood resilience of involuntary resettlers. Liu et al. [
26] carried out field survey to discuss about the influence of post-disaster resettlement on livelihood resilience of rural families in China. Through a survey of five post-2004 Indian Ocean tsunami relocated villages from Indonesia, Sina et al. [
27] developed a framework for measuring livelihood resilience in cases of post-disaster displacement. Li et al. [
28] took farming households in Minqin County, Gansu Province who were affected by the implementation of the comprehensive restoration plan of the Shiyang River Basin to discuss about the possibility livelihood vulnerability to convert to livelihood resilience. Jiang et al. [
29] used survey data of farming households in Wuhan, Hangzhou, and Jieyang to examine influencing factors of livelihood resilience of farming households after land requisition.
Resettlers of flood control projects are typically involuntary resettlers; however, research concerning their livelihood resilience is lacking. Li et al. [
30] and Jia et al. [
31] discussed land requisition and resettlement of migrants of flood control projects in the Lower Yellow River, but their research findings lack the evidence provided by quantitative analysis. Based on previous research findings, this paper further studies the following issues. First, an assessment index system which can reflect farming household livelihood resilience is built, combining the existing literature and the practical situations of flood control projects in the Lower Yellow River. Second, farming households’ livelihood resilience is calculated to realize inter-ground comparison of farming households’ livelihood resilience. At last, regression analysis and variance analysis are conducted to identify major factors influencing resettled farming households’ livelihood resilience.
3. Research Background, Research Area, and Data Sources
3.1. Research Background
The geographical conditions of the Yellow River are complex, which have posed a great challenge to its flood control. The main challenge facing the flood control of the Yellow River is that the water and sediment are from different sources and that the water is inadequate while the sediment is too much. Around 62% of the water source for the Yellow River is contributed by upper reaches above Lanzhou; 90% of the sediment is from the middle reaches. The different sources of water and sediment have resulted in the water and sediment imbalance. Among the sediment flowing to the lower reaches, around one-fourth is deposited in the channel of the lower reaches, thus lifting up the channel of the lower reaches by 5 cm to 10 cm every year. In this way, the lower reaches have been known as the “suspending river on the ground”. The Yellow River flows from Tongguan, Shaanxi into Henan Province. The Henan section of the Yellow River is a section from the mountainous area to the plain, which is characterized by a wide channel, significant difference of height, large floodplain area, and highest population density. All these characteristics have made this section the top priority of flood control for the Yellow River.
In 2015, the Lower Yellow River flood control project (Henan section) was kicked off. This project involved 16 counties (districts) of five cities in Henan Province, including a total population of 25.97 million, a total land area of around 30,400 km2, and average population density of 857.58 person/km2. In terms of agricultural development, this project is located in the alluvial plain of the Yellow River. This area features a flat land, fertile soil, and a high land utilization rate. The main grains of the project area include wheat, corn, paddy rice, and soybeans. Economic crops include cotton, peanuts, oilseed rape, watermelons, herbal medicine, etc. As to the development of the secondary and tertiary industries, the project area combines the local resources to gradually establish a series of pillar industries dominated by characteristic processing, large-scale cultivation, and sightseeing. Regarding infrastructure development, the project area boasts a convenient and complete transport network with national highways and provincial highways playing a main role. All administrative villages are installed with telephone, radio, and television services.
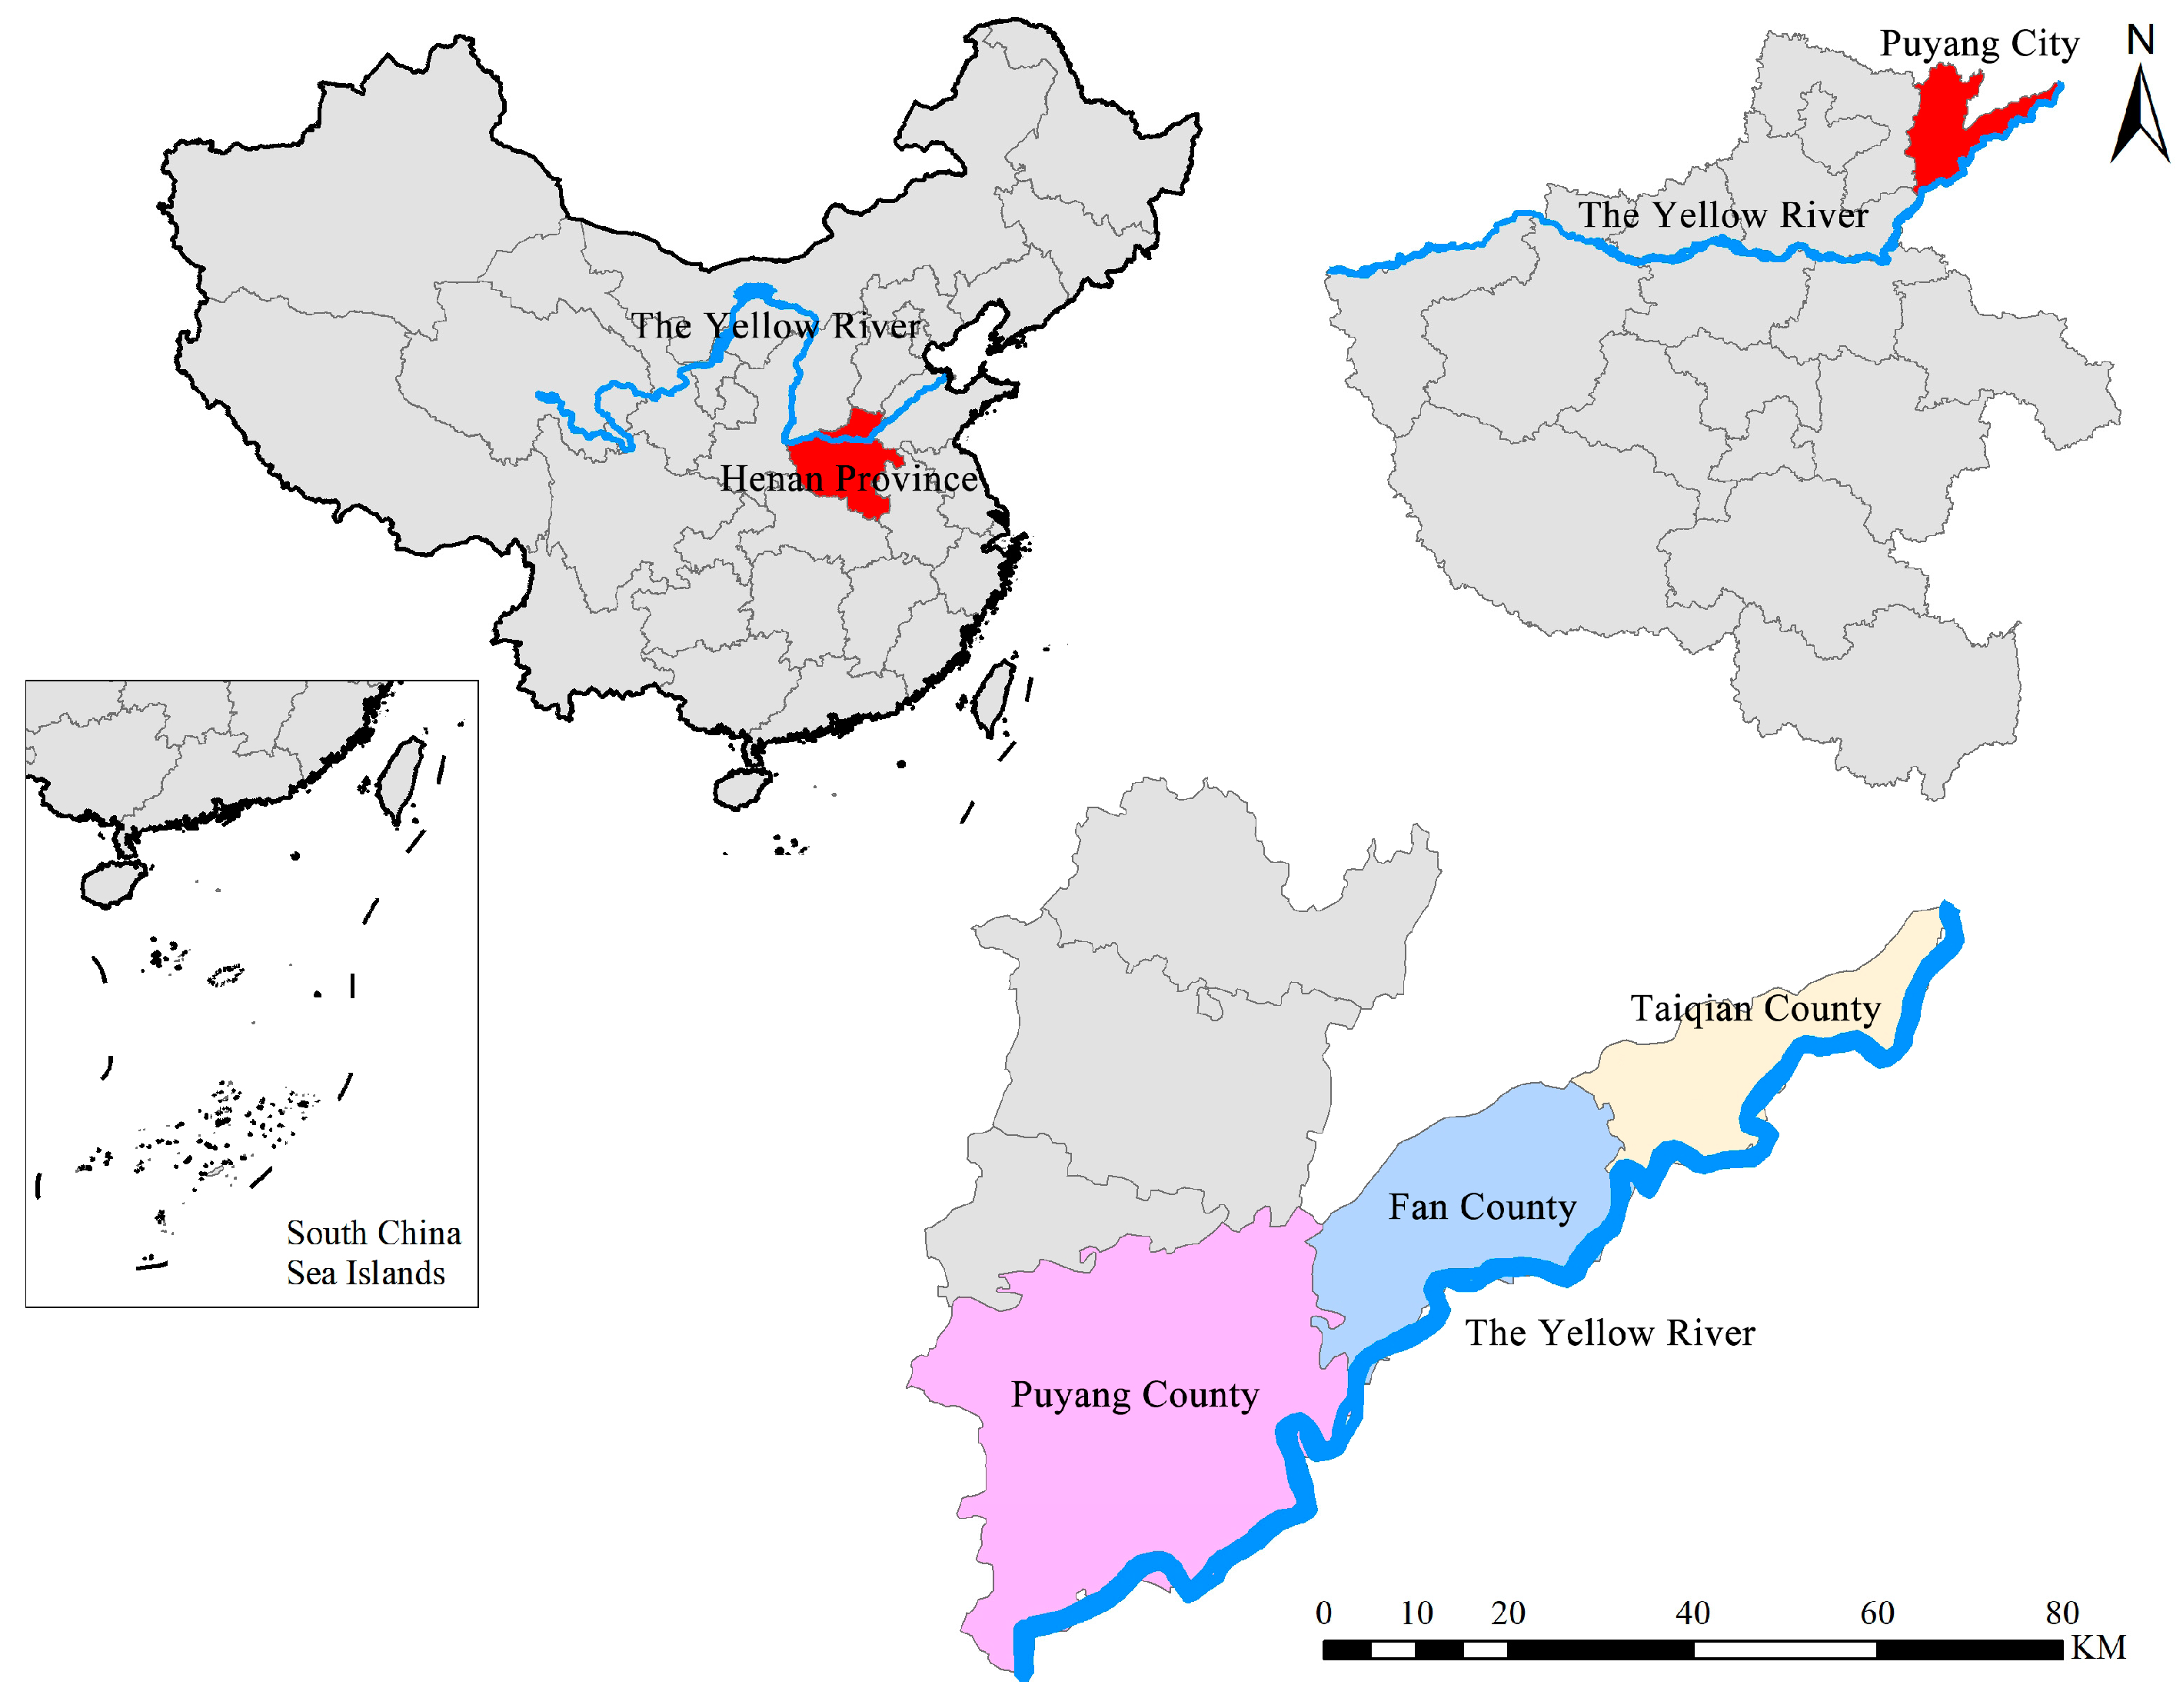
3.2. Research Area
Land requisition and resettlement of migrants are important parts of the Lower Yellow River flood control project (Henan section). The permanent land requisition of this project was 3691.44 mu (1 mu = 666.667 m
2), and the temporary land requisition was 17,063.71 mu. A total of 134,076.45 m
2 of houses were demolished. Among them, Puyang County, Taiqian County, and Fan County under the administration of Puyang City are key areas of land requisition and resettlement of migrants. The permanent land requisition of three counties takes up 44.13% of the total; the temporary land requisition of three counties accounts for 38.10% of the total; the demolished housing area reached 76.58% of the total. Therefore, this research project adopts the three representative areas, including Puyang County, Taiqian County, and Fan County, for field survey. The research area is located to the northeast of Henan Province, and the geographical location is shown in
Figure 1.
3.3. Data Sources
In 2019, our research group went to Henan Province for a field survey of Puyang County, Taiqian County, and Fan County by stratified random sampling. Below are specific steps: (1) Numbered villages and identified 13 villages by probability sampling; (2) Numbered selected villages and identified sample households via simple random sampling; (3) Carried out a door-to-door interview. If no one was in the sample household, it would be replaced by its neighbor. Finally, 200 questionnaires were issued, of which 186 valid questionnaires were collected, with abnormal value or without responses eliminated, which registered a response rate of 93%. Among the valid responses, 134 were resettled farming households, including 53 farming households with land expropriated, 53 farming households with house expropriated, 28 farming households with both land and house expropriated, and 52 non-resettled farming households. The survey covered basic situations of farming households, their land requisition and resettlement, employment and skill training, etc.
Basic situations of household samples are presented in
Table 1. Those aged above 50 years old took up 68.27% of the total, indicating that heads of these farming households were generally not young. Respondents graduating from primary school or middle school took up 68.81% of the total. Those holding a degree of junior college or above accounted for only 6.99%. This suggested that the household heads had a generally low educational degree. Concerning professions of household heads, farmers took up around 68.28% of the total, suggesting that agriculture remained a way for a majority to make a living. Analyzed by the number of labors, 79.57% of families were found with two or fewer than two labors. So there were not many labors in every family.
5. Analysis of Research Results
5.1. Analysis of Livelihood Resilience Measurement Results
In order to more directly compare the livelihood resilience differences between resettled farming households and non-resettled farming households, this paper carries out an inter-group comparison of farming household livelihood resilience.
Figure 2 reveals that the livelihood resilience density curve of all farming households, resettled farming households, and non-resettled farming households is all very steep, meaning that their livelihood resilience fluctuations are not obvious but concentrate around the mean. Among them, the livelihood resilience of all farming households reaches the peak at around 0.38; the livelihood resilience of resettled farming household reaches the peak at around 0.37; the livelihood resilience of non-resettled farming household reaches the peak at around 0.41. The livelihood resilience peak of resettled farming household is all lower than that of all farming households and non-resettled farming households. It means that the livelihood resilience of resettled farming households is lower than that of non-resettled farming households on the whole.
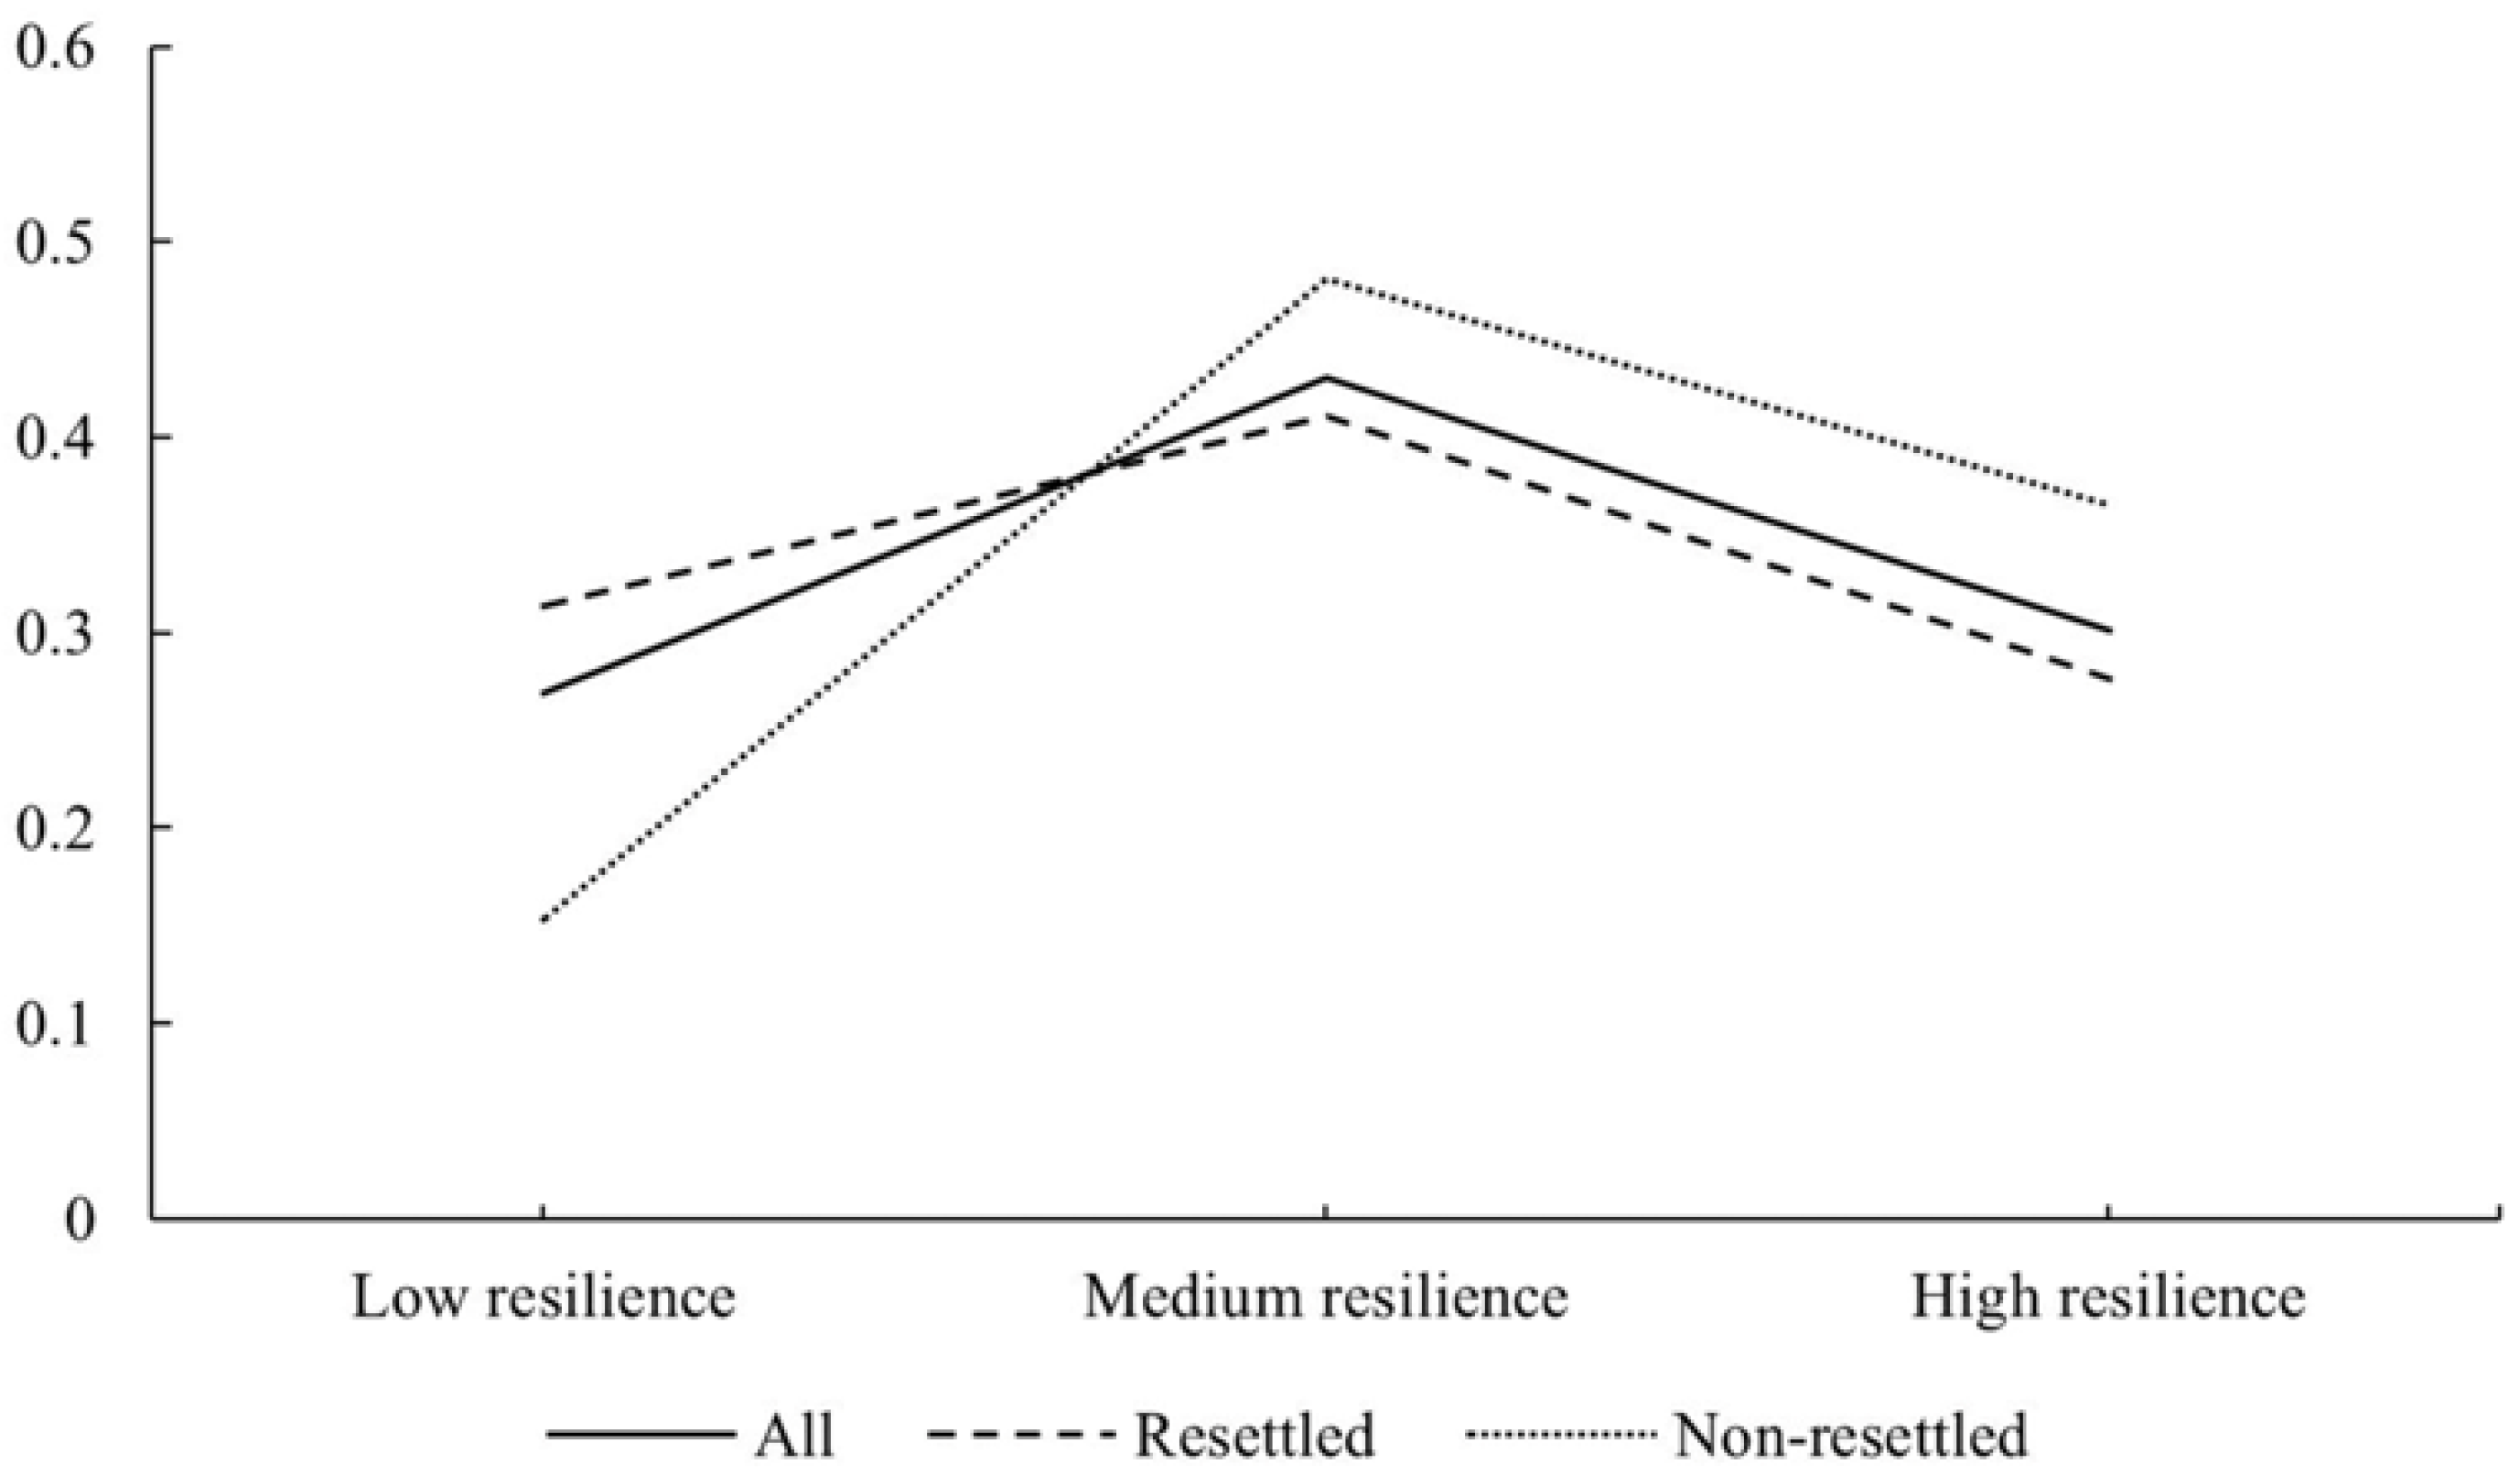
To better recognize characteristics of farming household livelihood resilience, the K-means clustering is used to divide farming households of the research regions into three types, including farming households with a low livelihood resilience, a medium livelihood resilience, and a high livelihood resilience. The F statistics of the one-way analysis of variance is 454.360, and
p value is 0.002. This means that the three types of livelihood resilience are significantly different. The average of the low livelihood resilience, medium livelihood resilience, and high livelihood resilience is 0.226, 0.379, and 0.519. The livelihood resilience distribution of farming households of different types is shown in
Figure 3. Only 15.38% of non-resettled farming households have a low livelihood resilience; the medium and high resilience of non-resettled farming households take up 48.08% and 36.54%, respectively. Among resettled farming households, the low livelihood resilience accounts for 31.34% of the total, the medium and high livelihood resilience account for 41.04% and 27.61%, respectively, which are both lower than the medium and high livelihood resilience of all farming households and non-resettled farming households. The analysis suggests that the livelihood resilience of a majority of resettled farming households is of the medium or low level. The livelihood resilience structure of resettled farming households is poorer than that of non-resettled farming households.
5.2. Analysis of Regression Results
The correlation between farming household livelihood resilience and potential influencing factors is presented in
Table 5. D-W test value is 1.801, meaning that data are mutually independent, which is consistent with conditions to ensure an independent linear regression. When the VIF is within 1.451, it means that the model is free of the problem of collinearity. JB test is conducted on the dependent variable. Results show that
p = 0.841 > 0.05, meaning that the dependent variable follows normal distribution. Results of model verification reveal that the F statistics is 37.278 (
p = 0.000 < 0.05), suggesting that the regression model constructed has statistical significance.
As shown in Model 1, resettlement factors include being resettled or not; family and social factors include family scale, livelihood strategy, and skill training. The influence of all the aforesaid variables on farming household livelihood resilience is all significant at the significance level of 10%. Among them, being resettled or not has a negative influence on farming household livelihood resilience. In other words, land or house requisition caused by flood control projects can weaken a farming household’s livelihood resilience. This finding also shows good agreement with the inter-group comparison results of farming household livelihood resilience. Family scale has a positive influence on livelihood resilience; therefore, the larger the family scale is, the stronger the household livelihood resilience is. Livelihood strategy has a positive impact on farming household livelihood resilience at the significance level of 1%. This finding can lead to the conclusion that the more diversified the livelihood strategies are, the more beneficial it is to improve farming household livelihood resilience. The influence of skill training is positive as well. This suggests that the more frequent the skill training is, the more likely it is to improve farming household livelihood resilience.
Model 2 controls resettlement, family, and social factors and then increases response towards policies to conduct a regression analysis of farming household livelihood resilience. Response to policies can reflect farming households’ acceptance of policies, which is reflected as resettled farming households’ willingness to implement relevant policies and accept management. To non-resettled farming households, response to policies refers to their acceptance of the resettlers to move to their own village group as well as their collaboration with relevant resettlement policies. Results suggest that the influence of response to policies on farming household livelihood resilience is significant at the significance level of 10%. Hence, it is apt to say that active response to policies has a positive influence on farming household livelihood resilience.
5.3. Variance Analysis
In this section, the difference of livelihood resilience between non-resettled farming households and different types of resettled farming households is examined by variance analysis. The homogeneity of variance test shows that p = 0.410 > 0.05, which satisfies the conditions of the homogeneity of variance. Thereby, variance analysis can be conducted. ANOVA results show that F statistics is 6.128, and p value is 0.001, which are far lower than the significance level. This means that the livelihood resilience between non-resettled farming households and different types of resettled farming households is significantly different.
To deepen the knowledge of the difference between non-resettled farming households and three types of resettled farming households, this paper compares them two by two. As one can notice in
Table 6, the mean difference (
p = 0.207) between non-resettled farming households and farming households with house expropriated fails to reach the statistical significance level. The mean difference between farming households with land expropriated and other three types of farming households is negative, being −0.051, −0.077, and −0.141, respectively, and
p < 0.05. This means that the livelihood resilience of farming households with land expropriated is significantly lower than that of the other three types of farming households.


