Article

Understanding the Influencing Factors of Enterprise Transformation and Upgrading Capability: A Case Study of the National Innovation Demonstration Zones, China

School of Business, Shandong Normal University, Jinan 250358, China
*
Author to whom correspondence should be addressed.
Sustainability 2023, 15(3), 2711; https://doi.org/10.3390/su15032711
Submission received: 2 December 2022 / Revised: 5 January 2023 / Accepted: 9 January 2023 / Published: 2 February 2023
(This article belongs to the Section Sustainable Urban and Rural Development)

Abstract

:
Being at the forefront of China’s regional innovation and development, enterprises in the National Innovation Demonstration Zones must take the lead in completing high-quality transformation and upgrading. In this study, we use data from 1770 manufacturing companies from China’s 21 National Innovation Demonstration Zones. Based on the multi-factor influence model, we quantitatively study a series of factors that affect enterprise transformation and upgrading capability in terms of innovation-driven input, economically beneficial output, regional high-quality development, and the enterprise’s basic environment. The research results show a good trend in enterprise transformation and upgrading capability, and 45% of the enterprises have higher capabilities than the average of these zones. There are significant differences in these capabilities across the different National Innovation Demonstration Zones. Economically beneficial output has a relatively large impact on enterprise transformation and upgrading capability, while innovation-driven input, regional high-quality development, and the enterprise’s basic environment all have a relatively small impact. We suggest that the National Innovation Demonstration Zones and relevant departments should provide policy guarantees for enterprise transformation and upgrading in terms of regional systems, industrial chain layout, and soft environment optimization, so as to fully enable policy benefits from top-level design.

1. Introduction

The construction of the world’s leading high-tech parks has greatly promoted the development of regional economies in developed countries and achieved remarkable achievements. In the process of leading the rapid development of the regional economy, the world’s leading high-tech parks have become important platforms for developed countries to develop high-tech industries and cultivate new kinetic energy by relying on their strong capabilities in enterprise transformation and upgrading. For example, Silicon Valley in the United States is the world’s technological innovation center. Through continuous improvement of the operating mechanism of close cooperation between the government, universities, scientific research institutions, and technology enterprises, a large number of original emerging industries and “unicorns” with world influence have been cultivated, helping to guarantee the dominant position of the US in strategic scientific and technological power [1]. According to the “2021 Silicon Valley Index” report, the per capita annual income of Silicon Valley Industrial Park was 152,000 US dollars, an increase of 49% from 2017, and the number of patents and amount of venture capital accounted for 13.1% and 21.3% of the total in the United States [2]. Enterprises in Singapore’s Jurong Industrial Zone contribute more than 20% of Singapore’s GDP and attract more than one-third of the country’s labor force [3]. The R&D companies in the Sofia Science Park in France grow at an annual rate of about 2.5%, and it is now the largest science and technology (S&T) park in Europe [4]. This all shows that the construction of high-tech industrial parks has greatly promoted the development of regional economies. The transformation of enterprises’ structure and power and improvements in economic benefits all play an important role in this process. Enterprise transformation and upgrading capability is an important focus of regional economic development.
At the same time, with the impact of the COVID-19 epidemic, the uncertainties of the world environment have increased, and the global trade structure and industrial division of labor have changed. China’s regional economic development is facing severe transformation challenges. In order to accelerate the promotion of regional coordinated development and lead regional innovation, China established the first regional National Innovation Demonstration Zone (NIDZ)—Zhong-Guan-Cun—in March 2009. After 13 years of development, the NIDZs have continuously improved the level of innovation-driven development and have become pioneers for the main engine of innovation-driven high-quality development in China [3]. China’s “14th Five-Year” development plan and outline of its 2035 long-term goals also clearly state the necessity of accelerating the construction of major S&T innovation platforms and strengthening the innovation function of the NIDZs. According to statistics, 21 NIDZs achieved a total production value of 9.6 trillion yuan in 2020, accounting for 9.5% of GDP [5]. However, the new development concept of “innovation, coordination, green, openness and sharing”, the “dual carbon” goal and the strategic goal of China’s high-quality economic development together imply higher, more sustainable, and more comprehensive development requirements for enterprise transformation and upgrading capability. Especially with the penetration and application of new-generation Internet information technologies such as the Internet of Things, Blockchain, Big Data, and artificial intelligence in the development processes of enterprises, enterprises’ transformation and upgrading capabilities present heterogeneity between regions. Enterprise transformation and upgrading have been endowed with a new-era connotation [6,7]. How do we grasp the connotations of enterprise transformation and upgrading under the new circumstances? How do we explore the influencing factors that affect enterprise transformation and upgrading capabilities in the NIDZs? These are key issues for the high-quality development of China’s economy and the construction of a modern economic system. Therefore, it is of great significance to explore the factors that influence enterprise transformation and upgrading capabilities under the framework of the NIDZs during this critical period of China’s economic development, so as to give full play to the innovation-leading role of the NIDZs [8].
Against the background of the new development pattern of China’s dual cycle, the new requirements of the “five development concepts”, and the new goals of high-quality development, what are the factors affecting the improvement of enterprises’ transformation and upgrading capabilities in NIDZs at this stage? Which factors have a significant impact on these capabilities? In order to solve the problem, based on the data of 1770 manufacturing enterprises from 21 NIDZs in 2020, the enterprise transformation and upgrading capability is calculated. Then, through the construction of a variable selection model, the stepwise regression method is used to solve the multi-factor model of enterprise transformation and upgrading capability. On this basis, we discuss the key factors affecting this capability under the framework of the NIDZs and the mechanisms by which these factors affect the capability. The contributions of this paper are as follows. On the one hand, previous studies have mainly focused on transformation and upgrading at the regional and industry levels. However, we focus on the enterprises in NIDZs, clarify the differences between enterprises’ transformation and upgrading capabilities in different NIDZs, and find the key factors that affect such capabilities in NIDZs. On the other hand, the conceptual extension of enterprise transformation and upgrading involves many aspects such as products, technologies, management, and systems, and it is difficult to reflect these aspects in individual indicators. Differently from previous work, we have established a more complete evaluation index system and have quantified the impact of the factors on enterprises’ transformation and upgrading capabilities through the construction of a multi-factor impact model.
The structure of this paper is as follows. In Section 2, we review the relevant literature related to NIDZs and the factors that influence enterprises’ transformation and upgrading capabilities. The study’s context and data sources are discussed in Section 3 of this paper. In Section 4, we describe the research methodology. Section 5 contains the discussion of the empirical results. Section 6 presents conclusions and policy recommendations.

2. Literature Review

2.1. Studies of Enterprises’ Transformation and Upgrading

Enterprises’ transformation and upgrading has always been one of the hot topics in the field of management research. The concept was first proposed in 1999 [9], and the related research mainly focuses on enterprise or organizational transformation [10,11], enterprise or industrial upgrading [12], and enterprise catch-up [13]. Up to now, however, the concept has not been clearly defined. On the one hand, enterprises’ transformation and upgrading capabilities under the current situation include such development characteristics as “innovation”, “intelligence”, and being “green” [14]. On the other hand, since the concept of enterprise transformation and upgrading involves various aspects, such as products, technology, and management [15], it is difficult to reflect those aspects using individual indicators, and there is no set of quantitative evaluation standards. Therefore, the research on enterprise transformation and upgrading is mostly focused on qualitative analysis, and the most common analysis method is the case study method [16]. For example, Wang et al., have studied the upgrading process from Original Equipment Manufacturer (OEM) to Original Design Manufacturer (ODM) and Original Brand Manufacturer (OBM) using a comparative analysis of two companies and summarized the key success factors of their upgrading, mainly including advanced R&D capability, building corporate goodwill, and credit [17]. Ho et al., have studied the impact of manpower secondment on the technological upgrading of SMEs using Singapore’s T-Up program as an example, and the results show that the manpower secondment program promotes the upgrading of enterprises by improving their technological capabilities and innovation performance [18].
Although case studies can visually represent the transformation and upgrading process of an enterprise, the scope of this type of research is relatively limited because a single sample is not universally applicable to all enterprises. In recent years, researchers have begun to study the problem of enterprise transformation and upgrading from a quantitative perspective, and most reflect the development level of such capabilities using two aspects. The first is the level of corporate assets and innovation output [19], captured by intermediate variables such as intensity of R&D investment [20], operating profit margin [21], proportion of R&D expenditures, and economic value added per share [22]. However, these methods have certain limitations. On the one hand, changes in intermediate variables such as enterprise innovation only indicate that an enterprise has transformation and upgrading behavior and does not reflect the level of enterprise transformation and upgrading achieved. On the other hand, economist Krugman believes that China’s economic growth is “extensive”, while the truly sustainable growth is “intensive”; that is, growth should be achieved by improving efficiency. Therefore, it is not enough for enterprises to use only intermediate variables such as enterprise innovation output to reflect the level of enterprise transformation and upgrading. The second aspect is the improvement of production methods or production efficiency by enterprises. Such improvements can lead to shifts from low- to high-value-added products, providing differences in the total factor productivity of enterprises eventually. Enterprise total factor productivity explains the increase in output caused by technological progress, structural optimization, resource allocation efficiency optimization, etc. No matter how the enterprise changes its product or industrial value chain, this will ultimately be reflected in its total factor productivity [23]. For example, scholars such as Yuan have used enterprise total factor productivity to measure the level of transformation and upgrading of manufacturing enterprises, and have studied the inverted U-shaped relationship between China’s market segmentation and manufacturing enterprises’ upgrading [24]. Scholars such as Shen et al., have also taken enterprise total factor productivity as a surrogate variable for enterprise transformation and upgrading capabilities. Their study has found that an increase in the intensity of environmental supervision promotes the improvement of enterprise total factor productivity [8]. It can thus be seen that enterprise total factor productivity is more and more being used to measure enterprises’ transformation and upgrading capabilities and is a representative indicator at this stage.

2.2. Studies of Influencing Factors

In order to further stimulate the huge potential of enterprise transformation and upgrading, it is first necessary to clarify the factors that affect such capabilities [7]. In terms of factors influencing the transformation and upgrading capabilities of the industry and enterprise, most studies focus on the following two aspects. The first is a focus on the factors that influence enterprise transformation and upgrading capabilities from the regional level. Previous scholars have studied such factors in the Guangdong-Hong Kong-Macao Greater Bay Area [25], the Yangtze River Delta [26], the Yellow River Basin City Cluster [27], and resource-based cities [28]. The first study has found that the transformation and upgrading capabilities in the Guangdong–Hong Kong–Macao Greater Bay Area are mainly affected by the five dimensions of intelligent manufacturing industry, technological innovation, scale agglomeration, market demand, and fixed asset investment [25]. Compared with pure technical efficiency, scale efficiency has been found to have a greater impact on the transformation and upgrading capabilities of the manufacturing industry in the Yangtze River Delta [26]. Based on the super-efficiency data envelopment analysis (DEA) model, the evaluation of the Yellow River Basin urban agglomeration shows that the industrial structure, economic development, technological innovation level, and industrial agglomeration have had significant impacts on industrial transformation and upgrading capabilities [27]. Miao et al., have adopted a “rough set-based rule mining technique of learning” research method and have concluded that the input of physical and human capital under government policy intervention is the key factor determining the transformation and upgrading capabilities of resource-based cities [28].
Second, it is necessary to study the factors influencing enterprise transformation and upgrading capabilities from the industry level. One previous study has found that basic production factors such as physical and human capital are still the key factors restricting the capabilities of enterprises in the construction industry to transform and upgrade, and that the level of technological innovation has a significantly positive role in promoting the transformation of construction enterprises [29]. The technology acquisition mechanism and the degree of business diversification have been found to have a potentially significant impact on the transformation and upgrading capabilities of Chinese wind turbine manufacturing enterprises [29]. Environmental regulation and green innovation are found to have a significant impact on the intelligent upgrading of manufacturing enterprises, and environmental dynamism can positively regulate the relationship between green innovation and manufacturing enterprise transformation and upgrading capability [30]. Human capital, financing ability, technological innovation, and government behavior can significantly affect the green transformation and upgrading capabilities of Chinese manufacturing enterprises [31]. Corporate profitability, human capital quality, and industry intelligence level are important factors affecting the transformation and upgrading of SMEs [32]. In addition, Wen et al., have used a quasi-experimental method to study the impact of green credit policies on the transformation and upgrading of energy-intensive enterprises from the perspective of credit allocation efficiency. The research results show that a green credit policy can have a significantly negative impact on enterprise transformation and upgrading capabilities [20].

2.3. Studies of National Innovation Demonstration Zones

The National Innovation Demonstration Zones (NIDZs), approved by the State Council, aim to continuously gather innovation elements through deepening institutional reforms and policy pilots and to shoulder the important mission of promoting scientific and technological policy innovation. The construction of NIDZs is a regional development strategy with Chinese characteristics. Today, NIDZ has become an innovation highland for China’s regional development and a frontier for international scientific and technological innovation cooperation, beneficially combining multi-point radiation, a systematic layout, and leading development [33]. Since the first construction and development of the NIDZs, research on them has mainly been carried out in terms of the following three aspects.
First, there is the innovation capability evaluation of NIDZs. Most of this research mainly evaluates the level of high-quality development and the innovation capabilities of NIDZs based on innovation input, innovative talent, innovation environment, and innovation output. Studies have found that, from the perspective of the time axis, the overall green and high-quality development levels of the NIDZs have been greatly improved [34,35]. However, there are also problems, such as unbalanced development among NIDZs [36] and insignificant innovation spillover effects [37]. The talent policy of the NIDZs is improving day by day. Compared with that of the Zhong-Guan-Cun NIDZ, the construction of the talent policy of the Wu-Han East Lake NIDZ is slightly behind [38]. Second, there is the research on the impact of NIDZs on the regional economy or innovation performance. Here, existing studies have used the DID method [37] and the breakpoint regression method [39], among others. The research results show that the construction of the NIDZs has significantly improved the level of urban technological innovation [40]. The pilot policy of the NIDZs has a significant role in promoting regional economic growth [41]. To be specific, there is significant regional heterogeneity in the implementation of policies in NIDZs, with the policy implementation being greatest in the eastern region [42]. The establishment of the NIDZs has significantly promoted the improvement of regional innovation capabilities, while the NIDZ policy has had a positive impact on the economic growth of the Beijing region through innovation capabilities [39]. Third, there is the research on NIDZs from the perspective of macro-strategic positioning and construction direction. Through a comparative analysis of 17 NIDZs, including Zhong-Guan-Cun, Zhang proposes promoting the innovative development of NIDZs from the perspective of a regional innovation coordination mechanism [43]. Some scholars have systematically summarized the phased characteristics of a NIDZ’s construction, starting from the policy arrangements. It is beneficial to clarify the current issues with the NIDZs’ development, and to propose new directions for exploration, such as differentiated development and integration and coordination [44].
To sum up, previous studies have mainly focused on enterprises’ transformation and upgrading capabilities and the factors that influence them, as well as the innovation development of the NIDZs, all of which have achieved good research progress. Enterprises’ transformation and upgrading are influenced by various factors, and previous studies have explored the impact of individual factors or combinations of them. However, the research on enterprise transformation and upgrading development level focused on the NIDZs is relatively lacking. The new generation of Internet information technology has completely changed the original competition rules of enterprises in NIDZs [45]. It is thus necessary to further improve the index system for evaluating influencing factors and the methods used to research them. The previous studies have not reflected these two characteristics, and this paper attempts to fill this research gap. Therefore, based on the data of 1770 manufacturing enterprises from 21 NIDZs from 2020, this paper constructs a multi-factor model of enterprises’ transformation and upgrading capabilities. Thus, our research goal in this paper is to quantify the key factors that affect such capabilities and explore the mechanisms by which different factors impact such capabilities under the framework of NIDZs. It has certain guiding significance for enterprises in the NIDZs to carry out transformation and upgrading.

3. Data and Indicator System Establishment

The research data used for this study concerns the A-share manufacturing enterprises in China’s NIDZs. The first NIDZ (Zhong-Guan-Cun NIDZ) was approved by the State Council in 2009 and, as of March 2022, there are 21 NIDZs distributed among 19 provinces in China. Of these, 11 are located in eastern China, 6 in central China, and 4 in western China. Details are provided in Table 1.
The transformation and upgrading of manufacturing enterprises is an important manifestation of China’s vigorous development of the real economy and realization of high-quality development. We selected 1770 A-share manufacturing enterprises from China’s NIDZs as our research object in order to explore the key factors affecting enterprises’ transformation and upgrading capabilities. The data on the A-share manufacturing enterprises comes from the CSMAR database provided by Shenzhen Guotaian Information Technology Co., Ltd. Table 1 shows the distribution of the 1770 A-share manufacturing enterprises across China’s 21 NIDZs. As we can see from Table 1, both the Su-Nan NIDZ and the Shen-Zhen NIDZ are located in the eastern coastal region of China, and the number of enterprises in these two NIDZs exceeds two hundred (see Table 1), accounting for 28% of the total number of enterprises. However, the number of enterprises in the Lan-Bai and Wu-Chang-Shi NIDZs, which are located in the western part of China, is low, only accounting for 2% of the enterprises.
The NIDZs are on the frontier of China’s promotion of innovation development and enterprise transformation and upgrading. The new generation of Internet information technology has completely changed the original competition rules of the enterprises in NIDZs. How do we construct an evaluation index system that can reflect the characteristics of the new era? How do we grasp the factors that influence enterprise transformation and upgrading capabilities under the current situation? This is our concern. As we all know, there are many factors that affect enterprises’ transformation and upgrading capabilities, such as government subsidies [46], R&D investment level [47,48], technological innovation ability [49], green development level, etc. However, when considering the factors, we should not only consider the internal factors of the enterprises, but also those external to them. The human and capital investment inside and outside of an enterprise enable it to transform the existing production equipment or introduce advanced production equipment, thereby optimizing the production process, driving the R&D of new products, and promoting transformation and upgrading capabilities [50]. The economically beneficial output outside of an enterprise enables it to promote consumer demand and adjust the economic structure so that the enterprise can achieve transformation and upgrading [51]. At the same time, in the era of the digital economy and the popularization of the Internet, the high-quality economic development of enterprises that integrates the characteristics of “digitalization, intelligence and greening” can lead the way for enterprises’ transformation and upgrading. That is to say, more intensive factors, greener technology, and more intelligent production are conducive to enterprises’ development up the value chain [52]. In addition, a good external environment for enterprises can promote an increase in consumer demand and the upgrading of enterprises’ consumption structure, driving the development of enterprises towards rationalization and advancement.
Based on the above, this paper analyzes the key factors affecting enterprises’ transformation and upgrading capabilities from four dimensions: innovation-driven input (IDI), economically beneficial output (EBO), regional high-quality development (RHD), and the enterprise’s basic environment (EBE). Based on the principles of relevance, comprehensiveness, systematization, and data availability, we have selected 22 secondary indicators to measure IDI, including 3 internal factor indicators and 19 external factor indicators, 22 secondary indicators to measure EBO, including 8 internal factor indicators and 14 external factor indicators, 26 secondary indicators for measuring RHD (all external factor indicators) and 18 secondary indicators to measure EBE (all external factor indicators). The data for the external factors comes from the China Statistical Yearbook(http://www.stats.gov.cn/tjsj/ndsj/2021/indexch.htm (accessed on 1 December 2022)), the China Science and Technology Statistical Yearbook (http://cnki.nbsti.net/CSYDMirror/trade/Yearbook/Single/N2022010277?z=Z018 (accessed on 1 December 2022)), the China Torch Statistical Yearbook (https://data.cnki.net/v3/Trade/yearbook/single/N2021120209?zcode=Z018 (accessed on 1 December 2022)), and the statistical yearbooks of each province in 2021. The index system we have constructed to evaluate the enterprises’ transformation and upgrading capabilities in the NIDZs is shown in Table 2.

4. Methodology

As shown in Figure 1, we first use the LP method to calculate the enterprise’s total factor productivity as a measure of the enterprise’s transformation and upgrading capability, then construct a multi-factor influence model for enterprises’ transformation and upgrading capabilities to analyze the key factors affecting the TFP. The following is a detailed introduction.

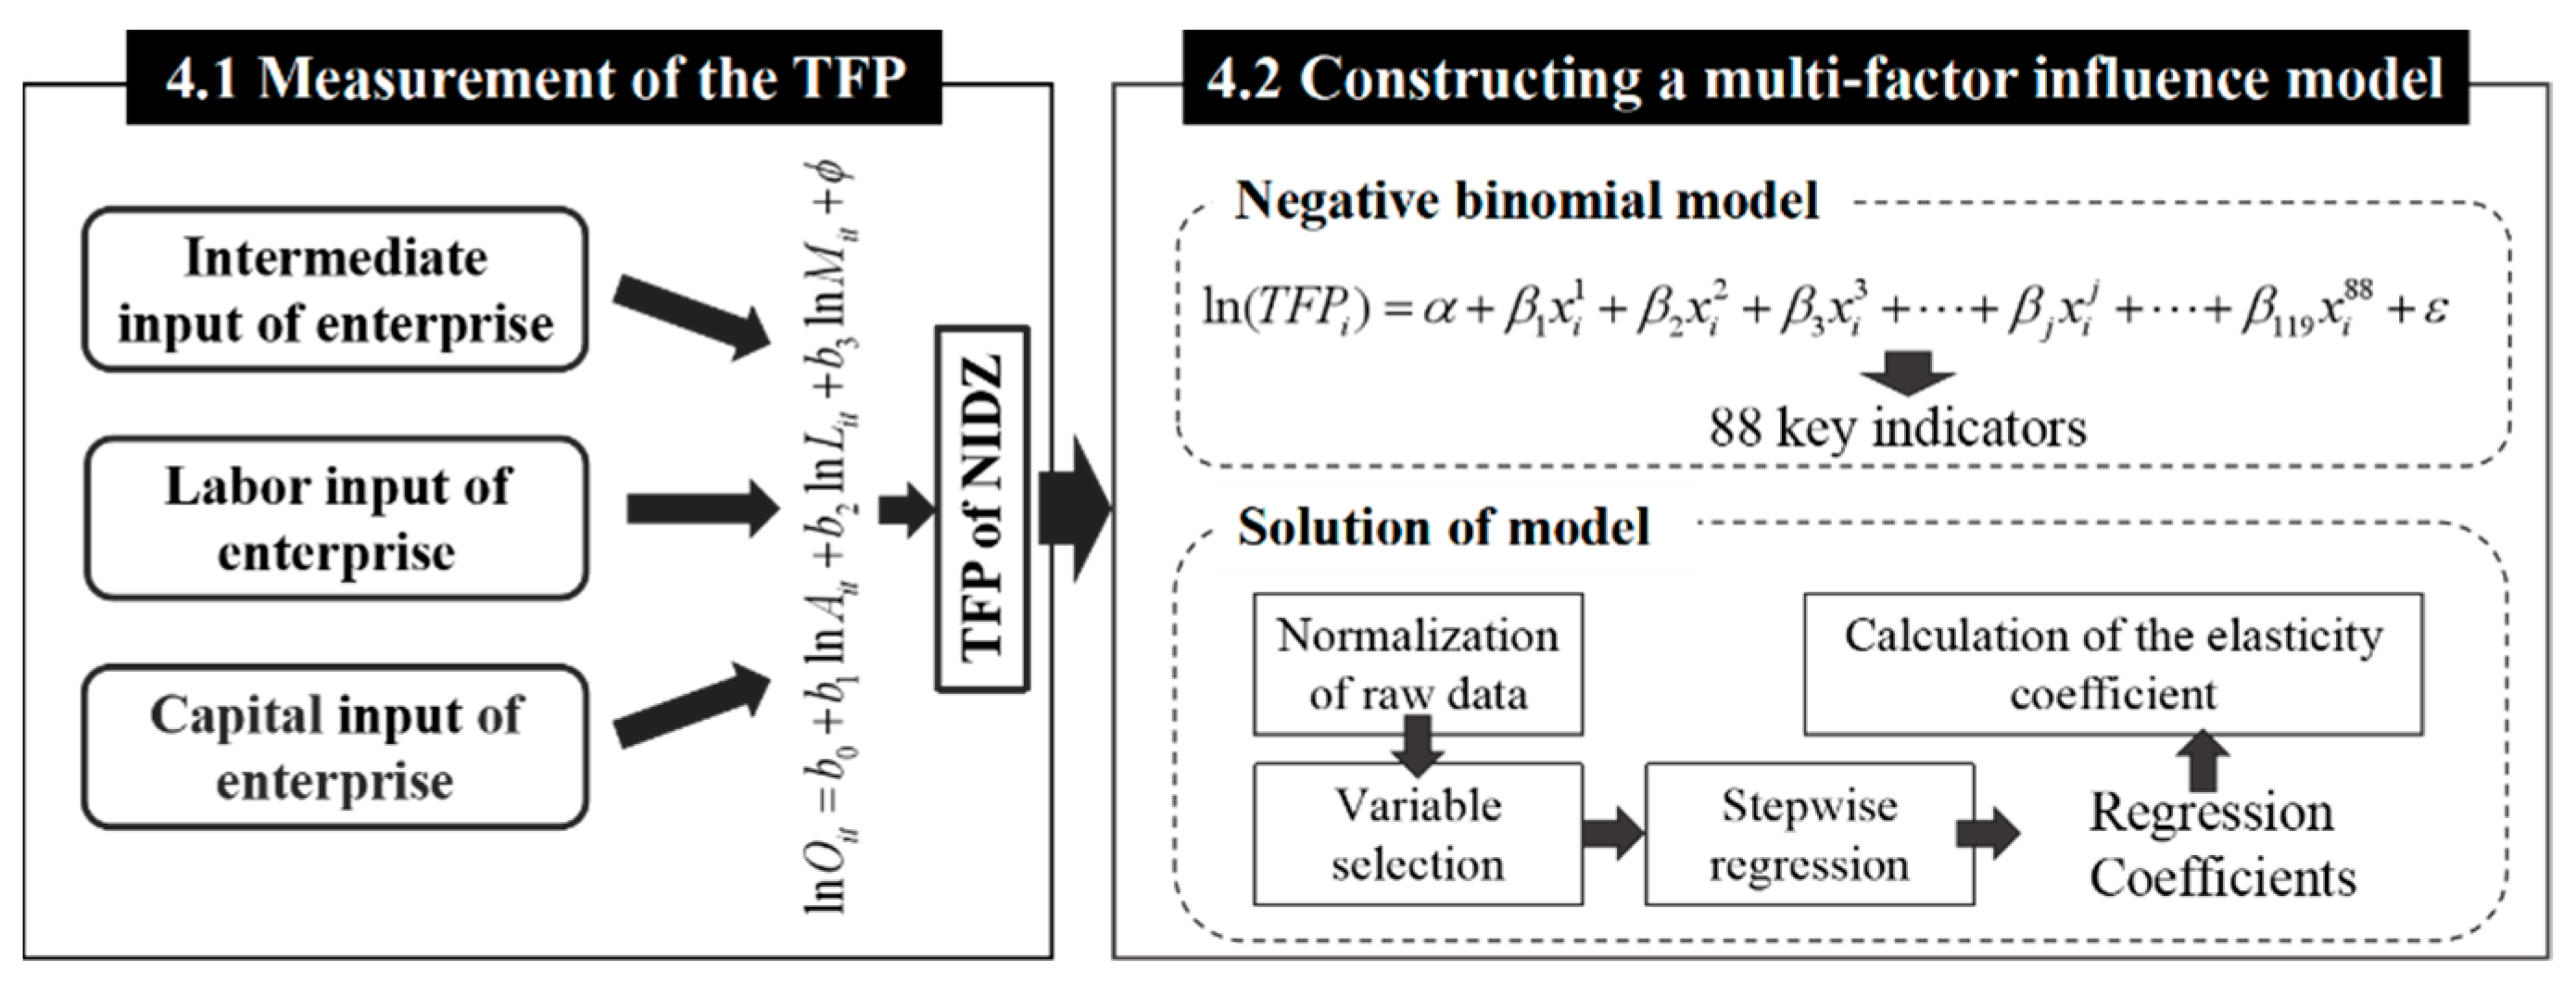
4.1. Measurement of Enterprises’ Transformation and Upgrading Capabilities

Enterprise total factor productivity is the output increase that can be explained by the technological progress, structural optimization, and improvement of resource allocation efficiency of enterprises, excluding factor contributions (including capital input, human input, etc.). Enterprise total factor productivity is widely used to measure the sustainable economic development capabilities and technological innovation level of enterprises, which is a representative index for measuring manufacturing enterprises’ transformation and upgrading capabilities. Therefore, we choose enterprise total factor productivity as the dependent variable in this paper to represent enterprises’ transformation and upgrading capabilities. There are three main methods for calculating the total factor productivity: the parametric method, the non-parametric method, and the semi-parametric method. At present, most scholars prefer the semi-parametric method for measuring the total factor productivity of enterprises, mainly using the Olley-Pakes (OP) or the Levinsohn-Petrin (LP) method, which can avoid simultaneity bias and sample selection bias. When calculating the enterprises’ total factor productivity, the OP method takes investment as a proxy variable, while the LP method takes intermediate input as a proxy variable. Since some enterprises lack investment data, the LP method can reduce the loss of sample size and calculate the enterprise total factor productivity more accurately. Therefore, we use the LP method to calculate the enterprise’s total factor productivity as a measure of the enterprise’s transformation and upgrading capability. The constructed model (1) is shown below. The Stata MP 16.0 software is used to perform an OLS regression of model (1), and the residual term contains information in the form of the logarithm of enterprise total factor productivity.
ln O i t = b 0 + b 1 ln A i t + b 2 ln L i t + b 3 ln M i t + ϕ
Specifically, Oit represents the output of enterprise i in period t, measured by the enterprise’s operating income, Ait represents the capital input of enterprise i in period t, measured by the enterprise’s fixed assets, Lit represents the labor input of enterprise i in period t, measured by the compensation paid to employees, Mit represents the intermediate input of enterprise i in period t, calculated by “operating cost + selling expense + administrative expense + financial expense + R&D expense-depreciation and amortization-employee compensation”, b0 represents the intercept term, and ϕ represents the error term.

4.2. Constructing a Multi-Factor Influence Model for Enterprises’ Transformation and Upgrading Capabilities

Next, we construct a multi-factor influence model to study the correlation between the enterprises’ transformation and upgrading capabilities and each influencing factor. Given that the dependent variable (enterprise total factor productivity) is discrete count data, we incorporate a negative binomial regression model into the multi-factor influence model to construct a functional relationship between enterprises’ transformation and upgrading capabilities and the different influencing factors [53,54], as shown in Equation (2).
ln ( T F P i ) = α + β 1 x i 1 + β 2 x i 2 + β 3 x i 3 + + β j x i j + + β 119 x i 88 + ε
Here, TFPi represents the transformation and upgrading capabilities of enterprise i, x i j represents the influencing factor j that affects such capabilities of enterprise i, βj represents the regression coefficient of the variable Xj in the regression equation, α represents the intercept term, and the scalar ε represents the residual term.
The multi-factor influence model constructed in this paper involves 88 evaluation indicators. Considering the possible multi-collinearity problem among the factors influencing enterprises’ transformation and upgrading capabilities, ordinary negative binomial regression cannot be used to accurately estimate the influence of the independent variables on the dependent variable. We wish to avoid only selecting individual factors or a few factors that influence enterprises’ transformation and upgrading capabilities and retain as many factors that affect these capabilities as possible in solving the model. To do so, we construct a variable selection model using a Bayesian prior sparse function and stepwise regression. Specifically, the following steps are followed:
Step 1: Normalization of raw data. Matrix X = ( x i j ) is composed of 88 secondary indicators that affect enterprises’ transformation and upgrading capabilities (i = 1, 2, …, 1770; j = 1, 2, …, 88). We standardize all the evaluation indicators one by one within the 0–1 interval and obtain the standardized x ( i j ) , { x ( i j ) | x ( i j ) = X max j X i j X max j X min j } (positive indicator), { x ( i j ) | x ( i j ) = X max j X i j X max j X min j } (negative indicator), where, x m i n j and x m a x j , respectively represent the minimum and maximum values of all observations of the jth index.
Step 2: Construction of a variable selection model to solve the multi-collinearity problem between variables. Using the Bayesian prior sparse function to randomly sample the standardized observations x = ( x i j ), a vector γ = (γj) (j = 1, 2, …, 88) is sampled according to the regression coefficients of the independent variables, such that βj (j = 1, 2, …, 88) denotes the set of coefficients on the variables x i j . If βj = 0, let γj = 0, otherwise let γj = 1, then γj obeys the (0–1) distribution. We can obtain a good default value γ without prior information from the Bernoulli distribution, and its probability density function can be written as:
f = p j γ j ( 1 p j ) 1 γ j = { p j , γ j = 1 1 p j , γ j = 0
At the same time, let γ = (γ1, γ2, …, γn)T. Then, its probability density can be written as
γ ~ j = 1 n ( 1 p j ) 1 γ j
We can determine pj by determining the ideal number of influencing factors m in the regression model, with p j = m n , where n represents the total number of influencing factors (n = 88 in this paper) and m represents the expected number of influencing factors when resolving the model. Overall, a priori, γ is first obtained by sampling using Equation (3), and then the corresponding influencing factors satisfying the condition βj ≠ 0 are selected according to γj = 1. Thus, we obtain a sample of X, denoted by X* = (xk) (k = 1, 2, …, m).
Step 3: Solving the multi-factor influence model by stepwise regression. StataMP16 is used to process the data, and a negative binomial regression of the sample influences X* on the enterprises’ transformation and upgrading capabilities is conducted using the variable selection model. Furthermore, the regression coefficient β* of each influencing factor with respect to the enterprises’ transformation and upgrading capabilities can be found by selecting the regression results at the significance level 0.05. At the same time, in order to ensure that all influencing factors are included in the regression model, and to avoid errors in the regression results, we repeat the above process a sufficient number of times to ensure the comprehensiveness and accuracy of the results. The regression results from 5,000 runs were ranked from largest to smallest R2. Then, the top 50% were taken and averaged to give the final regression coefficients of the 88 influencing factors. The functional relationship between enterprises’ transformation and upgrading capabilities and their influencing factors is
T F P i = β 0 + β 1 1 x i 1 + β 2 x i 2 + + β 88 x i 88
By solving Equation (5), we obtain the fit values for each influencing factor. Next, we can measure the impact of the four first-level indicators, IDI, EBO, RHD, and EBE, on enterprises’ transformation and upgrading capabilities, as follows.
T F P 1 = β 1 x i 1 + β 2 x i 2 + + β 22 x i 2 T F P 2 = β 23 x i 23 + β 24 x i 24 + + β 44 x i 44 T F P 3 = β 45 x i 45 + β 46 x i 46 + + β 70 x i 70 T F P 4 = β 71 x i 71 + β 72 x i 72 + + β 88 x i 88
Here, TFP1 represents the degree of influence of the internal and external IDI indicators on enterprises’ transformation and upgrading capabilities, TFP2 represents the degree of influence of the internal and external EBO indicators on such capabilities, TFP3 represents the degree of influence of the RHD indicators on such capabilities, and TFP4 represents the degree of influence of the EBE indicators on such capabilities.
Step 4: Calculation of the elasticity coefficient of each influence factor. The coefficient of elasticity refers to the degree of change in the dependent variable, given a 1% change in a given influencing factor. The larger the elasticity coefficient, the more sensitive the dependent variable is to changes in this influencing factor, and vice versa. The elasticity coefficients of the factors influencing enterprises’ transformation and upgrading capabilities are calculated by
E T i , j = Δ y i , j / y i Δ x i , j / x i , ( j = 1 , 2 , , 88 )
where ETi,j denotes the elasticity coefficient of the jth influencing factor for firm i, Δ x i , j denotes the change in the jth factor with other influencing factors unchanged, and Δ y i , j represents the change in the dependent variable caused by the change in the jth factor. xi and yi respectively denote the values of the independent and dependent variables before the change.

5. Results and Discussion

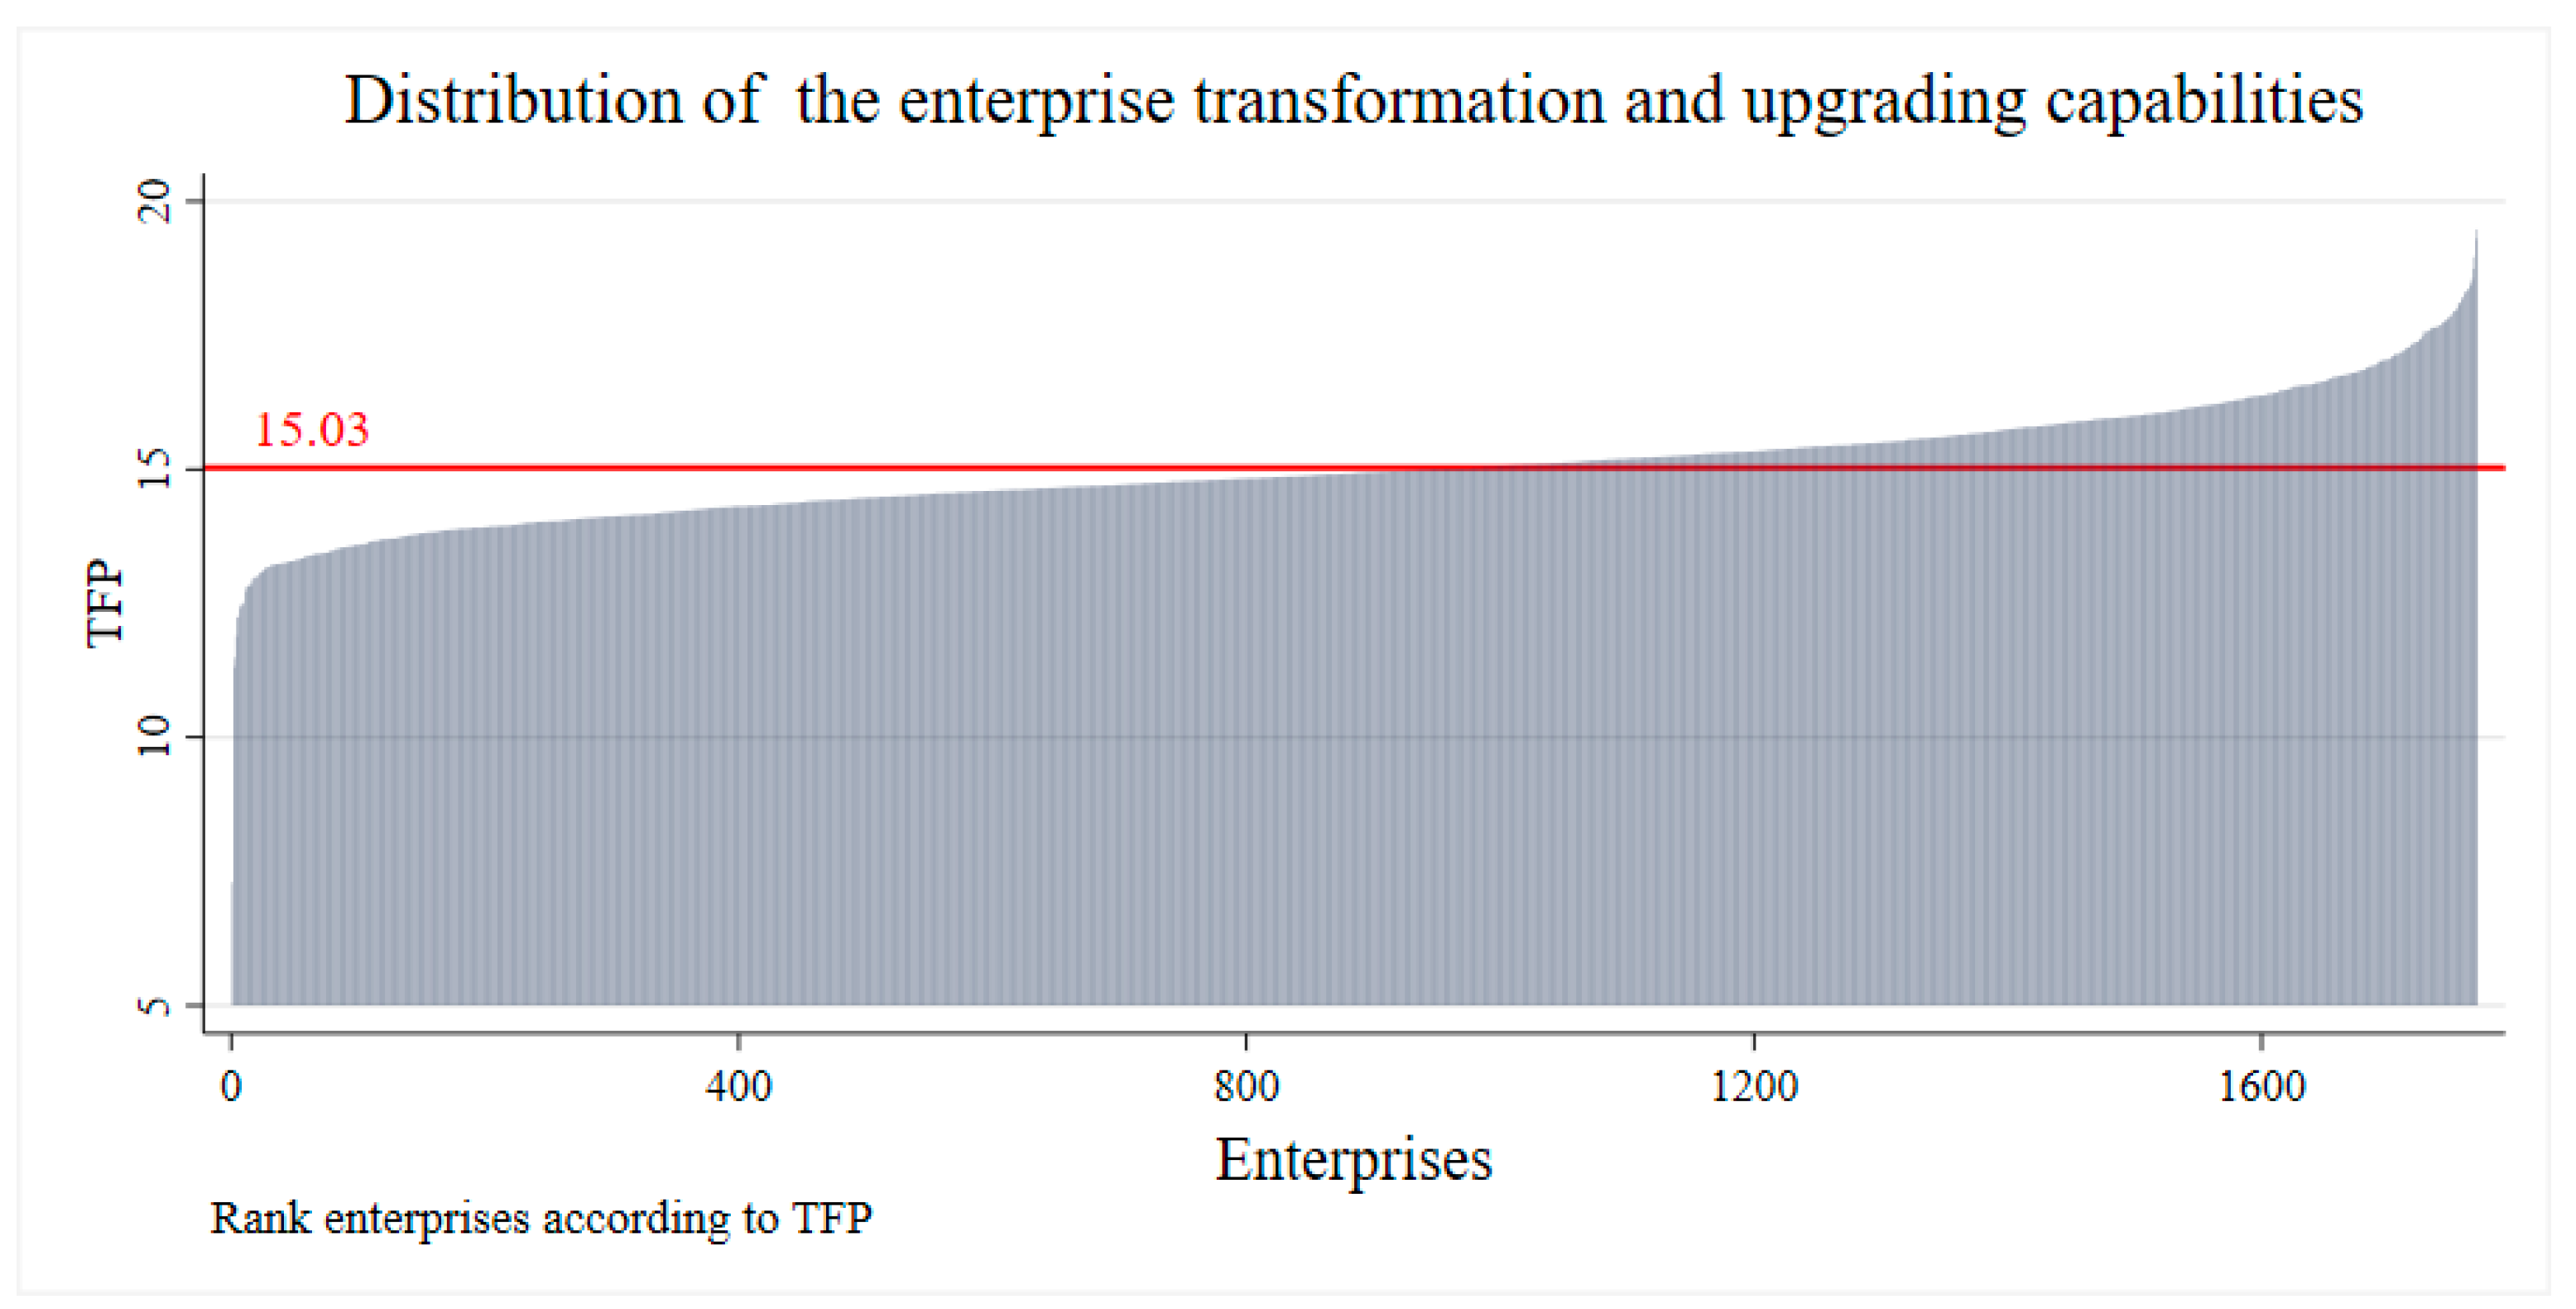
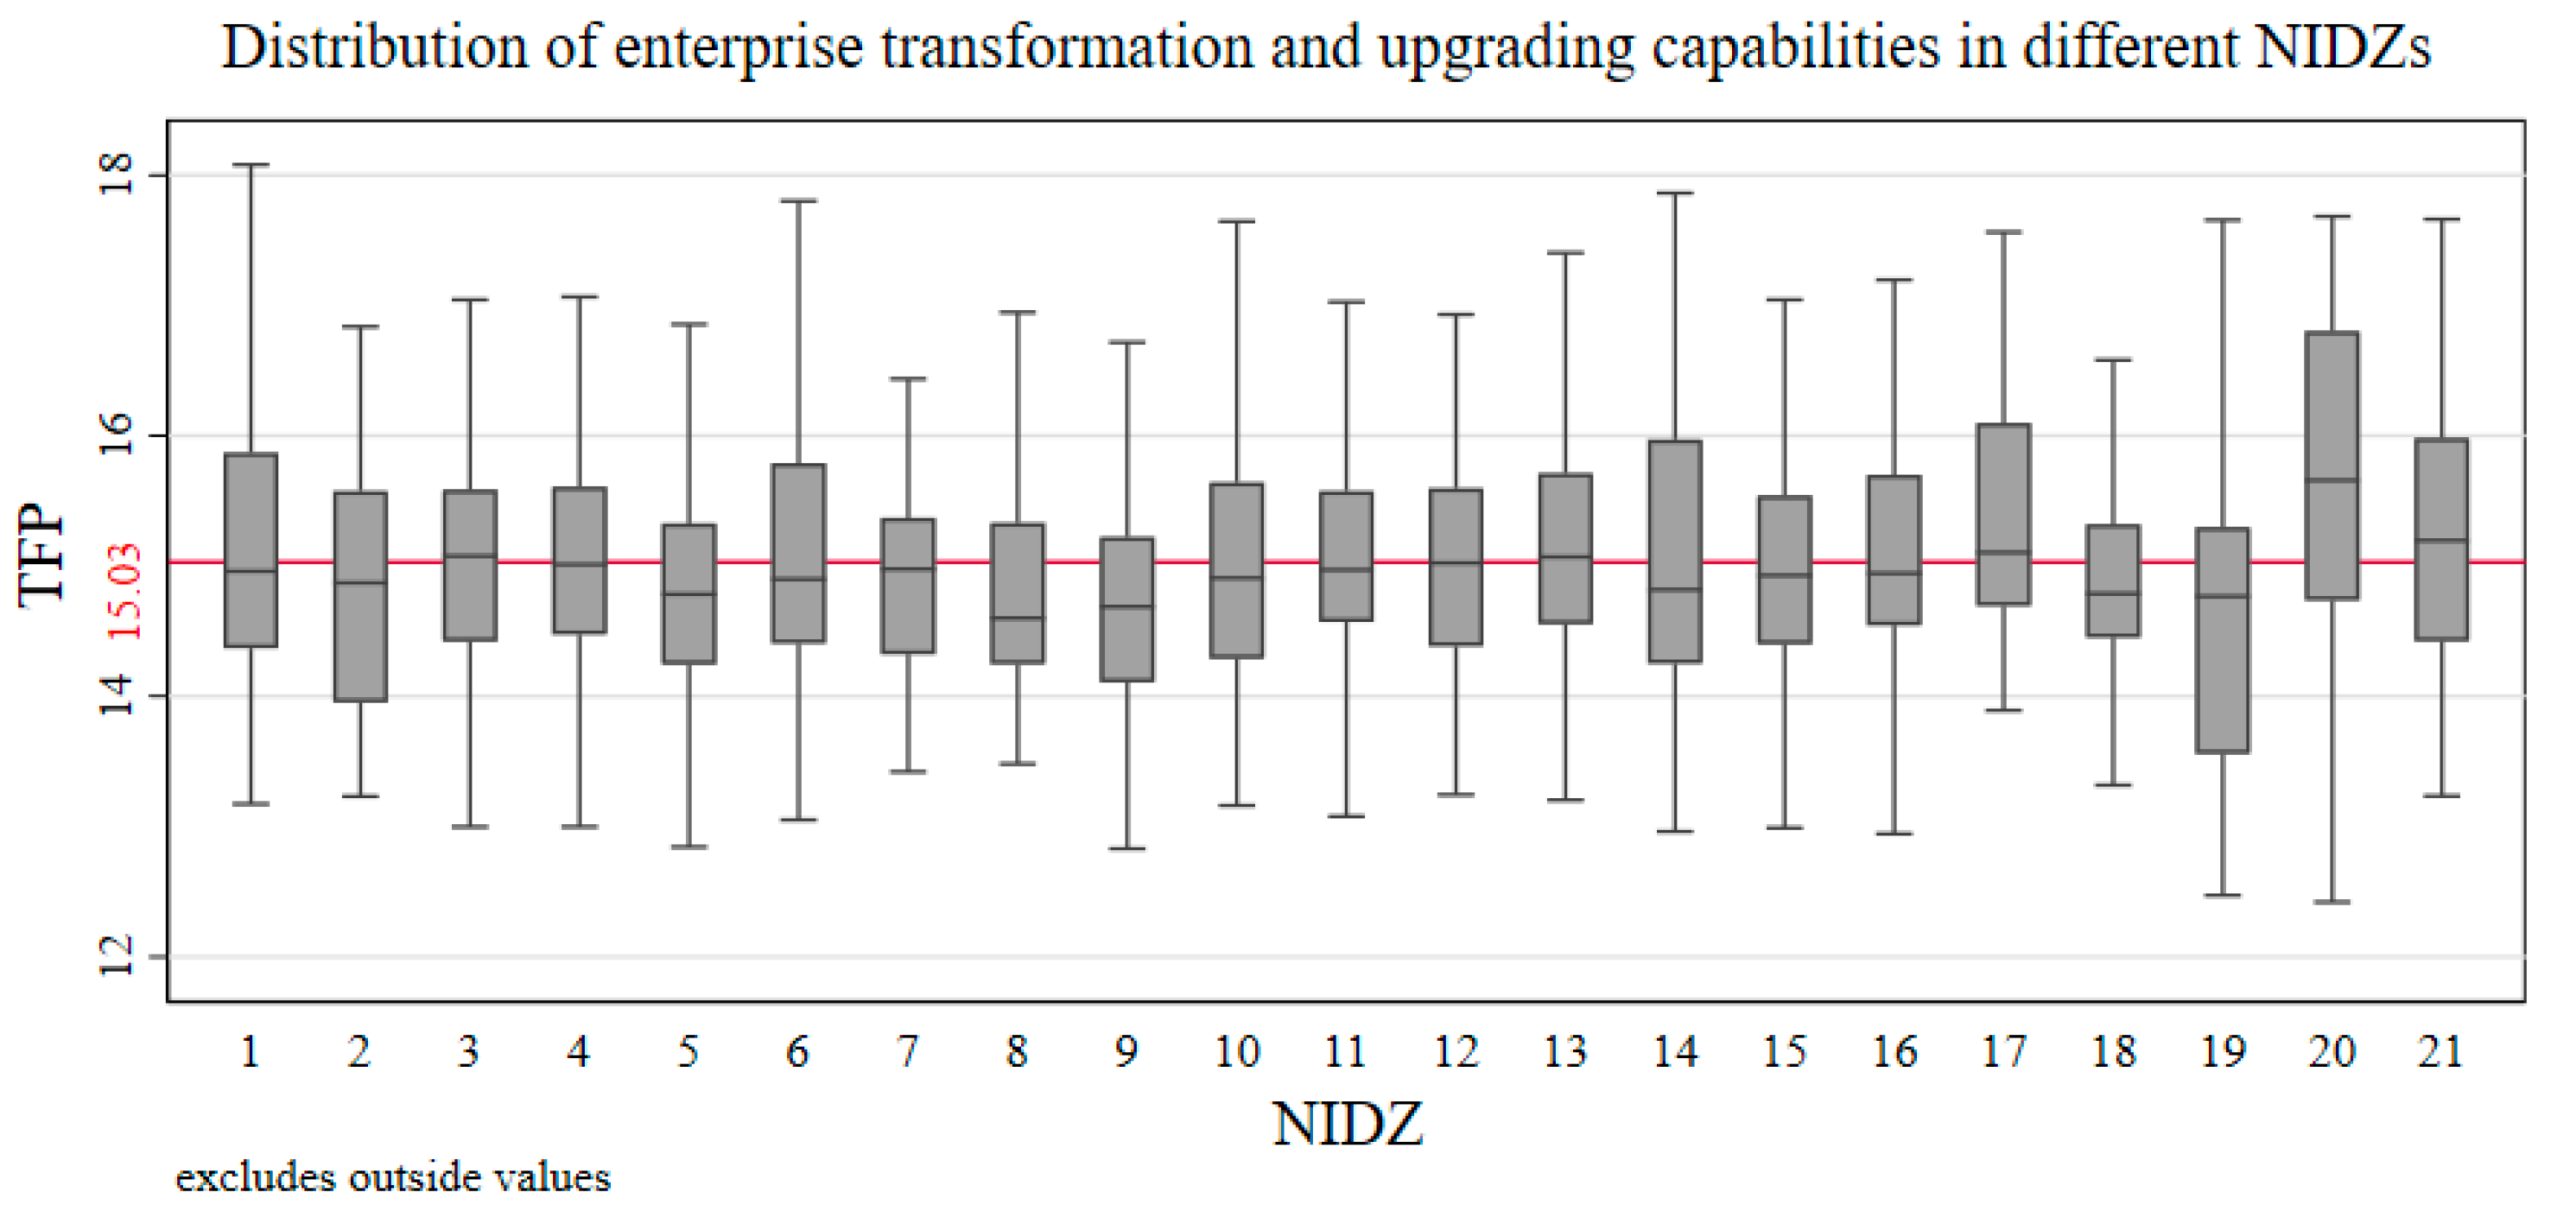
5.1. Analysis of Enterprises’ Transformation and Upgrading Capabilities in National Innovation Demonstration Zones

Figure 2 shows the transformation and upgrading capabilities of the 1770 companies in the A-share manufacturing industry. On the whole, enterprises’ transformation and upgrading capabilities show a good trend, with 45% of them having higher than average capabilities (the average is 15.03). To a certain extent, this shows that most enterprises have fully realized the necessity of carrying out transformation and upgrading, and the improvement of such capabilities has achieved preliminary results at this stage. The reasons are as follows. On the one hand, this is mainly related to China’s strategic layout of high-quality economic development and its leadership in terms of the five new development concepts of “innovation, coordination, green, openness and sharing” in recent years. On the other hand, real enterprises are actively responding to the government’s policy and implementing it in their regular development plans, promoting their transformation and upgrading by taking advantage of the favorable conditions brought about by the policy. There are 43 companies with relatively high transformation and upgrading capabilities. From the perspective of industry characteristics, most of them are resource-processing enterprises, in areas such as ferrous metal smelting, petroleum processing, automobile manufacturing, etc. In recent years, China has attached great importance to the development of the real economy, which has imposed higher requirements in terms of the transformation and upgrading of traditional manufacturing enterprises. Those resource-based enterprises that can respond to the national policy guidance faster and more precisely are likely to be the first to complete the transformation and upgrading. Two examples are SAIC (company code: 600104), which is engaged in the automobile manufacturing industry, and Foxconn (company code: 601138), which belongs to the electronic and telecommunications equipment manufacturing industry. Since its listing in 2018, Foxconn has implemented a dual strategy of “intelligent manufacturing + industrial Internet” and, relying on Shenzhen’s strong industrial Internet innovation system, it is continuing to develop itself from traditional manufacturing to precision manufacturing to intelligent manufacturing and smart factories through digital transformation. Through the deep integration of intelligent technology and production technology, qualitative changes to enterprises’ transformation and upgrading capabilities have been achieved.
In contrast, there are 91 companies with transformation and upgrading capabilities lower than 13.55, the majority of which are engaged in pharmaceutical manufacturing and electronic and telecommunications equipment manufacturing, accounting for 36% of the entire sample. In recent years, the pharmaceutical industry has experienced changes, moving from generic to innovative, and is now in a bottleneck when it comes to enterprises’ transformation and upgrading [33]. Some enterprises engaged in electronic and telecommunications equipment manufacturing are still in the middle and lower reaches of the value chain [34]. Meanwhile, China is still facing bottleneck problems in key core technologies such as semiconductor chips and precision instruments [35], which is hindering the transformation and upgrading capabilities of enterprises. Among the whole sample, Ailes Technology Co., Ltd. (company code: 688578), which is in the biopharmaceutical industry, has the worst performance in transformation and upgrading, at only 7.29. As a new stock listed on the Science and Technology Innovation Board in 2020, Ailes has suffered from losses during the pre-listing inquiry stage. After achieving economic consolidation and recovery, the company’s capability to transform and upgrade is poor.
Figure 2 shows the enterprise transformation and upgrading capabilities within the 21 NIDZs. On the whole, there are obvious differences between the NIDZs. Only seven NIDZs, namely Shang-Hai Zhang-Jiang, Shan-Dong Peninsula, Zheng-Luo-Xin, Chong-Qing, Po-Yang Lake, Wu-Chang-Shi, and Lan-Bai, have median enterprise transformation and upgrading capabilities exceeding the overall average across all the companies in the sample. Among them, Shan-Dong Peninsula and Shang-Hai Zhang-Jiang, two NIDZs located in the eastern coastal area of China, have better performances, with the highest average transformation and upgrading capabilities of 15.16 and 15.11, and with more than 50% of their enterprises exceeding the average transformation and upgrading capability. However, no more than 38% of the enterprises in Xi-an, Wu-Han East Lake, and Cheng-Du NIDZ have transformation and upgrading capabilities higher than the average. Xi’an City is located in Shanxi Province, a relatively developed economy in western China. Although it has relatively strong resources in terms of universities and research institutes, the brain drain caused by geographical constraints is a very serious problem. According to the data released by the Education Department of Shaanxi Provincial Government, less than 25% of the graduates of Xi’an Jiaotong University in 2020 choose to stay in Xi’an after graduation, with most going to developed eastern coastal areas such as Shanghai and Guangdong. From a problem-oriented perspective, the vitality of enterprise transformation and upgrading in the Xi-an NIDZ needs to be further stimulated.
From Figure 3, we can also see that there are significant differences in the degree of clustering of the TFP in each NIDZ. The enterprises’ transformation and upgrading capabilities in the three NIDZs of Tian-Jin, Ning-Wen, and Pearl River Delta fluctuate less, with the interquartile distance lower than 1.02 and the median close to the average value of 15.03, showing a better overall clustering characteristic. The reasons are as follows. On the one hand, these three NIDZs are located in the more economically developed coastal cities, which have a superior geographical location and flexible policy dividends, providing a strong impetus for the enterprises in these NIDZs to carry out transformation and upgrading. On the other hand, the strong local economic infrastructure and abundant resources of universities and research institutes provide strong support for the improvement of enterprises’ transformation and upgrading capabilities in these NIDZs.
The enterprise transformation and upgrading capabilities of three other NIDZs, namely Lan-Bai, Shen-Da, and Wu-Chang-Shi, fluctuate greatly, with interquartile distances of 1.52, 1.57, and 2.01, respectively. There is a large difference between these NIDZs’ median capabilities and the mean value across the sample (15.03), which shows a more scattered characteristic overall. The reasons can be summarized in the following two aspects. On the one hand, two of these NIDZs, Lan-Bai and Wu-Chang-Shi, are located in the western region of China and were approved more recently (2018), and the economic basis for enterprises in these NIDZs to be able to improve their transformation and upgrading capabilities is relatively weak. On the other hand, Table 1 shows that they have the lowest number of enterprises of the sample (14 for Lan-Bai; 17 for Wu-Chang-Shi). Meanwhile, Shen-Da NIDZ is located in the northeast of China, which has long been dominated by heavy industry and has a deep industrial foundation and complex industrial system, making industrial transformation a complex and difficult process.

5.2. Analysis of Factors Influencing Enterprises’ Transformation and Upgrading Capabilities

Using Equations (5) and (7), we have calculated the regression coefficients and elasticity coefficients of each influencing factor, and the results are shown in Table 3. The goodness-of-fit shows that the model fit was good (R2 = 0.1895) and it was able to pass the smoothness test. Overall, the regression coefficients and elasticity coefficients of the multi-factor influence model are small, which indicates that enterprises’ transformation and upgrading capabilities cannot be accurately predicted by a few influencing factors. The IDI index reflects the level of innovation capability and R&D investment both inside and outside the enterprise. Among the internal factors, 33% play a positive role in promoting enterprises’ transformation and upgrading capabilities. However, among the external factors, 68% have a negative impact on such capabilities. The EBO index reflects the internal and external economically beneficial outputs of the enterprises. The results of the study show that 89% and 69% of the internal and external factors show positive effects on enterprises’ transformation and upgrading capabilities, and the regression coefficients of the internal factors are generally higher than those of the external factors. Thus, the promoting effect of the internal factors is more significant. The RHD index reflects quality enhancement and efficiency improvement in the region from the external perspective of enterprises, including the network intelligence, green, and international development of the region, that the strongest factor among these has a regression coefficient of only 0.0455, and that all have relatively small effects. The EBE index reflects the regional social environment, including education level and infrastructure construction, thus external factors to the enterprise. 44% of the EBE indicators make a positive contribution to enterprises’ transformation and upgrading capabilities, but the largest regression coefficient is only 0.0223. It can thus be seen that the EBE indicators have only a relatively small impact on enterprises’ transformation and upgrading capabilities.
Specifically, the main factors that have a significant positive impact on enterprises’ transformation and upgrading capabilities are as follows:
(1)
The amount of enterprise R&D investment, expenditure on new product development, and S&T institutions of industrial enterprises above the designated size (secondary indicators of IDI). Among them, the amount of enterprise R&D investment (one of the internal factors) has the greatest impact on enterprises’ transformation and upgrading capabilities (regression coefficient 0.5894), which indicates that such R&D investment can significantly affect these capabilities. Generally speaking, higher R&D investment provides financial support for manufacturing enterprises to engage in independent R&D. Enterprises prefer to upgrade and transform their existing processes through independent R&D in order to take the lead in completing “process upgrade, product upgrade, function upgrade and industry chain upgrade” and gain a core competitive advantage over the industry’s development. Among the external factors, expenditure on the new product development of industrial enterprises above a designated size has the greatest impact on enterprises’ transformation and upgrading capabilities with an elasticity coefficient of 0.0172. This indicates that for every 1% increase in expenditure on the new product development of industrial enterprises above the designated size, the enterprises’ transformation and upgrading capacity increases by 0.0172%. Enterprises’ new product expenditure includes capital investment in new product design and new technology development, which is usually the main source of enhancements in enterprises’ transformation and upgrading capabilities. Therefore, any increase in expenditure on the new product development of industrial enterprises above the designated size provides development impetus for the improvement of such capabilities.
(2)
Business revenue, operating profit margin, rate of return on common stockholders’ equity, return on assets, and general public budget revenue (secondary indicators of EBO). The internal factors of return on assets, return on equity, and operating profit margin are three indicators used to reflect enterprises’ profitability. Among them, the operating profit margin has the greatest impact on enterprises’ transformation and upgrading capabilities (the regression coefficient is 0.7398), and every 1% increase in an enterprise’s return on equity increases its transformation and upgrading capabilities by 0.1758%. Good profitability for an enterprise means continuous cash flow growth, which is an important source of finance for various expenditures needed in the process of transformation and upgrading. Companies with a good return on equity will thus be better able to transform and upgrade their businesses. Among the external factors, for every 1% increase in local general public budget revenue, the regional enterprises’ transformation and upgrading capabilities will increase by 0.0022%. Higher local general public budget revenue means a social environment where development is more modern and people’s livelihood needs are fully protected. These regions are more dynamic in terms of business development, which is conducive to local enterprises’ transformation and upgrading.
(3)
E-commerce sales, green covered area as % of completed area, and the number of parks (secondary indicators of RHD). Among these, regional E-commerce sales have the greatest degree of influence on enterprises’ transformation and upgrading capabilities (regression coefficient 0.0455). On the one hand, an increase of E-commerce sales promotes the widespread application of the Internet in business. On the other hand, the E-commerce platform provides enterprises with a broad space for online marketing and promotion, which is conducive to promoting their intelligent transformation. In addition, for every 1% increase in the green covered area as % of completed area, enterprises’ transformation and upgrading capabilities will increase by 0.0168%, because in areas with an excellent environment and a high level of greening, local enterprises are also likely to be more aware of green innovation in their transformation and upgrading process, which is conducive to long-term sustainable development.
(4)
Construction area of S&T museums, the number of secondary vocational schools, and the number of students enrolled in secondary vocational schools (secondary indicators of EBE). Among all the external factors in the EBE category, the construction area of S&T museums has the greatest impact on enterprises’ transformation and upgrading capabilities (regression coefficient 0.0223). Meanwhile, for every 1% increase in the number of regional secondary vocational schools and the number of students enrolled in them, enterprises’ transformation and upgrading capabilities increase by 0.0132% and 0.0.0061%, respectively. This is due to an increase in high-quality young innovative talent for local enterprises.
The factors that have a significant negative impact on enterprises’ transformation and upgrading capabilities are as follows:
(1)
The number of national university science parks, the number of mass maker spaces, and projects for the new product development of industrial enterprises above the designated size (secondary indicators of IDI). The three factors mentioned above are all external indicators. For every 1% increase in the number of national university science parks and mass maker spaces, local companies’ enterprise transformation and upgrading capabilities decrease by 0.0006% and 0.0208%, respectively. This is mainly due to the fact that, compared with local enterprises, national university science parks and mass maker spaces will enjoy preferential government subsidies and preferential policies, which reduces the policy and financial support for enterprise transformation. This reduces the inflow of innovation resources from the “supply” side of transformation and upgrading, somewhat reducing enterprises’ capabilities.
(2)
Sales revenue of new products of industrial enterprises above the designated size (secondary indicator of EBO). In the secondary indicators of economically beneficial output, it is mainly external factors that have a negative impact on enterprises’ transformation and upgrading capabilities. For every 1% increase in such sales revenue, enterprises’ transformation and upgrading capability will decrease by 0.0309%. If an enterprise spends too much on the design, production, and sales of new products, instead of promoting transformation and upgrading according to its business and operational characteristics, it will cause a lot of waste, which is not conducive to good transformation and upgrading capabilities.
(3)
Websites per 100 enterprises, the amount of informatization and E-commerce of enterprises, value-added by tertiary industry, and income from software-related businesses (secondary indicators of RHD). With 1% more websites per 100 enterprises and informatization and E-commerce of enterprises in the region, enterprises’ transformation and upgrading capabilities fall by 0.0116% and 0.0068%, respectively. This is probably because, in the initial stages of transformation, putting a lot of capital investment into intelligent transformation may mean enterprises are ignoring the key issues of transformation and upgrading. Accumulating high costs is not conducive to such capabilities. Income from software-related businesses has a regression coefficient of −0.0462 (significant). The software business belongs to the tertiary industry. The results show that the tertiary industry also has a negative impact on the ability of enterprises to transform and upgrade. For every 1% increase in the value-added by tertiary industry, enterprises’ transformation and upgrading capabilities decrease by 0.0046%. Emerging industries such as new energy, energy conservation, environmental protection, electric vehicles, new materials, new medicines, and software development are all tertiary industries, providing enterprises with a direction for transformation and upgrading. However, if some enterprises flock to these emerging industries without thinking, although the tertiary industry’s value-added is increased, in the long run, this is not conducive to the economic growth of enterprises, and will also undermine healthy competition in the industrial chain.
(4)
The number of S&T museums and the number of public libraries (secondary indicators of EBE). Compared with the three other categories, EBE indicators have less of an overall impact on enterprises’ transformation and upgrading capabilities in NIDZs. The number of S&T museums and the number of public libraries affect such capabilities to the greatest extent, with regression coefficients of 0.026 and 0.018, respectively. For every 1% increase in the number of S&T museums and public libraries, enterprises’ transformation and upgrading capabilities decrease by 0.0222% and 0.0134%, respectively. We speculate that a large increase in the number of S&T museums and public libraries in the short term will incur a lot of capital and labor costs, which will slow down enterprises’ transformation and upgrading in a certain sense.
We also find that the five external factors of IDI, namely R&D expenditure input intensity, the number of patent applications, the number of patents granted, the number of R&D institutions in industrial enterprises above a designated size, and the number of R&D institutions, have no significant impact on enterprises’ transformation and upgrading capabilities in NIDZ. This result is inconsistent with our inferences from the perspective of market logic. We speculate that there are two main reasons for it. On the one hand, it may be related to the time-lagged, indirect, and long-term effects of R&D investment on the economic growth of enterprises. The current external innovation investment will not be immediately reflected in enterprises’ transformation and upgrading capabilities. On the other hand, an imperfect transformation mechanism of scientific and technological achievements could also play a role.

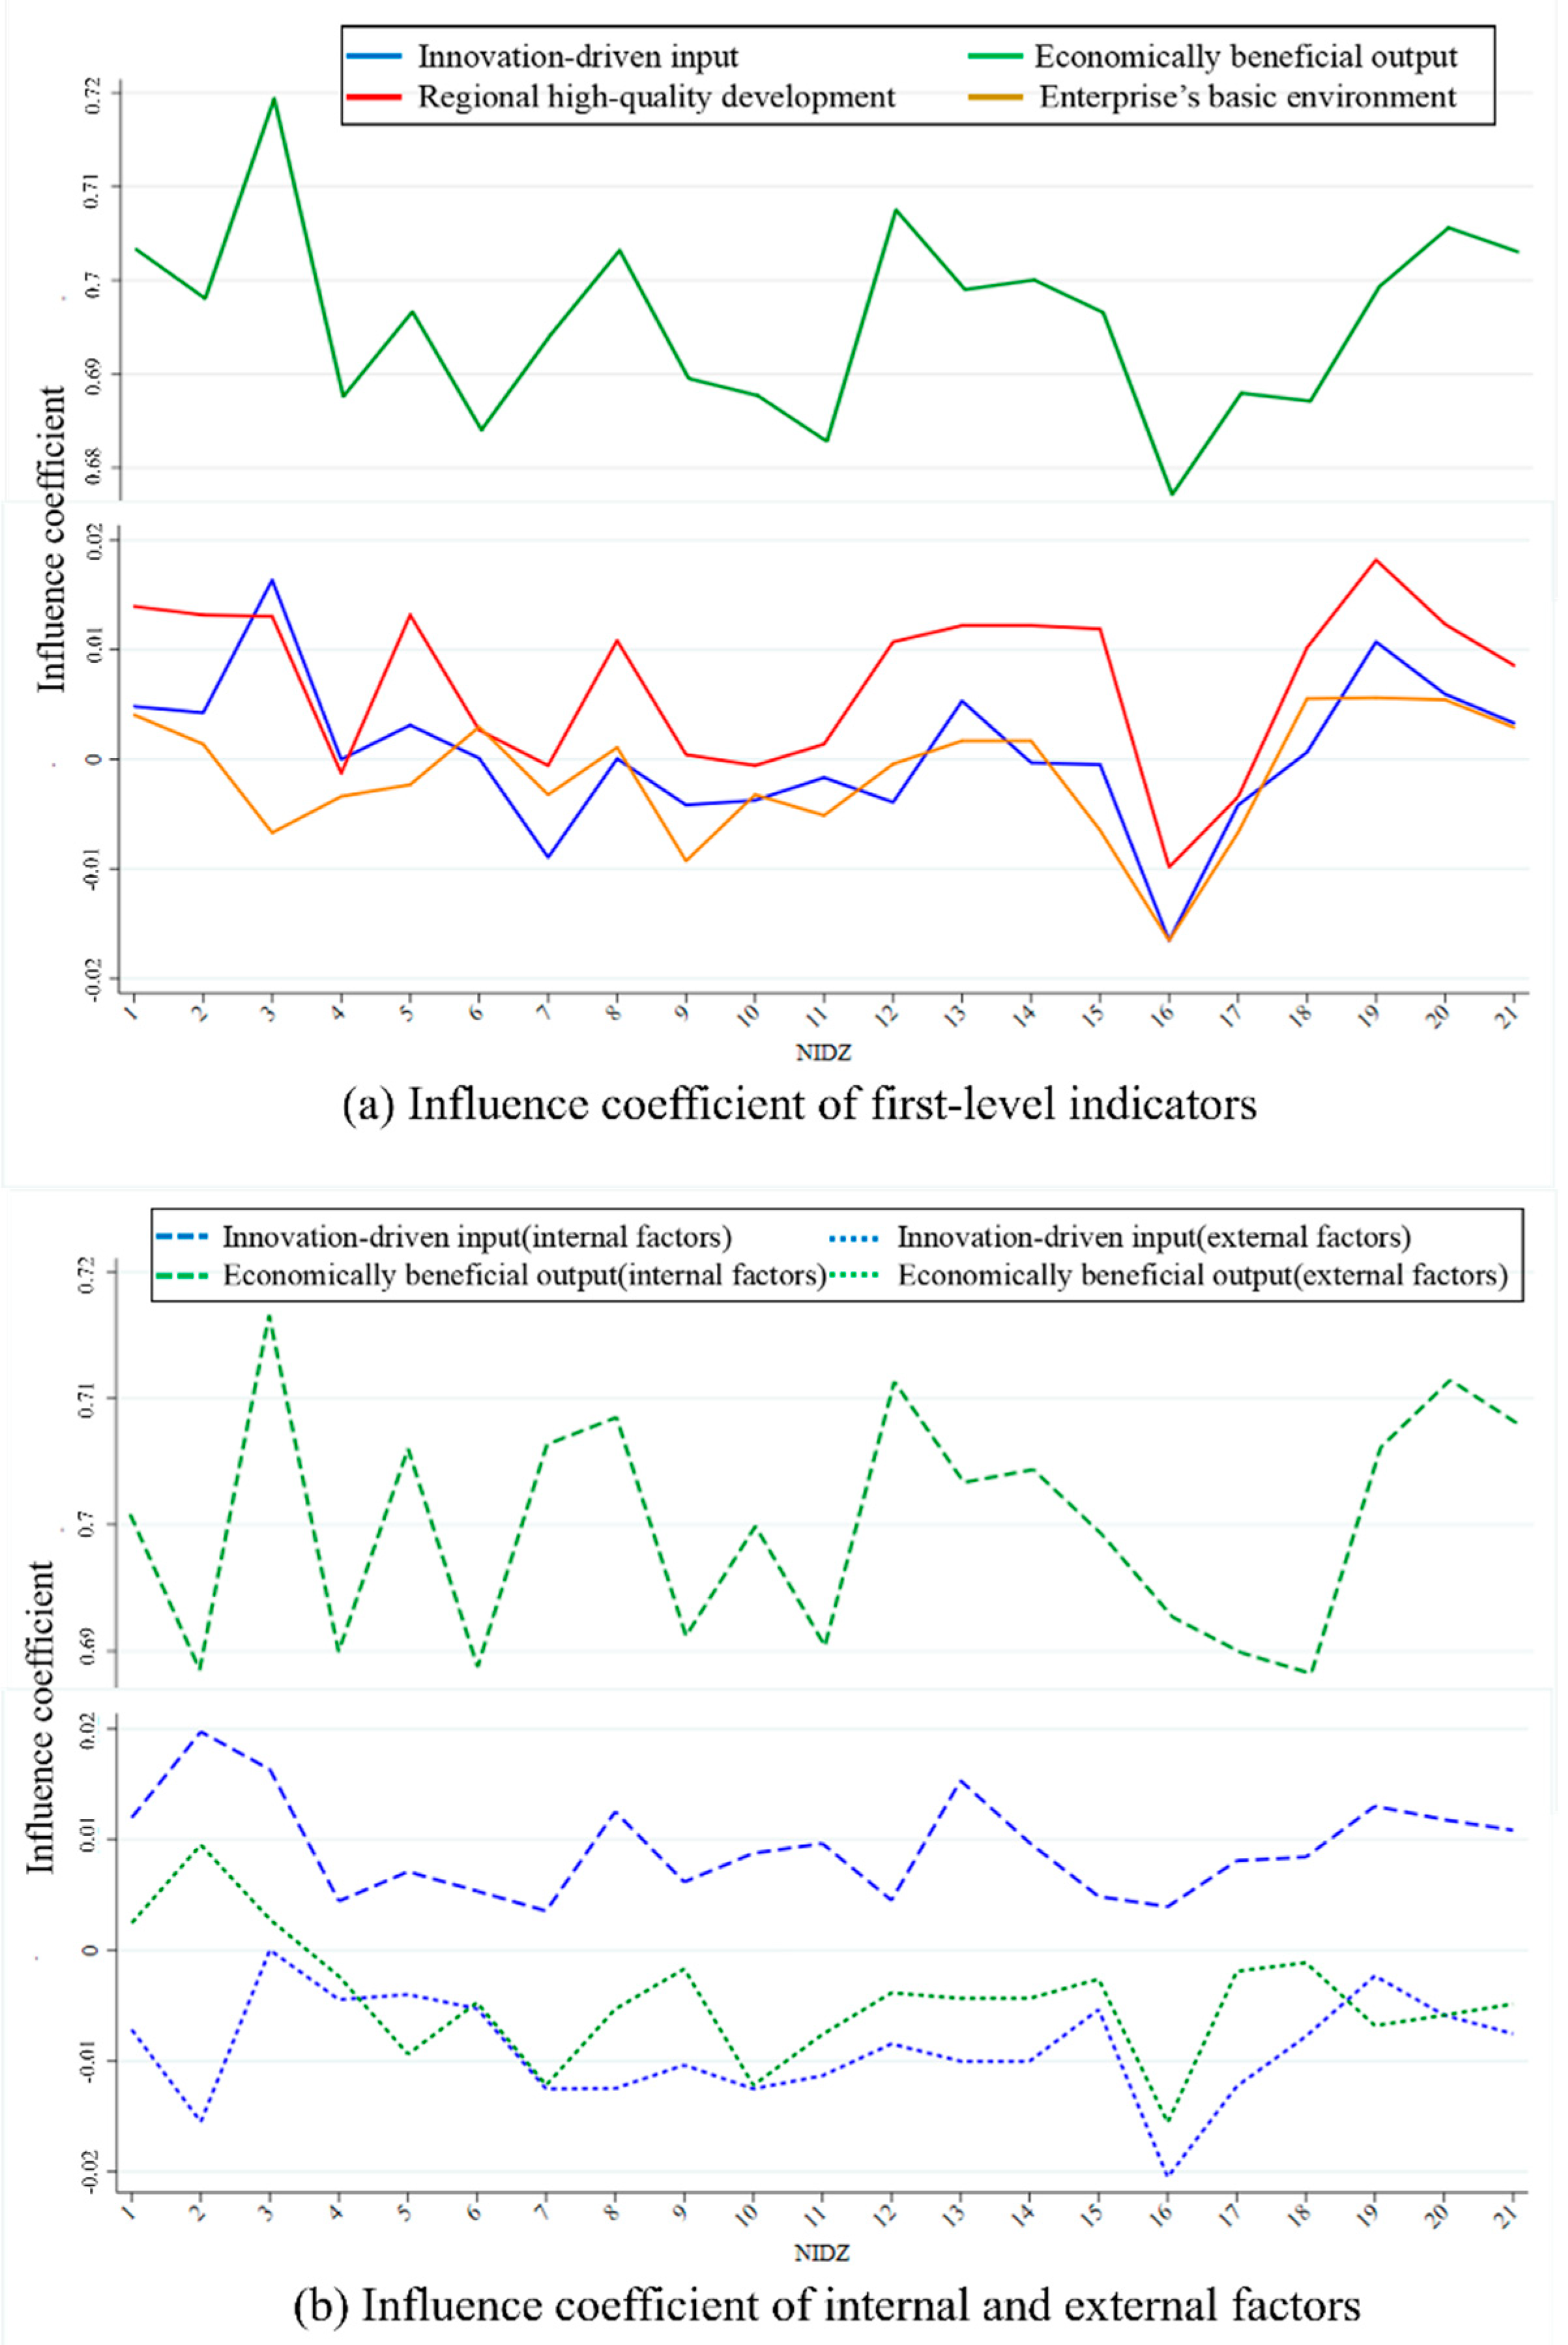
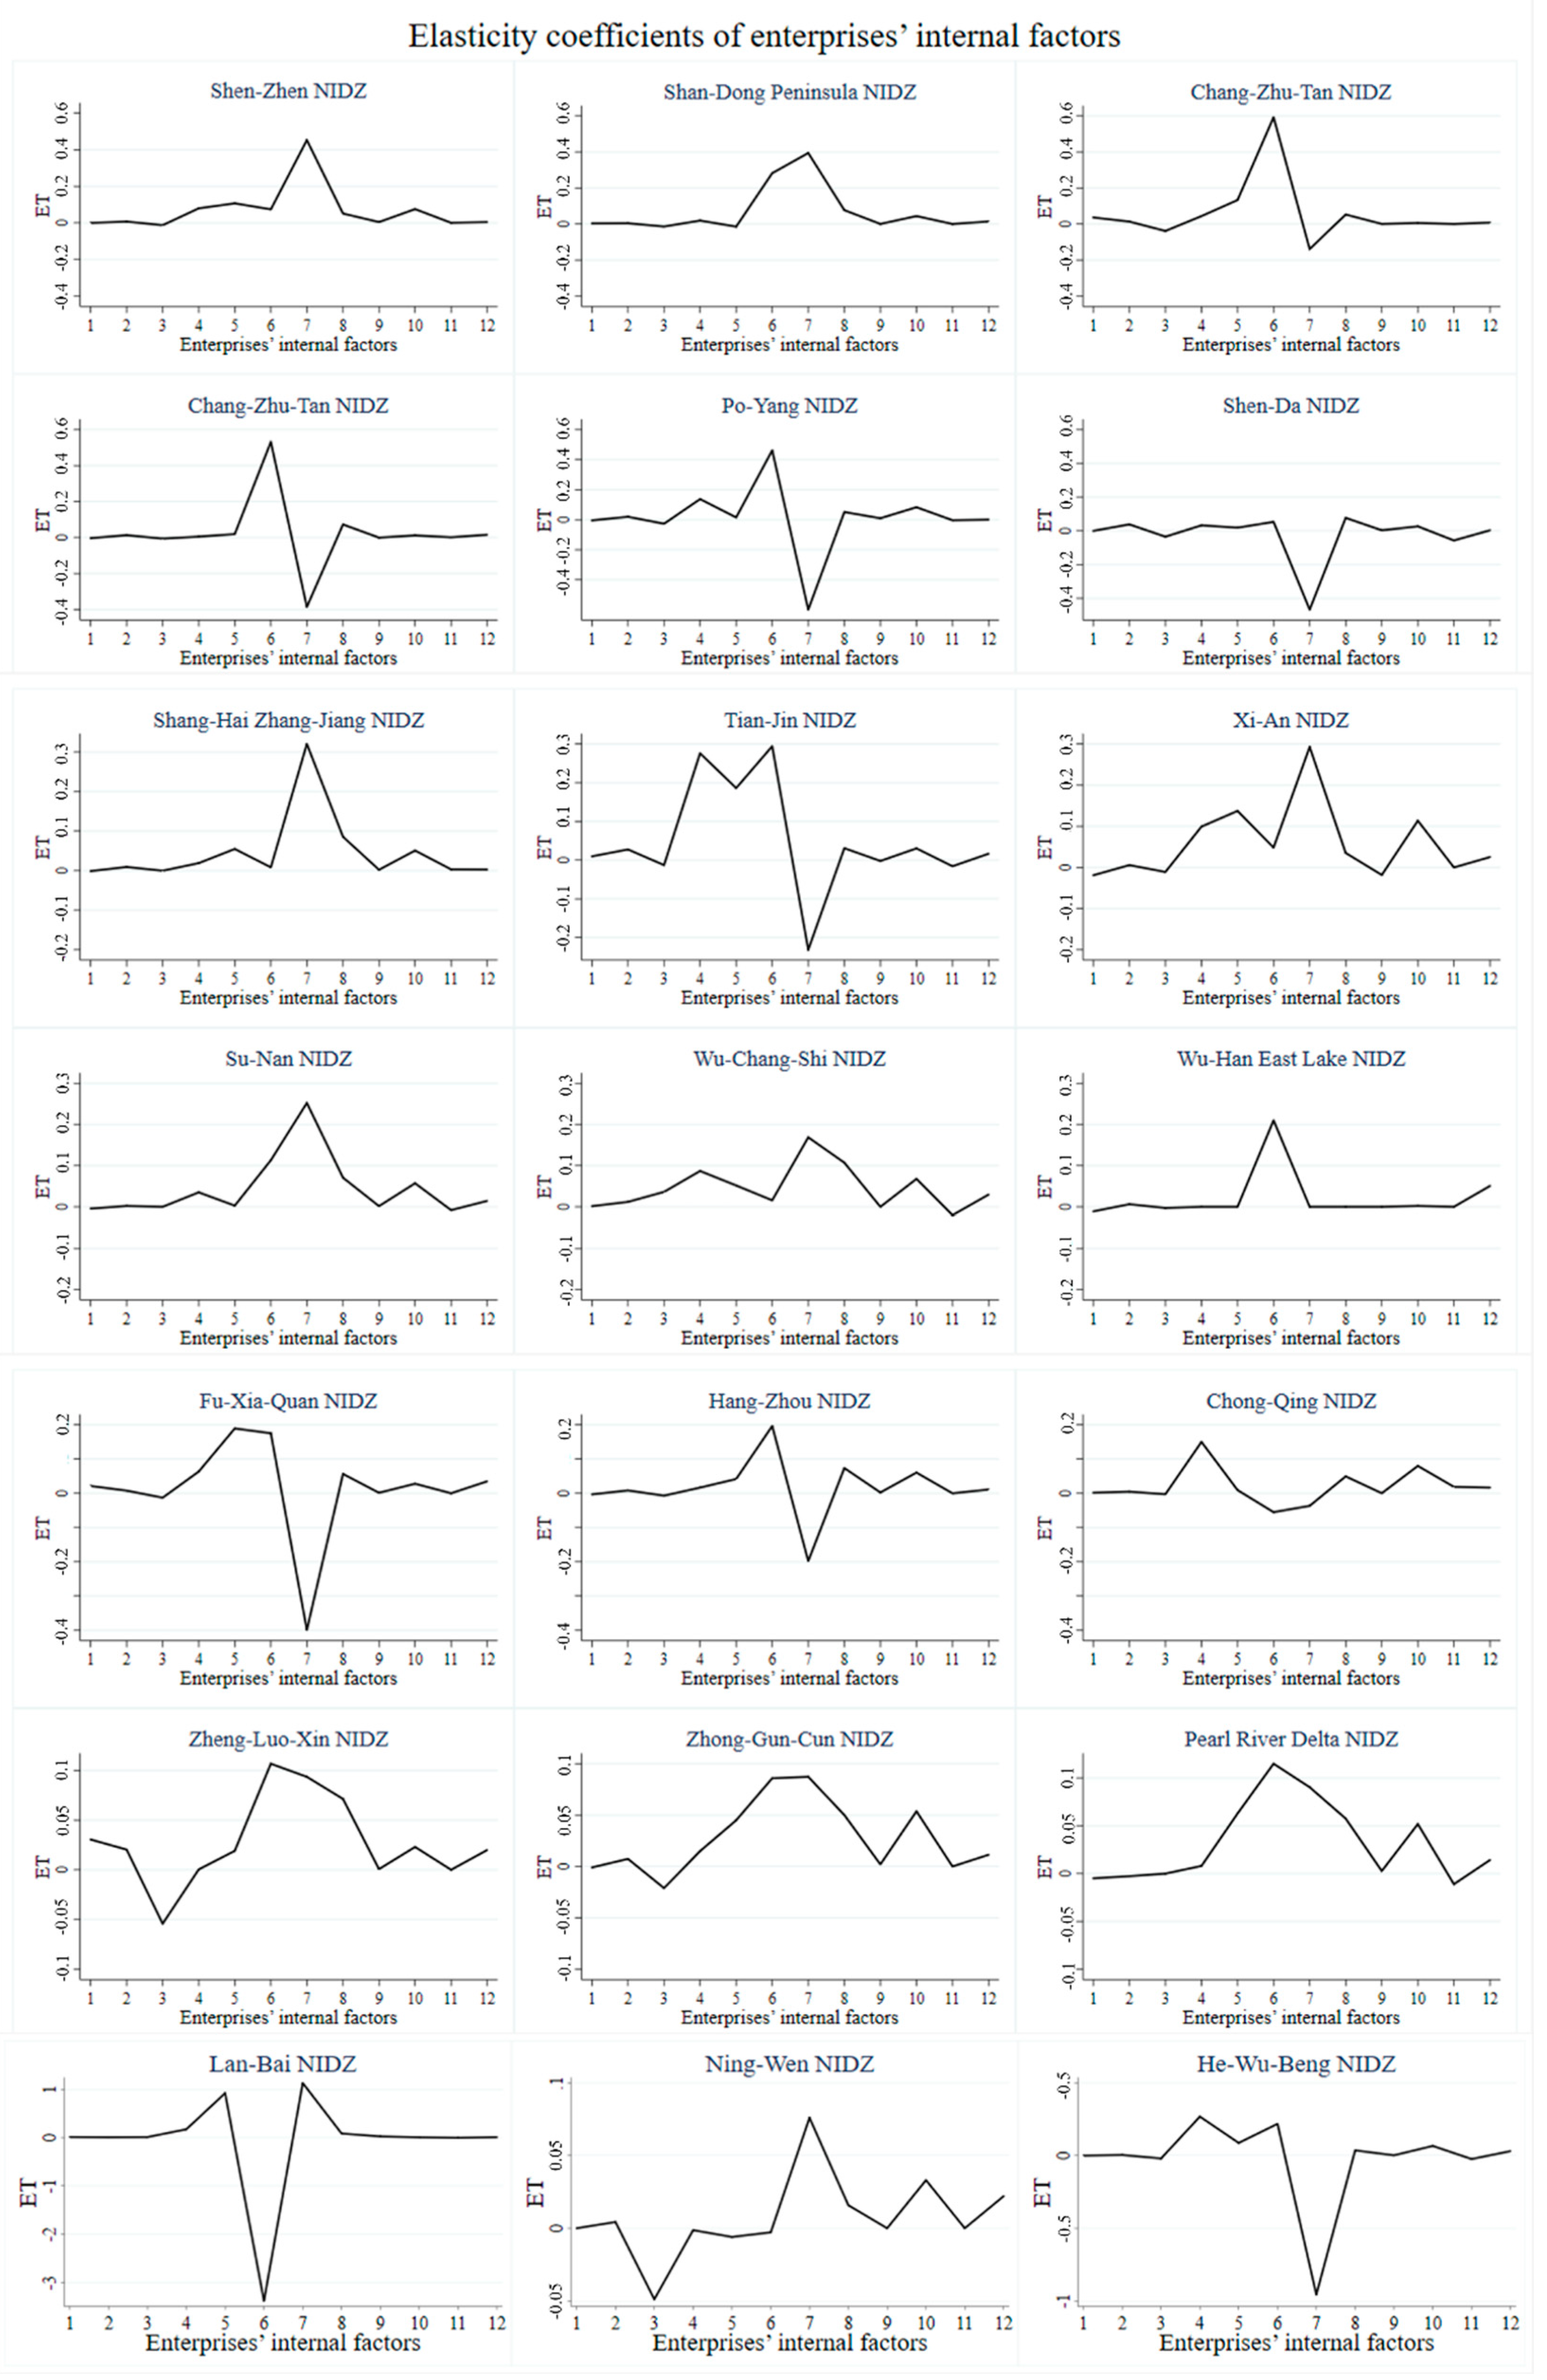
5.3. Analysis of Factors Influencing Enterprises’ Transformation and Upgrading Capabilities in the Different National Innovation Demonstration Zones

Formula (6) can be used to calculate the degree of influence of the four first-level indicators of IDI, EBO, RHD, and EBE, as well as the internal and external factors of IDI and EBO, on enterprises’ transformation and upgrading capabilities in each NIDZ. The results are shown in Figure 4. On the whole, EBO has a relatively large impact on these capabilities, while the impacts of IDI, RHD, and EBE are relatively small. Overall, the internal factors of EBO and IDI are the key factors.
It can be seen from Figure 4a that EBO has the greatest impact on enterprises’ transformation and upgrading capabilities in several of the NIDZs, and the differences in the degrees of impact are relatively significant. Specifically, EBO has a greater positive impact on these capabilities in six NIDZs: Wu-Chang-Shi, Shen-Da, Chong-Qing, Shang-Hai Zhang-Jiang, SD Peninsula, and Chang-Zhu-Tan. Among these, EBO has the greatest positive impact in Wu-Chang-Shi and Shen-Da NIDZ (regression coefficients 0.3597 and 0.3538, respectively). Wu-Chang-Shi NIDZ is located in the “Core Area of the Silk Road Economic Belt”, an excellent geographical location. In addition, the policies proposed in recent years, such as the “Outline of the Development Plan of Wu-Chang-Shi NIDZ (2021–2025)”, have greatly improved the development of enterprises in this NIDZ. Located in the northeast of China, where heavy industry is dominant, the Shen-Da NIDZ has played a leading role in the policy of enterprise transformation and upgrading in the NIDZs, relying on the major opportunities of the northeast region to accelerate the transformation of traditional “old industrial bases” in recent years. On the contrary, EBO has relatively little impact on enterprises’ transformation and upgrading capabilities in Su-Nan NIDZ, Wu-Han East Lake NIDZ, and Tian-Jin NIDZ. For example, the average enterprise operating income in these three NIDZs is relatively low, 60%, 41%, and 52% lower than the overall average, ranking them in the bottom 6 of all the NIDZs.
In contrast, the impacts of IDI, RHD, and EBE on enterprises’ transformation and upgrading capabilities in each of the NIDZs are smaller, and even negative, in some NIDZs, such as Lan-Bai, Ning-Wen, and Su-Nan. Among these, Lan-Bai and Ning-Wen have relatively low numbers of regular higher education institutions and health care institutions. Specifically, the number of regular higher education institutions and the number of health care institutions in the Lan-bai NIDZ are 60% and 13% lower than the overall average, and the number of regular higher education institutions and the number of health care institutions in the Ning-Wen NIDZ are 35% and 14% lower than the overall average values, which indicates to a certain extent that the basic environments in these regions are relatively weak and not conducive to the improvement of enterprises’ transformation and upgrading capabilities. EBE has a negative impact on Wu-Chang-Shi NIDZ. Therefore, if we continue to increase investment in the construction of the infrastructure environment there, not only will it not be conducive to the improvement of enterprises’ transformation and upgrading capabilities, it will also cause some waste of resources. IDI, RHD, and EBE also have a negative impact on enterprises’ transformation and upgrading capabilities in the Su-Nan NIDZ. To find out its cause, those NIDZs’ average values of the proportion of corporate R&D personnel and the amount of enterprise R&D investment is ranked low, ranking 13th and 20th, respectively.
It can be seen from Figure 4b that the internal IDI and EBO factors are key in affecting enterprises’ transformation and upgrading capabilities. On the whole, they have a significantly positive impact in each NIDZ, with the EBO internal factors having the greater impact (coefficients all greater than 0.68). Specifically, the internal factors of enterprises have a greater impact in Shan-Dong Peninsula and Shen-Zhen, which are both in the top 7 NIDZs in terms of the amount of R&D investment (with 1.20 and 1.48 times the overall average) and business revenue (1.38 and 1.15 times the overall average). Since the concept of “high-quality economic development” was introduced, the Shan-Dong Peninsula NIDZ has made large economic adjustments to solve the problem of new and old kinetic energy conversion. This adjustment has, to a certain extent, stimulated enterprises’ transformation and upgrading in this NIDZ, with a large number of technology-based enterprises emerging. Good IDI and EBO within the enterprises are significant for the transformation and upgrading of emerging enterprises in this NIDZ at this stage. However, factors external to the enterprises have a significantly negative impact on their transformation and upgrading capabilities in each NIDZ. Among these, the EBO external factors have a significantly negative impact on 85.71% of the NIDZs, and the IDI external factors have a significantly negative impact on 95.24% of the NIDZs. The reasons are that, on the one hand, most of the enterprises carry out transformation and upgrading based on their own development needs and through active adjustments. Thus, external factors have some effect on enterprises’ transformation and upgrading, but not a strong one. On the other hand, the influence of macro-level external factors on enterprises’ transformation and upgrading is mostly indirect, which will cause the accumulation of many intermediate costs.
Figure 5 shows the degree of influence of the enterprises’ internal EBO and IDI factors on their transformation and upgrading capabilities in each NIDZ. We find that, compared to the other factors, enterprises’ operating income, operating profit margin, return on equity, asset-liability ratio, and profit rate of total assets have more significant effects on their transformation and upgrading capabilities in the NIDZs. The proportion of corporate R&D personnel has a significantly positive impact on enterprises’ transformation and upgrading capabilities in 10 out of 21 of the NIDZs; the operating profit margin has a significantly positive impact on such capabilities in 12 out of 21 of the NIDZs; return on equity has a significantly positive impact in 19 out of 21 of the NIDZs. Compared with the internal IDI factors, the internal EBO factors have a greater impact. The operating profit margin’s degree of influence is relatively significant in 11 NIDZs, including Shen-Zhen, Shan-Dong Peninsula, Shang-Hai Zhang-Jiang, Xi-An, and Su-Nan (with positive elasticity coefficients). However, it inhibits enterprises’ transformation and upgrading capabilities in eight NIDZs, namely Chang-Zhu-Tan, Cheng-Du, Po-Yang Lake, Shen-Da, Tian-Jin, Fu-Xia-Quan, Hang-Zhou, and He-Wu-Beng (the elasticity coefficient is negative). Some other indicators, such as the profit rate of total assets and the asset-liability ratio, also have a significant role in promoting these capabilities in some of the NIDZs. For example, for every 1% increase in the profit rate of total assets, enterprise transformation and upgrading capacity in Fu-Xia-Quan, Lan-Bai, Tian-Jin, and Xi-An will increase by at least 0.15%, and for each 1% increase in the asset-liability ratio, such capacity in Chong-Qing and Wu-Chang-Shi will increase by at least 0.08%.
There are significant differences between the NIDZs in terms of the impacts of enterprises’ internal BEO and IDI factors on enterprises’ transformation and upgrading capabilities. For example, the internal IDI factors have a greater impact on enterprises’ transformation and upgrading capabilities in Zhong-Gun-Cun, Shen-Zhen, and Wu-Chang-Shi, while enterprises in the three NIDZs of Lan-Bai, Su-Nan, and Ning-Wen are relatively less affected by such factors. Zhong-Gun-Cun, Shen-Zhen, and Wu-Chang-Shi NIDZs have higher amounts of enterprise R&D investment, their average amount being 1.29 times the overall average across all the NIDZs, while the average in Lan-Bai, Su-Nan, an and Ning-Wen is only 0.46 times the overall average. The internal EBO factors have a relatively large impact on enterprises’ transformation and upgrading capabilities in the Wu-Chang-Shi, Shen-Da, and Chong-Qing NIDZs, while the impacts in Zhong-Gun-Cun, Wu-Han East Lake, and Lan-Bai are relatively small. When we study the raw data, we find that the EBO levels of enterprises in Wu-Chang-Shi, Shen-Da, and Chong-Qing are relatively high, with the average values for total asset turnover and accounts receivable turnover putting them in the top 10 of all NIDZs, while the average return on assets in Zhong-Gun-Cun, Wu-Han East Lake, and Lan-Bai is lower than the overall average value (which is 6.08%).

6. Conclusions

This paper selects 88 influencing factors affecting enterprises’ transformation and upgrading capabilities in NIDZs, including 22 secondary indicators of IDI, 22 secondary indicators of EBO, 26 secondary indicators of RHD, and 18 secondary indicators of EBE. Based on this, a multi-factor influence model is constructed to quantitatively analyze the degree of influence of each factor on enterprises’ transformation and upgrading capabilities. Further, by measuring the elasticity coefficients of each influencing factor with respect to those capabilities, we analyze the degree of influence of each factor on those capabilities in the individual NIDZs and look at the differences between them. This paper draws a series of valuable conclusions, as follows:
On the whole, enterprises’ transformation and upgrading capabilities in NIDZs show an improving trend, with 45% of enterprises having higher capabilities than average (the average being 15.03). Most of the enterprises with relatively high transformation and upgrading capabilities are resource-processing manufacturing enterprises, while those engaged in the pharmaceutical manufacturing industry and the electronic and telecommunications equipment manufacturing industry have relatively weaker capabilities. There are obvious differences in the degree of clustering of these capabilities, and seven NIDZs, namely Shang-Hai Zhang-Jiang, Shan-Dong Peninsula, Zheng-Luo-Xin, Chong-Qing, Po-Yang Lake, Wu-Chang-Shi, and Lan-Bai, have relatively better capabilities. The capabilities of enterprises in Tian-Jin, Ning-Wen, and Pearl River Delta fluctuate less and show better clustering overall, while those of enterprises in Lan-Bai, Shen-da, and Wu-Chang-Shi fluctuate more and show a more dispersed characteristic.
A total of 33% of the internal IDI factors have a positive influence on enterprises’ transformation and upgrading capabilities, as do 89% of the internal EBO factors. Indicators with a significantly positive impact on enterprises’ transformation and upgrading capabilities mainly include the amount of enterprise R&D investment, expenditure on new product development, and expenditure on the S&T institutions of industrial enterprises above a designated size (IDI); business revenue, operating income, operating profit margin, return on equity, return on assets, and general public budget revenue (EBO); E-commerce sales, green covered area as % of completed area, and the number of parks (RHD); and the construction area of S&T museums, the number of secondary vocational schools and the number of students enrolled in general senior secondary schools (EBE). The indicators with a significantly negative impact on enterprises’ transformation and upgrading capabilities are the number of national university science parks, the number of mass maker spaces, and projects for the new product development of industrial enterprises above a designated size (IDI); the sales revenue of new products of industrial enterprises above a designated size (EBO); the number of websites per 100 enterprises and the amount of informatization and E-commerce of enterprises (RHD); and the number of S&T museums and the number of public libraries (EBE).
The degree of Influence of EBO on enterprises’ transformation and upgrading capabilities is relatively large, while those of IDI, RHD, and EBE are relatively small. The internal EBO and IDI factors are the key factors affecting enterprises’ transformation and upgrading capabilities. Compared with other factors, enterprise business revenue, operating profit margin, return on equity, and return on assets have more significant impacts and are the most important internal factors. The internal IDI factors have a greater impact in Zhong-Gun-Cun NIDZ, Shen-Zhen NIDZ, and Wu-Chang-Shi NIDZ, while the three NIDZs of Lan-Bai, Su-Nan, and Ning-Wen are relatively less influenced by such factors. Internal EBO factors have a relatively large impact in the Wu-Chang-Shi, Shen-Da, and Chong-Qing NIDZs, while they have a relatively small impact in Zhong-Gun-Cun, Wu-Han East Lake, and Lan-Bai.
Based on the above conclusions, to further promote enterprises’ transformation and upgrading capabilities in NIDZs and optimize resource allocation so as to boost sustainable economic development, this paper makes the following policy recommendations:
(1)
Improve the supportive policy system for enterprises’ transformation and upgrading at the national level and accelerate the layouts of differentiated industrial chains in NIDZs. The NIDZs represent the highland for promoting regional technological innovation and accelerating the flow of innovation resources in China, but the results show that there is a problem in terms of large differences in the development of enterprises’ transformation and upgrading capabilities in different NIDZs. On the one hand, NIDZs should make full use of innovation platforms such as universities and research institutes to smooth the flow of innovation resources between enterprises and the outside world, in order to form a long-term synergistic cooperation mechanism. On the other hand, enterprises should seize the major opportunity of regional differentiation and transformation and clarify the key development industries and the division of labor in the industrial chain in NIDZs, so as to achieve the goal of value chain climbing.
(2)
Invest innovation funds to tackle technical problems and improve the efficiency of innovation resource allocation. We have found that the internal IDI and EBO factors can significantly promote the improvement of enterprises’ transformation and upgrading capabilities, especially the internal EBO factors. Enterprises are the main implementers of innovation activities in NIDZs and the key to continuously improving the efficiency of innovation resource allocation. On the one hand, enterprises can reduce the waste of resources by improving the innovative capital investment mechanism and increasing special capital investment in basic research and key core technology fields, so as to achieve the goal of optimizing resource allocation. On the other hand, enterprises can attract outstanding talent at home and abroad through preferential conditions such as bonuses and resettlement allowances. Based on their actual development and future strategic directions, they can build a team to tackle technical problems, solve the technical problems that restrict their transformation and upgrading, and accelerate the breakthrough of core technologies.
(3)
Optimize the soft environment of the innovation ecosystem in the NIDZs, so as to promote high-quality enterprise transformation and upgrading. The soft environment of the innovation ecosystem refers to the innovation policy, service ecology, and innovation culture in the location of the NIDZs. Cultivating a good soft environment of the innovation ecosystem is very important for NIDZs’ innovation development. On the one hand, NIDZs should actively promote the construction of an open innovation environment. In line with the construction standards of foreign high-tech industrial parks, the NIDZs should continuously strengthen the awareness of open innovation and promote their innovation capabilities and independent R&D capabilities. On the other hand, NIDZs should actively cultivate a cultural atmosphere that stimulates innovation vitality and promotes the efficient allocation of innovation resources. The soft environment of an open, innovative, and collaborative innovation ecosystem for enterprises will promote the NIDZs’ high-quality transformation and upgrading.
The research contribution of this paper lies in that on the one hand, we focus on the enterprises in NIDZs, clarify the differences between enterprises’ transformation and upgrading capabilities in different NIDZs, and find the key factors that affect such capabilities in NIDZs, so as to provide inspiration for the technical and management problems faced by the transformation of the NIDZs and provide strategic guidance for the transformation of enterprises. On the other hand, differently from previous work, we have established a more complete evaluation index system, and then quantified the impact of the factors on enterprises’ transformation and upgrading capabilities through the construction of a multi-factor impact model. This research method also provides a reference for the research on influencing factors of related topics in other fields and has broad application scenarios.
At the same time, this paper also has some limitations. (1) Limited by sample size and data, this paper only examines the situation of A-share manufacturing listed companies, which is a comprehensive evaluation of the transformation and upgrading of manufacturing enterprises in the NIDZs. (2) This paper matches the registered address of enterprises with the NIDZs, but there is a deviation between the registered address of some enterprises and the actual operation place. Therefore, in view of the above shortcomings, our future work can be carried out from the following two aspects: (1) In the future, we can consider expanding the sample to the empirical research results of listed enterprises on the GEM and SME boards, so that our research conclusions can be verified in a wider range. (2) Due to the insufficient information disclosure of relevant enterprises, this paper only considers the situation that the registered place is the same as the actual place of operation. This situation can be clarified in the future to get richer research conclusions.

Author Contributions

Z.M. conceived the research project, interpreted the results, and wrote the article. X.F. performed technical work, interpreted the results, helped write the article. Y.Z. conceived the research project, interpreted the results. B.H. helped with the technical work, interpreted the results. All authors have read and agreed to the published version of the manuscript.

Funding

This research is funded by the program of the National Social Science Foundation of China, grant number: 21AGL035.

Institutional Review Board Statement

Not applicable.

Informed Consent Statement

Not applicable.

Data Availability Statement

The datasets used and analyzed during the current study are available from the corresponding author on reasonable request.

Conflicts of Interest

The authors declare no conflict of interest.

References

  1. Cevik, E.I.; Yıldırım, D.Ç.; Dibooglu, S. Renewable and Non-Renewable Energy Consumption and Economic Growth in the US: A Markov-Switching VAR Analysis. Energy Environ. 2021, 32, 519–541. [Google Scholar] [CrossRef]
  2. Armstrong, B. Industrial Policy and Local Economic Transformation: Evidence from the U.S. Rust Belt. Econ. Dev. Q. 2021, 35, 181–196. [Google Scholar] [CrossRef]
  3. Li, K.; Kim, D.J.; Lang, K.R.; Kauffman, R.J.; Naldi, M. How Should We Understand the Digital Economy in Asia? Critical Assessment and Research Agenda. Electron. Commer. Res. Appl. 2020, 44, 101004. [Google Scholar] [CrossRef]
  4. Chen, F.H.; Liu, H.R. Evaluation of Sustainable Development in Six Transformation Fields of the Central Taiwan Science Park. Sustainability 2021, 13, 4336. [Google Scholar] [CrossRef]
  5. Liu, F.; Fan, Y.; Yang, S. Environmental Benefits of Innovation Policy: China’s National Independent Innovation Demonstration Zone Policy and Haze Control. J. Environ. Manag. 2022, 317, 115465. [Google Scholar] [CrossRef] [PubMed]
  6. Shen, Z.; Siraj, A.; Jiang, H.; Zhu, Y.; Li, J. Chinese-Style Innovation and Its International Repercussions in the New Economic Times. Sustainability 2020, 12, 1859. [Google Scholar] [CrossRef]
  7. Rupeika-Apoga, R.; Petrovska, K. Barriers to Sustainable Digital Transformation in Micro-, Small-, and Medium-Sized Enterprises. Sustainability 2022, 14, 3558. [Google Scholar] [CrossRef]
  8. Shen, L.; Fan, R.; Wang, Y.; Yu, Z.; Tang, R. Impacts of Environmental Regulation on the Green Transformation and Upgrading of Manufacturing Enterprises. Int. J. Environ. Res. Public Health 2020, 17, 7680. [Google Scholar] [CrossRef] [PubMed]
  9. Gereffi, G. International Trade and Industrial Upgrading in the Apparel Commodity Chain. J. Int. Econ. 1999, 48, 37–70. [Google Scholar] [CrossRef]
  10. Bhupendra, K.V.; Sangle, S. Product Stewardship Strategy: A Study of Indian Firms. Corp. Soc. Responsib. Environ. Manag. 2018, 25, 124–134. [Google Scholar] [CrossRef]
  11. Skare, M.; de las Mercedes de Obesso, M.; Ribeiro-Navarrete, S. Digital Transformation and European Small and Medium Enterprises (SMEs): A Comparative Study Using Digital Economy and Society Index Data. Int. J. Inf. Manag. 2023, 68, 102594. [Google Scholar] [CrossRef]
  12. Xue, L.; Zhang, Q.; Zhang, X.; Li, C. Can Digital Transformation Promote Green Technology Innovation? Sustainability 2022, 14, 7497. [Google Scholar] [CrossRef]
  13. Lamin, A.; Livanis, G. Agglomeration, Catch-up and the Liability of Foreignness in Emerging Economies. J. Int. Bus. Stud. 2013, 44, 579–606. [Google Scholar] [CrossRef]
  14. Horbach, J.; Rammer, C. Energy Transition in Germany and Regional Spill-Overs: The Diffusion of Renewable Energy in Firms. Energy Policy 2018, 121, 404–414. [Google Scholar] [CrossRef]
  15. Khan, M.A.; Stoll, O.; West, S.; Wuest, T. Equipment Upgrade Service Provision in the Context of Servitization: Drivers, Capabilities, and Resources. Prod. Plan. Control 2022, 1–19. [Google Scholar] [CrossRef]
  16. Han, X.; Zheng, Y. Driving Elements of Enterprise Digital Transformation Based on the Perspective of Dynamic Evolution. Sustainability 2022, 14, 9915. [Google Scholar] [CrossRef]
  17. Liu, Y.; Lee, H.; Ham, D.; Westervelt, R.M. CMOS-Based Magnetic Cell Manipulation System. Technovation 2007, 2, 103–144. [Google Scholar] [CrossRef]
  18. Ho, Y.P.; Ruan, Y.; Hang, C.C.; Wong, P.K. Technology Upgrading of Small-and-Medium-Sized Enterprises (SMEs) through a Manpower Secondment Strategy—A Mixed-Methods Study of Singapore’s T-Up Program. Technovation 2016, 57–58, 21–29. [Google Scholar] [CrossRef]
  19. Gaglio, C.; Kraemer-Mbula, E.; Lorenz, E. The Effects of Digital Transformation on Innovation and Productivity: Firm-Level Evidence of South African Manufacturing Micro and Small Enterprises. Technol. Forecast. Soc. Change 2022, 182, 121785. [Google Scholar] [CrossRef]
  20. Wen, H.; Lee, C.C.; Zhou, F. Green Credit Policy, Credit Allocation Efficiency and Upgrade of Energy-Intensive Enterprises. Energy Econ. 2021, 94, 105099. [Google Scholar] [CrossRef]
  21. Matsuzaki, T.; Shigeno, H.; Ueki, Y.; Tsuji, M. Innovation Upgrading of Local Small and Medium-Sized Enterprises and Regional Innovation Policy: An Empirical Study. Ind. Mark. Manag. 2021, 94, 128–136. [Google Scholar] [CrossRef]
  22. Xiao, S.; Yang, J. Does the Executive Equity Incentive Promote the Up- Grading of Enterprises: Empirical Evidence from Chi- Nese Listed Companies. Explor. Econ. Hist. 1993, 24, ETG 5-1–ETG 5-17. [Google Scholar] [CrossRef]
  23. Ai, H.; Hu, S.; Li, K.; Shao, S. Environmental Regulation, Total Factor Productivity, and Enterprise Duration: Evidence from China. Bus. Strateg. Environ. 2020, 29, 2284–2296. [Google Scholar] [CrossRef]
  24. Zhu, L. Research on the Impact of Environmental Regulation on Global Value Chain Upgrading of Enterprises: From the Perspective of Export Domestic Added Value. J. Int. Bus. Stud. 2011, 1, 137–140. [Google Scholar] [CrossRef]
  25. Yang, F.; Sun, Y.; Zhang, Y.; Wang, T. Factors Affecting the Manufacturing Industry Transformation and Upgrading: A Case Study of Guangdong–Hong Kong–Macao Greater Bay Area. Int. J. Environ. Res. Public Health 2021, 18, 7157. [Google Scholar] [CrossRef] [PubMed]
  26. Chen, X.; Liu, X.; Wang, W.; Gong, Z. Behavioral DEA Model and Its Application to the Efficiency Evaluation of Manufacturing Transformation and Upgrading in the Yangtze River Delta. Soft Comput. 2020, 24, 10721–10738. [Google Scholar] [CrossRef]
  27. Song, C.; Yin, G.; Lu, Z.; Chen, Y. Industrial Ecological Efficiency of Cities in the Yellow River Basin in the Background of China’s Economic Transformation: Spatial-Temporal Characteristics and Influencing Factors. Environ. Sci. Pollut. Res. 2022, 29, 4334–4349. [Google Scholar] [CrossRef] [PubMed]
  28. Mao, W.; Wang, W.; Sun, H.; Yao, P.; Wang, X.; Luo, D. Urban Industrial Transformation Patterns under Natural Resource Dependence: A Rule Mining Technique. Energy Policy 2021, 156, 112383. [Google Scholar] [CrossRef]
  29. Wang, Y.; Li, Z.; Shi, F. Factors Influencing Mechanism of Construction Development Transformation in China Based on SEM. Discret. Dyn. Nat. Soc. 2015, 2015, 9865. [Google Scholar] [CrossRef]
  30. Meng, F.; Xu, Y.; Zhao, G. Environmental Regulations, Green Innovation and Intelligent Upgrading of Manufacturing Enterprises: Evidence from China. Sci. Rep. 2020, 10, 1–17. [Google Scholar] [CrossRef]
  31. Zhai, X.; An, Y. Analyzing Influencing Factors of Green Transformation in China’s Manufacturing Industry under Environmental Regulation: A Structural Equation Model. J. Clean. Prod. 2020, 251, 119760. [Google Scholar] [CrossRef]
  32. Wang, Z.; Shou, M.; Wang, S.; Dai, R.; Wang, K. An Empirical Study on the Key Factors of Intelligent Upgrade of Small and Medium-Sized Enterprises in China. Sustainability 2019, 11, 619. [Google Scholar] [CrossRef]
  33. Li, C.; Wan, J.; Xu, Z.; Lin, T. Impacts of Green Innovation, Institutional Constraints and Their Interactions on High-Quality Economic Development across China. Sustainability 2021, 13, 5277. [Google Scholar] [CrossRef]
  34. Sheng, Z.; Yuan, G.; Xiru, D.; Minglong, Z.; Yi, W.; Yu, H. Research on High Quality Evaluation and Influencing Factors of China Energy Finance: Evidence From A-Share New Energy Companies. Front. Environ. Sci. 2021, 9, 1–15. [Google Scholar] [CrossRef]
  35. Xin, G. Research on Curriculum System of Electrical Engineering Based on Innovation and Entrepreneurship Education. In Proceedings of the 2021 6th International Conference on Social Sciences and Economic Development (ICSSED 2021), Nanjing, China, 12–14 March 2021; Volume 543, pp. 985–989. [Google Scholar] [CrossRef]
  36. Borrás, S.; Laatsit, M. Towards System Oriented Innovation Policy Evaluation? Evidence from EU28 Member States. Res. Policy 2019, 48, 312–321. [Google Scholar] [CrossRef]
  37. Chen, X.; Liu, Z.; Ma, C. Chinese Innovation-Driving Factors: Regional Structure, Innovation Effect, and Economic Development—Empirical Research Based on Panel Data. Ann. Reg. Sci. 2017, 59, 43–68. [Google Scholar] [CrossRef]
  38. Zaharia, A.; Diaconeasa, M.C.; Maehle, N.; Szolnoki, G.; Capitello, R. Developing Sustainable Food Systems in Europe: National Policies and Stakeholder Perspectives in a Four-Country Analysis. Int. J. Environ. Res. Public Health 2021, 18, 7701. [Google Scholar] [CrossRef]
  39. Yong, Z. Research on the Effect of National Independent Innovation Demonstration Zone Policy on Regional Economy. Am. J. Res. Commun. 2021, 1, 1–7. [Google Scholar]
  40. Aisaiti, G.; Xie, J.; Zhang, T. National Innovation Demonstration Zone Policy and City Innovation Capability—A Quasi-Natural Experimental Analysis. Ind. Manag. Data Syst. 2022, 122, 1246–1267. [Google Scholar] [CrossRef]
  41. Wei, L.; Bu, W. Research on the Economic Growth Promoting Effect of National Innovation Demonstration Zone. Sci. Technol. Prog. Policy 2018, 35, 48–56. [Google Scholar]
  42. Ma, Z.; Ding, C. Evaluation on the Innovation Ecosystem of National Independent Innovation Demonstration Zone Based on RJVs. Am. J. Res. Commun. 2009, 5, 12–42. [Google Scholar]
  43. Zhang, W. Position, Construction Strategy and the Orientation of National Independent Innovation Demonstration Zones. Innov. Dev. Coord. Dev. 2019, 1, 9–25. [Google Scholar]
  44. Wang, S. Evolution Track and Expectation of National Independent Innovation Demon-Stration Zone. Complexity 2017, 297, 82–94. [Google Scholar]
  45. Feng, C.; Liao, X. An Overview of “Energy + Internet” in China. J. Clean. Prod. 2020, 1, 258. [Google Scholar] [CrossRef]
  46. Yu, F.; Wang, L.; Li, X. The Effects of Government Subsidies on New Energy Vehicle Enterprises: The Moderating Role of Intelligent Transformation. Energy Policy 2020, 141, 111463. [Google Scholar] [CrossRef]
  47. Boeing, P.; Eberle, J.; Howell, A. The Impact of China’s R&D Subsidies on R&D Investment, Technological Upgrading and Economic Growth. Technol. Forecast. Soc. Change 2022, 174, 121212. [Google Scholar] [CrossRef]
  48. Lan, F.; Wang, W.; Cao, Q. Tax Cuts and Enterprises’ R&D Intensity: Evidence from a Natural Experiment in China. Econ. Model. 2020, 89, 304–314. [Google Scholar] [CrossRef]
  49. Wang, Q.; Wang, J.; Li, H.; Li, X. Research on Financing Efficiency and Influencing Factors of Equipment Manufacturing Industry-Regression Model Based on SFA Panel Data. J. Intell. Fuzzy Syst. 2021, 40, 8117–8126. [Google Scholar] [CrossRef]
  50. Kolaj, M.; Smith, R.S. A Multiple Transmitter and Receiver Electromagnetic System for Improved Target Detection. Geophysics 2015, 80, E247–E255. [Google Scholar] [CrossRef]
  51. Dong, T. The Evaluation System of Publishing Industry’s Competitiveness in Overseas Market; Springer: Berlin/Heidelberg, Germany, 2021; ISBN 9789811686597. [Google Scholar]
  52. Cao, H.; Chen, Z. The Driving Effect of Internal and External Environment on Green Innovation Strategy-The Moderating Role of Top Management’s Environmental Awareness. Nankai Bus. Rev. Int. 2019, 10, 342–361. [Google Scholar] [CrossRef]
  53. Li, H.; Graham, D.J.; Majumdar, A. The Effects of Congestion Charging on Road Traffic Casualties: A Causal Analysis Using Difference-in-Difference Estimation. Accid. Anal. Prev. 2012, 49, 366–377. [Google Scholar] [CrossRef] [PubMed]
  54. Xia, P.; Wei, L.; Ma, Z. Negative Binomial Regression Model Based Analysis for Influential Factors of Expressway Traffic Accidents. Shandong Sci. 2013, 26, 80–84. [Google Scholar] [CrossRef]
Figure 1. Flow chart of our research.
Sustainability 15 02711 g001
Figure 2. Pulse diagram of the transformation and upgrading capacity of 1770 enterprises in the A-share manufacturing industry in 2020. The red line represents the average of the enterprise transformation and upgrading capabilities.
Sustainability 15 02711 g002
Figure 3. Box line diagram of the enterprise transformation and upgrading capacity of the 21 NIDZs in 2020. Note: Serial number 1–21represent, respectively, Zhong-Guan-Cun NIDZ, Wu-Han East Lake NIDZ, Shang-Hai Zhang-Jiang NIDZ, Shen-Zhen NIDZ, Su-Nan NIDZ, Chang-Zhu-Tan NIDZ, Tian-Jin NIDZ, Cheng-Du NIDZ, Xi-an NIDZ, Hang-Zhou NIDZ, Pearl River Delta NIDZ, Zheng-Luo-Xin NIDZ, Shan-Dong Peninsula NIDZ, Shen-Da NIDZ, Fu-Xia-Quan NIDZ, He-Wu-Beng NIDZ, Chong-Qing NIDZ, Ning-Wen NIDZ, Lan-Bai NIDZ, Wu-Chang-Shi NIDZ and Po-Yang Lake NIDZ. The red line represents the average of the enterprise transformation and upgrading capabilities.
Sustainability 15 02711 g003
Figure 4. Influence of first-level indicators on enterprises’ transformation and upgrading capabilities in National Innovation Demonstration Zones. Note: 1. Shang−Hai Zhang−Jiang NIDZ, 2. Zhong−Guan−Cun NIDZ, 3. Wu−Chang−Shi NIDZ, 4. Lan−Bai NIDZ, 5. He−Wu−Beng NIDZ, 6. Tian−Jin NIDZ, 7. Ning−Wen NIDZ, 8. Shan−Dong Peninsula NIDZ, 9. Cheng−Du NIDZ, 10. Hang−Zhou NIDZ, 11. Wu−Han East Lake NIDZ, 12. Shen−Da NIDZ, 13. Shen−Zhen NIDZ, 14. Pearl River Delta NIDZ, 15. Fu−Xia−Quan NIDZ, 16. Su−Nan NIDZ, 17.Xi−An NIDZ, 18. Zheng−Luo−-Xin NIDZ, 19. Po−Yang NIDZ, 20. Chong−Qing NIDZ, 21. Chan−Zhu−Tan NIDZ.
Sustainability 15 02711 g004
Figure 5. Elasticity coefficients of enterprises’ internal factors with respect to enterprises’ transformation and upgrading capabilities in the National Innovation Demonstration Zones. Note: 1. Proportion of corporate R&D personnel (%), 2. Amount of enterprise R&D investment (10,000 yuan), 3. Enterprise R&D investment intensity (%), 4. Return on assets (%), 5. Profit rate of total assets (%), 6. Return on equity (%), 7. Operating profit margin (%), 8. Turnover of total assets (%), 9. Accounts receivable turnover (%), 10. Asset−liability ratio (%), 11. Total assets growth rate (%), 12. Business revenue (10,000 yuan).
Sustainability 15 02711 g005
Table 1. Basic Overview of National Innovation Demonstration Zones.
Regional DistributionNIDZAffiliated ProvinceEstablishment DateNumber of Companies
Eastern coastal areasZhong-Guan-Cun NIDZBeijing2009.3136
Shang-Hai Zhang-Jiang NIDZShanghai2011.3173
Shen-Zhen NIDZGuangdong2014.6203
Su-Nan NIDZJiangsu2014.11285
Tian-Jin NIDZTianjin2015.233
Hang-Zhou NIDZZhejiang2015.997
Pearl River Delta NIDZGuangdong2015.9197
Shan-Dong Peninsula NIDZShandong2016.4133
Shen-Da NIDZLiaoning2016.423
Fu-Xia-Quan NIDZFujian2016.668
Ning-Wen NIDZZhejiang2018.297
Central areaWu-Han East Lake NIDZHubei2009.1233
Chang-Zhu-Tan NIDZHunan2015.150
Zheng-Luo-Xin NIDZHenan2016.430
He-Wu-Beng NIDZAnhui2016.648
Chong-Qing NIDZChongqing2016.728
Po-Yang Lake NIDZJiangxi2019.831
Western areaCheng-Du NIDZSichuan2015.649
Xi-An NIDZShanxi2015.925
Lan-Bai NIDZGansu2018.214
Wu-Chang-Shi NIDZXinjiang2018.1117
Table 2. System of indicators of enterprises’ transformation and upgrading capabilities in NIDZs.
First-Level IndicatorSecond-Level Indicator
Innovation-driven inputInternal factorsProportion of corporate R&D personnel (x1), Amount of enterprise R&D investment (x2), Enterprise R&D investment intensity (x3)
External factorsFull time equivalent of R&D personnel (x4), R&D expenditure input intensity (x5), Expenditure on science and technology (S&T) (x6), Number of patent applications (x7), Number of patents granted (x8), Number of enterprises with R&D institutions (x9), Number of R&D institutions in industrial enterprises above designated size (x10), Expenditure on S&T institutions of industrial enterprises above designated size (x11), Expenditure on technical renovation in industrial enterprises above designated size (x12), Projects for new product development of industrial enterprises above designated size (x13), Expenditure on new product development of industrial enterprises above designated size (x14), Number of foreign technology import contracts (x15), Transaction value in technical markets (x16), Scientific papers issued (x17), Publications on S&T (x18), Number of technical formed national and industrial standards (x19), Number of R&D institutions (x20), Number of mass maker spaces (x21), Number of national university science parks (x22)
Economically beneficial outputInternal factorsReturn on assets (x23), Profit rate of total assets (x24), Return on equity (x25), Operating profit margin (x26), Turnover of total assets (x27), Accounts receivable turnover (x28), Asset-liability ratio (x29), Total assets growth rate (x30), Business revenue (x31)
External factorsPer capita gross regional product (x32), General public budget revenue (x33), Per capita disposable income of households (x34), Per capita disposable expenditure of households (x35), General consumer price index (x36), Growth rate of total investment in fixed assets (x37), Proportion of urban population (x38), Total wages bill of employed persons in urban non-private units (x39), Number of employed persons in urban non-private units (x40), Per capita consumption expenditure of urban households (x41), Sales revenue of new products of industrial enterprises above designated scale (x42), Business revenue of high-tech industry (x43), Profits of high-tech industry (x44)
Regional high-quality developmentExternal factorsAmount of informatization and E-commerce of enterprises (x45), Computers used per 100 persons (x46), Websites per 100 enterprises (x47), Sales through E-commerce (x48), Number of persons employed in information transmission software and information technology (x49), Business volume of telecommunication services (x50), Revenue from express delivery services (x51), Broadband subscribers by Internet ports (x52), Mobile internet subscribers (x53), Qualification rate of products (x54), Income from software-related business (x55), Area of green space (x56), Number of parks (x57), Forest coverage rate (x58), Forest area (x59), Investment in gardening and greening (x60), Green area as % of completed area (x61), Integrated reuse of common industrial solid waste (x62), Daily disposal capacity of city sewage (x63), Harmless treatment capacity of garbage (x64), International trade in goods (x65), Number of foreign-invested enterprises (x66), Total investment of foreign-invested enterprises (x67), Value-added by tertiary industry (x68), Tertiary industry’s share of GDP (x69), Proportion of employed persons in tertiary industry (x70)
Enterprise’s basic environmentExternal factorsNumber of regular higher education institutions (x71), Number of education personnel in regular senior secondary schools (x72), Number of students enrolled in general senior secondary schools (x73), Number of secondary vocational schools (x74), Number of students enrolled in secondary vocational schools (x75), Educational finance (x76), Number of health care institutions (x77), Number of licensed physicians and physicians’ assistants (x78), Number of public libraries (x79), Collections of public libraries per person (x80), Number of museums (x81), Full-time S&T popularization personnel (x82), Number of S&T museums (x83), Construction area of S&T museums (x84), Number of people participating in basic medical insurance (x85), Number of buses and trolly buses (x86), Number of motor vehicles (x87), Electricity consumption (x88)
Table 3. Estimated parameters and coefficients of elasticity of multi-factor influence model.
ParamatersRegression CoefficientsElastic CoefficientsParamatersRegression CoefficientsElastic CoefficientsParamatersRegression CoefficientsElastic Coefficients
R20.1895 β290.18400.0781β590.00070.0003
β00.4608 β30−0.0266−0.0043β60−0.00010.0000
β1−0.1089−0.0017β310.73980.0093β610.02090.0168
β20.58940.0149β320.00090.0007β620.00460.0025
β3−0.4128−0.0002β330.00240.0022β630.00000.0000
β4−0.0029−0.0025β340.00080.0006β640.00000.0000
β50.00000.0000β35−0.0002−0.0001β65−0.0041−0.0033
β60.00090.0007β36−0.0093−0.0077β660.00010.0000
β70.00000.0000β370.00180.0019β670.00010.0000
β80.00000.0000β380.00030.0003β68−0.0048−0.0046
β9−0.0001−0.0001β390.02340.0191β690.00060.0003
β100.00000.0000β400.01190.0093β700.00270.0016
β110.00350.0022β41−0.0062−0.0049β71−0.0109−0.0112
β120.00160.0011β42−0.0362−0.0309β72−0.0008−0.0006
β13−0.0005−0.0004β430.00060.0004β730.00780.0057
β140.02330.0172β440.00080.0006β740.01980.0132
β150.00040.0002β45−0.0076−0.0068β750.00820.0061
β160.00060.0003β460.00080.0004β76−0.0172−0.0137
β17−0.0167−0.0167β47−0.0089−0.0116β770.00370.0025
β180.00010.0001β480.04550.0394β78−0.0016−0.0015
β190.00020.0001β49−0.00010.0000β79−0.0177−0.0134
β200.00000.0000β500.00010.0001β80−0.0005−0.0002
β21−0.0229−0.0208β51−0.0028−0.0019β81−0.0006−0.0004
β22−0.0008−0.0006β52−0.0018−0.0017β82−0.0024−0.0018
β230.10550.0812β530.00320.0025β83−0.0263−0.0222
β240.07150.0536β540.01030.0081β840.02230.0234
β250.19210.1758β55−0.0462−0.0390β850.00170.0015
β260.42160.6729β560.00110.0008β86−0.0034−0.0030
β270.20620.0461β570.01370.0079β870.01370.0111
β280.07020.0007β58−0.0021−0.0018β880.00030.0003
Note: The results in this table are the estimated parameters obtained after 5000 runs at a significance level of 0.05, i.e., all parameters passed the p-test (0.05).
Disclaimer/Publisher’s Note: The statements, opinions and data contained in all publications are solely those of the individual author(s) and contributor(s) and not of MDPI and/or the editor(s). MDPI and/or the editor(s) disclaim responsibility for any injury to people or property resulting from any ideas, methods, instructions or products referred to in the content.

