Article

The Study of Cu(II) Adsorption onto Synthetically Modified Geopolymers

by
Matej Šuránek
1,*,
Zuzana Melichová
1,
Miljana M. Mirković
2,
Marija Ivanović
2,
Vladimir B. Pavlović
3,
Ljiljana Kljajević
2 and
Snežana Nenadović
2
1
Department of Chemistry, Faculty of Natural Sciences, Matej Bel University, Tajovskeho 40, 97401 Banska Bystrica, Slovakia
2
Department of Materials, Vinča Institute of Nuclear Sciences-National Institute of the Republic of Serbia, University of Belgrade, 11000 Belgrade, Serbia
3
Institute of Technical Sciences of the Serbian Academy of Sciences and Arts, Knez Mihailova 35/IV, University of Belgrade, 11000 Belgrade, Serbia
*
Author to whom correspondence should be addressed.
Sustainability 2023, 15(4), 2869; https://doi.org/10.3390/su15042869
Submission received: 13 January 2023 / Accepted: 2 February 2023 / Published: 5 February 2023
(This article belongs to the Section Sustainable Materials)

Abstract

:
The study of Cu(II) from aqueous solutions using the adsorption process on synthetically modified geopolymers was performed under static conditions. Three geopolymers (based on metaphase of Serbian clay, metaphase of German clay and metaphase of German clay plus 10% of carbon cloth) were used. The geopolymers were made by condensing a mixture of metaphases and alkali activator solution at a fixed ratio at room temperature and then at a temperature of 60 °C in a dry oven. Then, the geopolymer samples were pre-crashed to a fixed-radius size. Their properties were characterized by X-ray diffractometry (XRD), Diffuse Reflectance Infrared Fourier Transform (DRIFT) analysis and Scanning Electron Microscopy (SEM) with Energy Dispersive Spectroscopy (EDS). Adsorption experiments were carried out under batch process as a function of the dose, concentration of metal, and contact time. The uptake of Cu(II) was rapid, and it increased with increasing metal concentration. The sorption percentage decreased with increasing concentration of Cu(II). The equilibrium adsorption capacity of geopolymers was measured and extrapolated using more isotherms. The data fit very well the linear Langmuir isotherm model. The pseudo-second-order kinetic model can well describe the adsorption behavior of Cu(II) ions with geopolymers samples. These results show that used geopolymers hold great potential to remove Cu(II) from industrial wastewater.

1. Introduction

The essence of environmental sustainability is the minimization of environmental burdens, which can also include contamination of water with heavy metals (a consequence of the development of industrial production, battery production, sheet metal production, and mining activities, etc.) [1,2,3].
Copper is an essential element for all plants and animals. All copper compounds, unless known otherwise, should be considered toxic [4,5]. The lethal dose of copper sulfate for humans is approximately 7 to 10 g. Copper is the third most abundant trace element in the body after zinc and iron. The suggested safe concentration in drinking water for humans varies depending on the source but tends to stabilize between 1.5 and 2 mg L−1. Dietary reference intake: the tolerable upper limit for adult consumption of dietary copper from all sources is 10 mg/day [6,7].
An important part of copper toxicity comes from its ability to accept and donate electrons when its oxidation state changes. This catalyses the formation of highly reactive radical ions, such as the hydroxyl radical, in a manner similar to the Fenton reaction [8]. This catalytic activity is exploited by enzymes with which copper is normally associated and is therefore toxic only when separated and unmediated. This increase in unmediated free radicals is called oxidative stress and is the subject of active research in various diseases where copper may play an important but lesser role than in acute toxicity [9,10].
There are several procedures to reduce the concentration of Cu(II) in water. Among the most widely used are chemical precipitation [11,12], membrane filtration [13], ion exchange [14], solvent extraction [15], photocatalysis [16], reverse osmosis [17], electrochemical treatment [18], chemical coagulation [19], and adsorption [20,21]. Adsorption on natural or synthetic materials is one of the cheap, feasible, and effective methods for the removal of toxic metal ions from water [22,23].
Geopolymers are a favorable class of materials for the elimination of harmful substances from industrial and household liquid waste. It is commonly made from an uncomplicated reaction between alkali activator and reactive aluminosilicate. Commonly used as an alkali activator, it is a mix of sodium hydroxide and sodium silicate (NaOH/Na2SiO3) or KOH. Aluminosilicate and alkali activator through a reaction of geopolymerization creates a material responsible for pure fabrication [24]. Concerning the application of geopolymers, their properties can be controlled with the consumption of as little energy as possible through a process that is wholly environmentally friendly. Geopolymer manufacture is one of the effective methods for creating a rapidly inorganic ionic conductor [25]. Furthermore, the thermodynamic properties of the mixture alkali activator (density, viscosity, speed of sound) are conducive to easier arrangement of engineering processes [26]. Afterwards, geopolymers have a number of advantages: heat and acid/alkaline resistance, immense strength, and beneficial solidification of toxic waste [27]. After 1979, the term “geopolymer”, which categorizes a new class of alumino-silicate materials, was introduced by Davidovits [28]. Geopolymers are inorganic, solid, and stable at elevated temperatures; they are inflammable materials that are cured at low temperatures and with low CO2 emissions, compared to Portland cement [29,30]. Si–O–Al structures with interchangeable Si and Al tetrahedral associate with each other by sharing oxygen atoms; they are building blocks of geopolymer samples [31].
A special three-dimensional network structure with determined pore sizes and pathways that allow certain heavy metals to pass through makes geopolymer an effective adsorbent. More than one decade ago, Wang et al. [32] investigated the adsorption capacity of fly ash-based geopolymer for Cu(II) in an aqueous solution. The value of adsorption capacity was 92 mg g−1, which is a significantly higher value than those of fly ash. Zhang et al. [33] immobilized Cr(VI), Cd(II), and Pb(II) by using a fly ash-based geopolymer binder. They concluded that a chemical connection occurs in geopolymer gels. Yousef et al. [34] confirmed that geopolymers based on natural zeolitic tuff has a high adsorption capacity in terms of methylene blue and Cu(II) ions.
The use of geopolymers for the removal of Cu(II) from water has been investigated. A zeolite-based geopolymer was used for Cu(II) removal by Siyal et al. This material had a Cu(II) adsorption capacity per gram of geopolymer of 7.8 mg g−1 [35]. Andrejkovicva et al. investigated the adsorption capacity of metakaolin-based geopolymers. The adsorption capacity of these materials, depending on their quantitative composition, ranged from 28.38 to 44.73 mg g−1 of adsorbed Cu(II) [36]. Qiaoqiao et al. Al prepared NaOH activated geopolymer. They were able to prepare a material with a huge adsorption surface area. This material was prepared synthetically, and its theoretical adsorption capacity of Cu(II) was 335.43 mg g−1 [37]. Ge et al. used a methacoline-based porous geopolymer to remove Cu(II) from water. The adsorption capacity of the material was 50.06 mg g−1 [38]. Wang et al. used coal gangue and red mud based geopolymers for adsorption of Cu(II) from aqueous solutions. The theoretical adsorption capacity of these geopolymers ranged from 18.8 to 60.0 mg g−1 [11]. Cheng et al. used a metakaolin-based geopolymer to adsorb toxic metal ions including Cu(II). The theoretical maximum Cu(II) adsorption capacity of their material was 48.78 mg g−1 [39].
The adsorption of Cu(II) onto a bio-modified geopolymer from a multi-metal system of Cu(II), Fe(II) and Zn(II) was studied by Mama et al. The conclusion of their study was that Cu(II) adsorbed the worst among these ions. The calculated maximum adsorption capacities increased in the order of 35.01 mg g−1—Cu(II), 45.18 mg g−1 Fe(II) and 44.63 mg g−1 Zn(II) [40].
The subject of this research was to prepare three clay-based geopolymers, characterize their structure, and compare their adsorption efficiencies with respect to Cu(II) adsorption. The effect of pH, amount of adsorbent, initial concentration of Cu(II), and contact time was also studied.

2. Materials and Methods

2.1. The Preparation of Adsorbent Samples

Geopolymers were synthesised by reaction of solid precursor and an alkali activator. A solid precursor was obtained using three different system: (a) metaphase of kaolinite of Serbian origin (MS), (b) metaphase of German clay (MG) and (c) mixing MG and 10 mas % of carbon cloth (MGC). The percent of carbon cloth is related to metaphase—MG. The carbon cloth was manufactured in ‘‘Vinča” Institute of Nuclear Sciences (Serbia) [41]. Origin of carbon cloth was viscose rayon cloth (from the Viskoza Factory Loznica, Yugoslavia). The cloth was carbonized in a nitrogen flow and activated in a carbon dioxide flow at 850 °C for 1 h. Methaphases were prepared by calcining kaolinite (Al2Si2O7·2H2O) of Serbian origin (Rudovci, Serbi) and clay that originated in Germany at 850 °C for 3 h. The alkaline activator solution was made by mixing a solution of Na2SiO3 (technical grade) and a solution of NaOH (analytical grade) with a concentration of 12 mol dm–3 (12 M). The solution of Na2SiO3 supplied by a manufacturer from Serbia, “DEM Company”, Belgrade, (the chemical composition of Na2SiO3 was comprised of Na2O = 14.7%, SiO2 = 29.4%, and water 55.9%). Different metaphases and alkaline activators were mixed for 15 min. The ratio of mass of solid precursor and mass of liquid phase of alkali activator was 1.5. The obtained pastes were poured out into molds and shaken for 1 h to eliminate the bubbles. The samples stayed at room temperature for 1 day, and after that for 2 days in a sample-drying oven at 60 °C. Prior to using them as adsorbents, the geopolymer samples were crushed and sieved (hole diameter-355 µm). These samples of geopolymers were marked as GPS (geopolymer based on metakaolin of Serbian clay), GPG (geopolymer based on metaphase of German clay) and GPGC (geopolymer based on metaphase of German clay and mixed with carbon cloth).
Due to a microstructure evaluation and semi-quantitative elemental analysis of the surface, geopolymer samples were characterized by X-ray diffractometry (XRD), Diffuse Reflectance Infrared Fourier Transform (DRIFT) analysis, and Scanning Electron Microscopy (SEM) with Energy Dispersive Spectroscopy (EDS).

2.2. Cu(II) Syntetic Sollutions

For all the experimental aqueous solutions of Cu(II), analytical reagent grade CuSO4 · 5 H2O (Chemapol, Praha) was used. The equivalent mass of CuSO4 · 5 H2O (p. a.) was dissolved in deionized water. Deionized water was prepared via reverse osmosis Demiwa, Watek, Czech Republic. For the preparation of standard solution for AAS analysis was used a certificate referenced material—Cu(II) with a concentration of 1001 ± 4 mg L−1 (Fluka Analytical Copper Standard for AAS).

2.3. Adsorption Experiments

For the adsorption experiments the 50 mL PVC tubes were used. In the tube 0.025 g of an adsorbent sample was mixed with 25 mL of copper solution. The tubes with the adsorbent sample and with aqueous solution of Cu(II) were shaken at a temperature of 25 °C in an orbital shaker ES-20/60 (bioSan, Riga, Latvia) at 200 rpm. After the required mixing time the suspension was centrifugated by a rotation centrifuge machine at 5000 rpm. The adsorption experiments were performed in duplicate using two independent samples. For determination of the copper concentration in the solution before and after adsorption experiments, atomic absorption spectrometry (AAS) was used. The experimental error bar limit between duplicate samples was lower than ±5%.
For the calculation of the percentage of Cu(II) adsorption (Ads. %), this equation was used (1):
A d s .   % = c 0     c t c 0 ×   100
where c0 is an initial Cu(II) concentration (mg L−1) and ct is the Cu(II) concentration left in aqueous solution at time t (mg L−1).
The amount of the adsorbed Cu(II) per mass unit of the adsorbent in time qt (mg g−1) was calculated by Equation (2):
q t = c 0     c t V m
where V is the volume of the Cu(II) aqueous solution (L), and m is the mass of adsorbent sample (g).

2.4. Atomic Absorption Spectrometry
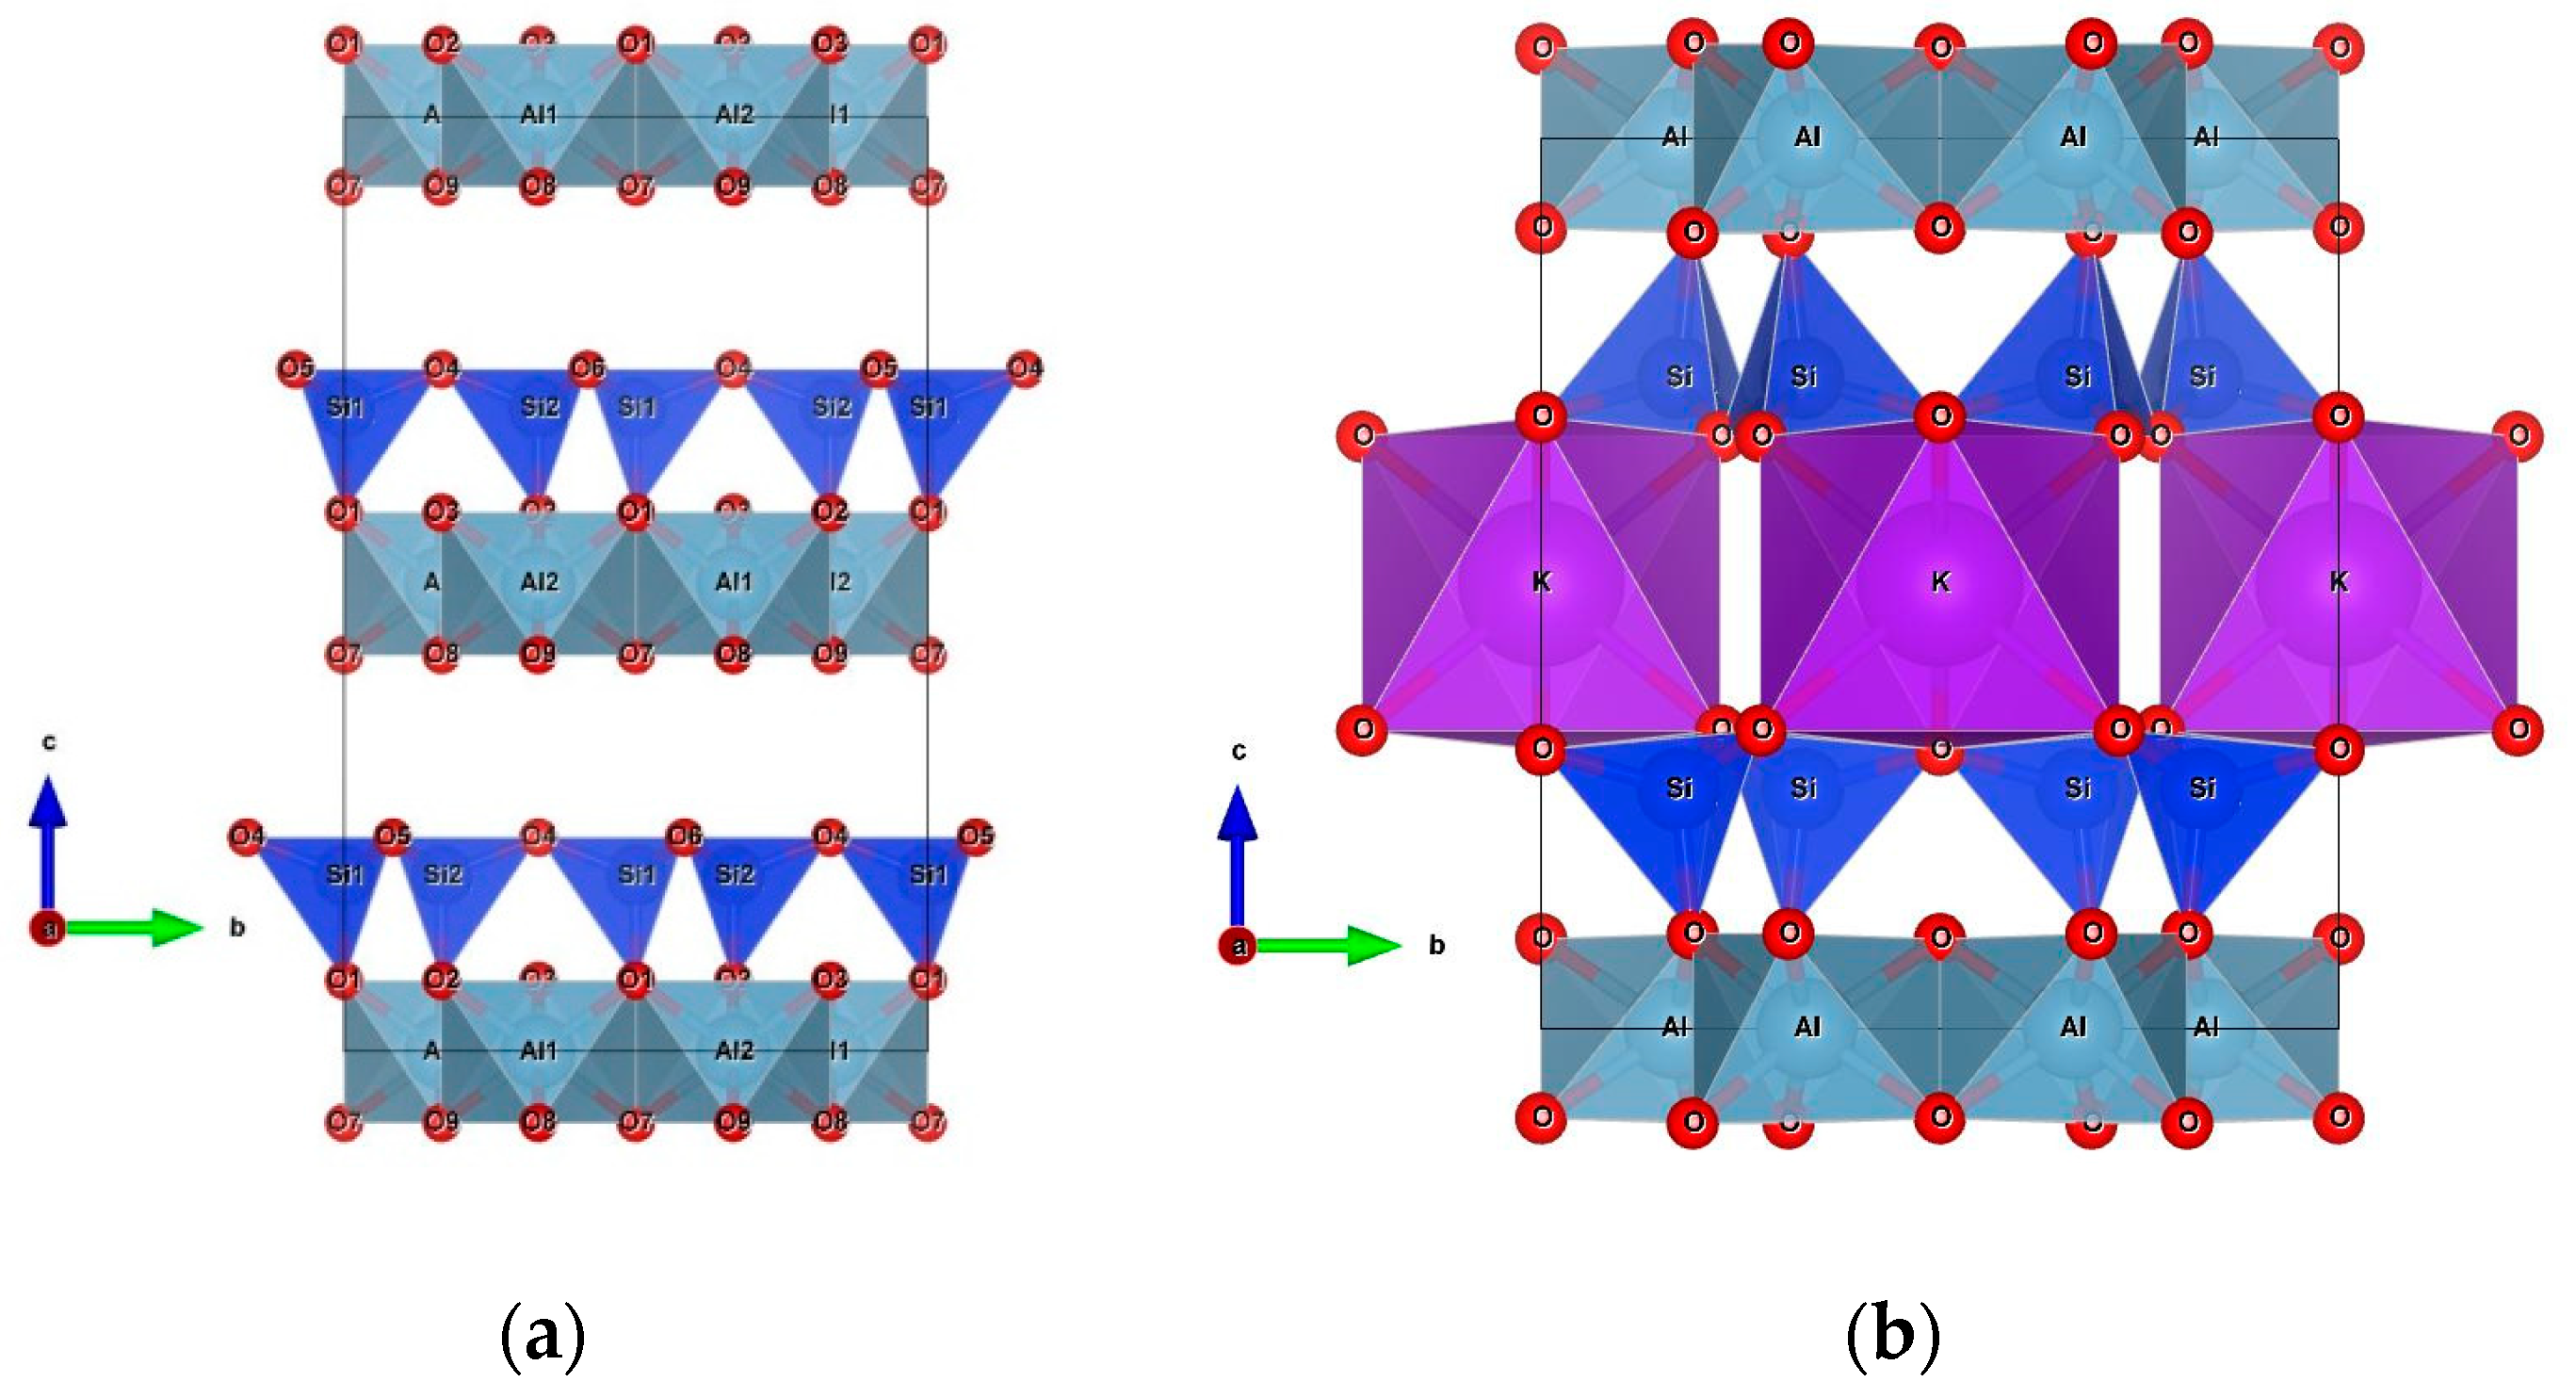
The concentrations of Cu(II) before and after adsorption experiments were determined by using the atomic absorption spectrometer AVANTA Σ (GBC Scientific, Melbourne, Australia) with flame atomization. For the flame-fuel a mixture of acetylene and air was used. The experimental data were processed using a GBC Avanta v. 2.0 software (GBC Scientific, Melbourne, Australia). The working wavelengths were 217.90 nm for Cu(II) concentrations up to 60 mg L−1 and 222.60 nm for a Cu(II) concentration limit lower than 300 mg L−1. For periodically checking the instrument response standard metal ion solutions were used.

2.5. XRD Analysis

In order to determine the phase composition of the synthesized samples, XRD analysis was applied. Samples were recorded at room temperature using an Ultima IV Rigaku diffractometer; an X-ray copper tube was used with a generator voltage (40.0 kV) and a generator current (40.0 mA). The selected angular range of the recording was 5–80° 2θ in a continuous scan mode with a scanning step size of 0.02° and at a scan rate of 5°/min. The samples were prepared on mono crystalline Si-sample holders, and an ultra-high-speed detector D/TeX was used. The PDXL2 (Ver. 2.8.4.0) software was used to evaluate the phase identification and microstructure properties of the material. All obtained powders were identified using the ICDD data base [26]. For phase identification, selected PDF card numbers were used:
  • PDF: 00-024-1047, Paragonite NaAl2(AlSi3)O10(OH)2
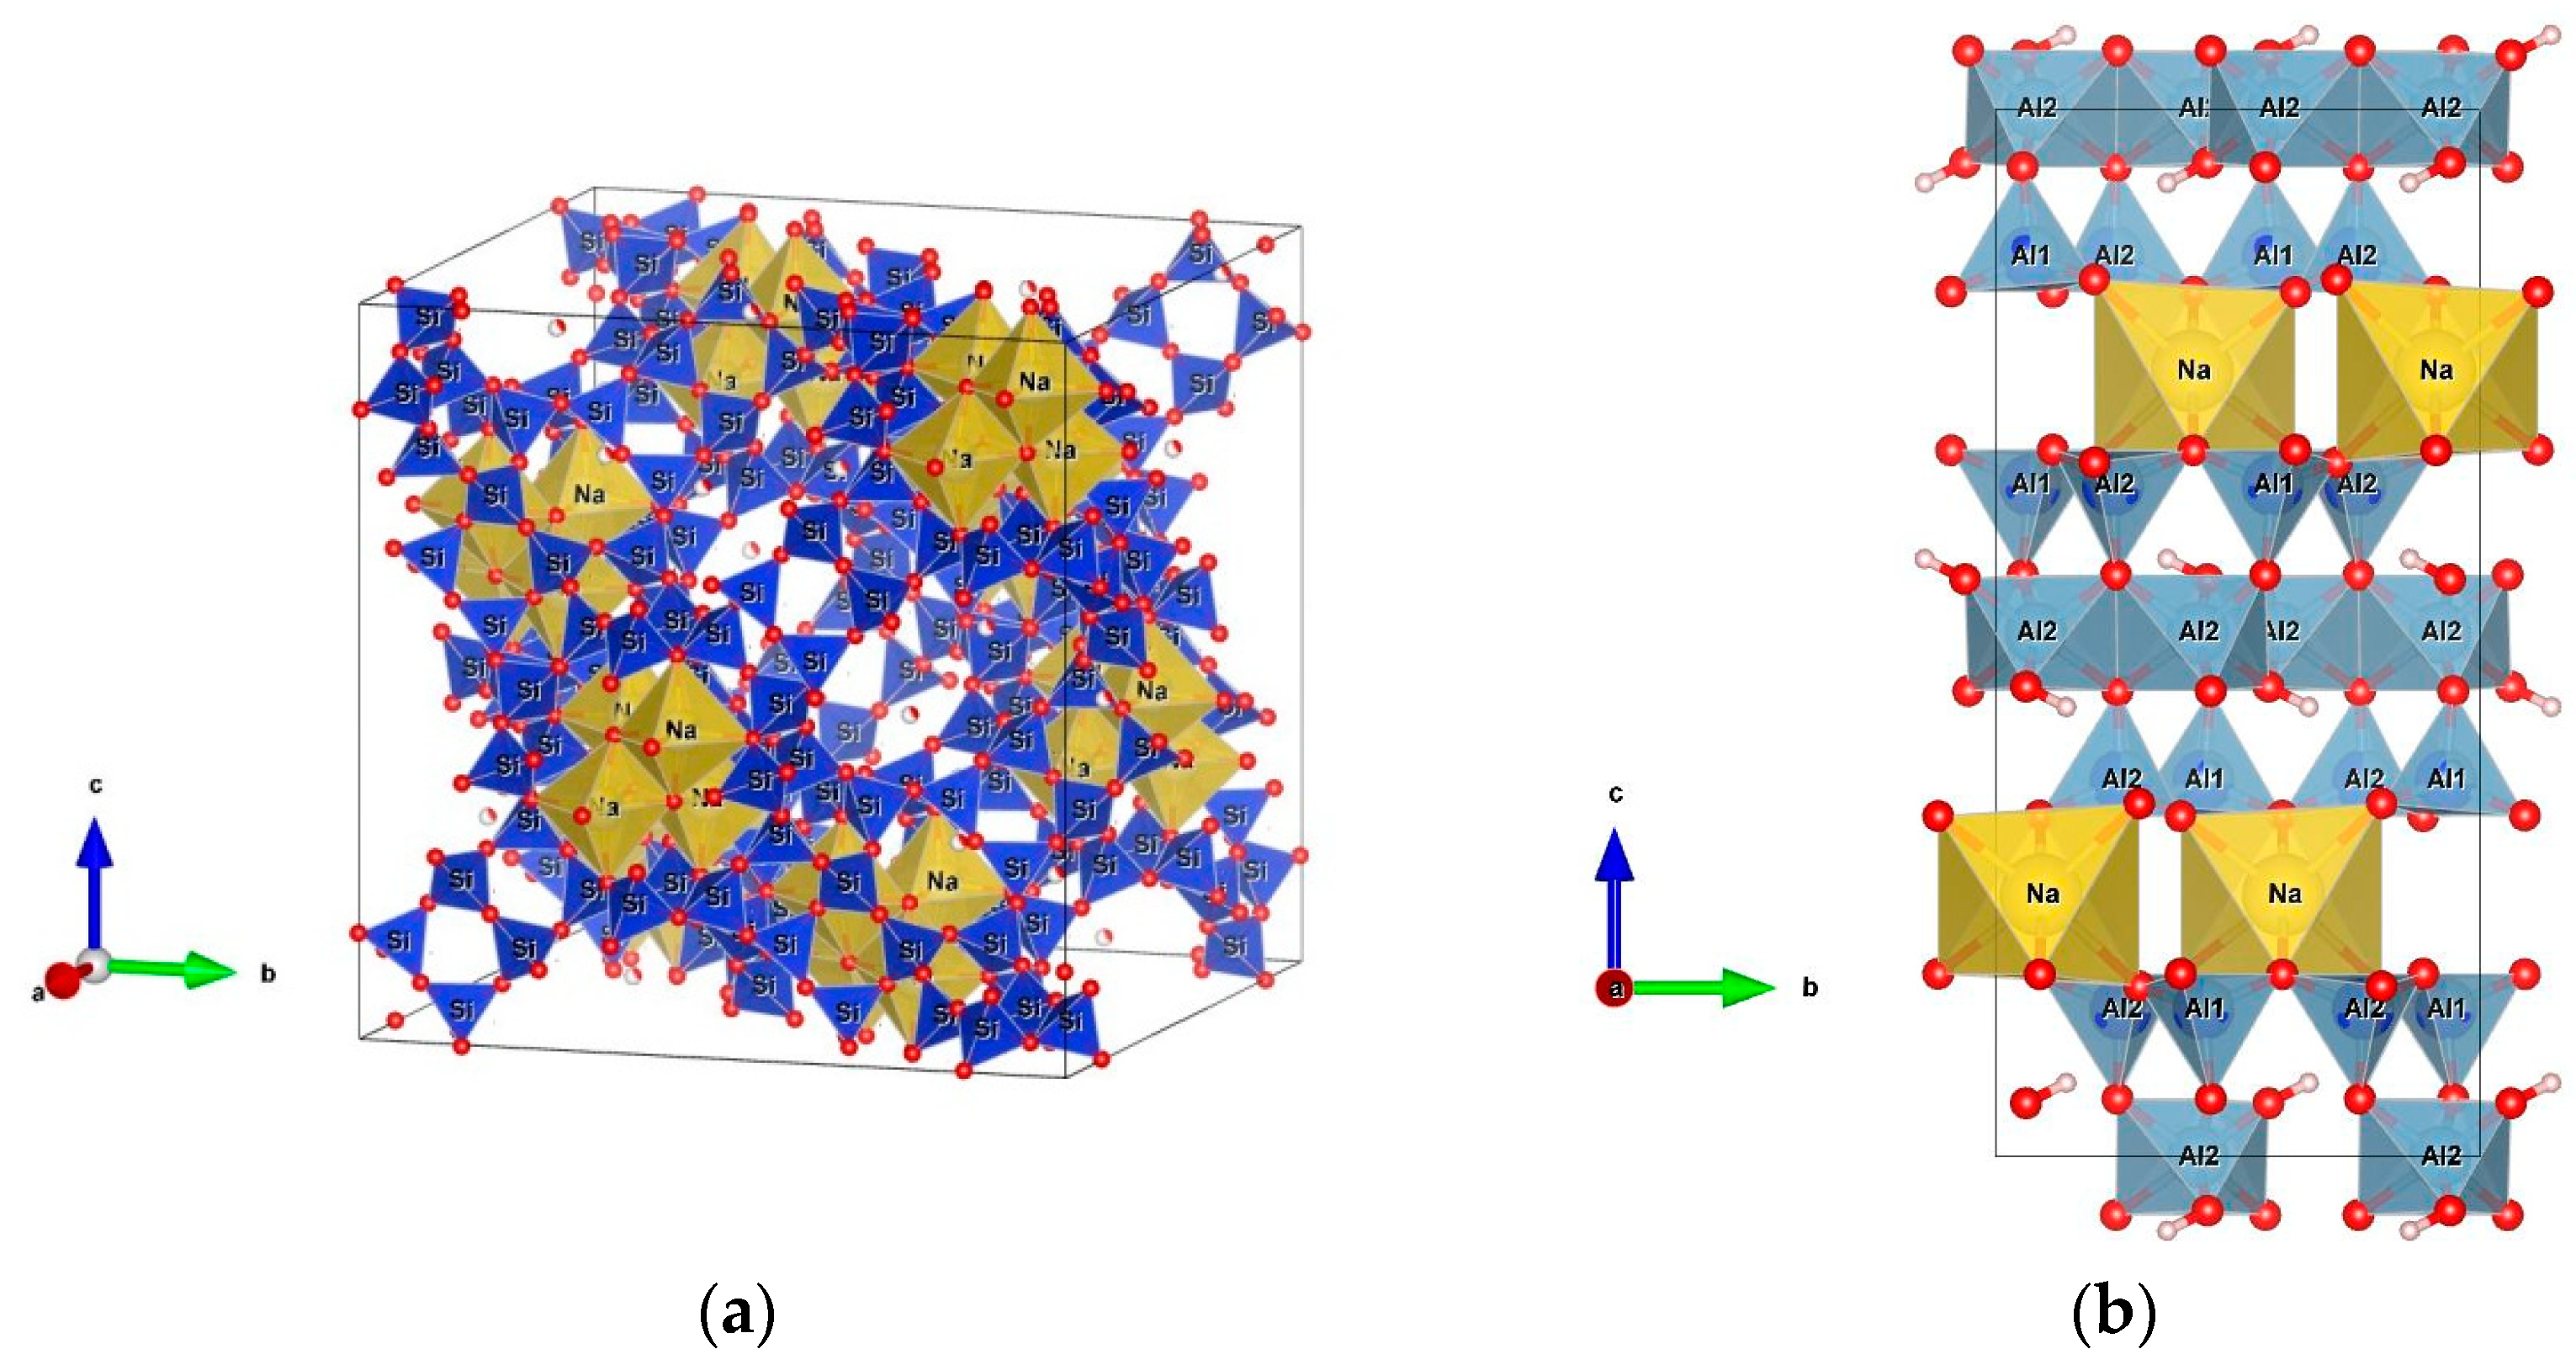
  • PDF: 00-039-1380, Faujasite-NaNa2Al2Si4O12 · 8 H2O
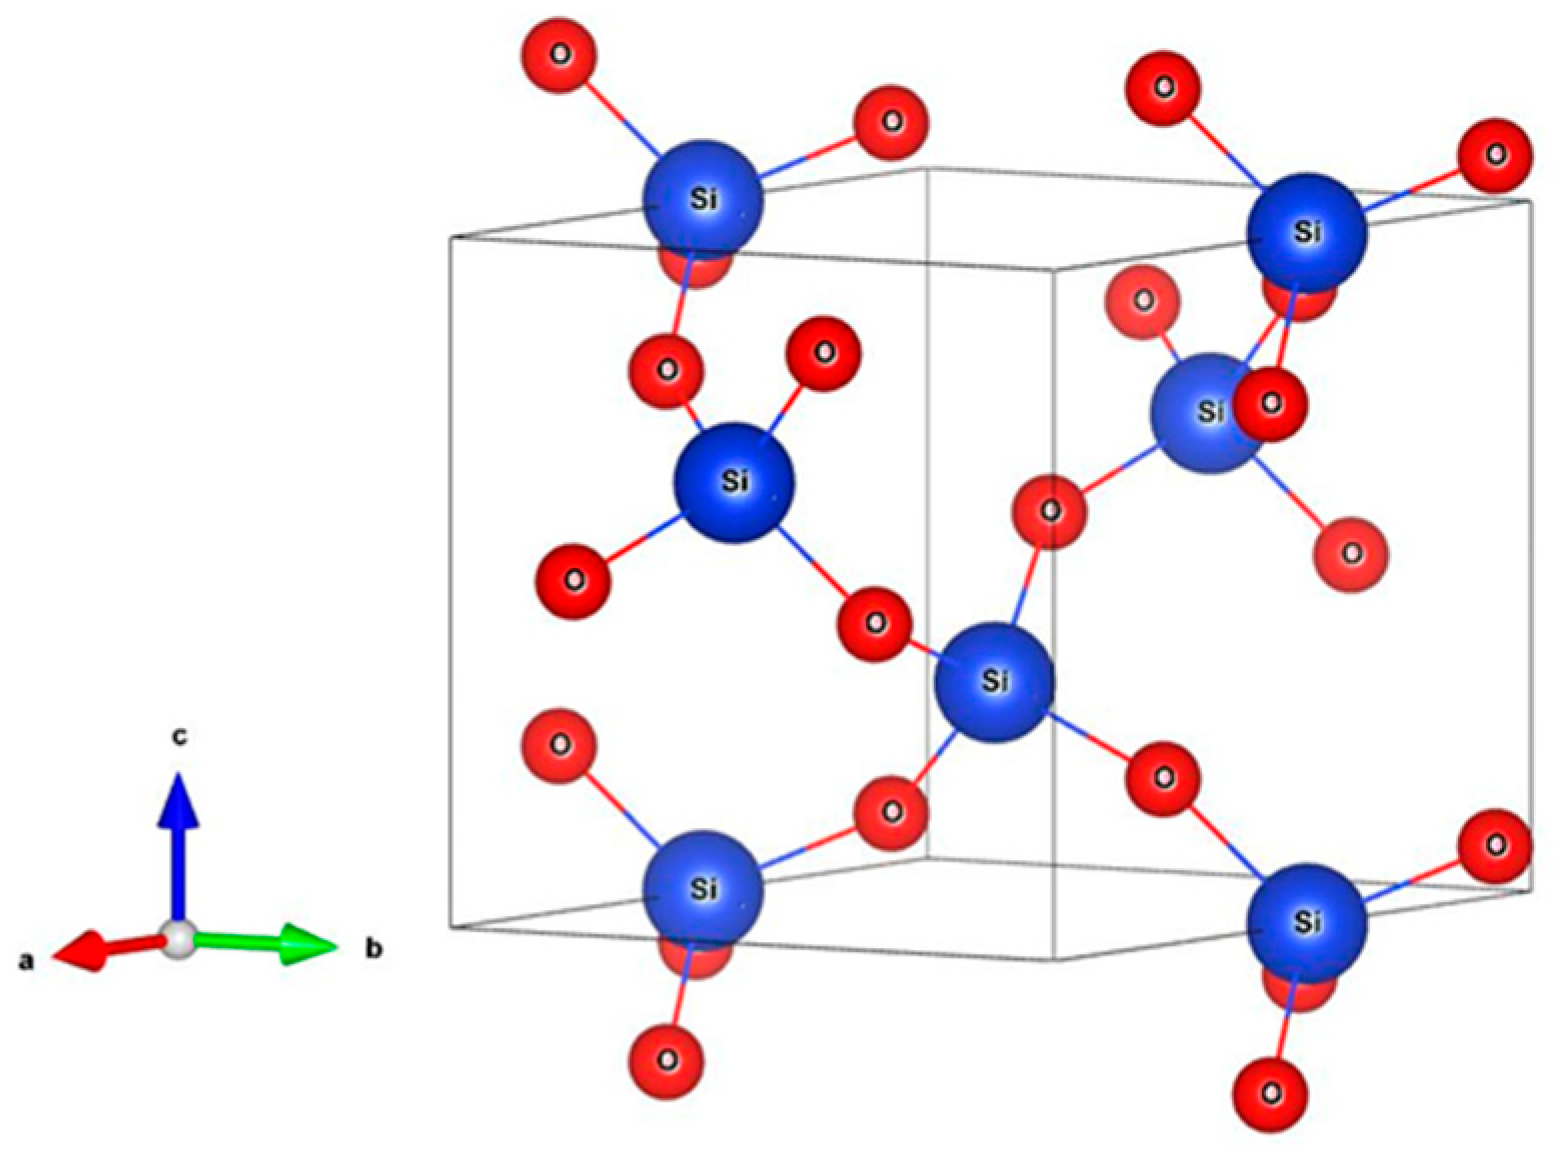
  • PDF: 01-078-1252, Quartz SiO2
  • PDF: 01-089-0769, Zeolite X
  • PDF: 00-043-0685, Illite KAl2(Si3Al)O10(OH)2
  • PDF: 00-003-0052, Kaolinite Al2O3 · 2 SiO2 · 2 H2O

2.6. Diffuse Reflectance Infra Red Fourier Transform Spectroscopy (DRIFTS)
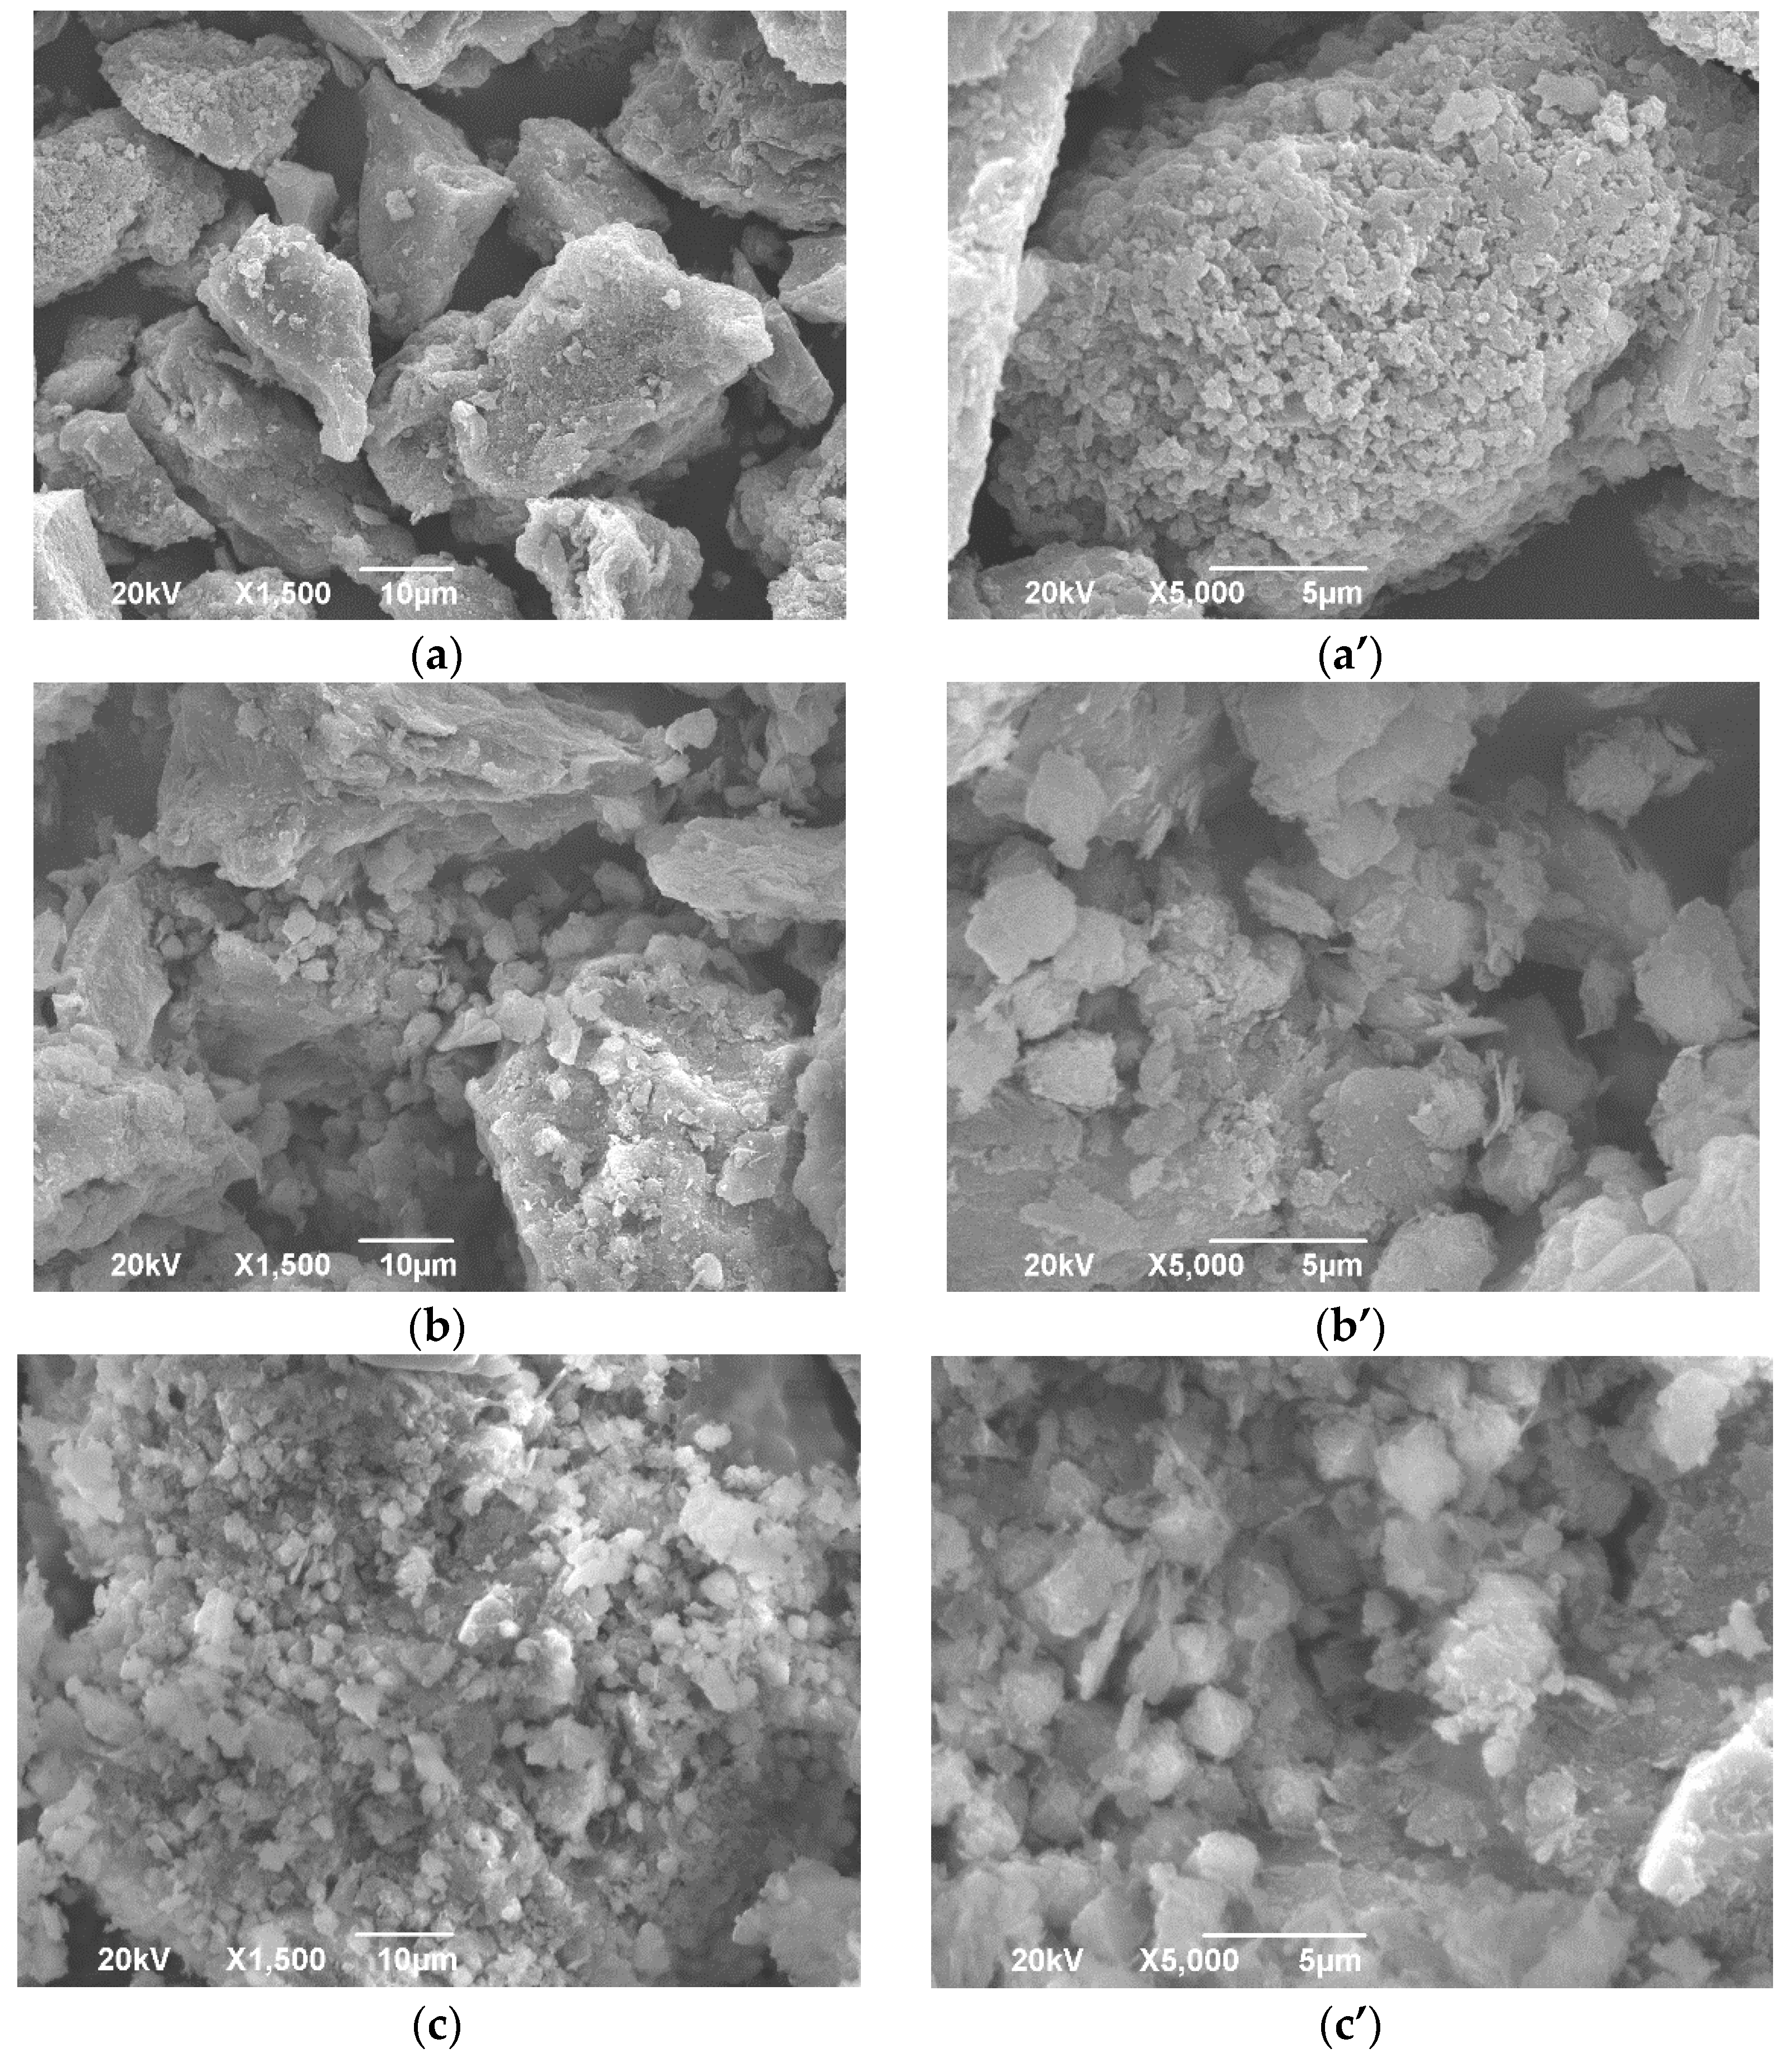
The samples for the DRIFT technique were mixed with KBr. By application of this technique the need for pelleting of samples was avoided. Contrary to the FTIR, the DRIFT technique can outdo the spectra in increased resolution and lower interference from water bands [42], but DRIFT spectra can be exposed to dissimilarity in the spectra due to sample particle size differences. That problem recurs throughout the pellet production. The DRIFT spectra in this research were obtained using the Perkin-Elmer FTIR spectrometer, Spectrum Two. The spectra of samples were scanned at 4 cm−1 resolution and collected in the mid-IR region from 4000 to 400 cm−1.

2.7. SEM Analysis

SEM analysis was used to determine the morphological characteristics of the samples, and EDS was used to determine the semi-quantitative chemical composition. Samples were Au coated prior to analysis and analyzed using the Scanning electron microscope model: JEOL JSM 6390 LV under a low vacuum with a backscattered electron detector and electron acceleration voltage of 25 kV. The EDS spectra were collected by scanning a certain area of the surface.

3. Results and Discussion

3.1. Characterization of the Adsorbents Samples

3.1.1. X-ray Diffraction

As can be seen from the identified phases of the powder diffractogram (Figure 1), the clay mineral phases represented in both clays were: kaolinite and illite, while quartz was the secondary mineral that accompanied these clay samples [43]. In the sample of Serbian clay (D), slightly more peaks belonging to the illite phase were identified, indicating a probably slightly higher content of illite in this sample compared to the sample of German clay (G). The kaolinite clay used for this research has already been described [26], and depending on the sampling locality of the clay itself, the results pointed to the illite phase, which occurs in different proportions in the sample itself [26,44].
Kaolinite and illite are clay minerals with a layered structure. From a chemical point of view, these are hydrated silicates of K, Na, and Mg, and from a chemical and structural point of view, these minerals have a significant content of OH groups. Clay minerals from a structural point of view can be represented as different orientations and interconnections among the octahedral and tetrahedral layers in the structure [45]. Figure 2 illustrates the crystal structure of kaolinite and illite.
The quartz represents the main crystalline residue in the amorphous geopolymer matrix. During the activation process, quartz (Figure 3) contributes with the share of silica in addition to the activation solution; however, it is not completely degraded. For this reason, it can be said that the geopolymer structure is semi-crystalline, where the intensity of the main quartz peak decreases and the baseline increases, i.e., the amorphous part on the diffractogram [46].
XRD results of geopolymer samples are shown on Figure 4. Based on the X-ray patterns of samples, the presence of a mixture of different zeolitic phases, obtained after alkaline activation of kaolinite and thermal treatment is noticed.
During the addition of Si, Al, and Na in excess during the formation of geopolymer, the formation of most likely synthetic faujasite (Zeolite with X type of structure) occurs in the geopolymer matrix. These characteristics of zeolite formation from a matrix rich with Si, Al, and Na have already been described by other authors [47]. The sample GPS consists mainly of three phases—faujasite, quartz, and paragonite. Faujasite has the chemical formulae Na2Al2 Si4O12 · 8 H2O and represents sodium aluminum silicate hydrate. Paragonite represents Na-rich mica mineral, by weathering its converts with its analogue illite [48]. Paragonite is sodium dialuminum phyllo-decaoxodihydroxoalumotrisilicate and with the zeolite group of minerals can also be found in the geopolymer matrix.
All identified phases represent sodium aluminosilicates. Samples GPGC and GPG are very similar in terms of their phase composition where, in addition to quartz, which is the common phase for all three samples. The zeolite X phase was also identified; this phase, together with zeolite Y, belongs to the family of aluminosilicate molecular sieves with a faujasite-type structure (FAU). It is characterized by the formula (Ca, Mg, Na2). Identified types of zeolites can be synthesized using kaolinite clay with an activation solution, such as the geopolymerization process with included thermal treatment [44,49].
In the amorphous structure of geopolymers, it appears that the negative charge is not localized, and it is more or less uniformly distributed in the framework. The Si4+ and Al3+ cations in the framework of aluminosilicate geopolymeric gels are tetrahedrally coordinated and linked by oxygen bridges. The negative charge on the AlO 4–group is charge-balanced by alkali cations (typically Na+ and/or K+). Geopolymers can also be viewed as amorphous analogs of zeolites, capable of cation exchange and possessing catalytic properties [27]. Based on the XRD analysis, we found the presence of zeolite in the GPG and GPGC samples, which additionally influences these two adsorbents to show better adsorption properties. DRIFT analysis confirmed the Al-Si-O amorphous structure, which is also responsible for the adsorption of the tested copper ions. Carbon cloth can adsorb small but signification quantities of Cu(II) ions from aqueous solutions. It is well known that the most common functional groups on the carbon surface are carboxyl, lactonic, carbonyl, and phenolic.
Figure 5 illustrates the structure of sodium rich zeolite Fujasite and Paragonite.

3.1.2. DRIFT Analysis

DRIFT is a fast and non-destructive way of evaluating clay minerals and their products [50]. DRIFT analysis results for GPS, GPG and GPGC are shown in Figure 6a–c. In the process of geopolymerization, dissolution of the raw aluminosilicate material took place. Silica and alumina were released and reacted to form a geopolymer gel which is subject to condensation to form a geopolymer. The basic steps of geopolymerisation involve dissolution of solid alumino-silicate oxides in MOH solution (M: alkali metal), diffusion or transportation of dissolved Al and Si complexes from the particle surface to the inter-particle space, formation of a gel phase resulting from the polymerization between added silicate solution and Al and Si complexes, and finally, hardening of the gel phase. The following reaction scheme was proposed by Xu and Van Deventer (2000) [51] for the polycondensation taking place during geopolymerisation of minerals:
Al–Si material (s) +MOH (aq) + Na2SiO3 (s, aq)
Al–Si material (s) + [Mz (AlO2) × (SiO2)y · n (MOH) · m(H2O)](gel)
Al–Si material (s)[Ma ((AlO2)a (SiO2)b) n MOH · m(H2O)]
DRIFT results of geopolymer samples are not so easy to explain. The movement of some peaks, as well as the formation of new ones and the disappearance of some derived from the starting compounds point to the growth of newly formed geopolymers [52]. For geopolymer samples, a broad band around 3000–3450 cm−1 and a band around 1650 cm−1 usually appear. In our case the region 3000–3450 cm−1 is covered by noise, but there are indications of the existence of a broad band in this region in the GPS and GPG samples. These two bands can be attributed to stretching vibrations of –OH and H–O–H groups, respectively [53]. The band at 2352 to 2371 cm−1, which correlates with to the –CH stretching vibration with a strong hydrogen bond, is most pronounced in geopolymer GPS while it is almost non-existent in geopolymer GPG [54]. The band at about 1450 cm−1 corresponds to the stretching vibrations of (CO3)2– groups in carbonates [55]. A powerful peak at closely 1000 cm−1 of DRIFT spectra is joined with Si–O–Si asymmetric stretching vibrations, which is one of the fingerprints of geopolymerization [56].
The displacement of vibrational bands matching Si–O–X (X is Si, Al or O) bond stretching to lower wave numbers point to the elongation of the bonds, as well as the shrinkage of the bond angle [57]. In our case, a shift of the vibrational bands corresponding to Si–O–X stretching was observed. In the MK sample, the Si–O–Si band appears at 1063 cm−1 while in the activated samples it moves to lower wave numbers [32]. In the analyzed geopolymer samples, these bands were indicated at around 1022 cm−1 and 1024 cm−1. This movement is due to the creation of Al–Si gel, which indicates the condensation of Si–O as well as SiO4 and AlO4 tetrahedra in the new network, geopolymeric network [55].
In the part of the spectrum corresponding to wave numbers at 1220–1000 cm−1 there are two wide bands: Si–O and Si (Al)–O stretching vibrations [56,57]. The typical AlIV absorption detected in metakaolin at 806 cm−1 was superseded by some smaller bands on the 600 to 800 cm−1 scale after geopolymerization. The band at about 460 to 600 cm−1 is due to the bending of Si–O vibrations, Si–O– (Si, Al) bonds. The presence of quartz was confirmed by vibrational bands from 790 cm−1 to 804 cm−1; this was also observed by XRD analysis. In the DRIFT spectrum of geopolymer samples between 900 cm−1 and 1300 cm−1 there is a clear band associated with Si–O–M (M = Si or Al) asymmetric vibrations [58]. The peaks mentioned above are characteristic peaks that indicate that a geopolymeric structure has been created. The band at 700 cm−1 refers to the bending vibration of Si–O–Al, which is an indication that there is a reaction between the original materials and the activator and the formation of an alkali-activated Si–O–Al structure [59]. In addition to the above, bands at 850–1030 cm−1 were also detected, which can be attributed to asymmetric vibrations of Si–O tetrahedron stretching, while the absorption peak at 795 cm−1 is directly correlated to the Si–O–Si symmetric stretching [60]. The band at 466 cm−1 is attributed to the deformation vibration (O–Si–O), while the band between 600 and 800 cm−1 can be attributed to the asymmetric stretching vibration of Al–O.

3.1.3. SEM Analysis

The morphology of synthesized geopolymers was investigated by SEM, as shown in Figure 7. The geopolymer samples (GPS, GPG, GPGC) were analyzed in a powder state. Amorphous, semicrystalline, and crystalline particles widened surrounded by the aluminosilicate gel of all the geopolymer samples. All of the crystalline, semicrystalline, and amorphous phases were mainly comprised of Si, Al, Na, Ca compounds, as claimed by results obtained from the EDS analysis. The presence of carbon in the GPS and GPG sample, according to the EDS analysis, suggests that certain of the compounds could be carbonates. Formation of Na2CO3 in the geopolymer samples is due to the existence of Na in the MS and MG samples and in the alkali-activators. Besides Na2CO3, calcite (CaCO3) was created in the geopolymer samples, GPS and GPG. Carbon in GPGC also originated from carbon cloth.
The structure of the geopolymer matrix observed by SEM microanalysis depends on the molarity of the NaOH solution and the Si/Al ratio in the geopolymer samples. Matrix structures of investigated geopolymer samples consist of crystalline phases of quartz and zeolite, fujasite and paragonite. Fujasite and paragonite are found especially in the geopolymer made from Serbian clay (GPS) (Figure 7a). The geopolymer synthetized from Germany clay and carbon cloth consists predominantly of crystalline phase zeolite (Figure 7c). The gel structure was formed mainly from Si, Al, Na; it represents the major product, besides the unreacted metaphase particles, among all the samples studied from this time period. The microstructures of all geopolymer samples were inhomogeneous. Figure 7a shows semicrystalline, unevenly formed, individually arranged particles of GPS samples. All observed particles were of various sizes and have porous surface structures (Figure 7a). The geopolymers synthesized from metakaolin of clay of Serbian origin are the most porous, which can be explained by the ratio Si/Al (2.10) [43]. Table 1 shows the elemental composition of all geopolymer samples as well as the ratio of Si/Al to Na/Al.
The existence of pores in the matrix of a geopolymer sample (Figure 7a’) shows the possibility of good adsorption characteristics of this geopolymer. The micrograph in Figure 7b is completely different from the one in Figure 7a. Unequally shaped low particles grouped together in agglomerates and singly arranged particles on the surface of great geopolymer plates are presented. In Figure 7b, groups of much larger particles can be seen, as well as smaller ones between them, which practically join them. The appearance of smaller particles on their surface is characteristic of this geopolymer. The geopolymer plates on the surface of the grate are obviously small particles of undissolved MG. Figure 7b’ shows the presence of a platy unreacted metaphase, as well as a dense amorphous, porous structure that is suitable for adsorption.
By adding carbon cloth to the metaphase of German clay, by alkaline activation, the microstructure of GPGC compared to GPG was changed (Figure 7c,c’), although the Si/Al and Na/Si ratios did not change. The structure of GPGC is more homogeneous, with a lot of small particles distributed throughout the surface of the amorphous gel structure. Figure 7c’ shows prismatic shapes which are most likely the result of the presence of crystalline phases of zeolite. Micro porosity is lower compared to the previous two samples.
Figure 7c shows a homogenous and less crystalline microstructure in contrast with the previous structure of two geopolymers (GPS and GPG). The amorphous phase formation is an outcome of the creation of alkali-activated products, C-(A)-S-H gel and N-(A)-S-H gel. Zeolite X is identified in the XRD analysis next to the sodium aluminate phases. The presence of zeolite phases leads to an interface between these zeolites and the alkali-activated matrix. An increase in the interface between phases gives space for essential weakness of the alkali-activated matrix, leading to low strength.

3.2. Adsorption Experiments

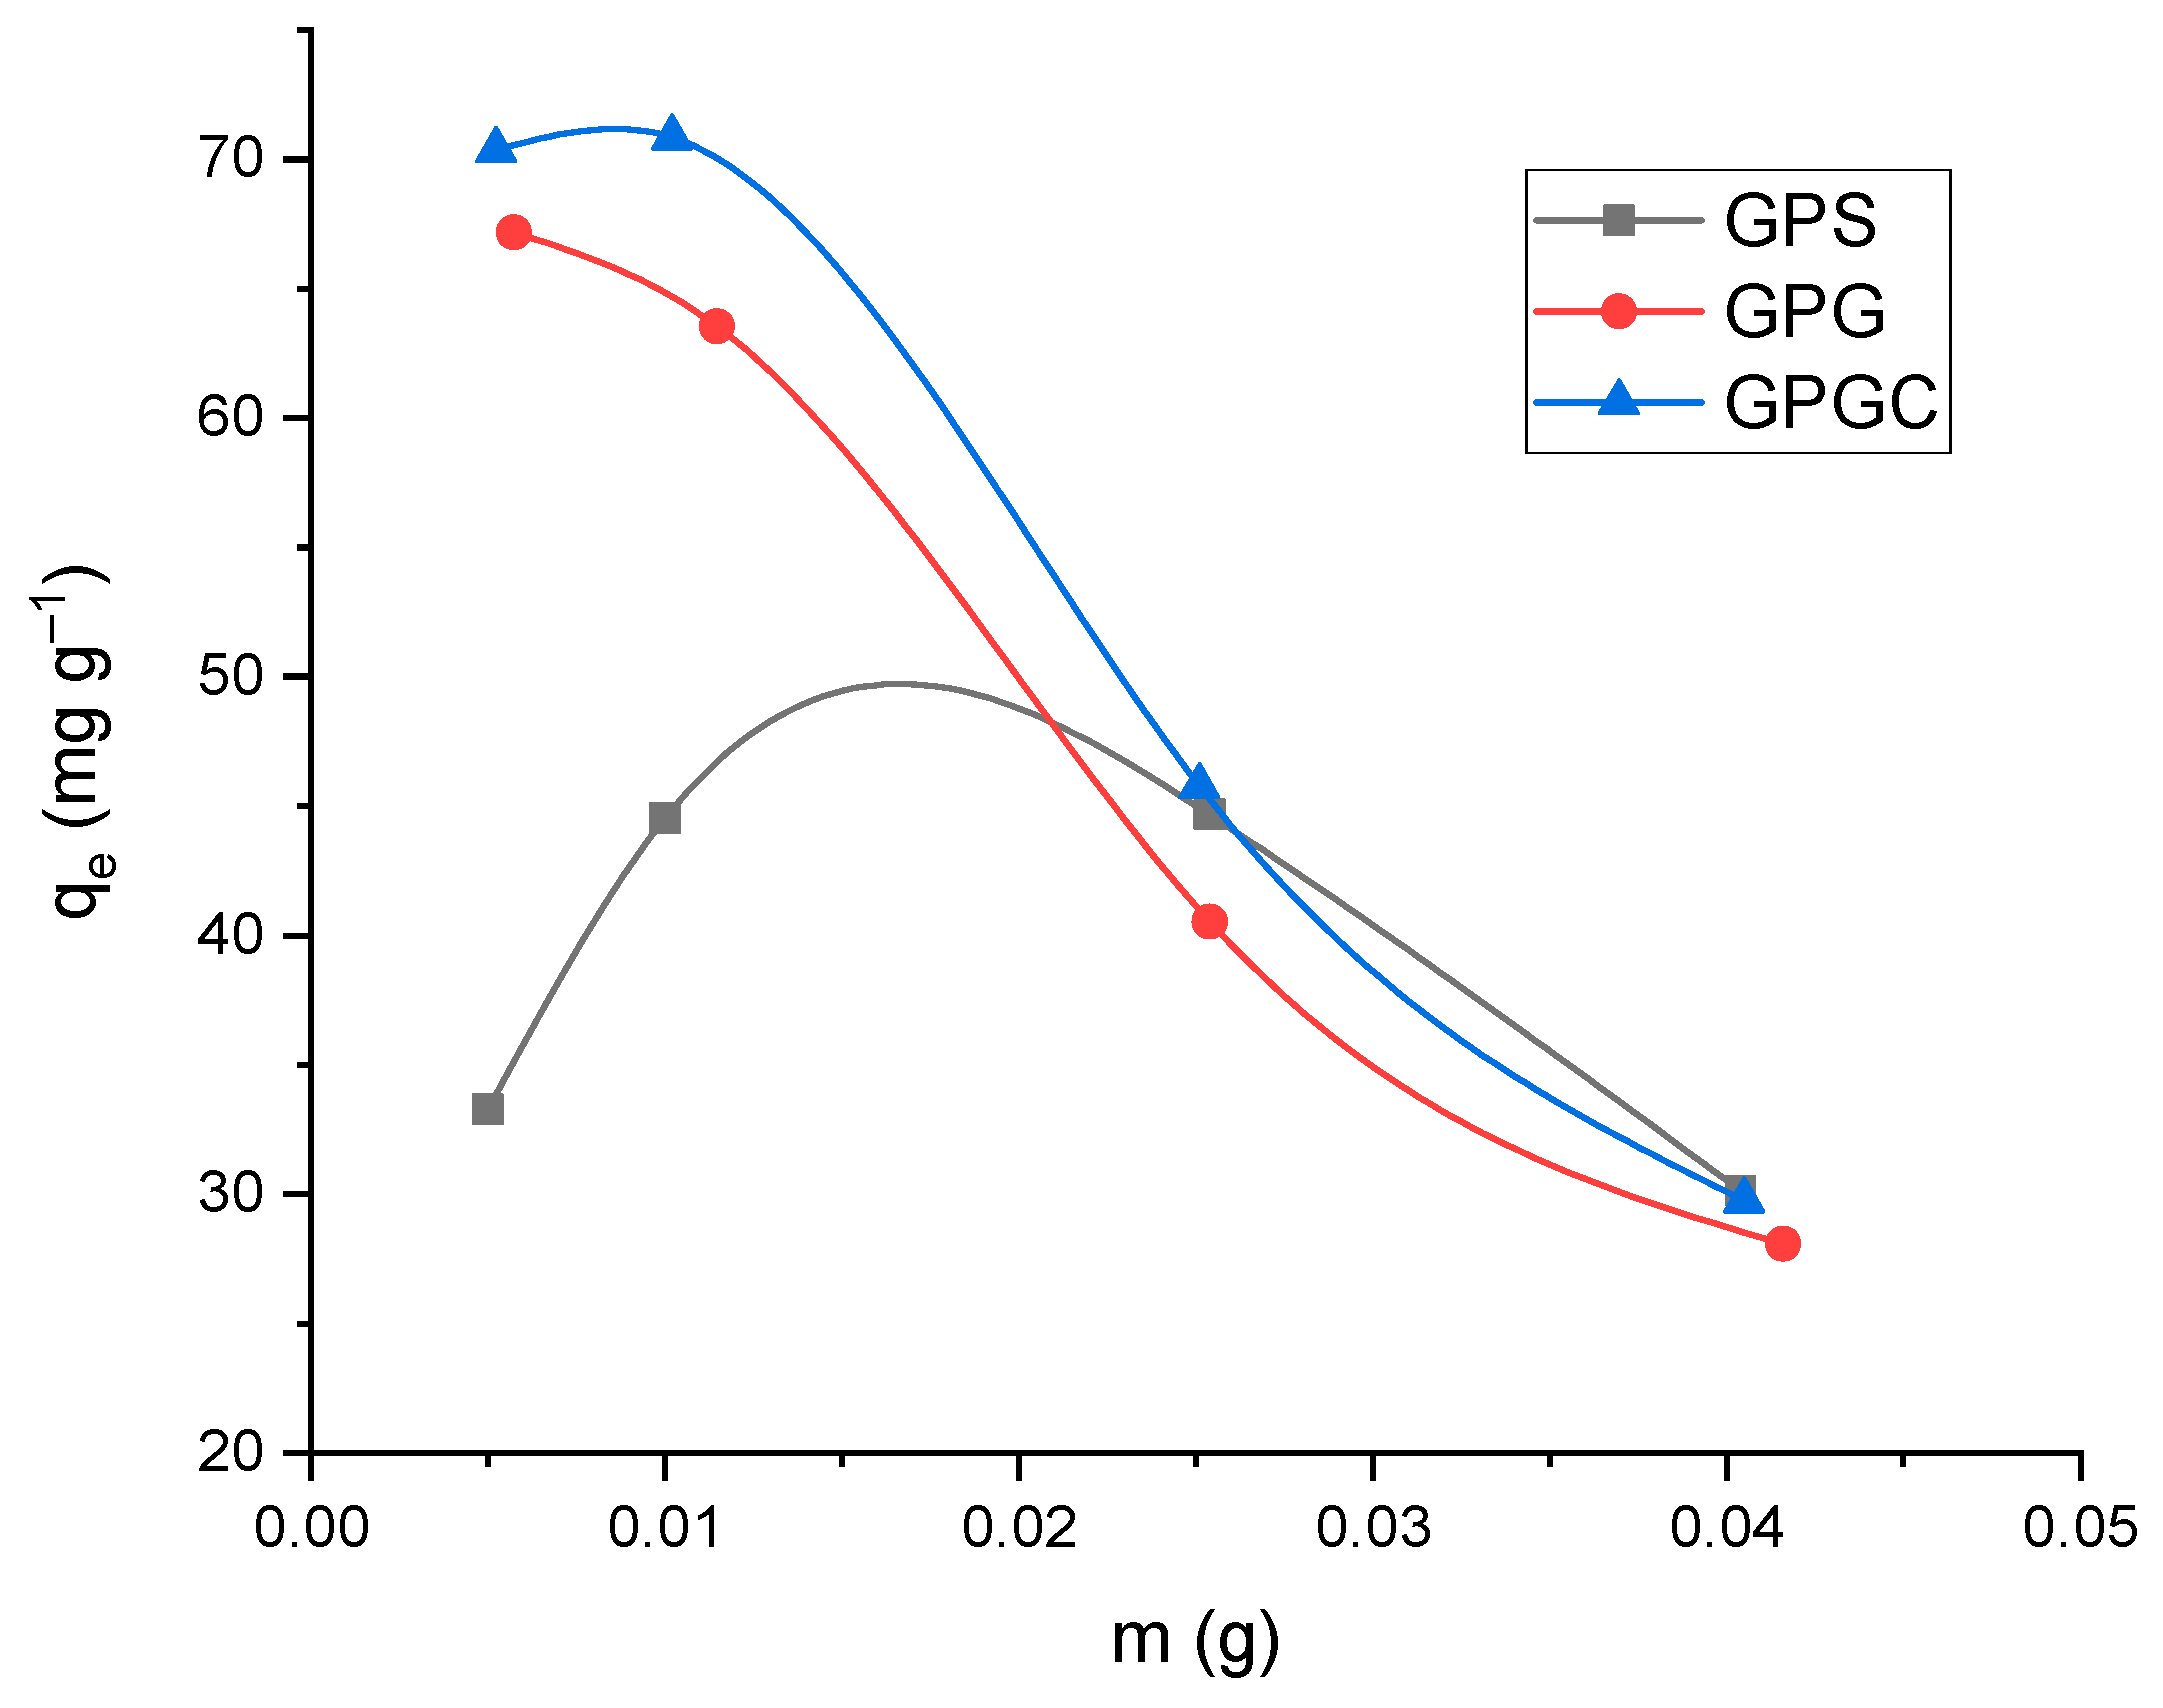
3.2.1. Effect of Adsorbent Dose

When the surface of a geopolymer is dry and subjected to fluids, the geopolymer adsorbs the fluid of the capillary structure [61]. From Figure 8 it was observed that the adsorption capacity decreased with increasing adsorbent dose. The amount of the adsorbed Cu(II) per mass unit of the adsorbent sample at equilibrium qe (mg g−1) was calculated according to Equation (3):
q e = c 0     c e V m
where c0 and ce (mg L−1) were initial and equilibrium Cu(II) ions concentrations, respectively, m is the mass of the adsorbent sample (g) and V is the volume of metal solution (L). Regarding the maximum adsorbent surface occupancy at GPS—the sample was at 0.015 g of the sample mass. At the highest doses of adsorbent, the adsorbent surface was fully occupied by Cu(II) ions, and the amount of metal on the adsorbent surface could not have been higher. Different adsorbent sample composition accounted for the different shapes of the plot qe vs. m by the GPS sample. The composition of the individual samples was described in Section 3.1. The most effective adsorbent was the GPGC sample, which is consistent with the theory of increasing the specific surface area by adding a carbon [62].

3.2.2. Effect of pH

The pH of the aqueous solution is a significant variable which controls the adsorption of the Cu(II) at the geopolymer–water interfaces. The theoretical calculated precipitation forms of Cu(II) in water solution are shown in Figure 9.
The visualization of precipitated forms was calculated with the software Visual MINTEQ v. 3.1 and the database minteqa.dat. From Figure 9 it is clear that the precipitated forms of Cu(II) begin at pH 6.5 approximately. The pH value in which the precipitated form was initiated depends significantly on the initial concentration of Cu(II) in the water solution, the temperature, and the atmospheric pressure. The data were interpreted as a function of qe or a percentage of a selected form of Cu(II) cation and pH value. The experimental results of pH value before and after the adsorption process showed that the pH values of approximately 5.4 after adsorption of Cu(II) by geopolymers samples agree well with the theoretical calculation of speciation processed as summarized in Figure 9. The precipitation process of Cu(II) ions in insoluble hydroxides of Cu start at pH values higher than pH = 6 [62,63,64,65].

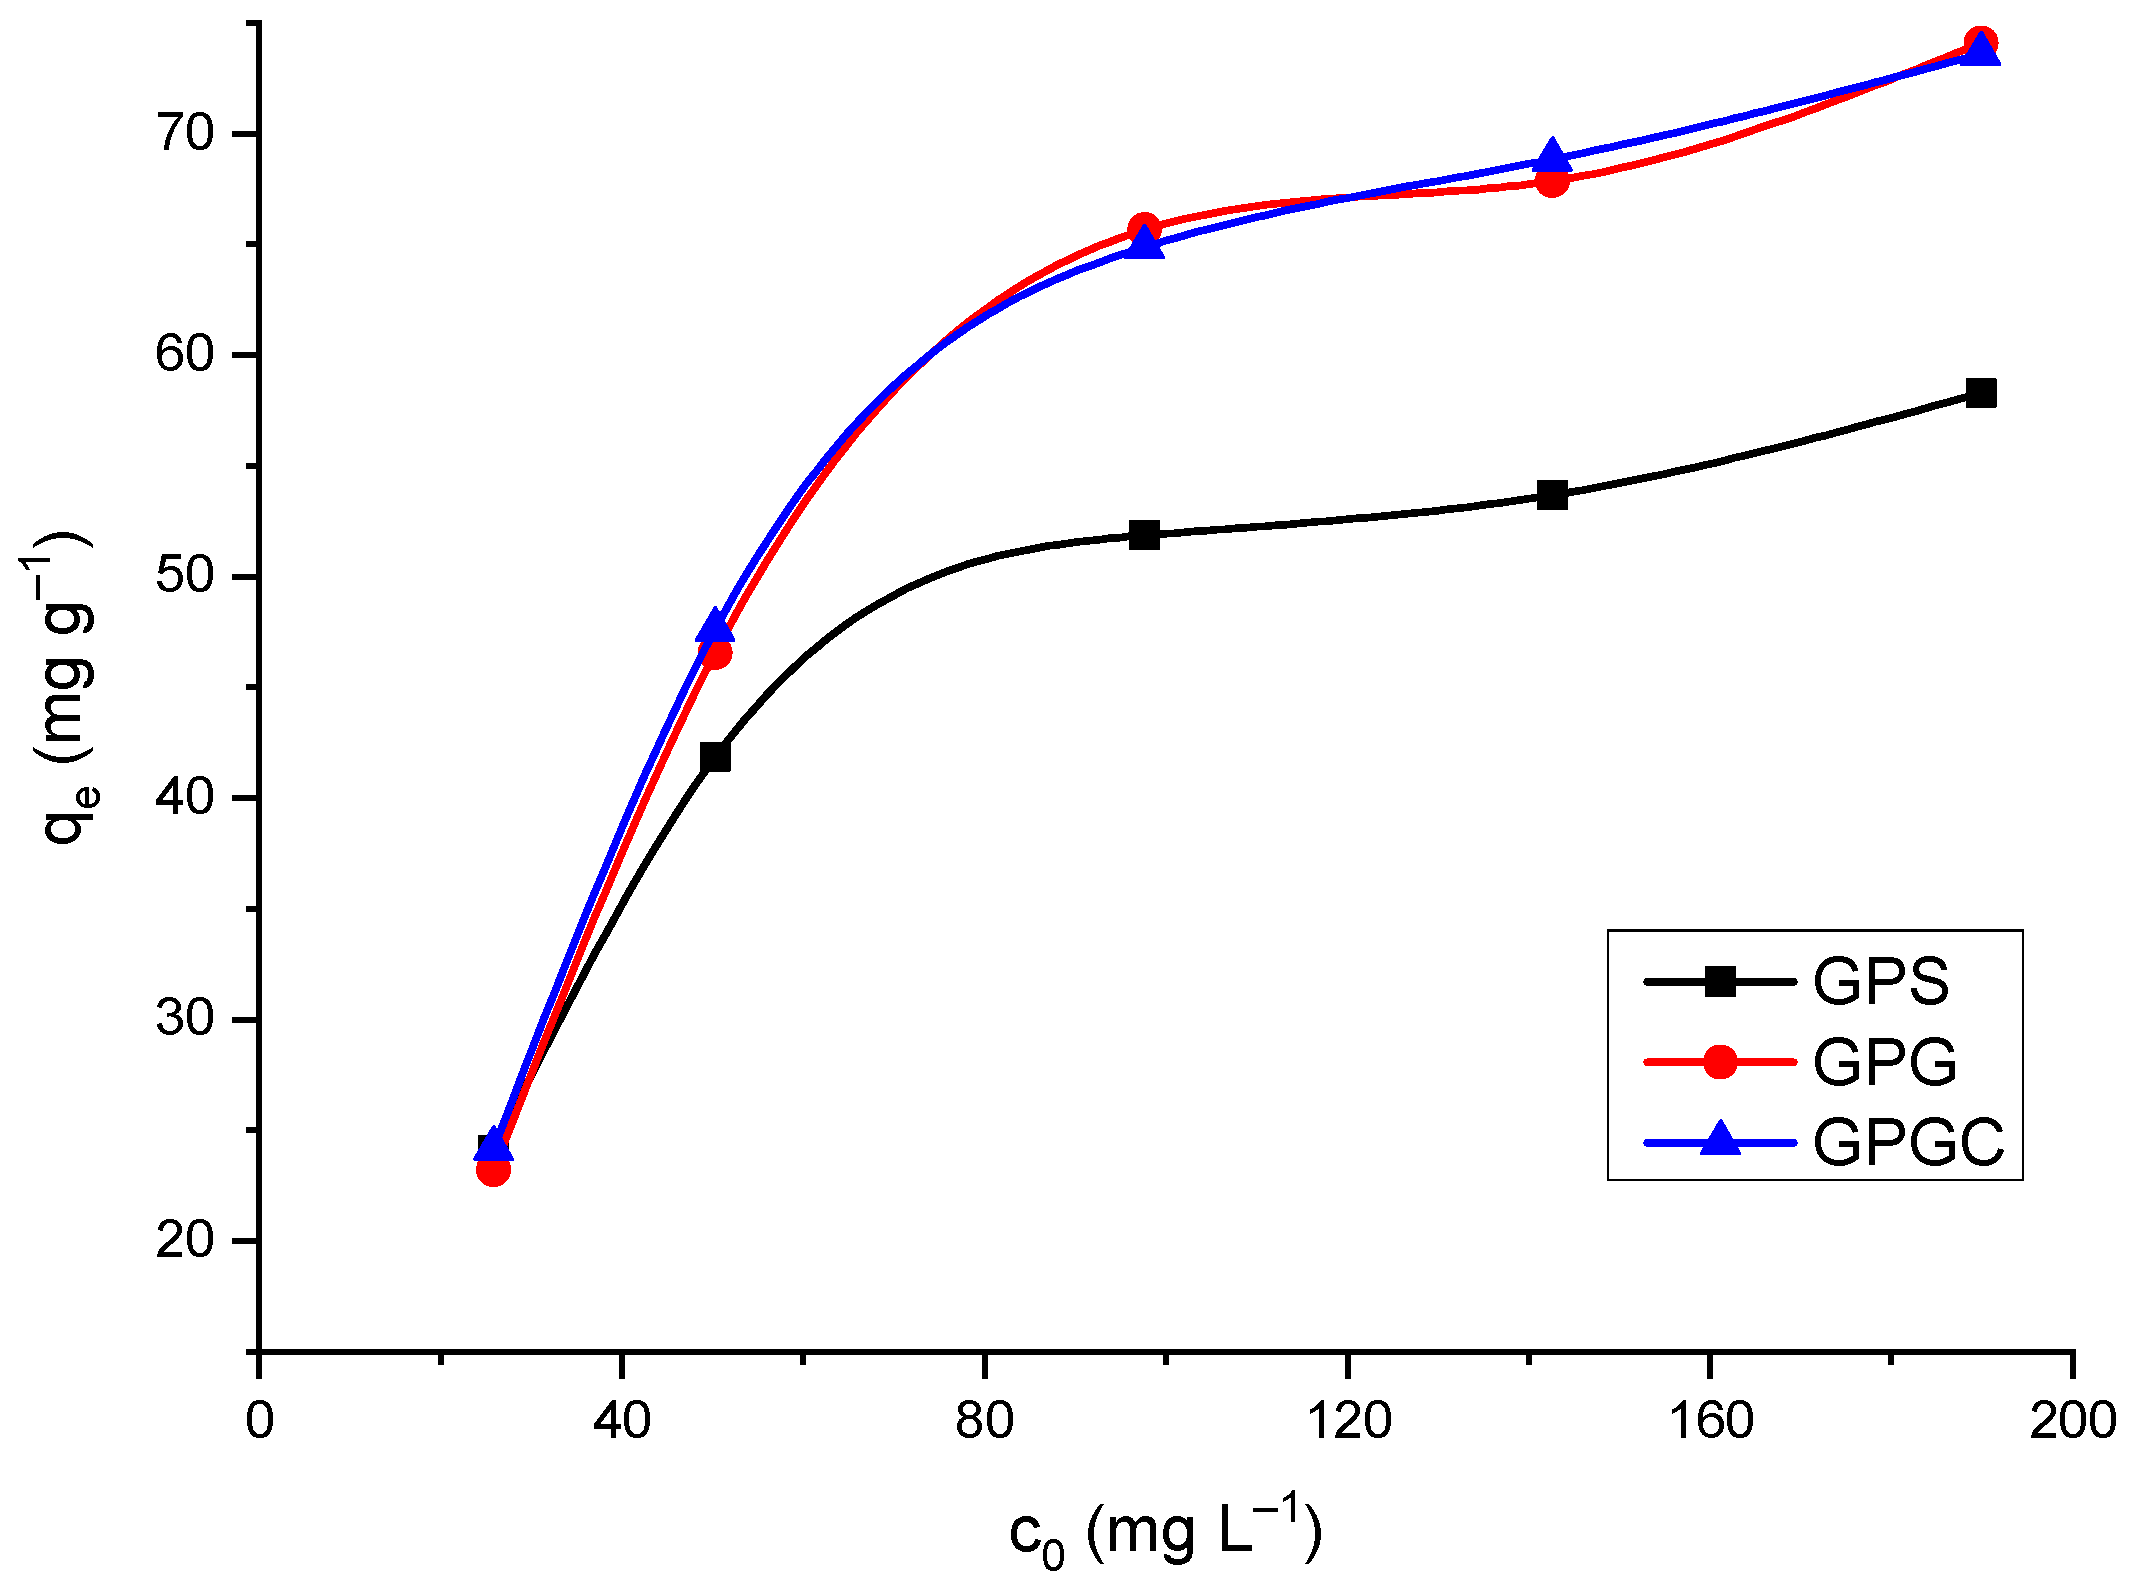
3.2.3. Effect of Initial Concentration Cu(II)

The influence of the initial concentration of Cu(II) on the adsorption capacity of geo-polymer samples was investigated in the interval of initial concentration of Cu(II) from 25 to 200 mg L−1 (Figure 10).
The dose of the geopolymers samples and volume of Cu(II) solutions was constant in all of the experimental tubes (0.025 g of geopolymers per 25 mL of the Cu(II) ions solution). Starting at a low concentration, the adsorption capacity increased significantly with increases in the initial Cu(II) concentration. When the initial Cu(II) concentration exceeded 100 mg/L, the adsorption capacity still increased gradually.
Higher equilibrium adsorption capacities (qe) were found for GPGC and GPG adsorbents (72.86 mg g−1, 70.29 mg g−1, respectively); GPS adsorbent showed lower efficiency with an equilibrium capacity of 58.30 mg g−1. The adsorption capacity of geopolymers can be expressed in percentages of adsorption. Figure 11 illustrates the dependence of adsorption % on the initial concentration of Cu(II) in solutions for geopolymer samples. The highest experimental adsorption capacity at a concentration of Cu(II) 25 mg L−1 had a geopolymer GPGC (96.92%); the lowest geopolymer GPS (85.93%).

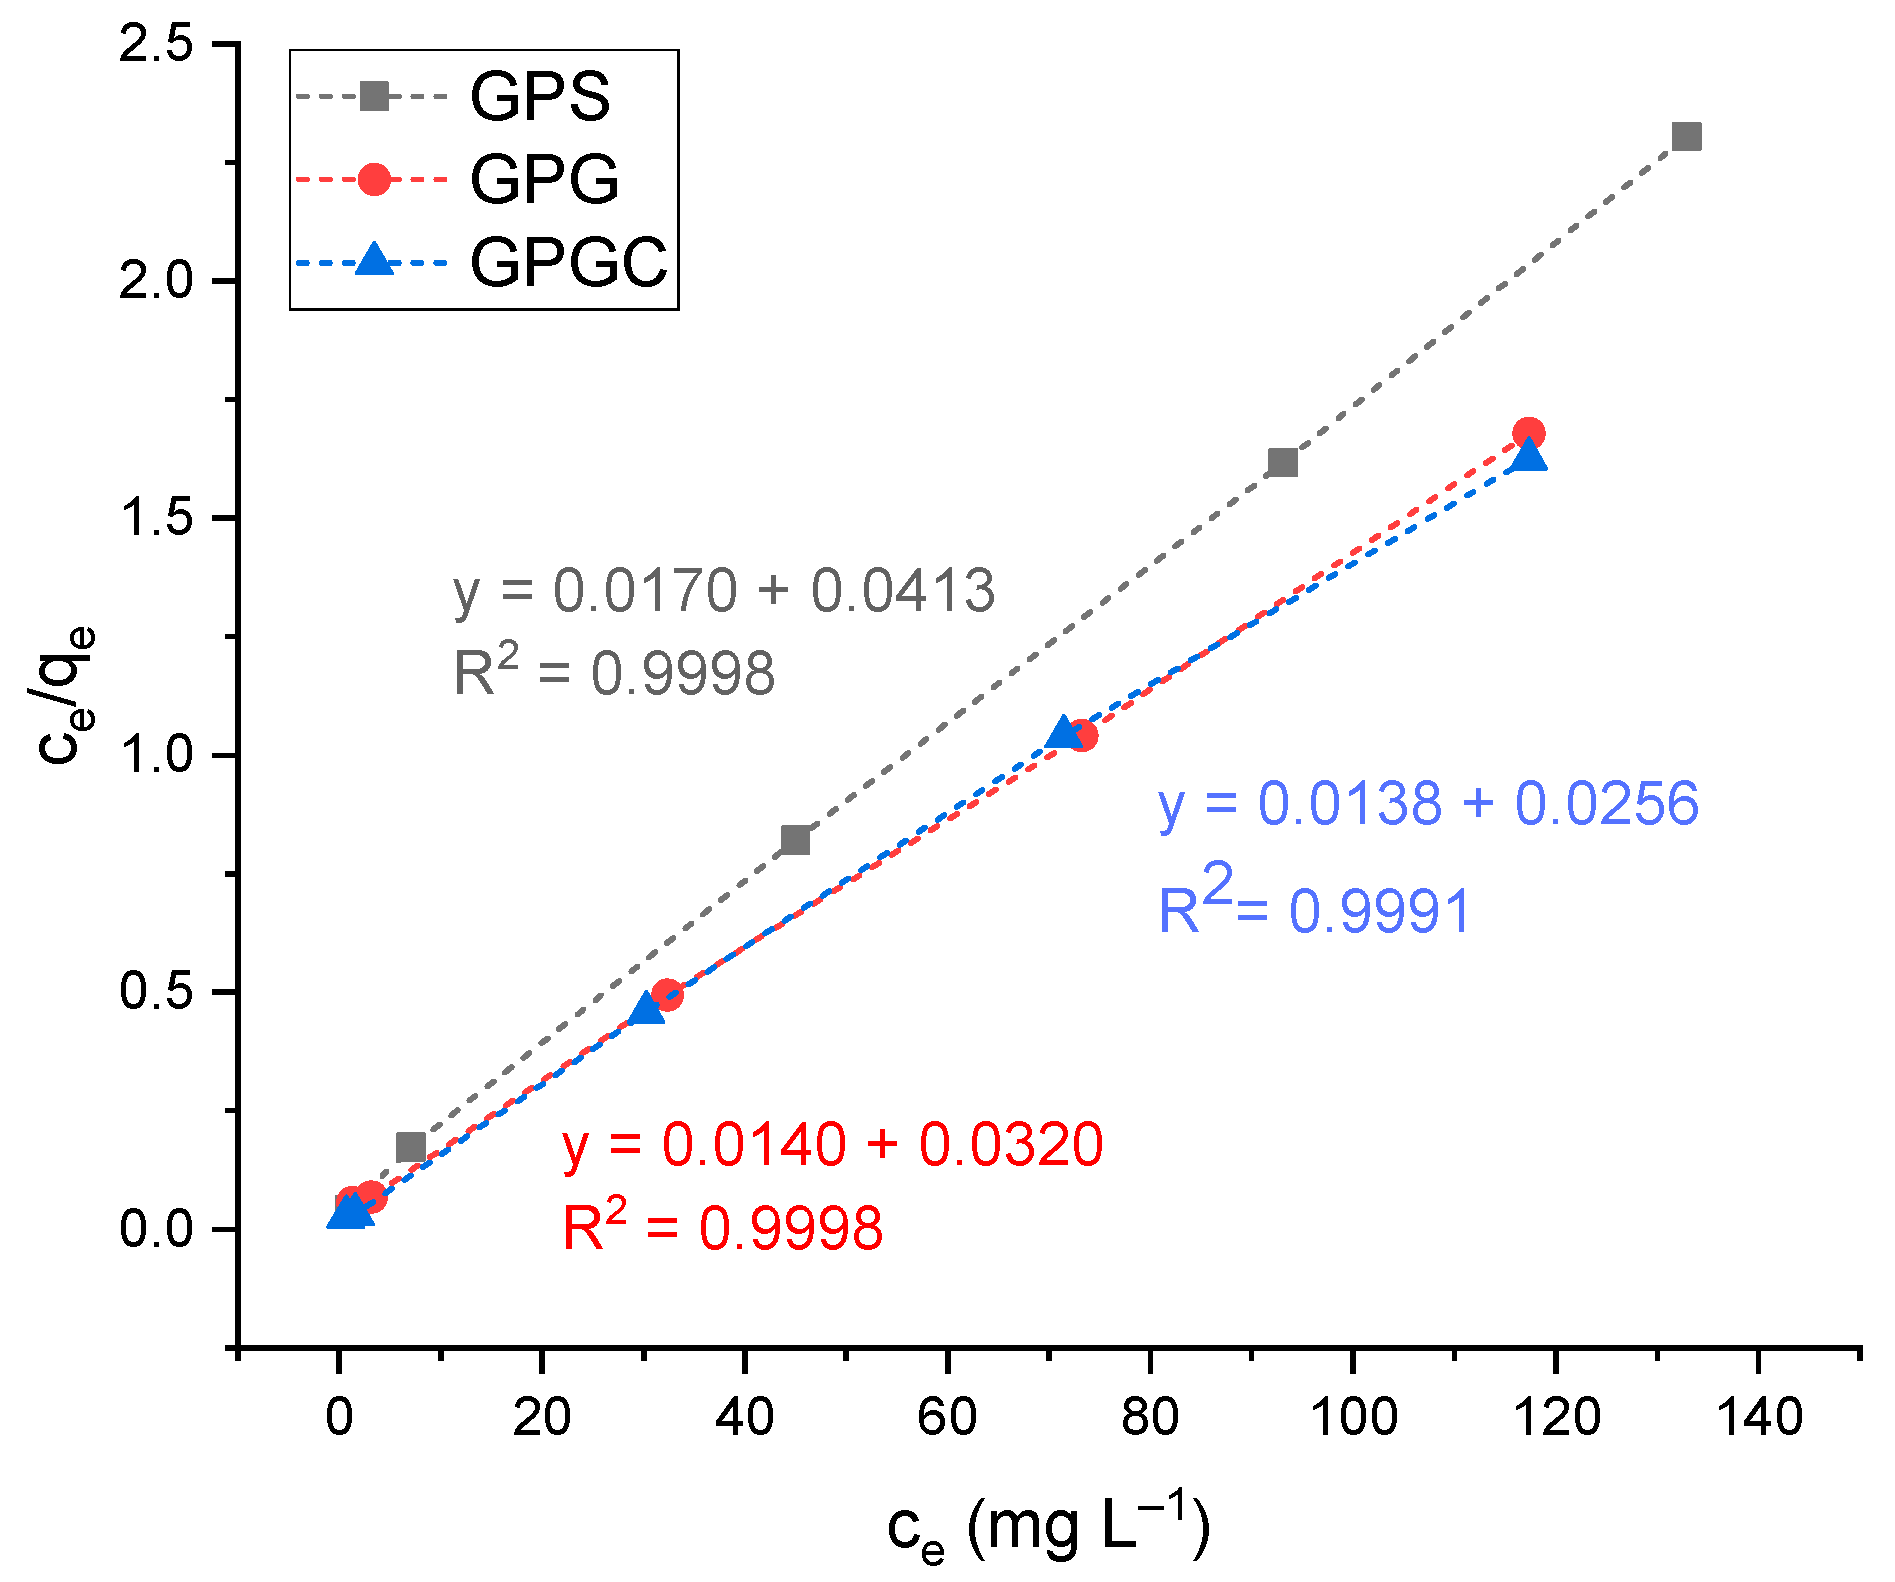
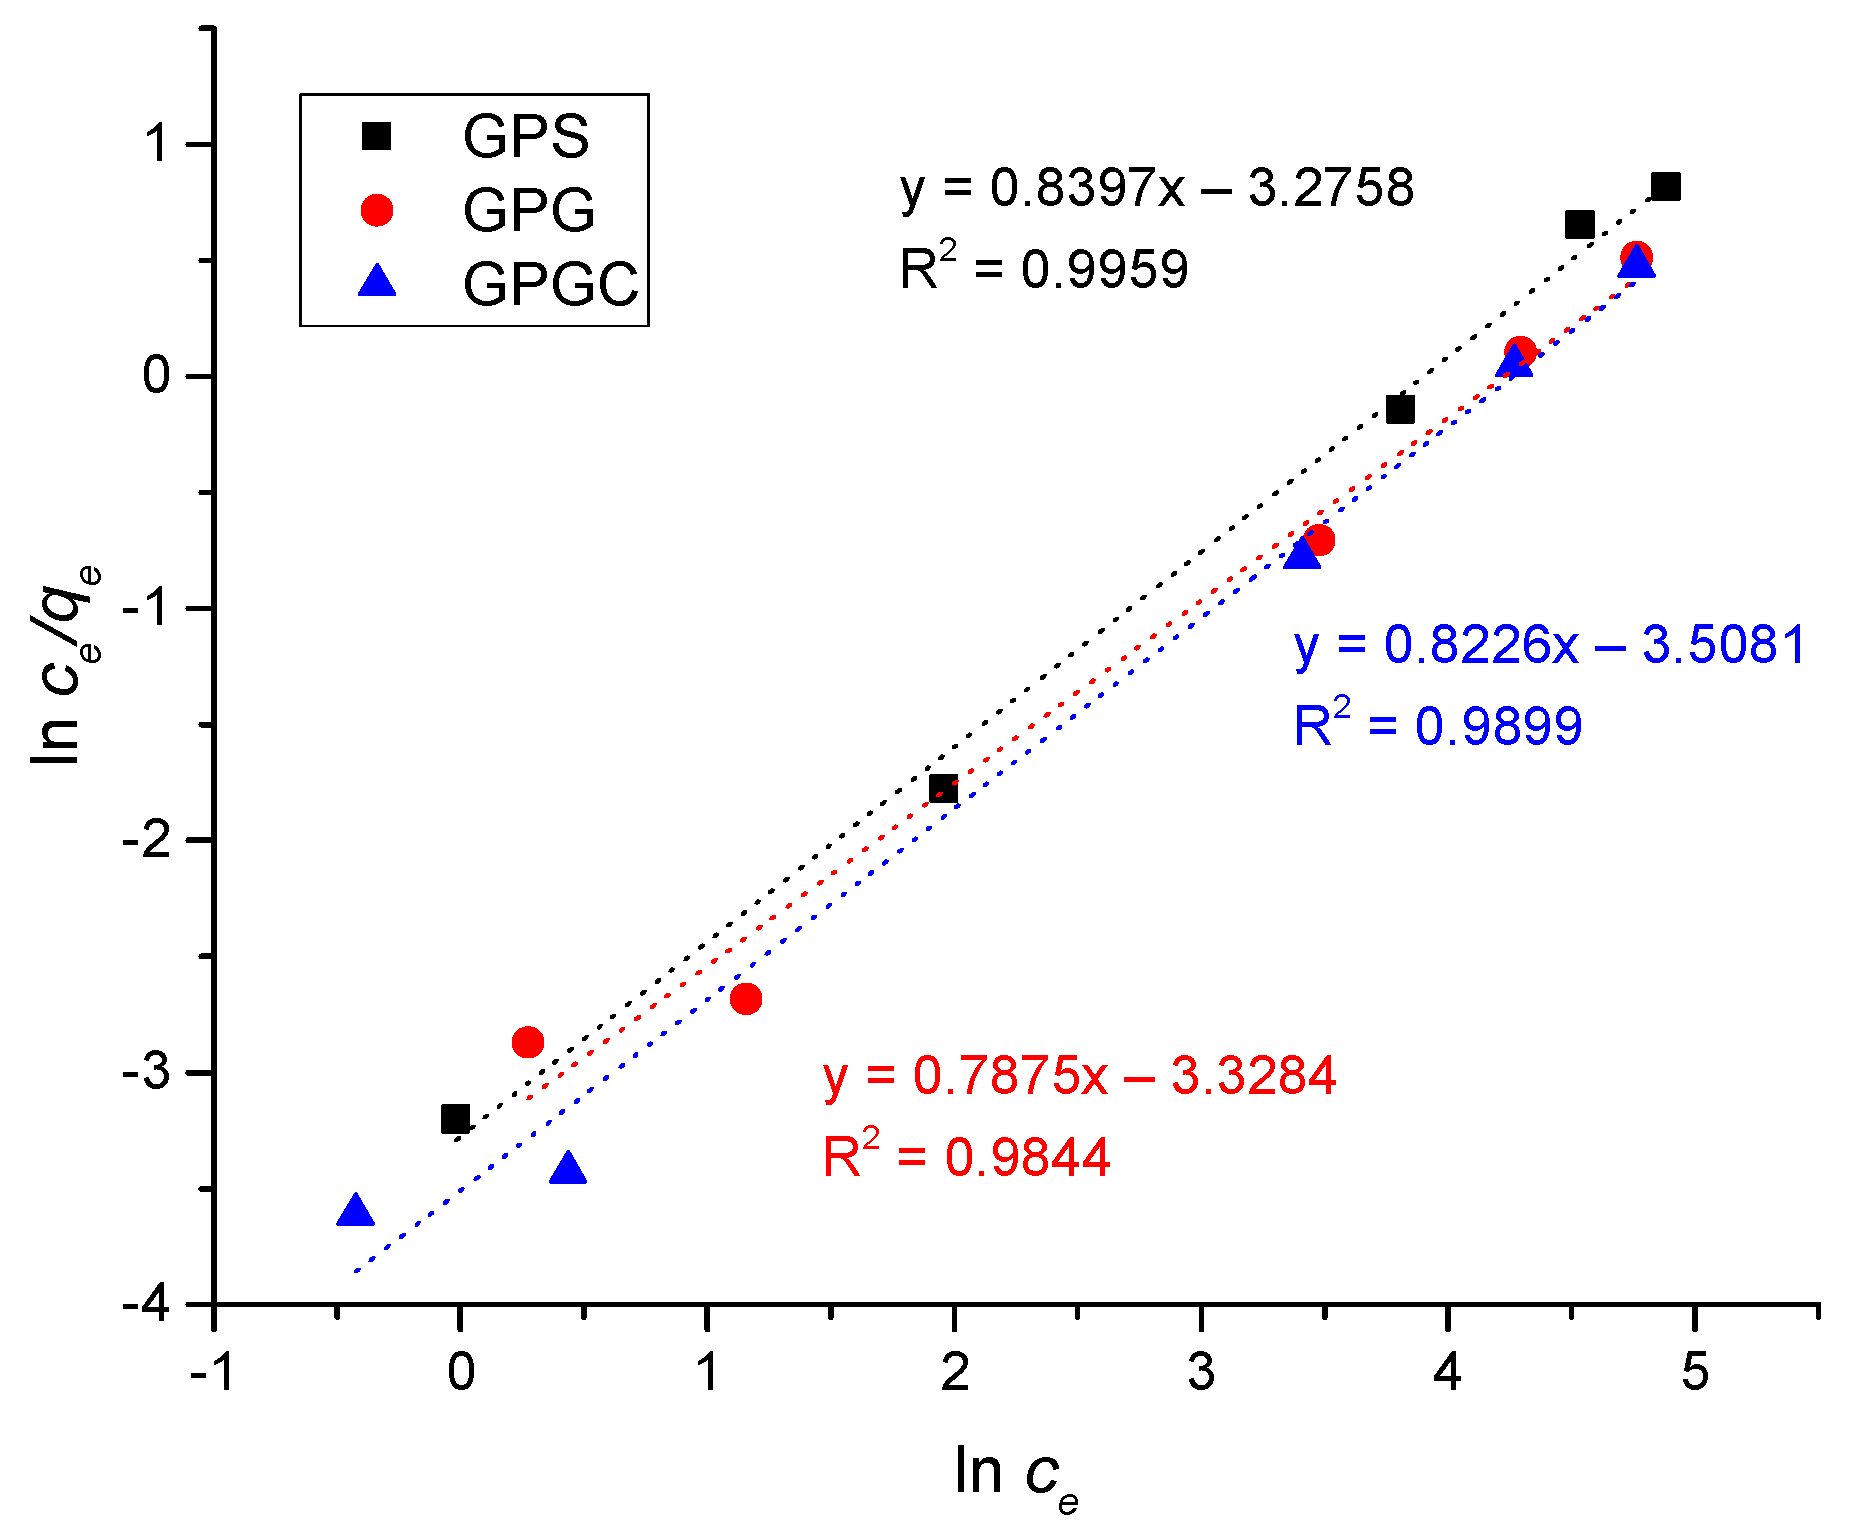
3.3. Adsorption Isotherms

The experimental adsorption data were fitted to linear forms of adsorption isotherms models. The data were calculated from selected adsorption isotherms models, using Equations (4)–(7) in Table 2 at the experimental temperature of 25 °C.
The experimental data were plotted for isotherm models (Figure 12, Figure 13, Figure 14 and Figure 15). By substituting them into the formulas, the parameters of the isotherms were calculated, which are listed in Table 3, where qe was the mass of Cu(II) ions adsorbed until the time unit per mass unit of geopolymer was in equilibrium. qm was the maximum adsorption capacity of the monolayer of used samples of adsorbent material (mg g−1); ce was the concentration of Cu(II) ions in the solution (mg L−1); b was the Langmuir constant related to the affinity of adsorbate-adsorbent (L mg−1) in equilibrium; 1/n, resp. n was an empirical parameter related to the intensity of adsorption (where for values in the range of 0.1 < 1/n < 1, adsorption is favorable); KF was the surface adsorption equilibrium constant (mg g−1); 𝐴 was the Redlich-Peterson isotherm constant (L g−1); 𝛽 was the exponent that lay between 0 and 1; 𝐾𝑠 was the Sips isotherm model constant (L g−1); 𝛽𝑠 was the Sips isotherm exponent; 𝑎𝑠 was the Sips isotherm model constant (L g−1). The alternative isotherms fit better for heterogeneous surfaces, while the Langmuir model fits better to experimental data of monolayer adsorption onto surfaces of geopolymers samples [66,67,68,69]. From the values is significant, that the data fitted the best to Langmuir isotherms (R2; GPS = 0.9998; GPG = 0.9998 and for GPGC = 0.9991).
The values of adsorption capacities for the adsorption of Cu(II) by geo-polymers used in the literature with geopolymers of the present study are summarized in Table 4. Although direct comparison is difficult, owing to the differences in experimental conditions, it was found that the adsorption capacities of geopolymers used in this work were comparable to geopolymers presented in Table 4.
The auxiliary hypothetical yield from Langmuir adsorption isotherm is the value of the dimensionless separation factor calculate RL, which characterizes the nature of adsorption within the Langmuir isotherm. This RL value was calculated from Equation (8) and their values appear in Table 5.
R L = 1 1 + b   ·   c 0
where b is the equilibrium constant calculated from Langmuir isotherm model (L mg−1) and c0 is the initial Cu(II) concentration (mg L−1). The results of RL factor reveal whether the adsorption process is favorable, by the condition: (0 < RL < 1), unfavorable—when the values of RL factor are higher than 1. The separation factor can be a theoretical tool for balancing a linear 1 < RL or irreversible (RL = 0) adsorption process. The calculated RL values at a concentration range from 25 to 200 mg L−1 of Cu(II) for used samples of geopolymers are shown in Table 5. The RL values indicate that the Langmuir model of adsorption isotherms is favorable—that is indicated by 0 < RL < 1.

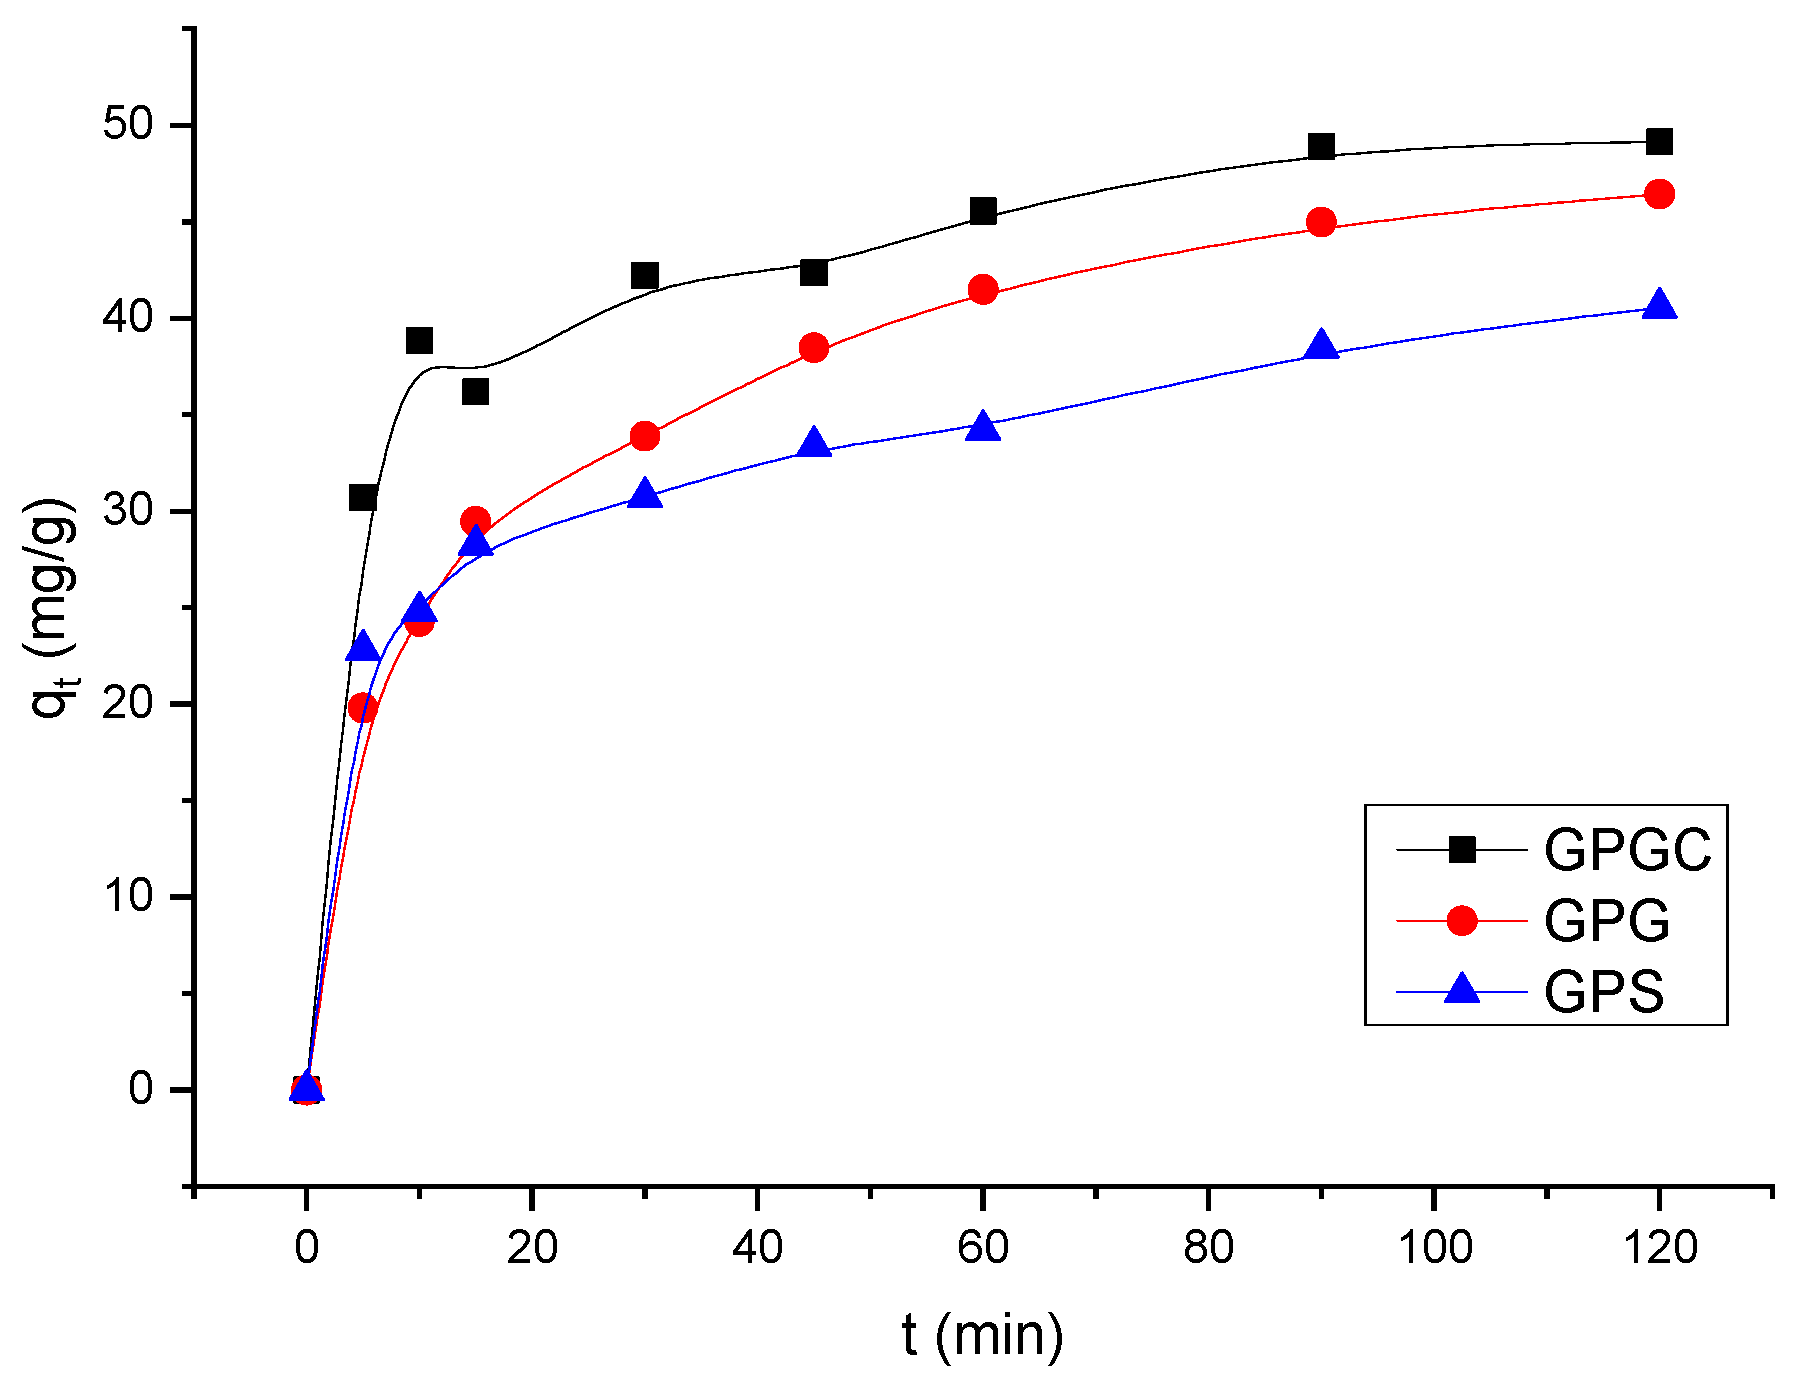
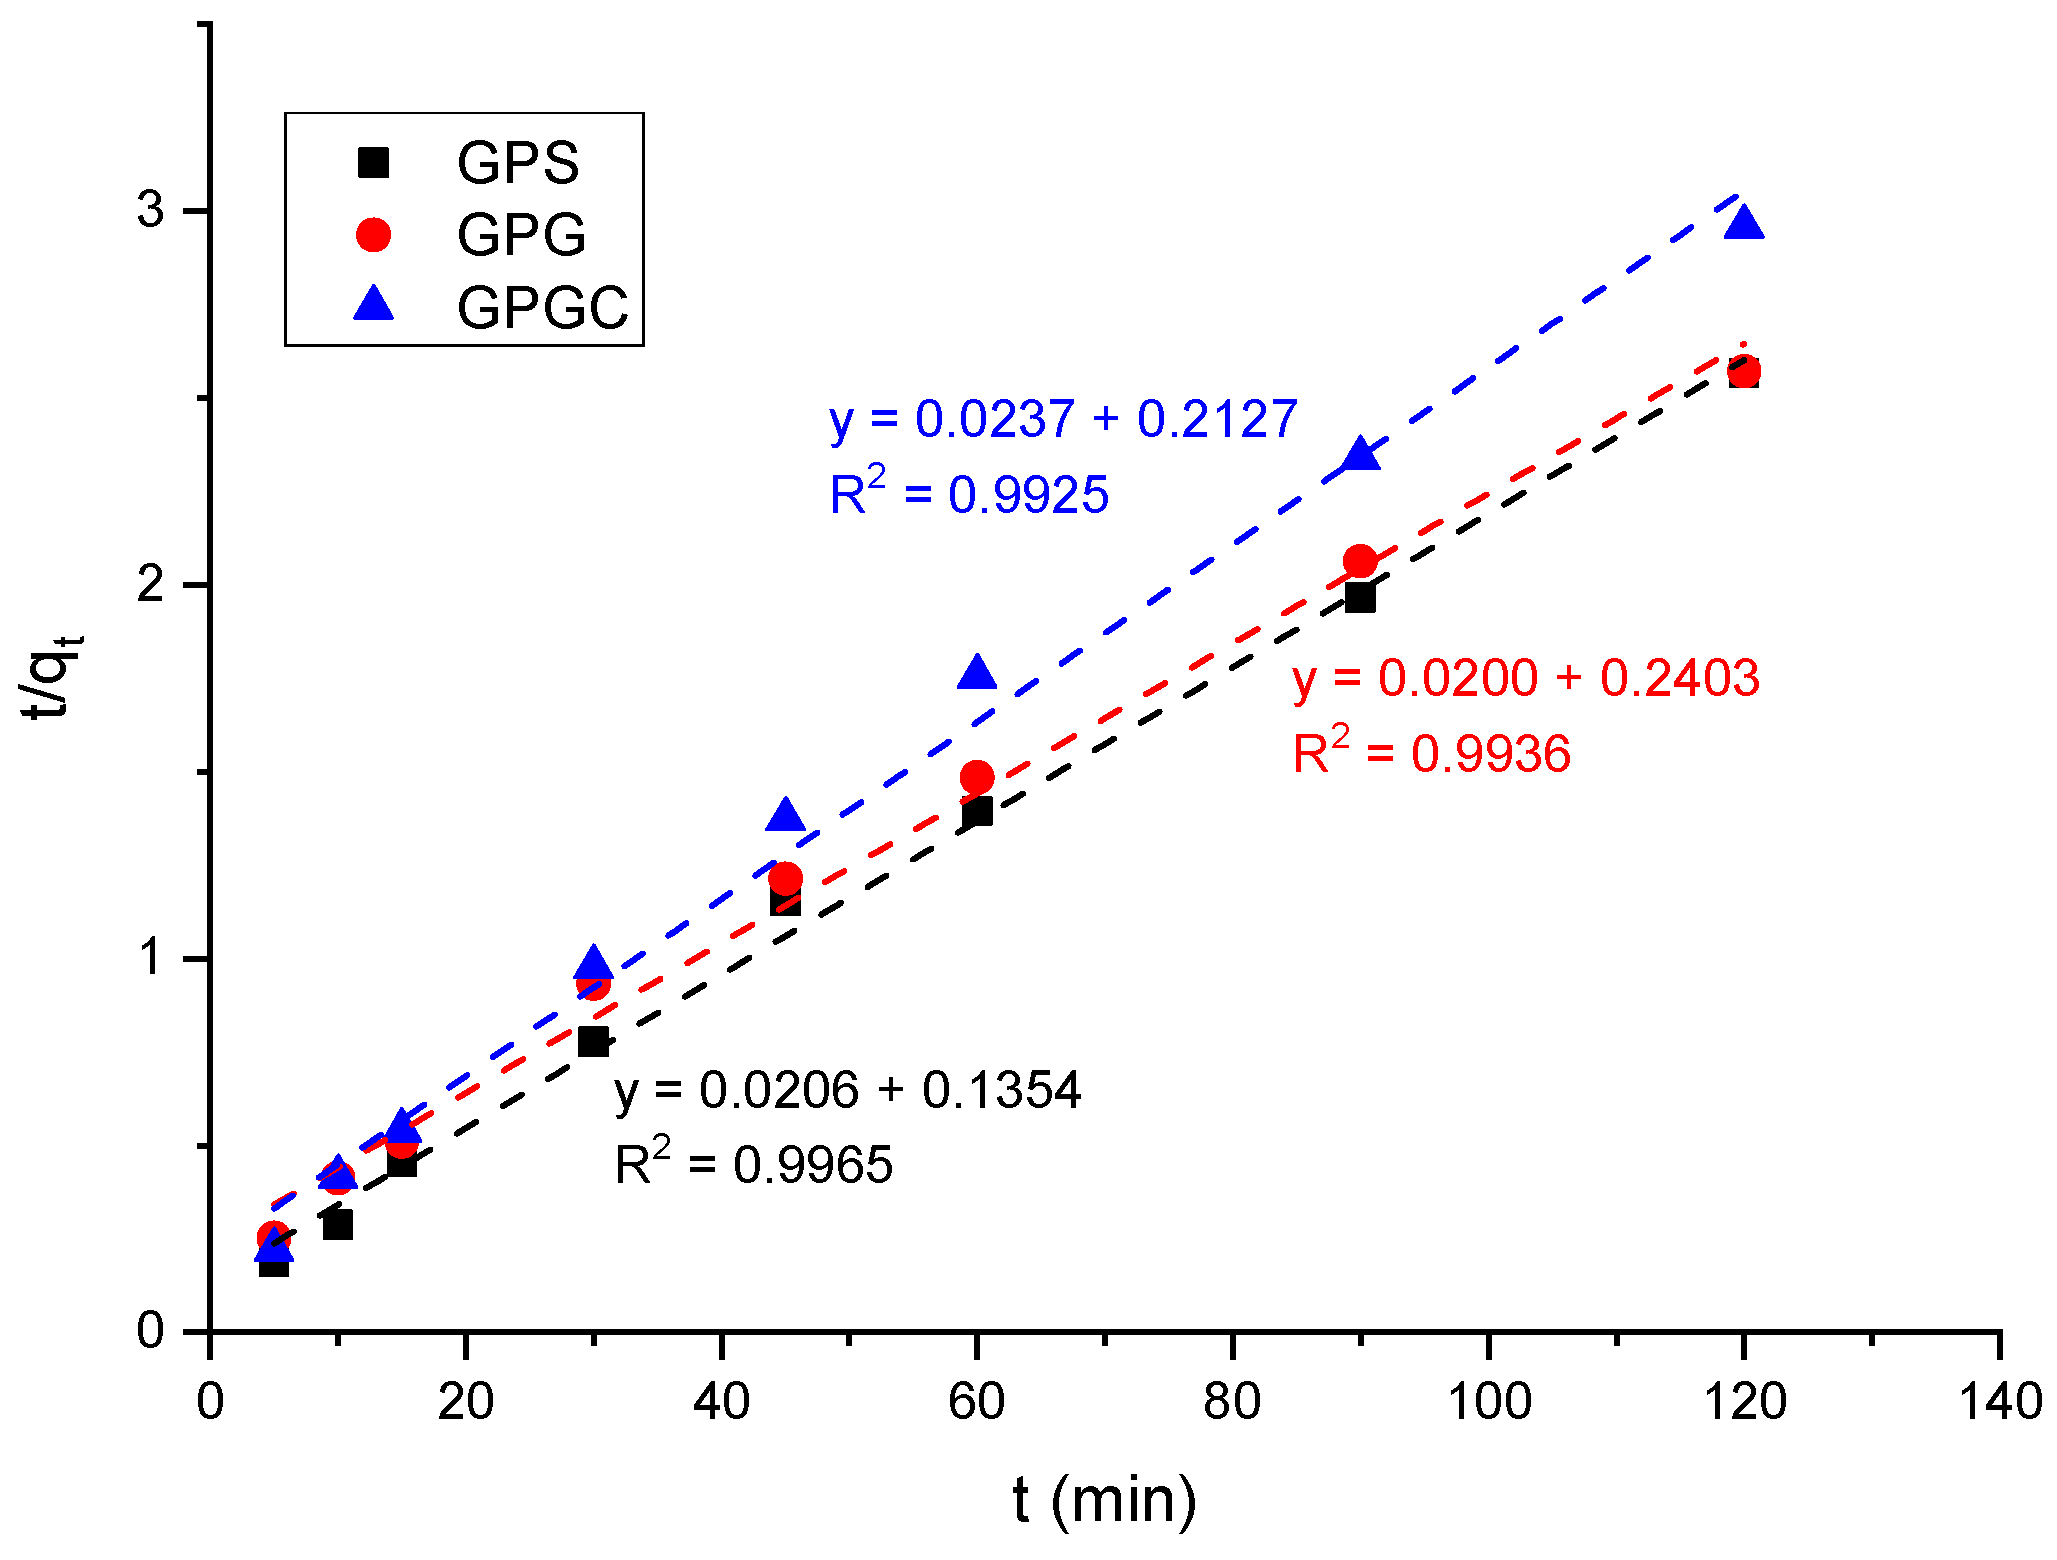
3.4. Kinetic Studies

The adsorption characteristics of Cu(II) by geopolymers depending on the reaction time (5–120 min) are shown in Figure 16.
The adsorption process was significantly fastest up to 30 min of contact time. Contact time longer than 120 min did not significantly influence the amount of adsorbed Cu(II) ions.
To explore the adsorption behavior, pseudo-first-order kinetic (Equation (9)) and pseudo-second-order (Equation (10)) kinetic models were utilized to examine the experimental data, which are described as follows:
ln q e q t = ln   q e k 1 t
t q t = 1 k 2 · q e 2 + 1 q e t
where qe and qt are the adsorbed amounts of Cu(II) at equilibrium and at the time t (mg g−1) respectively; t is the contact time (min); k1 is the pseudo-first-order adsorption rate constant (L min−1); k2 is the pseudo-second-order adsorption rate constant (g min−1 mg−1). The calculated values obtained from the linear plots in (qeqt) vs. time (t) did not agree with the experimental qe values, and the obtained R2 values are depicted in Table 6. The corresponding linear results were fitting for the pseudo-second-order presented in Figure 17 and Table 6.
The data in Table 6 show, significantly, that the correlation coefficients R2 (0.9925–0.9965) for pseudo-second-order models are higher than the R2 (0.1360–0.2039) values for pseudo-first order for adsorption Cu(II) onto used geopolymer samples. Comparison of experimental and theoretical data shows relative agreement. These results show that in terms of mechanism, chemisorption has a major influence—it controls the rate of the entire sorption process. Adsorption follows the pseudo-second order of the adsorption kinetic model.

4. Conclusions

Sorption performance of three synthetically modified geopolymers was studied for the adsorption of Cu(II) from aqueous solutions. All geopolymer samples were characterized by XRD, DRIFT, and SEM/EDS analysis. XRD analysis showed that all geopolymer samples represented sodium aluminosilicates. A strong band at 1000 cm−1 is associated with Si–O–Si asymmetric stretching vibrations, which is the one of the fingerprints of geo-polymerization. Vibrational bands in the region from 790 cm−1 to 804 cm−1 confirmed the presence of quartz, which was also observed by XRD. The appearance of carbon in GPS and GPG showed that the some of the compounds could be carbonates. In the amorphous phase, crystalline and semicrystalline particles are mainly Si, Na, Ca, Al compounds. By the SEM analysis, the presence of the platy unreacted metaphases, as well as a dense, amorphous, porous structure that is suitable for adsorption were observed. The adsorption capacity of used geopolymers followed the trend: GPGC > GPG > GPS. The adsorption capacity increased with increases from the initial concentration. Isotherm studies indicated that the Langmuir isotherm model fitted the experimental data better than the other models. The adsorption equilibrium was described well by the Langmuir isotherm model with maximum adsorption capacities of 72.86, 70.29 and 58.30 mg g−1 for Cu(II) on GPGC, GPG and GPS, respectively. The values of Ads. % were in accordance with this statement (96.92, 93.67 and 85.93% for GPGC, GPG and GPS, resp.) for the initial concentration of Cu(II) c0 = 50 mg L−1. The experimental and theoretical calculated data from the kinetics study are best fitted to pseudo-second order of adsorption process. To help summarize the presented study, the fact that all of the geopolymers used can be used for effective immobilization—adsorption of Cu(II) from aqueous solutions. The adsorption process of Cu(II) was favorable for all investigated geopolymer samples.

Author Contributions

Conceptualization, M.Š. and Z.M.; methodology, M.Š. and Z.M.; software, M.Š.; validation, M.Š., Z.M. and S.N.; formal analysis, M.Š., Z.M. and M.I.; investigation, M.Š., Z.M., M.M.M. and V.B.P.; resources, M.Š.; data curation, M.Š.; writing—original draft preparation, M.Š., Z.M. and L.K.; writing—review and editing, M.Š., Z.M. and L.K.; visualization, M.Š., Z.M. and S.N.; supervision, Z.M. and L.K. All authors have read and agreed to the published version of the manuscript.

Funding

This research was funded by the Scientific Grant Agency of the Slovak Republic VEGA, Project No. 1/0220/23, and funded by the Ministry of Education, Science and Technological Development of Republic of Serbia grant numbers: 451-03-68/2022-14/200017.

Institutional Review Board Statement

Not applicable.

Informed Consent Statement

Not applicable.

Data Availability Statement

The authors confirm that the data supporting the findings of this study are available within the article.

Conflicts of Interest

The authors declare no conflict of interest.

References

  1. Tallentire, C.W.; Mackenzie, S.G.; Kyriazakis, I. Can Novel Ingredients Replace Soybeans and Reduce the Environmental Burdens of European Livestock Systems in the Future? J. Clean. Prod. 2018, 187, 338–347. [Google Scholar] [CrossRef]
  2. Gautam, R.K.; Sharma, S.K.; Mahiya, S.; Chattopadhyaya, M.C. CHAPTER 1. Contamination of Heavy Metals in Aquatic Media: Transport, Toxicity and Technologies for Remediation. In Heavy Metals in Water; Sharma, S., Ed.; Royal Society of Chemistry: Cambridge, UK, 2014; pp. 1–24. ISBN 978-1-84973-885-9. [Google Scholar]
  3. Siegel, F.R. Heavy Metals Mobility/Immobility in Environmental Media. In Environmental Geochemistry of Potentially Toxic Metals; Springer: Berlin/Heidelberg, Germany, 2002; pp. 45–59. ISBN 978-3-642-07554-4. [Google Scholar]
  4. Stern, B.R. Essentiality and Toxicity in Copper Health Risk Assessment: Overview, Update and Regulatory Considerations. J. Toxicol. Environ. Health A 2010, 73, 114–127. [Google Scholar] [CrossRef]
  5. Ashish, B.; Neeti, K.; Himanshu, K. Copper Toxicity: A Comprehensive Study. Res. J. Recent Sci. 2013, 2, 58–67. [Google Scholar]
  6. García-Rico, L.; Leyva-Perez, J.; Jara-Marini, M.E. Content and Daily Intake of Copper, Zinc, Lead, Cadmium, and Mercury from Dietary Supplements in Mexico. Food Chem. Toxicol. 2007, 45, 1599–1605. [Google Scholar] [CrossRef] [PubMed]
  7. de Romaña, D.L.; Olivares, M.; Uauy, R.; Araya, M. Risks and Benefits of Copper in Light of New Insights of Copper Homeostasis. J. Trace Elem. Med. Biol. 2011, 25, 3–13. [Google Scholar] [CrossRef] [PubMed]
  8. Li, X.; Hao, S.; Han, A.; Yang, Y.; Fang, G.; Liu, J.; Wang, S. Intracellular Fenton Reaction Based on Mitochondria-Targeted Copper(II)–Peptide Complex for Induced Apoptosis. J. Mater. Chem. B 2019, 7, 4008–4016. [Google Scholar] [CrossRef]
  9. Liu, H.; Li, X.; Ma, Z.; Sun, M.; Li, M.; Zhang, Z.; Zhang, L.; Tang, Z.; Yao, Y.; Huang, B.; et al. Atomically Dispersed Cu Catalyst for Efficient Chemoselective Hydrogenation Reaction. Nano Lett. 2021, 21, 10284–10291. [Google Scholar] [CrossRef] [PubMed]
  10. Egorova, K.S.; Ananikov, V.P. Which Metals Are Green for Catalysis? Comparison of the Toxicities of Ni, Cu, Fe, Pd, Pt, Rh, and Au Salts. Angew. Chem. Int. Ed. 2016, 55, 12150–12162. [Google Scholar] [CrossRef]
  11. Wang, T.; Wang, Q.; Soklun, H.; Qu, G.; Xia, T.; Guo, X.; Jia, H.; Zhu, L. A Green Strategy for Simultaneous Cu(II)-EDTA Decomplexation and Cu Precipitation from Water by Bicarbonate-Activated Hydrogen Peroxide/Chemical Precipitation. Chem. Eng. J. 2019, 370, 1298–1309. [Google Scholar] [CrossRef]
  12. Thomas, M.; Zdebik, D.; Białecka, B. Using Sodium Trithiocarbonate to Precipitate Heavy Metals from Industrial Wastewater—From the Laboratory to Industrial Scale. Pol. J. Environ. Stud. 2018, 27, 1753–1763. [Google Scholar] [CrossRef]
  13. Divrikli, U.; Kartal, A.; Soylak, M.; Elci, L. Preconcentration of Pb(II), Cr(III), Cu(II), Ni(II) and Cd(II) Ions in Environmental Samples by Membrane Filtration Prior to Their Flame Atomic Absorption Spectrometric Determinations. J. Hazard. Mater. 2007, 145, 459–464. [Google Scholar] [CrossRef] [PubMed]
  14. Keane, M.A. The Removal of Copper and Nickel from Aqueous Solution Using Y Zeolite Ion Exchangers. Colloids Surf. Physicochem. Eng. Asp. 1998, 138, 11–20. [Google Scholar] [CrossRef]
  15. Dhiman, S.; Gupta, B. Partition Studies on Cobalt and Recycling of Valuable Metals from Waste Li-Ion Batteries via Solvent Extraction and Chemical Precipitation. J. Clean. Prod. 2019, 225, 820–832. [Google Scholar] [CrossRef]
  16. Xu, S.; Ng, J.; Du, A.J.; Liu, J.; Sun, D.D. Highly Efficient TiO2 Nanotube Photocatalyst for Simultaneous Hydrogen Production and Copper Removal from Water. Int. J. Hydrog. Energy 2011, 36, 6538–6545. [Google Scholar] [CrossRef]
  17. da Silva, J.R.P.; Merçon, F.; Guimarães Costa, C.M.; Radoman Benjo, D. Application of Reverse Osmosis Process Associated with EDTA Complexation for Nickel and Copper Removal from Wastewater. Desalin. Water Treat. 2016, 57, 19466–19474. [Google Scholar] [CrossRef]
  18. Tran, T.-K.; Chiu, K.-F.; Lin, C.-Y.; Leu, H.-J. Electrochemical Treatment of Wastewater: Selectivity of the Heavy Metals Removal Process. Int. J. Hydrog. Energy 2017, 42, 27741–27748. [Google Scholar] [CrossRef]
  19. Vo, K.A.; Xu, X.J.; Li, T.G.; Peng, R.H.; Liu, S.L.; Yue, X.L. Research on a New Electrochemical Method Combined with Chemical Coagulation in Removal of Lead, Zinc, and Copper from Wastewater. Desalin. Water Treat. 2016, 57, 15343–15352. [Google Scholar] [CrossRef]
  20. Veli, S.; Alyüz, B. Adsorption of Copper and Zinc from Aqueous Solutions by Using Natural Clay. J. Hazard. Mater. 2007, 149, 226–233. [Google Scholar] [CrossRef]
  21. Kucharski, P.; Białecka, B.; Thomas, M. Removal of Cadmium Ions from Polluted Waters Using Low-Cost Adsorbents: Process Optimization Study. Desalin. Water Treat. 2022, 256, 114–124. [Google Scholar] [CrossRef]
  22. Muya, F.N.; Sunday, C.E.; Baker, P.; Iwuoha, E. Environmental Remediation of Heavy Metal Ions from Aqueous Solution through Hydrogel Adsorption: A Critical Review. Water Sci. Technol. 2016, 73, 983–992. [Google Scholar] [CrossRef]
  23. Duricova, A.; Samesova, D. Distribution of the toxic metals in system water–sludge in the biological water treatment plant. Ecology and Environmental Protection. In Proceedings of the 14th International Multidisciplinary Scientific GeoConference SGEM, Albena, Bulgaria, 17–26 June 2014. [Google Scholar] [CrossRef]
  24. Yahya, Z.; Abdullah, M.M.A.B.; Hussin, K.; Ismail, K.N.; Razak, R.A.; Sandu, A.V. Effect of Solids-To-Liquids, Na2SiO3-To-NaOH and Curing Temperature on the Palm Oil Boiler Ash (Si + Ca) Geopolymerisation System. Materials 2015, 8, 2227–2242. [Google Scholar] [CrossRef]
  25. Gulicovski, J.; Nenadović, S.; Kljajević, L.; Mirković, M.; Nišavić, M.; Kragović, M.; Stojmenović, M. Geopolymer/CeO2 as Solid Electrolyte for IT-SOFC. Polymers 2020, 12, 248. [Google Scholar] [CrossRef] [PubMed]
  26. Ivanović, M.; Nenadović, S.; Pavlović, V.P.; Radović, I.; Kijevčanin, M.; Pavlović, V.B.; Kljajević, L. The Influence of Thermodynamic Parameters on Alkaline Activator of Geopolymers and Structure of Geopolymers. Maced. J. Chem. Chem. Eng. 2021, 40, 99. [Google Scholar] [CrossRef]
  27. Duxson, P.; Fernández-Jiménez, A.; Provis, J.L.; Lukey, G.C.; Palomo, A.; van Deventer, J.S.J. Geopolymer Technology: The Current State of the Art. J. Mater. Sci. 2007, 42, 2917–2933. [Google Scholar] [CrossRef]
  28. Davidovits, J. Geopolymers and Geopolymeric Materials. J. Therm. Anal. 1989, 35, 429–441. [Google Scholar] [CrossRef]
  29. Nenadović, S.; Gulicovski, J.; Mirković, M.; Kljajević, L.; Bošković, I.; Vukčević, M.; Nenadović, M. Structural, Mechanical and Chemical Properties of Low Content Carbon Geopolymer. Sustainability 2022, 14, 4885. [Google Scholar] [CrossRef]
  30. Yong, H.; Kamarudin, H.; Abdullah, M.M.A.B.; Musa, L.; Nizar, K.; Ming, L. Potential Application of Kaolin Without Calcine as Greener Concrete: A Review. Aust. J. Basic Appl. Sci. 2011, 5, 1026–1035. [Google Scholar]
  31. Al-Harahsheh, M.S.; Al Zboon, K.; Al-Makhadmeh, L.; Hararah, M.; Mahasneh, M. Fly Ash Based Geopolymer for Heavy Metal Removal: A Case Study on Copper Removal. J. Environ. Chem. Eng. 2015, 3, 1669–1677. [Google Scholar] [CrossRef]
  32. Wang, S.; Li, L.; Zhu, Z.H. Solid-State Conversion of Fly Ash to Effective Adsorbents for Cu Removal from Wastewater. J. Hazard. Mater. 2007, 139, 254–259. [Google Scholar] [CrossRef]
  33. Jianguo, Z.; Provis, J.L.; Dingwu, F.; Deventer, J.S.J. van Geopolymers for Immobilization of Cr{sup 6+}, Cd{sup 2+}, and Pb{sup 2+}. J. Hazard. Mater. 2008, 157, 587–598. [Google Scholar] [CrossRef]
  34. Yousef, R.I.; El-Eswed, B.; Alshaaer, M.; Khalili, F.; Khoury, H. The Influence of Using Jordanian Natural Zeolite on the Adsorption, Physical, and Mechanical Properties of Geopolymers Products. J. Hazard. Mater. 2009, 165, 379–387. [Google Scholar] [CrossRef]
  35. Siyal, A.A.; Shamsuddin, M.R.; Khan, M.I.; Rabat, N.E.; Zulfiqar, M.; Man, Z.; Siame, J.; Azizli, K.A. A Review on Geopolymers as Emerging Materials for the Adsorption of Heavy Metals and Dyes. J. Environ. Manag. 2018, 224, 327–339. [Google Scholar] [CrossRef] [PubMed]
  36. Andrejkovičová, S.; Sudagar, A.; Rocha, J.; Patinha, C.; Hajjaji, W.; da Silva, E.F.; Velosa, A.; Rocha, F. The Effect of Natural Zeolite on Microstructure, Mechanical and Heavy Metals Adsorption Properties of Metakaolin Based Geopolymers. Appl. Clay Sci. 2016, 126, 141–152. [Google Scholar] [CrossRef]
  37. Su, Q.; Ye, Q.; Deng, L.; He, Y.; Cui, X. Prepared Self-Growth Supported Copper Catalyst by Recovering Cu (II) from Wastewater Using Geopolymer Microspheres. J. Clean. Prod. 2020, 272, 122571. [Google Scholar] [CrossRef]
  38. Ge, Y.; Cui, X.; Kong, Y.; Li, Z.; He, Y.; Zhou, Q. Porous Geopolymeric Spheres for Removal of Cu(II) from Aqueous Solution: Synthesis and Evaluation. J. Hazard. Mater. 2015, 283, 244–251. [Google Scholar] [CrossRef]
  39. Cheng, T.W.; Lee, M.L.; Ko, M.S.; Ueng, T.H.; Yang, S.F. The Heavy Metal Adsorption Characteristics on Metakaolin-Based Geopolymer. Appl. Clay Sci. 2012, 56, 90–96. [Google Scholar] [CrossRef]
  40. Mama, C.N.; Nwonu, D.C.; Akanno, C.C.; Chukwuemeka, O.E. Adsorption Capacity of Composite Bio-Modified Geopolymer for Multi-Component Heavy Metal System: Optimisation, Equilibrium and Kinetics Study. Environ. Monit. Assess. 2022, 194, 134. [Google Scholar] [CrossRef] [PubMed]
  41. Babić, B.M.; Milonjić, S.K.; Polovina, M.J.; Čupić, S.; Kaludjerović, B.V. Adsorption of Zinc, Cadmium and Mercury Ions from Aqueous Solutions on an Activated Carbon Cloth. Carbon 2002, 40, 1109–1115. [Google Scholar] [CrossRef]
  42. Haberhauer, G.; Gerzabek, M.H. Drift and Transmission FT-IR Spectroscopy of Forest Soils: An Approach to Determine Decomposition Processes of Forest Litter. Vib. Spectrosc. 1999, 19, 413–417. [Google Scholar] [CrossRef]
  43. Kljajević, L.; Melichová, Z.; Kisić, D.; Nenadovic, M.; Todorović, B.; Pavlovic, V.; Nenadović, S. The Influence of Alumino-Silicate Matrix Composition on Surface Hydrophobic Properties. Sci. Sinter. 2019, 51, 163–173. [Google Scholar] [CrossRef]
  44. Yan, K.; Guo, Y.; Fang, L.; Cui, L.; Cheng, F.; Li, T. Decomposition and Phase Transformation Mechanism of Kaolinite Calcined with Sodium Carbonate. Appl. Clay Sci. 2017, 147, 90–96. [Google Scholar] [CrossRef]
  45. Clay and Clay Minerals; Do Nascimento, G.M. (Ed.) IntechOpen: Rijeka, Croatia, 2021; ISBN 978-1-83969-563-6. [Google Scholar]
  46. Wan, Q.; Zhang, Y.; Zhang, R. Using Mechanical Activation of Quartz to Enhance the Compressive Strength of Metakaolin Based Geopolymers. Cem. Concr. Compos. 2020, 111, 103635. [Google Scholar] [CrossRef]
  47. Omerašević, M.; Lukić, M.; Savić-Biserčić, M.; Savić, A.; Matović, L.; Baščarević, Z.; Bučevac, D. Permanent Disposal of Cs Ions in the Form of Dense Pollucite Ceramics Having Low Thermal Expansion Coefficient. Nucl. Eng. Technol. 2020, 52, 115–122. [Google Scholar] [CrossRef]
  48. Alderton, D. Micas. In Encyclopedia of Geology; Elsevier: Amsterdam, The Netherlands, 2021; pp. 326–333. ISBN 978-0-08-102909-1. [Google Scholar]
  49. Ríos, C.A.; Williams, C.D.; Fullen, M.A. Nucleation and Growth History of Zeolite LTA Synthesized from Kaolinite by Two Different Methods. Appl. Clay Sci. 2009, 42, 446–454. [Google Scholar] [CrossRef]
  50. Frost, R.L.; Johansson, U. Combination Bands in the Infrared Spectroscopy of Kaolins—A Drift Spectroscopic Study. Clays Clay Miner. 1998, 46, 466–477. [Google Scholar] [CrossRef]
  51. Xu, H.; Van Deventer, J.S.J. The Geopolymerisation of Alumino-Silicate Minerals. Int. J. Miner. Process. 2000, 59, 247–266. [Google Scholar] [CrossRef]
  52. Nenadović, S.; Ferone, C.; Nenadovic, M.; Cioffi, R.; Mirkovic, M.; Vukanac, I.; Kljajevic, L. Chemical, Physical and Radiological Evaluation of Raw Materials and Geopolymers for Building Applications. J. Radioanal. Nucl. Chem. 2020, 325, 435–445. [Google Scholar] [CrossRef]
  53. Maragkos, I.; Giannopoulou, I.P.; Panias, D. Synthesis of Ferronickel Slag-Based Geopolymers. Miner. Eng. 2009, 22, 196–203. [Google Scholar] [CrossRef]
  54. Ivanović, M.; Kljajević, L.; Gulicovski, J.; Petković, M.; Jankovic-Castvan, I.; Bucevac, D.; Nenadović, S. The Effect of the Concentration of Alkaline Activator and Aging Time on the Structure of Metakaolin Based Geopolymer. Sci. Sinter. 2020, 52, 219–229. [Google Scholar] [CrossRef]
  55. Salami, B.; Megat Johari, M.A.; Ahmad, Z.; Maslehuddin, M.; Adewumi, A. Impact of Al(OH)3 Addition to POFA on the Compressive Strength of POFA- Alkali-Activated Mortar. Constr. Build. Mater. 2018, 190, 65–82. [Google Scholar] [CrossRef]
  56. Kljajević, L.M.; Nenadović, S.S.; Nenadović, M.T.; Bundaleski, N.K.; Todorović, B.Ž.; Pavlović, V.B.; Rakočević, Z.L. Structural and Chemical Properties of Thermally Treated Geopolymer Samples. Ceram. Int. 2017, 43, 6700–6708. [Google Scholar] [CrossRef]
  57. Alahverdi, A.; Mehrpour, K.; Najafikani, E. Taftan Pozzolan-Based Geopolymer Cement. Int. J. Eng. Sci. Engl. 2008, 19, 1–5. [Google Scholar]
  58. Zaharaki, D.; Komnitsas, K.; Perdikatsis, V. Use of Analytical Techniques for Identification of Inorganic Polymer Gel Composition. J. Mater. Sci. 2010, 45, 2715–2724. [Google Scholar] [CrossRef]
  59. Wang, H.; Li, H.; Wang, Y.; Yan, F. Preparation of Macroporous Ceramic from Metakaolinite-Based Geopolymer by Calcination. Ceram. Int. 2015, 41, 11177–11183. [Google Scholar] [CrossRef]
  60. Kosor, T.; Nakić-Alfirević, B.; Svilović, S. Geopolymer Depolymerization Index. Vib. Spectrosc. 2016, 86, 143–148. [Google Scholar] [CrossRef]
  61. Kljajević, L.M.; Melichova, Z.; Stojmenović, M.D.; Todorović, B.Z.; Pavlović, V.B.; Čitaković, N.M.; Nenadović, S.S. Structural and Electrical Properties of Geopolymer Materials Based on Different Precursors (Kaolin, Bentonite and Diatomite). Maced. J. Chem. Chem. Eng. 2019, 38, 283–292. [Google Scholar] [CrossRef]
  62. Zhou, Y.; Liu, X.; Xiang, Y.; Wang, P.; Zhang, J.; Zhang, F.; Wei, J.; Luo, L.; Lei, M.; Tang, L. Modification of Biochar Derived from Sawdust and Its Application in Removal of Tetracycline and Copper from Aqueous Solution: Adsorption Mechanism and Modelling. Bioresour. Technol. 2017, 245, 266–273. [Google Scholar] [CrossRef]
  63. Kim, D.-H.; Shin, M.-C.; Choi, H.-D.; Seo, C.-I.; Baek, K. Removal Mechanisms of Copper Using Steel-Making Slag: Adsorption and Precipitation. Desalination 2008, 223, 283–289. [Google Scholar] [CrossRef]
  64. Fornasiero, D.; Ralston, J. Effect of Surface Oxide/Hydroxide Products on the Collectorless Flotation of Copper-Activated Sphalerite. Int. J. Miner. Process. 2006, 78, 231–237. [Google Scholar] [CrossRef]
  65. Worrall, G.M.; Buswell, J.T.; English, C.A.; Hetherington, M.G.; Smith, G.D.W. A Study of the Precipitation of Copper Particles in a Ferrite Matrix. J. Nucl. Mater. 1987, 148, 107–114. [Google Scholar] [CrossRef]
  66. Mužek, M.N.; Svilović, S.; Ugrina, M.; Zelić, J. Removal of Copper and Cobalt Ions by Fly Ash-Based Geopolymer from Solutions-Equilibrium Study. Desalination Water Treat. 2016, 57, 10689–10699. [Google Scholar] [CrossRef]
  67. Yan, C.; Guo, L.; Ren, D.; Duan, P. Novel Composites Based on Geopolymer for Removal of Pb(II). Mater. Lett. 2019, 239, 192–195. [Google Scholar] [CrossRef]
  68. Luukkonen, T.; Sarkkinen, M.; Kemppainen, K.; Rämö, J.; Lassi, U. Metakaolin Geopolymer Characterization and Application for Ammonium Removal from Model Solutions and Landfill Leachate. Appl. Clay Sci. 2016, 119, 266–276. [Google Scholar] [CrossRef]
  69. Luukkonen, T.; Věžníková, K.; Tolonen, E.-T.; Runtti, H.; Yliniemi, J.; Hu, T.; Kemppainen, K.; Lassi, U. Removal of Ammonium from Municipal Wastewater with Powdered and Granulated Metakaolin Geopolymer. Environ. Technol. 2018, 39, 414–423. [Google Scholar] [CrossRef]
  70. Ge, Y.; Cui, X.; Liao, C.; Li, Z. Facile Fabrication of Green Geopolymer/Alginate Hybrid Spheres for Efficient Removal of Cu(II) in Water: Batch and Column Studies. Chem. Eng. J. 2017, 311, 126–134. [Google Scholar] [CrossRef]
  71. Duan, P.; Yan, C.; Zhou, W.; Ren, D. Development of Fly Ash and Iron Ore Tailing Based Porous Geopolymer for Removal of Cu(II) from Wastewater. Ceram. Int. 2016, 42, 13507–13518. [Google Scholar] [CrossRef]
  72. Tunali Akar, S.; Çolo, H.; Sayin, F.; Kara, I.; Akar, T. Parametric Optimization of Cu(II) Removal Process by a Metakaolin-Based Geopolymer: Batch and Continuous Process Design. J. Clean. Prod. 2022, 366, 132819. [Google Scholar] [CrossRef]
  73. Singhal, A.; Gangwar, B.P.; Gayathry, J.M. CTAB Modified Large Surface Area Nanoporous Geopolymer with High Adsorption Capacity for Copper Ion Removal. Appl. Clay Sci. 2017, 150, 106–114. [Google Scholar] [CrossRef]
  74. Yadav, V.B.; Gadi, R.; Kalra, S. Clay Based Nanocomposites for Removal of Heavy Metals from Water: A Review. J. Environ. Manag. 2019, 232, 803–817. [Google Scholar] [CrossRef] [PubMed]
  75. Boonamnuayvitaya, V.; Chaiya, C.; Tanthapanichakoon, W.; Jarudilokkul, S. Removal of Heavy Metals by Adsorbent Prepared from Pyrolyzed Coffee Residues and Clay. Sep. Purif. Technol. 2004, 35, 11–22. [Google Scholar] [CrossRef]
Figure 1. XRD results of Serbian clay sample (D) and German clay sample (G).
Sustainability 15 02869 g001
Figure 2. Crystal structure of kaolinite (a) and illite (b).
Sustainability 15 02869 g002
Figure 3. Unit cell of quartz.
Sustainability 15 02869 g003
Figure 4. XRD results of geopolymer samples: (a)—GPS; (b)—GPG; (c)—GPGC.
Sustainability 15 02869 g004
Figure 5. Structure of Na rich zeolite Fujasite (a) and Paragonite (b).
Sustainability 15 02869 g005
Figure 6. DRIFT spectrum of geopolymer samples: (a) GPS; (b) GPG; (c) GPGC.
Sustainability 15 02869 g006
Figure 7. SEM micrographs of geopolymers samples: (a) GPS- magnification of 1500; (a’) GPS- magnification of 5000; (b) MG- magnification of 1500; (b’) MG- magnification of 5000; (c) MGC- magnification of 1500; (c’) MGC- magnification of 5000.
Sustainability 15 02869 g007
Figure 8. Effects of the mass of adsorbents on the adsorption capacities of geopolymers samples (experimental conditions: 25 mL Cu(II) solution, temperature 25 °C, pH = 5.4), c0 = 100 mg L−1.
Sustainability 15 02869 g008
Figure 9. Theoretical effect of initial pH on qe adsorption of Cu(II) [50 mg L−1] and predicted Cu speciation in solution. (conditions: T = 25 °C, pCO2 = pAtm.).
Sustainability 15 02869 g009
Figure 10. Effects of initial concentrations of Cu(II) on the adsorption capacities of the geopolymers samples in equilibrium (experimental conditions: 25 mL Cu(II) solution, 0.025 g of geopolymer sample, temperature 25 °C, pH = 5.4).
Sustainability 15 02869 g010
Figure 11. Effect of initial concentrations of Cu(II) on the adsorption percentage of the geopolymers samples in equilibrium (experimental conditions: 25 mL Cu(II) solution, 0.025 g of geopolymer sample, temperature 25 °C).
Sustainability 15 02869 g011
Figure 12. Linear plots of Langmuir isotherms.
Sustainability 15 02869 g012
Figure 13. Linear plots of Freundlich isotherms.
Sustainability 15 02869 g013
Figure 14. Linear plots of Redlich-Peterson isotherms.
Sustainability 15 02869 g014
Figure 15. Linear models of Sips isotherms.
Sustainability 15 02869 g015
Figure 16. Effects of adsorption time on the adsorption process of Cu(II) by the geopolymers samples (experimental conditions: 25 mL of Cu(II) solutions, 0.025 g of geopolymer sample, c0 = 50 mg L−1.
Sustainability 15 02869 g016
Figure 17. The model of Pseudo-second-order adsorption kinetics of Cu(II) on geopolymers (experimental conditions: 25 mL of Cu(II) solutions, 0.025 g of geopolymer sample, c0 = 50 mg L−1, pH = 5.43, temperature: 25 °C).
Sustainability 15 02869 g017
Table 1. EDS results of surface analysis of GPS, GPG and GPGC.
Elementswt, %
Sample:GPSGPGGPGC
C17.5918.3319.80
O45.7545.1344.53
Na8.075.084.95
Al8.209.789.59
Si17.2018.1817.82
K1.901.701.68
Ca0.650.560.50
Ti0.10.560.42
Fe0.540.680.70
Total:100.00100.00100.00
Si/Al2.101.861.86
Na/Al0.980.520.52
Table 2. Equations of linear forms of used adsorption isotherms.
Isotherm ModelEquation
Langmuir c e q e = 1 b   q m + 1 q m c e (4)
Freundlich log   q e = log K F + 1 n logc e (5)
Redlich-Peterson ln c e q e = β   ln   c e     ln   A (6)
Sips β s   ln   c e = ln K s q e + ln a s (7)
Table 3. Calculated parameters of adsorption isotherms models.
Parameters GPSGPG GPGC
Langmuirqm (mg g−1) = 58.48 ± 0.06 qm (mg g−1) = 71.43 ± 0.02 qm (mg g−1) = 72.46 ± 0.07
b (L mg−1) = 0.3353 ± 0.0003 b (L mg−1) = 0.4389 ± 0.0007 b (L mg−1) = 0.5391 ± 0.0005
R2 = 0.9998R2 = 0.9998R2 = 0.9991
Freundlich1/n = 0.1592 ± 0.00791/n = 0.2109 ± 0.00991/n = 0.1773 ± 0.0087
KF = 26.6502 ± 0.0033 KF = 28.0543 ± 0.0039 KF = 33.8870 ± 0.0042
R2 = 0.8887R2 = 0.8157R2 = 0.8202
Redlich-Petersonβ = 0.3053 ± 0.0012 β = 0.3004 ± 0.0047 β = 0.2851 ± 0.0021
aR = 0.0378 ± 0.0002aR = 0.0359 ± 0.0002aR = 0.0300 ± 0.0003
KR = 0.2563 ± 0.0010 KR = 0.2366 ± 0.0037 KR = 0.2345 ± 0.0024
R2 = 0.9959R2 = 0.9844R2 = 0.9899
Sipsqmax (mg g−1) = 45.2489 ± 2.2624 qmax (mg g−1) = 27.0270 ± 1.3514 qmax (mg g−1) = 57.8035 ± 2.8902
Ks (L mg−1) = 1.1510 ± 0.0576 Ks (L mg−1) = 2.7407 ± 0.1370 Ks (L mg−1) = 1.2815 ± 0.0641
nS = 6.7267 ± 0.3363nS = 5.1988 ± 0.2599nS = 7.6029 ± 0.3801
R2 = 0.9766R2 = 0.9709R2 = 0.9675
Table 4. Adsorption capacities of different geopolymers for adsorption of Cu(II).
Used Adsorbent Materialqm (mg g−1)Author/’s
Sodium silicate based geopolymer48.78[39]
Green geopolymer/alginate hybrid spheres (GAS)62.50[70]
Geopolymer based on fly ash and iron ore tailing69.11[71]
Germany clay based geopolymer71.43In this study
Metakaolin-based geopolymer (MKG)86.60[72]
Geopolymer based on Serbian kaolinite58.48In this study
Beihai in Guangxi Province, China
—based kaolin porous geopolymer
52.63[38]
Cetyl-trimethylammonium bromide
(CTAB)-based geopolymer
40.00[73]
Unmodified kaolinite10.80[74]
Organic carbon based geopolymer
prepared from coffee residue
31.20[75]
Geopolymer based on Germany clay
with addition of a carbon
72.46In this study
Table 5. The values of RL for bentonites in concentration range 25–200 mg L−1 Cu(II) at 25 °C.
AdsorbentConcentration (mg L−1)
2550100150200
GPS0.1035 ± 0.00520.0560 ± 0.00280.0296 ± 0.00150.0205 ± 0.00100.0155 ± 0.0008
GPG0.0810 ± 0.00410.0433 ± 0.00220.0228 ± 0.00110.0157 ± 0.00080.0119 ± 0.0006
GPGC0.0670 ± 0.0034 0.0356 ± 0.00180.0186 ± 0.00090.0128 ± 0.00060.0097 ± 0.0005
Table 6. Comparison of the calculated and experimental qe values and the adsorption rate constants for pseudo-first and pseudo-second-order reaction kinetics of the Cu(II) adsorption on geo-polymers at the temperature 25 °C.
Pseudo-First Order
SampleExperimental qe
(mg g−1)
k1 (L min−1)Calculated qe
(mg g−1)
R2
GPS46.800.0071 ± 0.000418.81 ± 0.94050.1360
GPG47.090.0069 ± 0.000325.54 ± 1.27700.1627
GPGC50.520.0061 ± 0.000319.19 ± 0.95950.2039
Pseudo-Second Order
SampleExperimental qe
(mg g−1)
k2
(g mg−1 min−1)
Calculated qe
(mg g−1)
R2
GPS46.800.0026 ± 0.000242.19 ± 0.310.9965
GPG47.090.0031 ± 0.000548.54 ± 0.170.9936
GPGC50.520.0017 ± 0.000150.00 ± 0.320.9925
Disclaimer/Publisher’s Note: The statements, opinions and data contained in all publications are solely those of the individual author(s) and contributor(s) and not of MDPI and/or the editor(s). MDPI and/or the editor(s) disclaim responsibility for any injury to people or property resulting from any ideas, methods, instructions or products referred to in the content.

