
Comparative Study of Gasoline Fuel Mixture to Reduce Emissions in the Metropolitan District

 ,
, 
Abstract
:1. Introduction
2. Materials and Methods
2.1. Materials
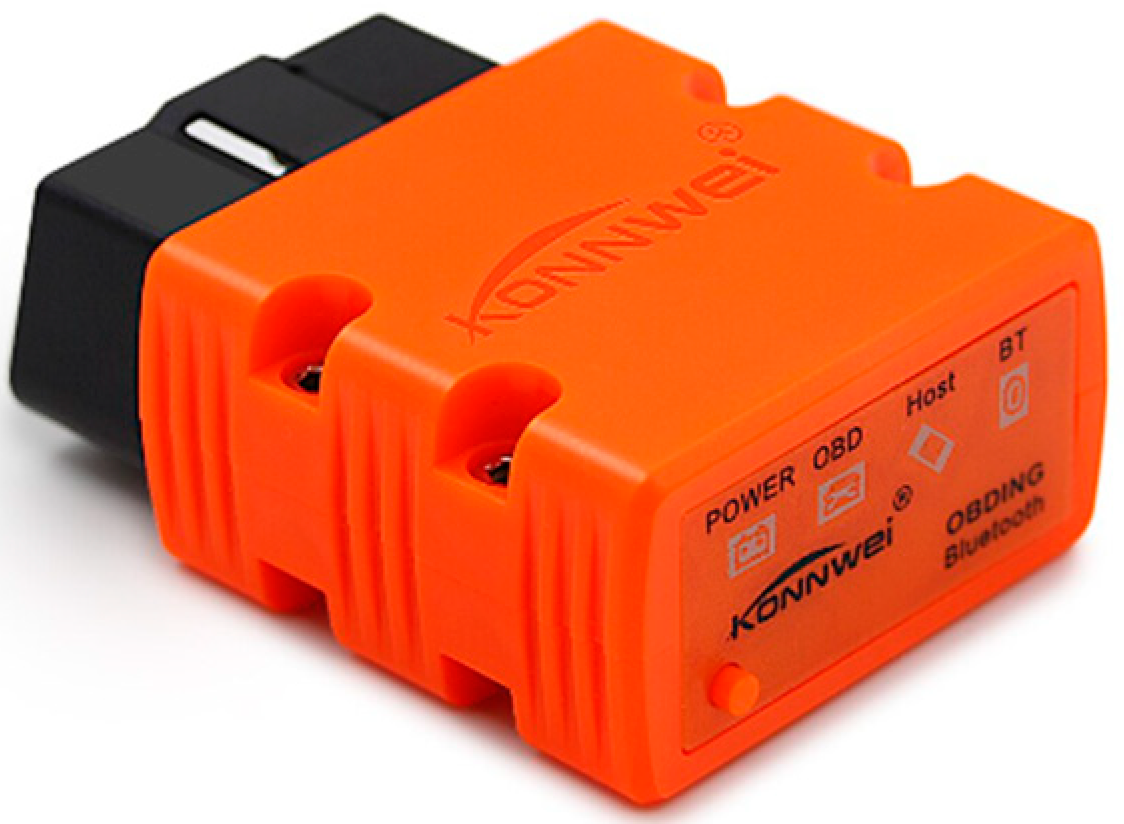
2.1.1. Data Acquisition Card
2.1.2. Software
2.1.3. Vehicles
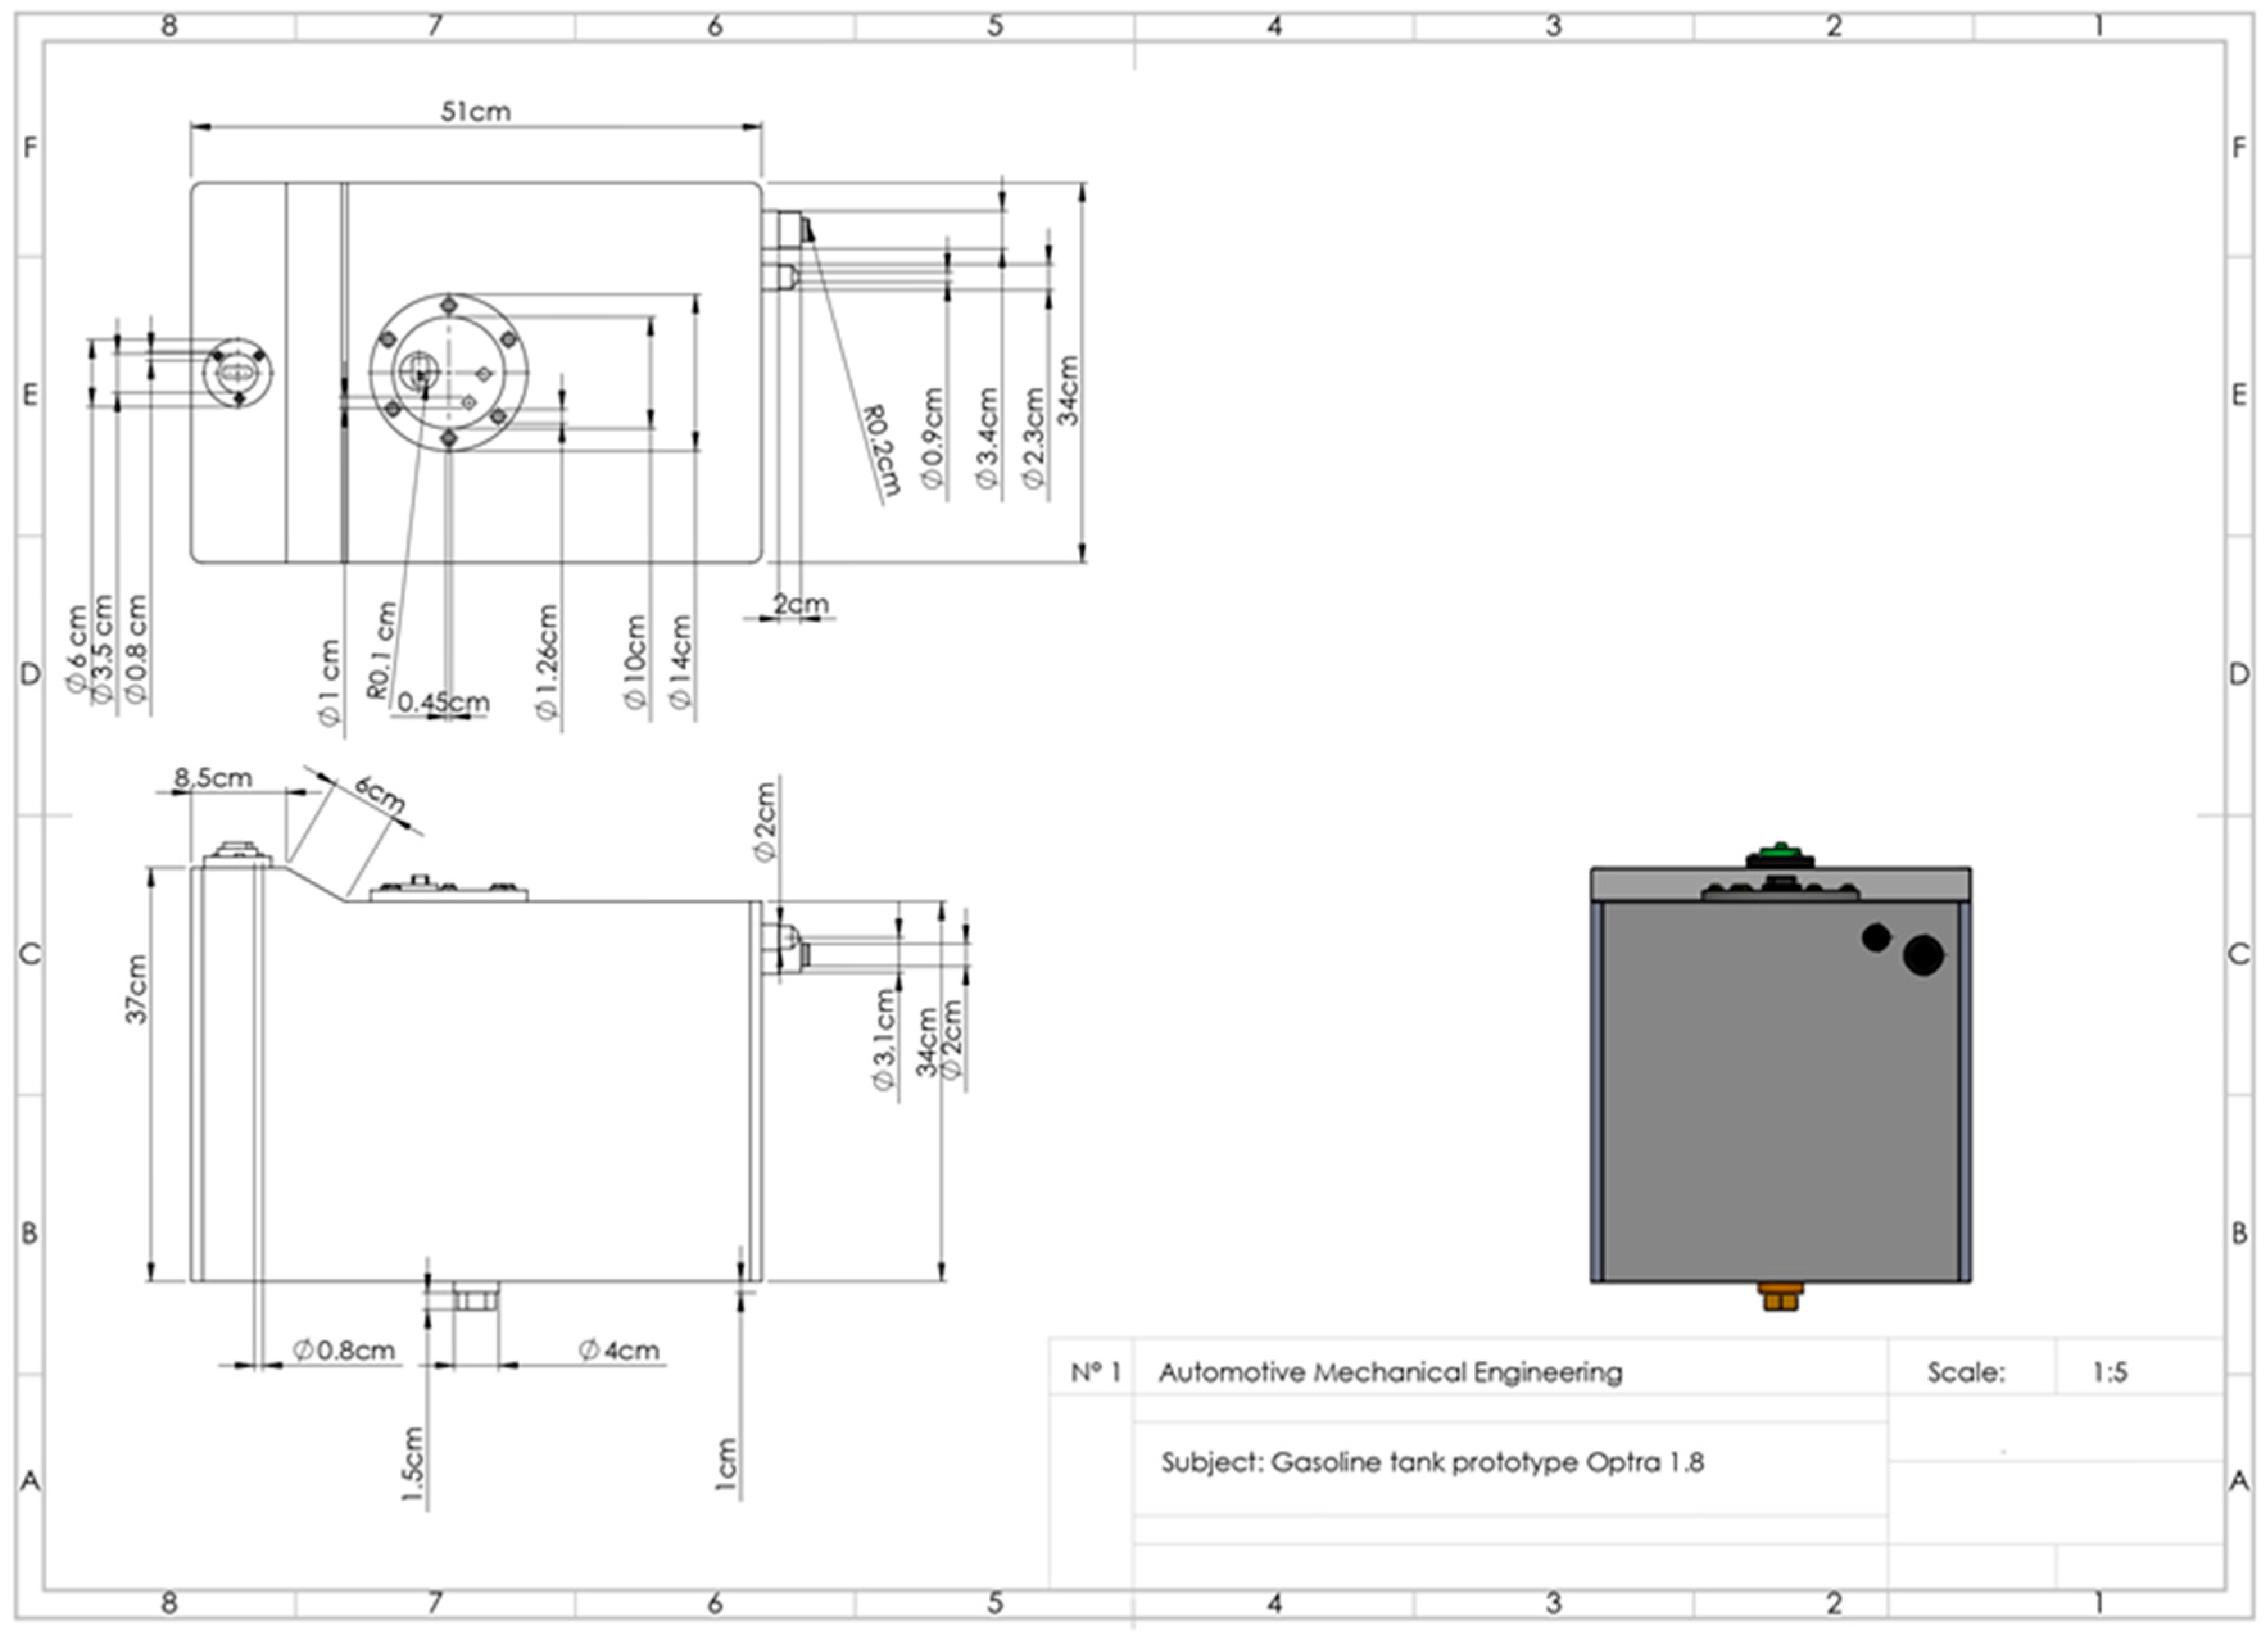
2.1.4. Fuel Tank
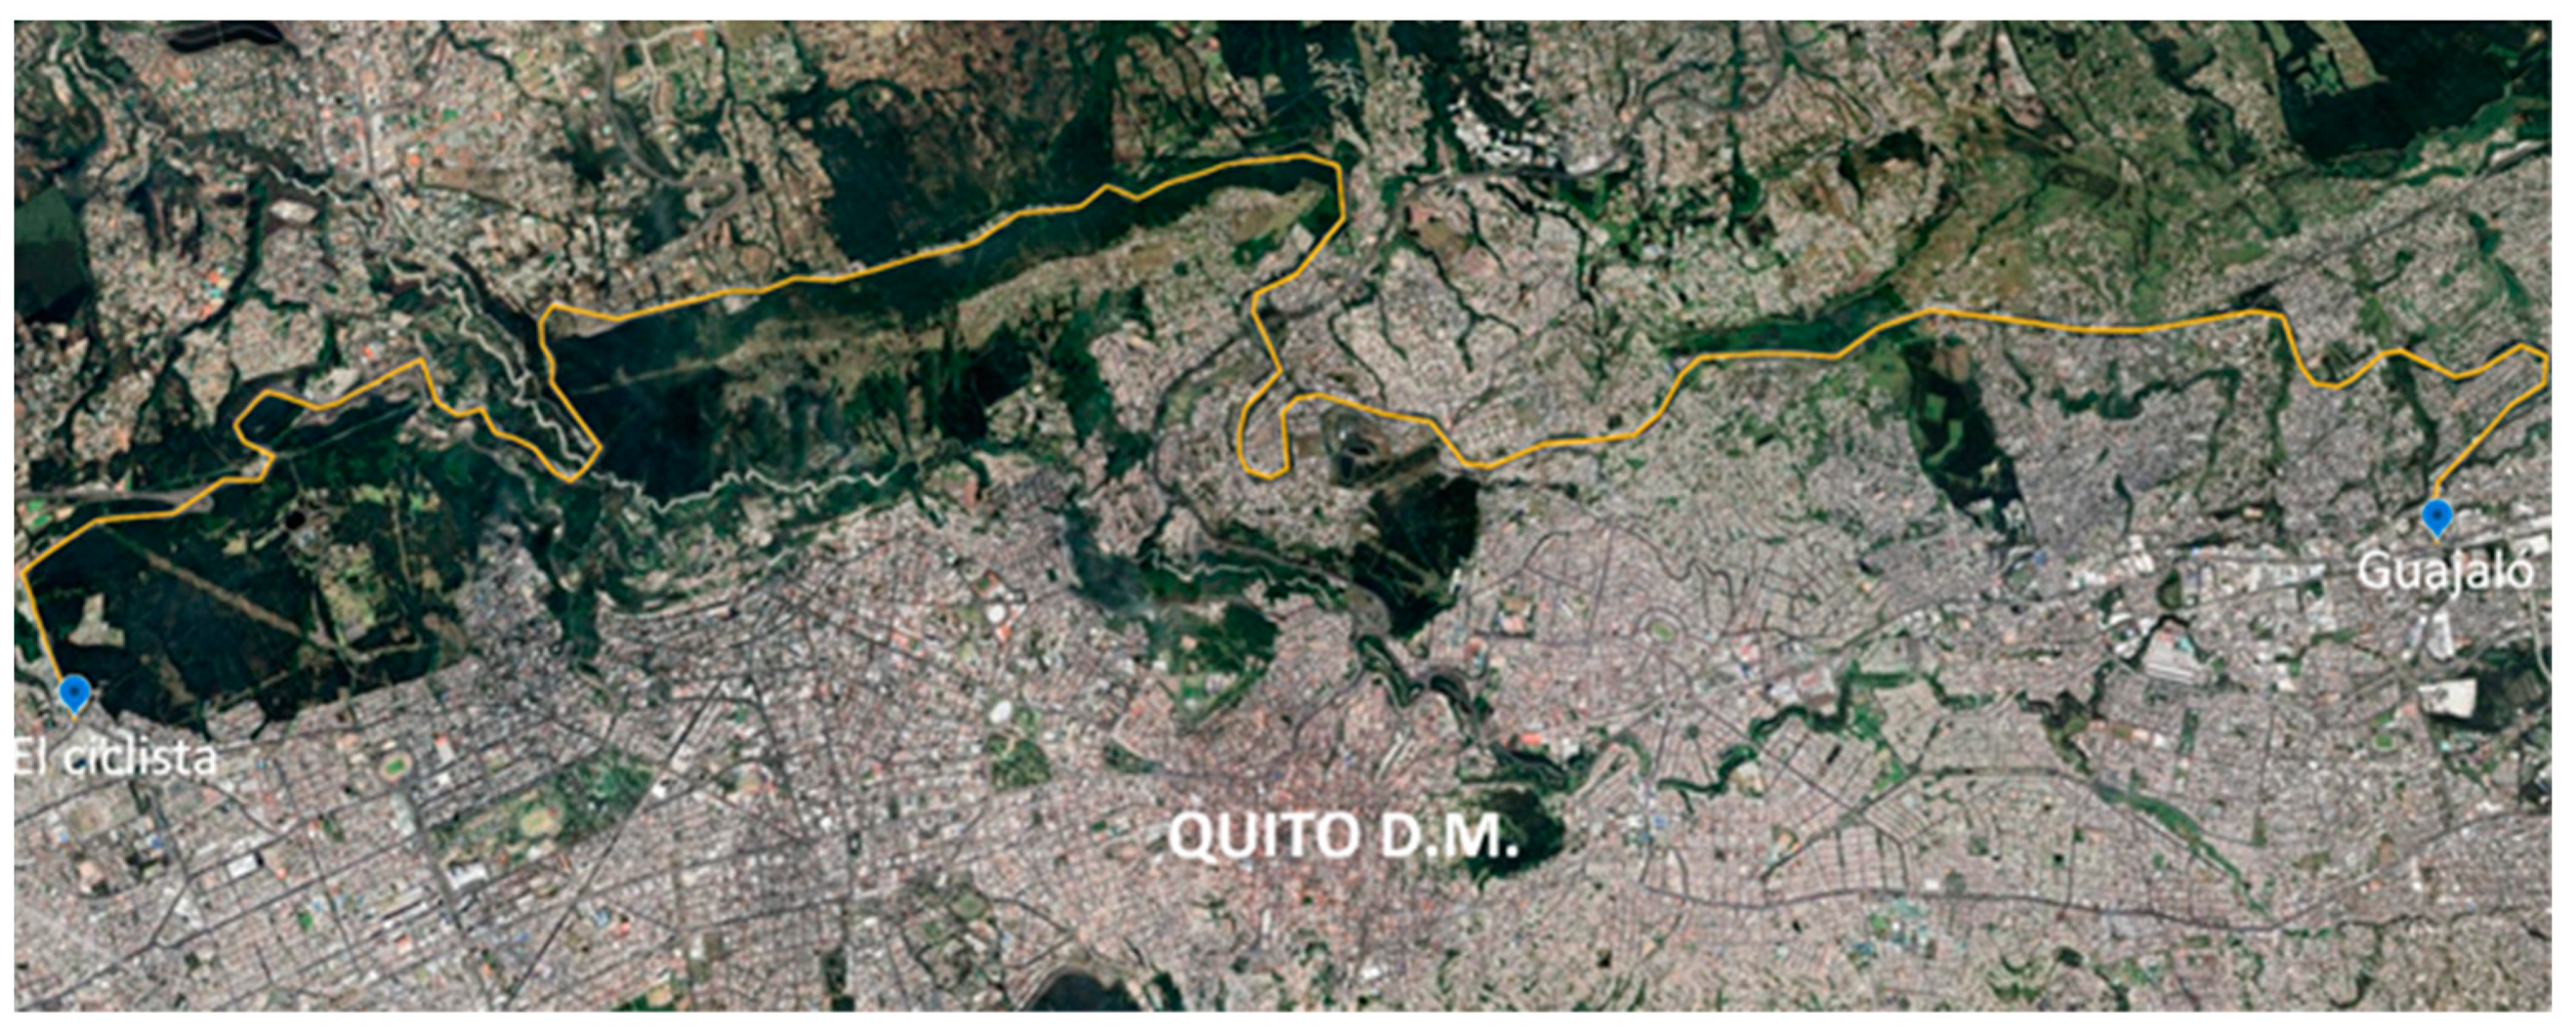
2.1.5. Route
2.1.6. Fuels
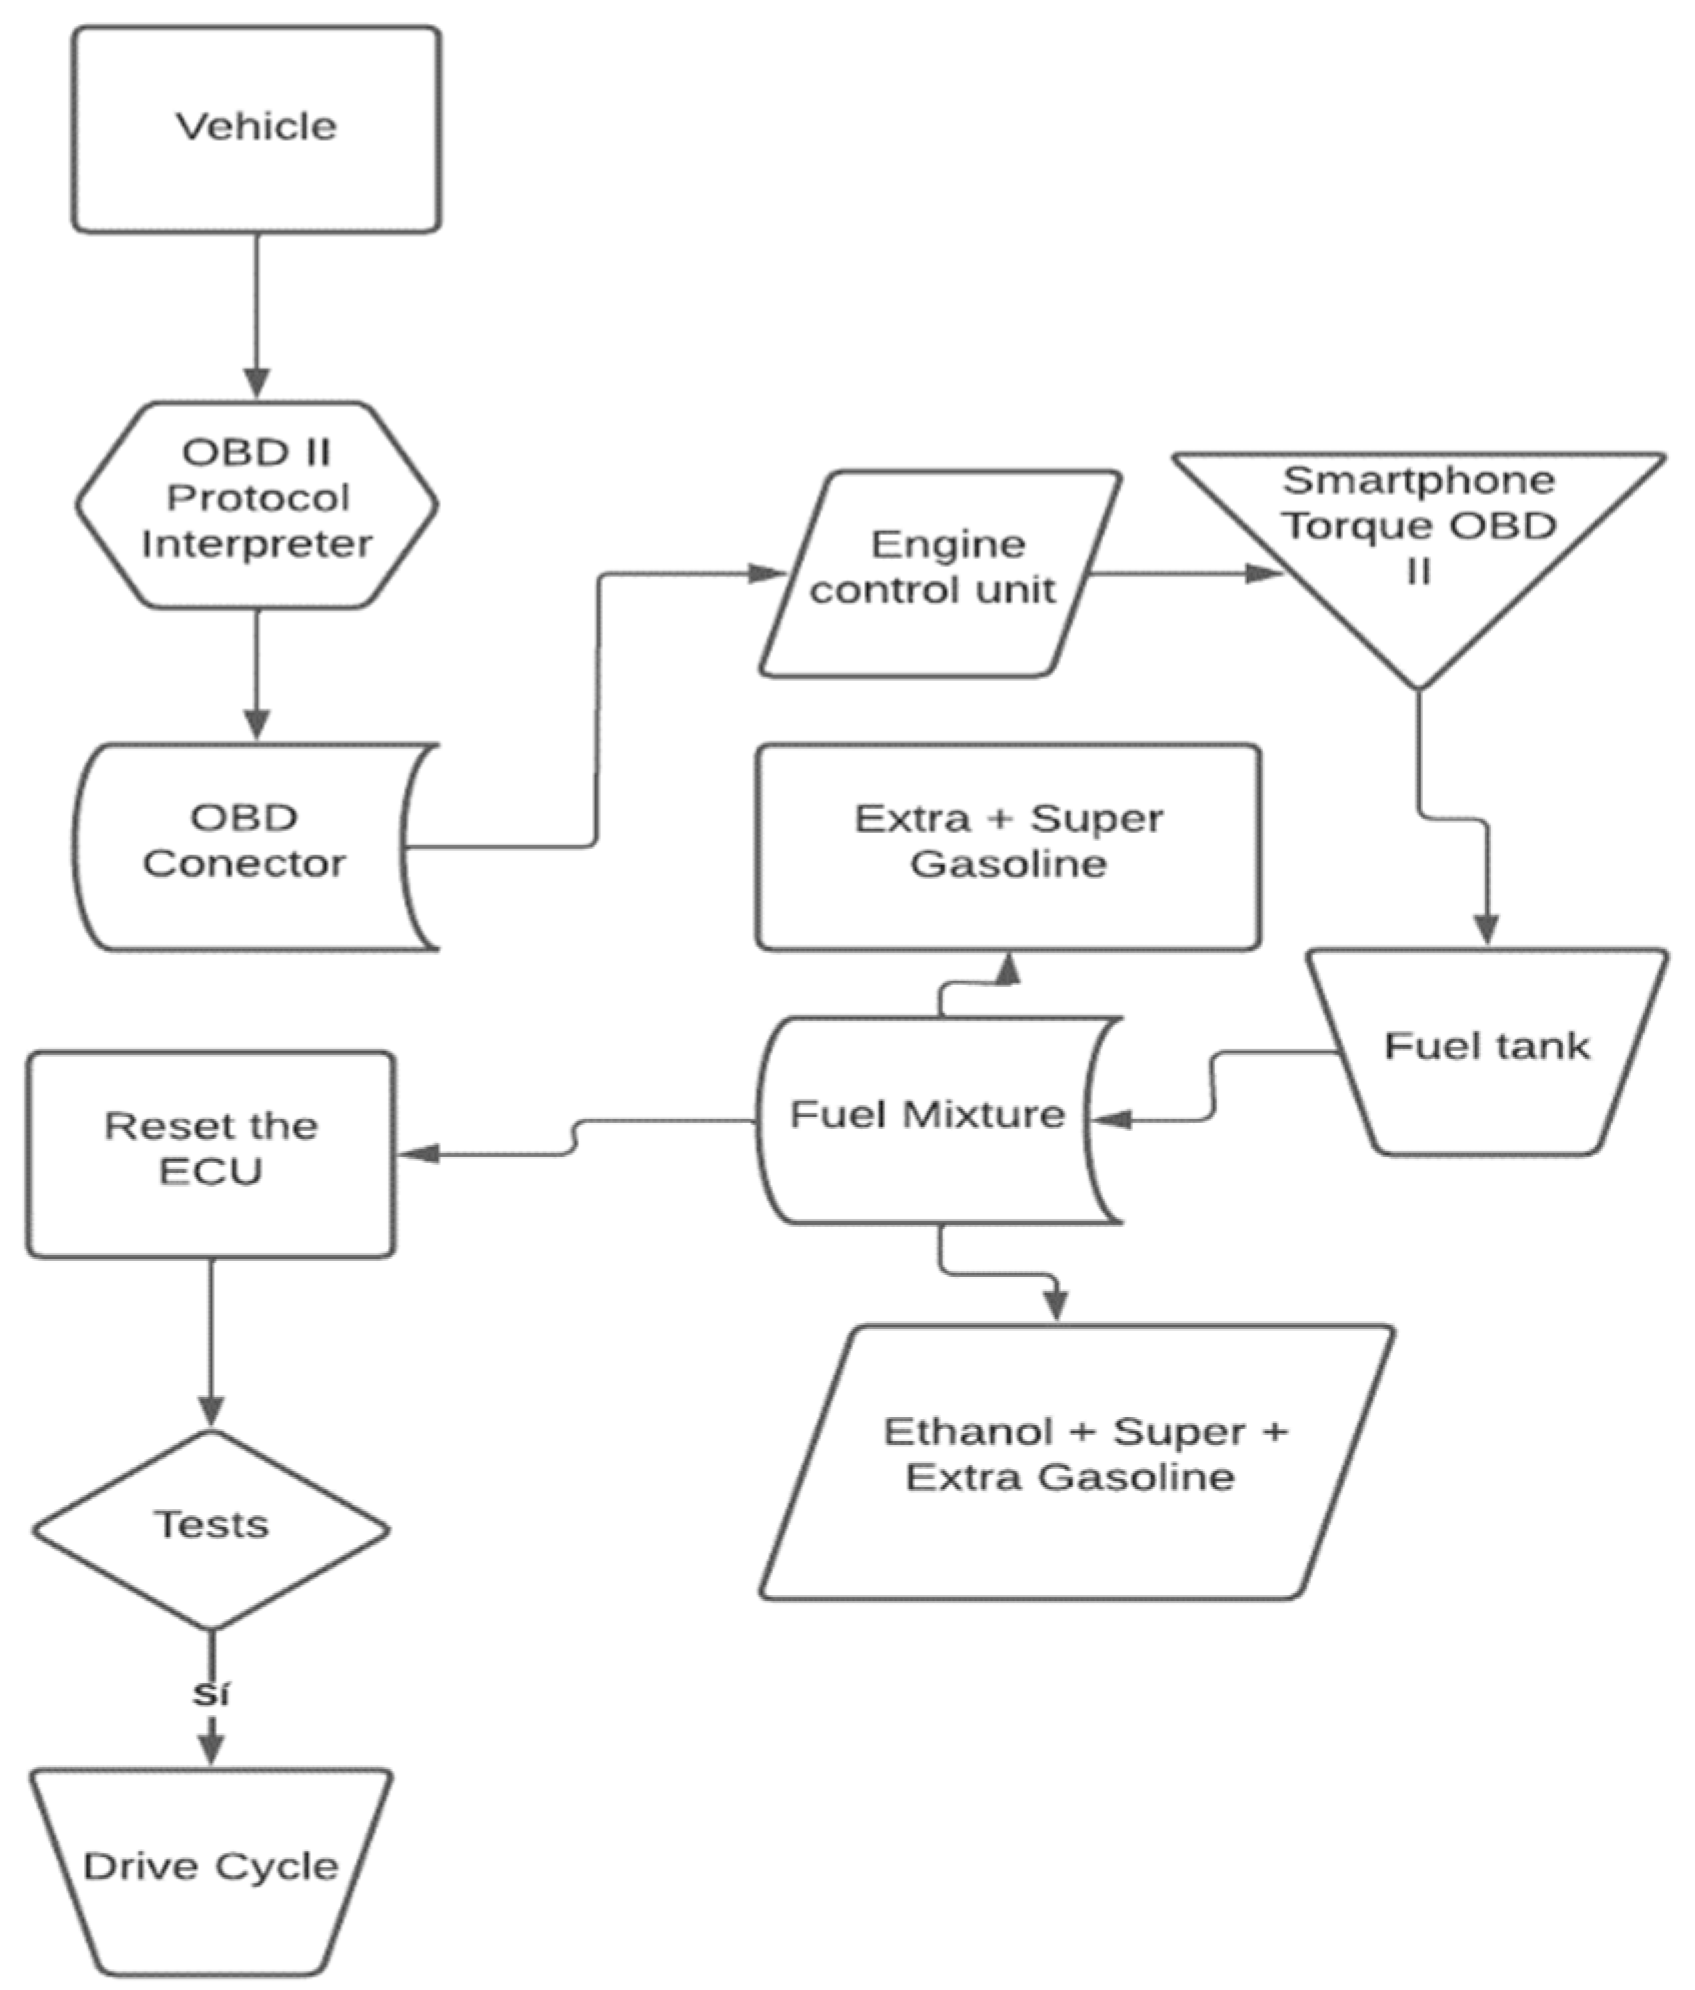
2.2. Methods
2.2.1. Driving Cycles
2.2.2. Uncertainty Analysis
3. Results
4. Discussion
5. Conclusions
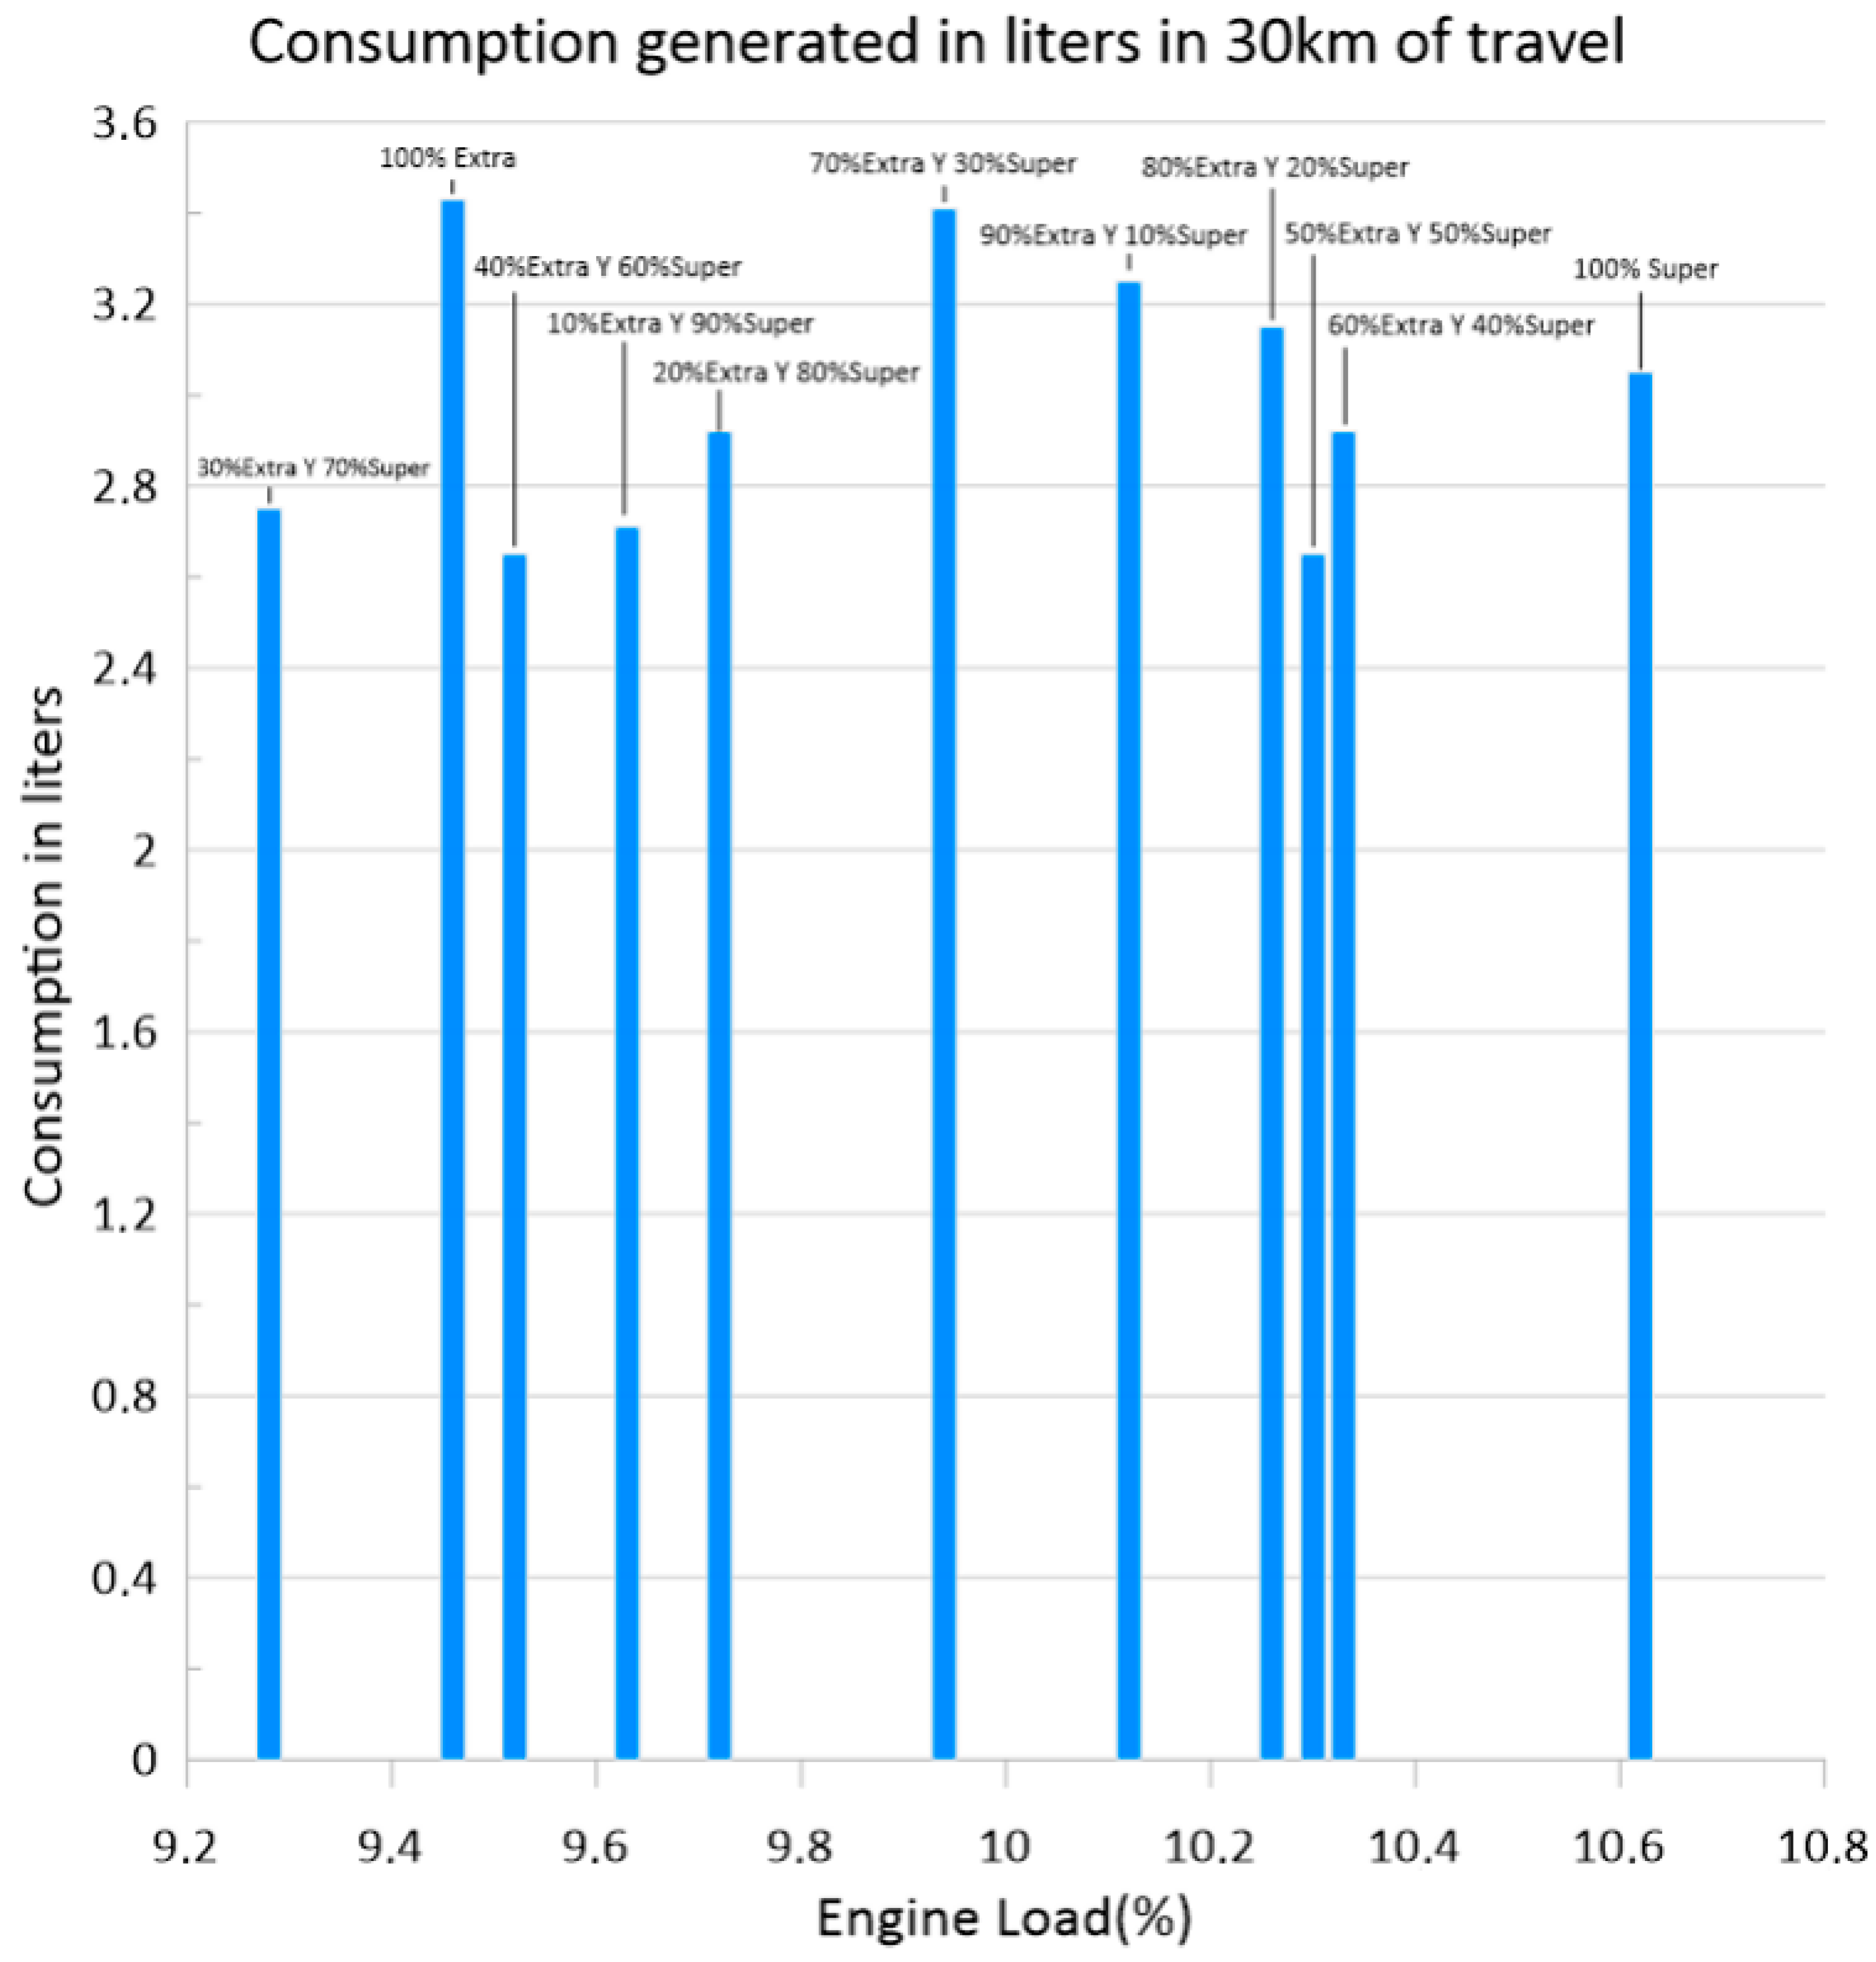
- The engine obtained the lowest fuel consumption on the routes traced with the mixture of 20% extra and 80% super, obtaining a value of 2.91 L, which when counteracted with the value of 100% extra, which consumed an average of 3.432 L on the routes drawn, decreased consumption by 15% on average. This indicates that making the mixtures to improve performance allows for similar consumption characteristics to be maintained, allowing a decrease in economic expenditure while maintaining the functionality of combustion.
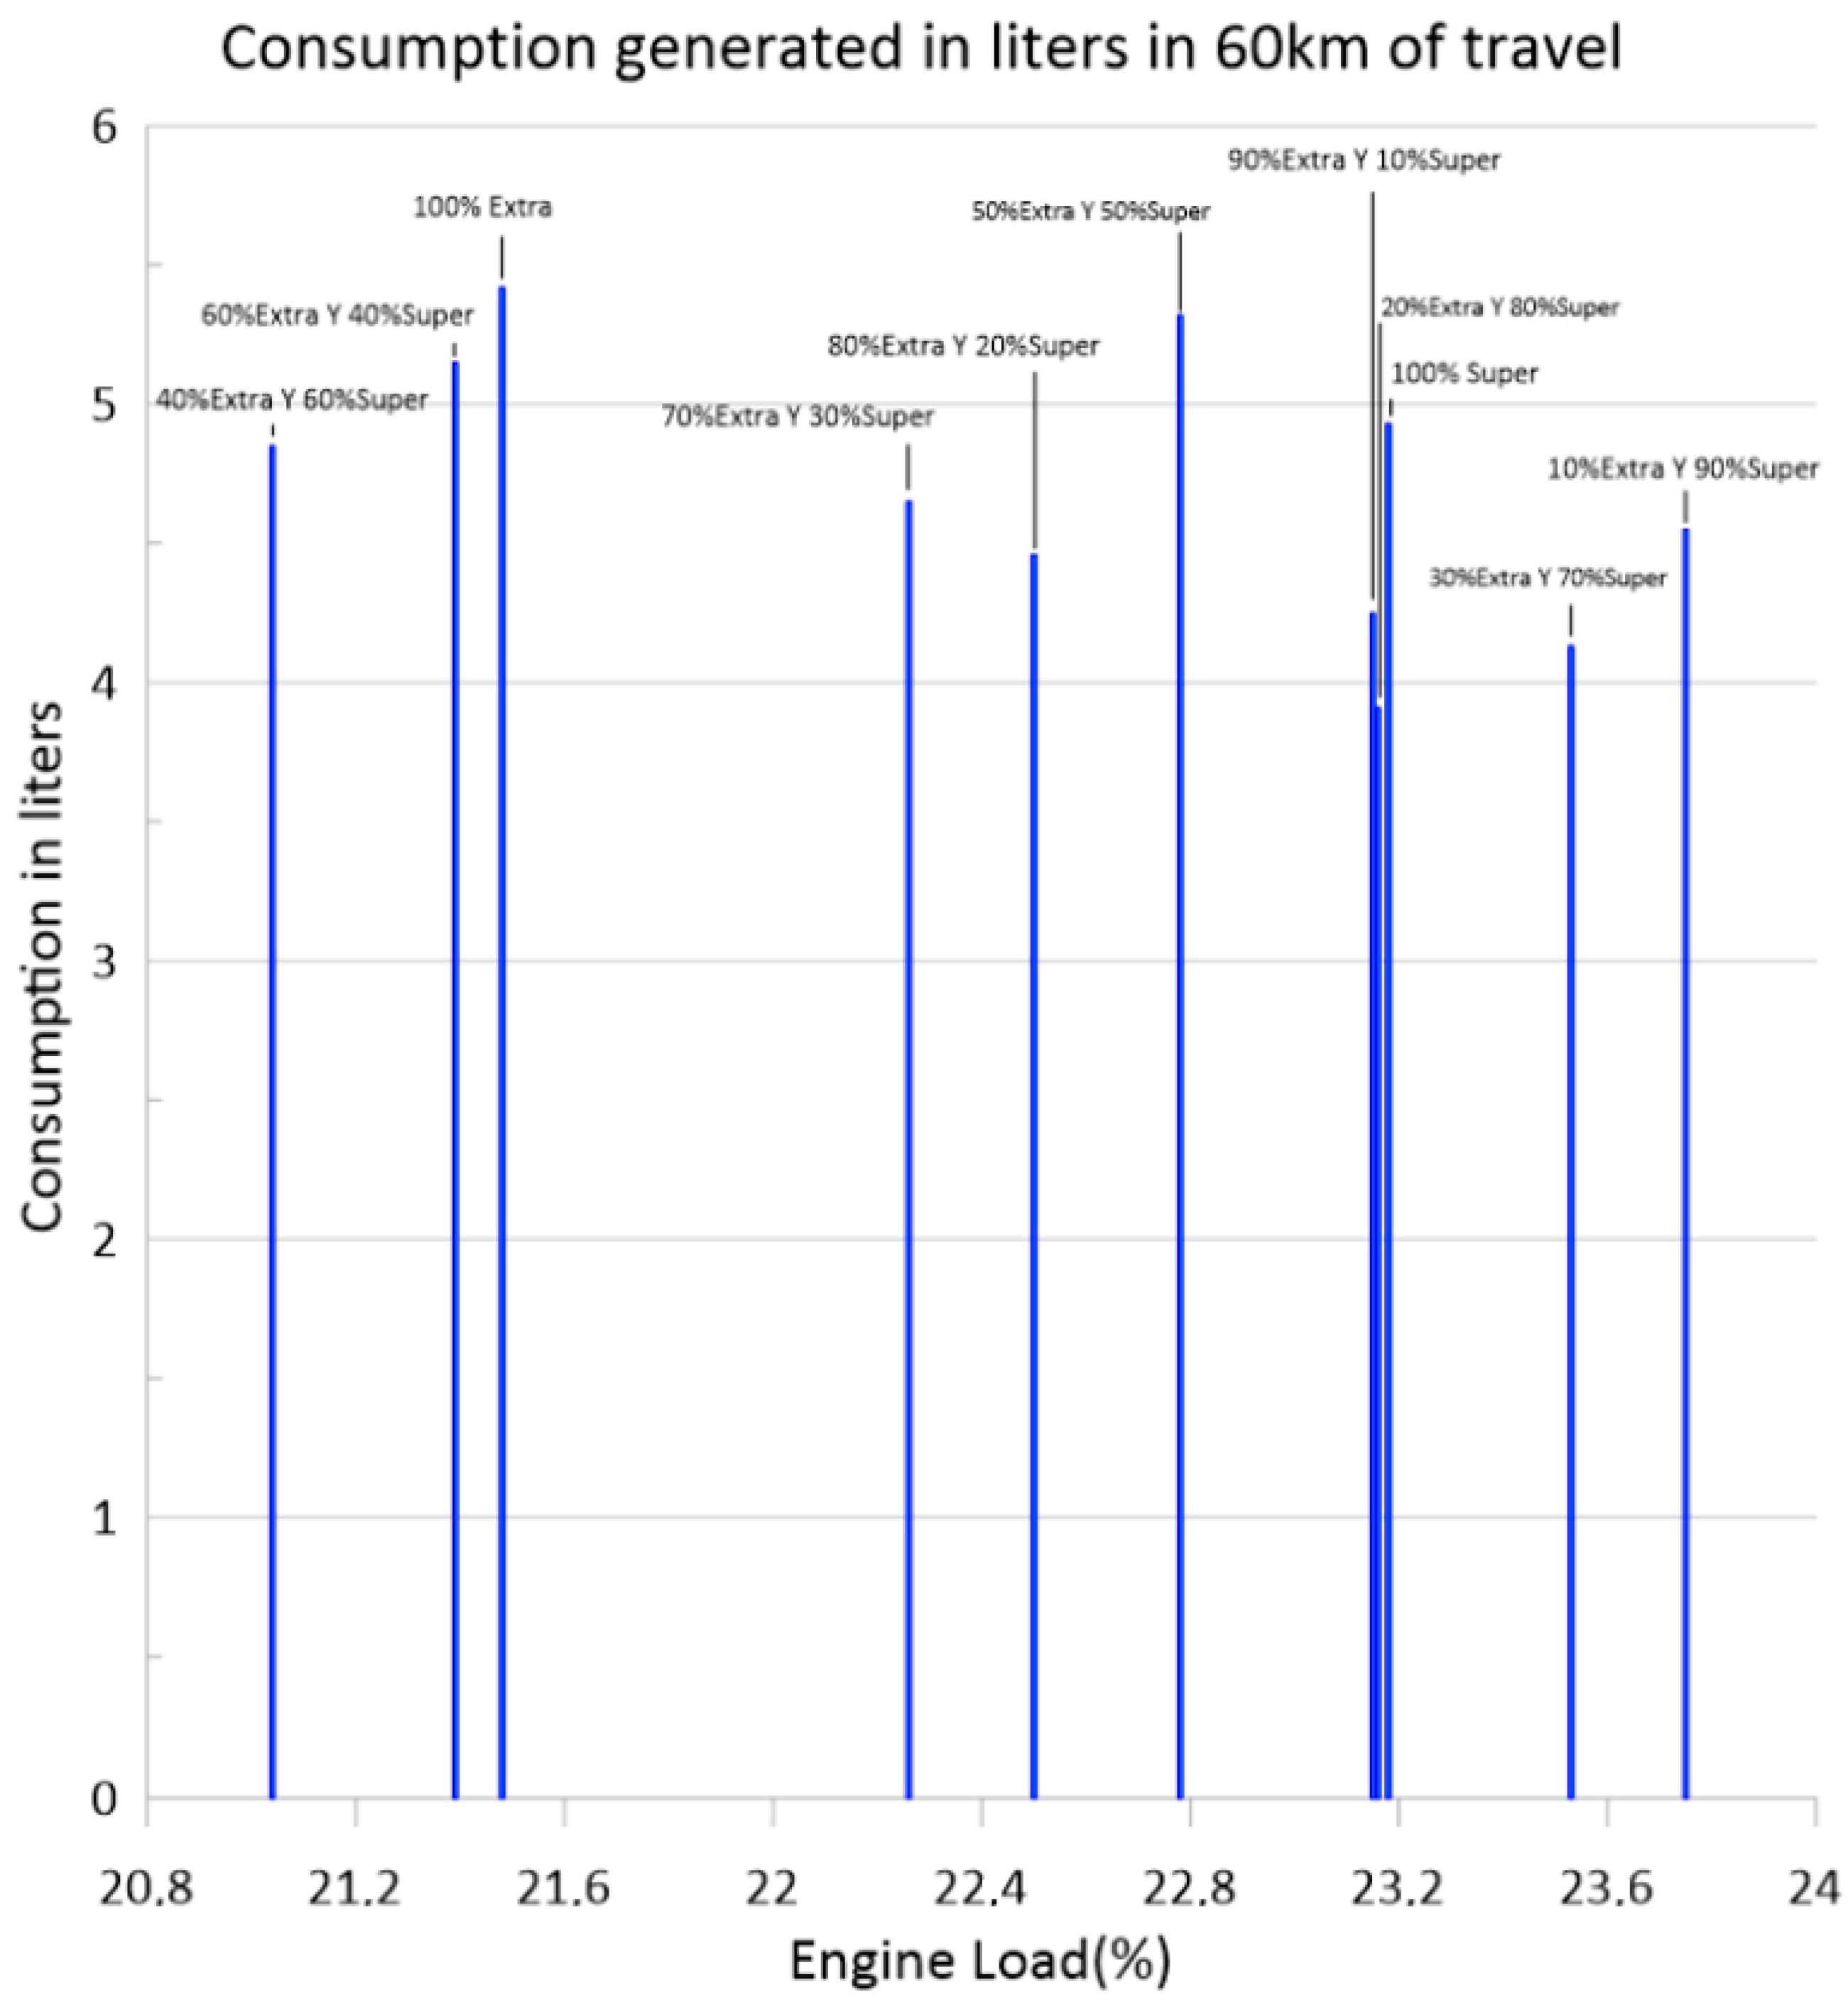
- It was found that the ideal mix in the consumption and efficiency of engine development in torque generation was 70% super and 30% extra for engines with a compression ratio between 9:1 and 10:1, obtaining better performance and autonomy both on the road and in traffic circulation with 2.754 (9.08%) liters and 4.126 (16.3%) liters, respectively.
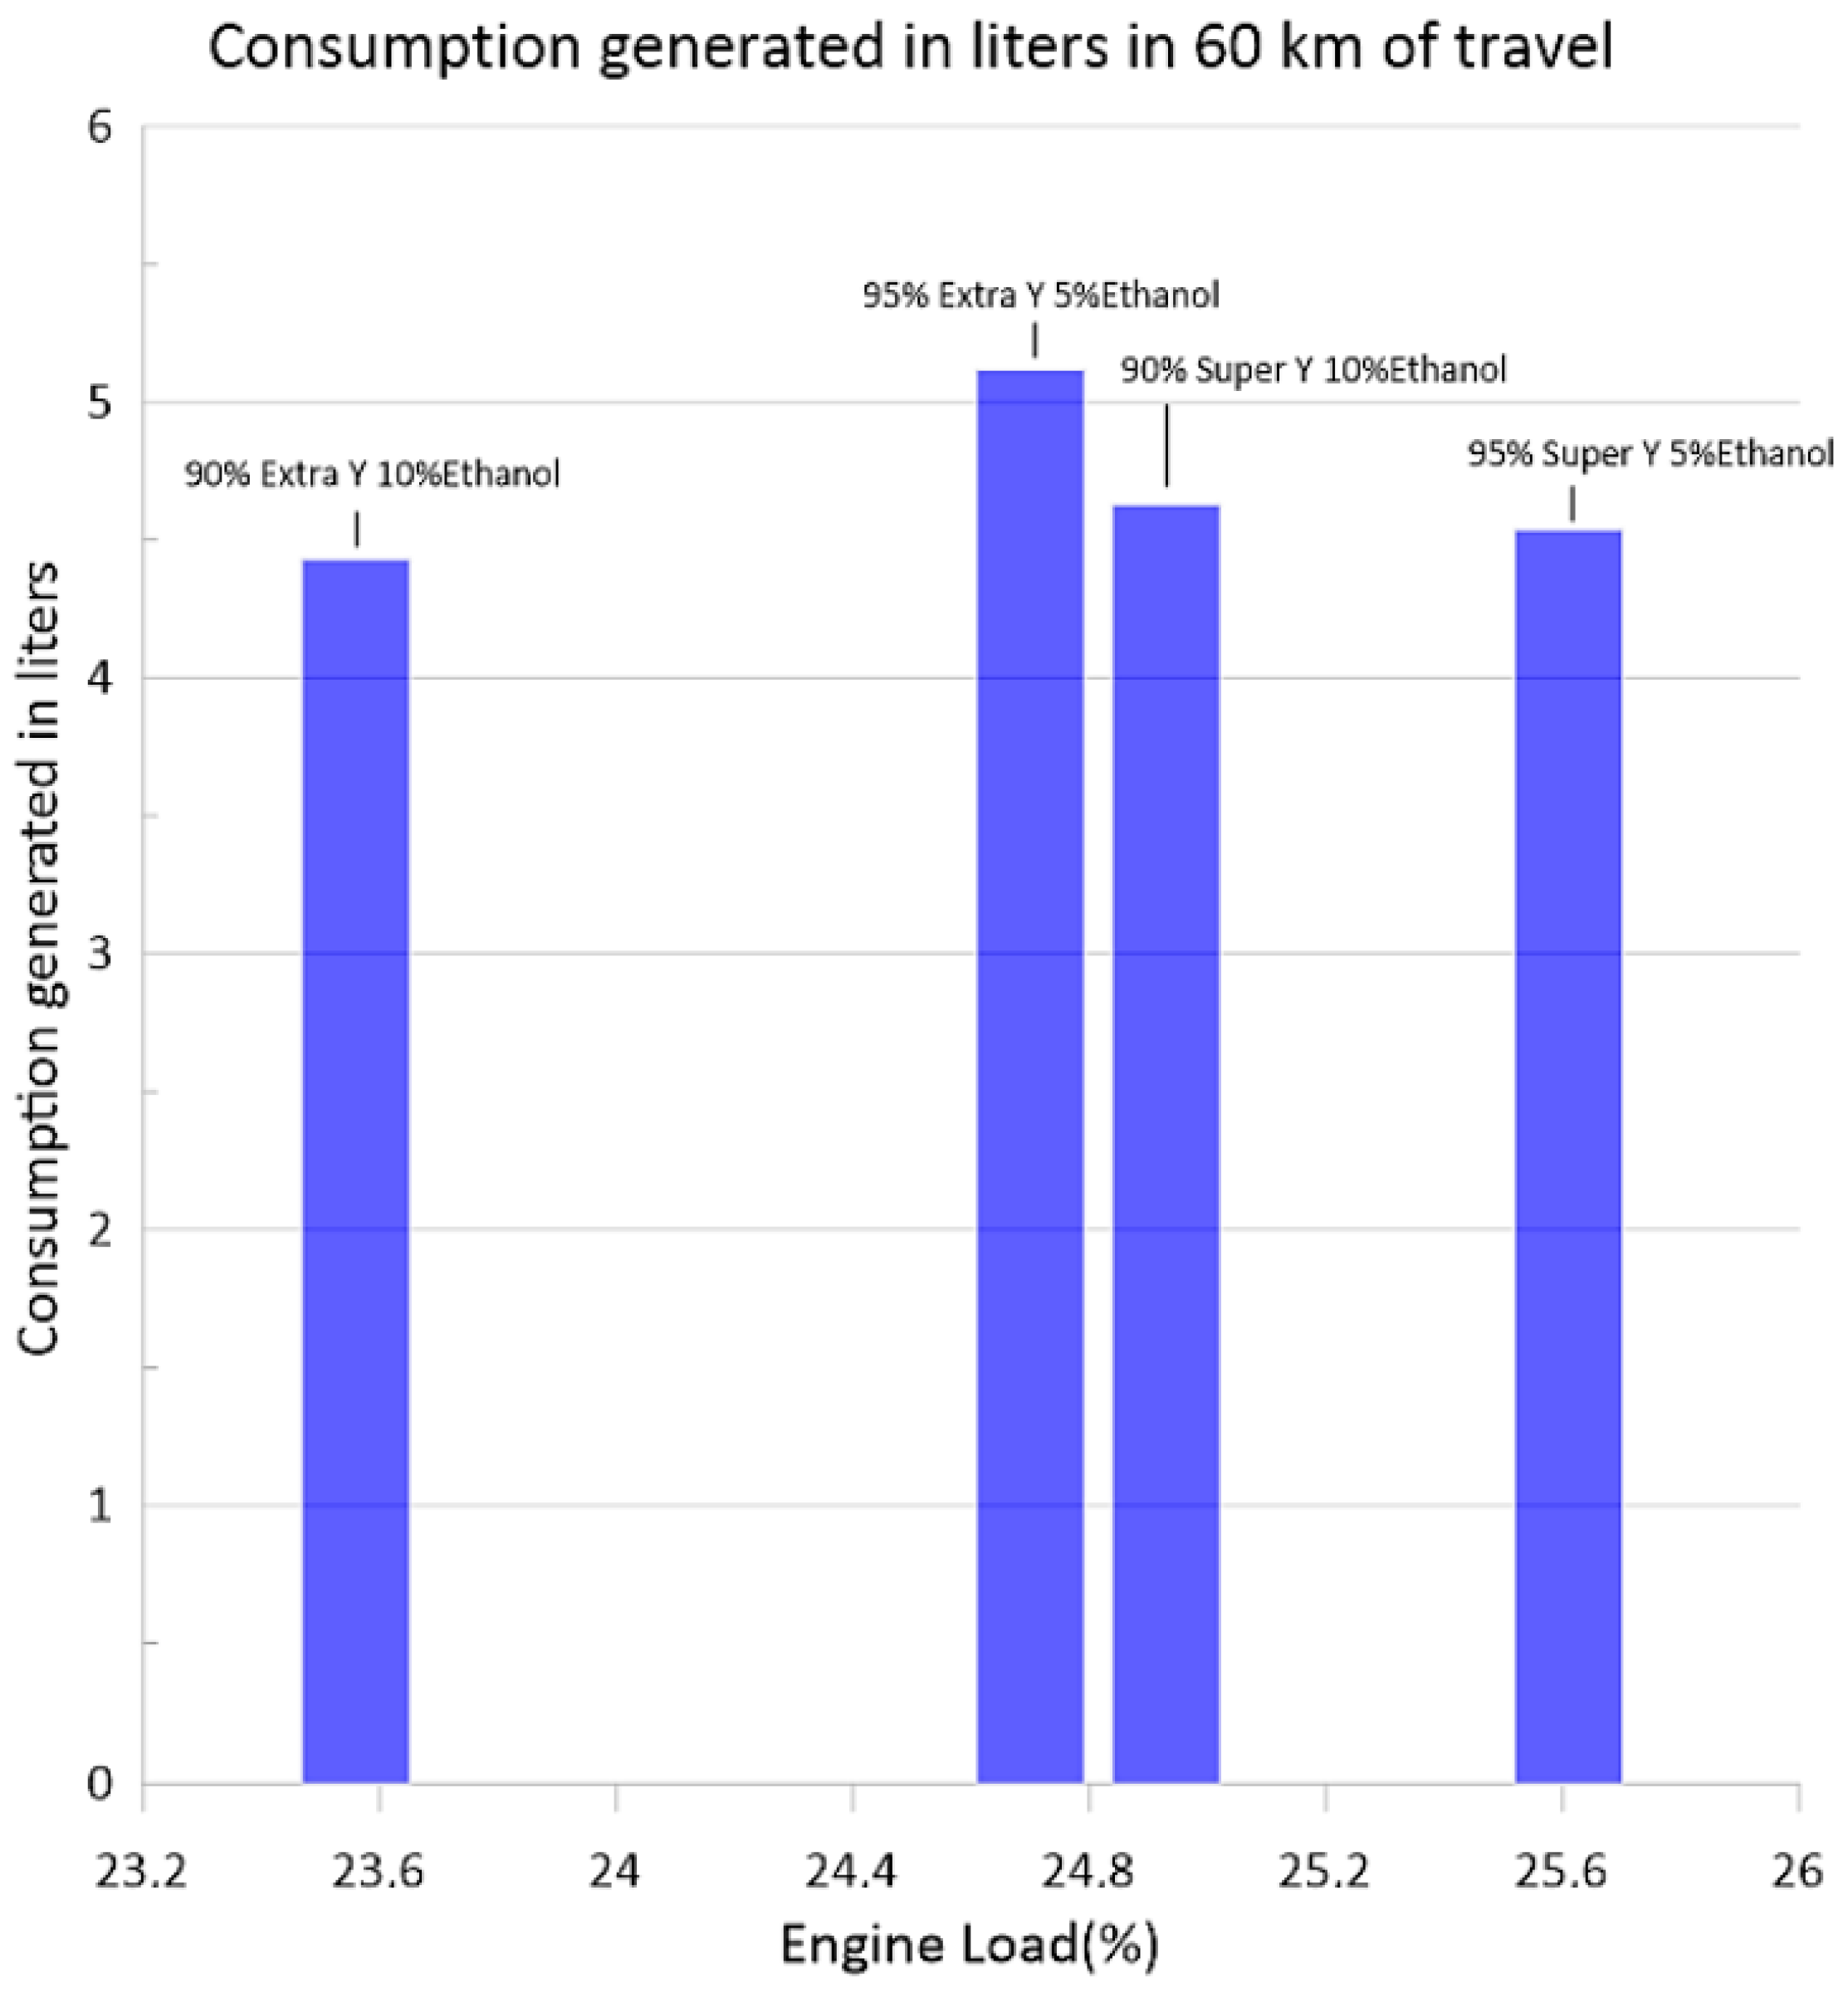
- It was determined that the most suitable fuel to generate blends with ethanol was extra gasoline, since it contains 86 octane and ethanol provides an oxygenating agent to reduce specific consumption and CO2 emissions, respectively. This is because the premium gasoline, having more additives, generated an instability in the mixture, so a percentage higher than 5% causes a malfunction in the combustion.
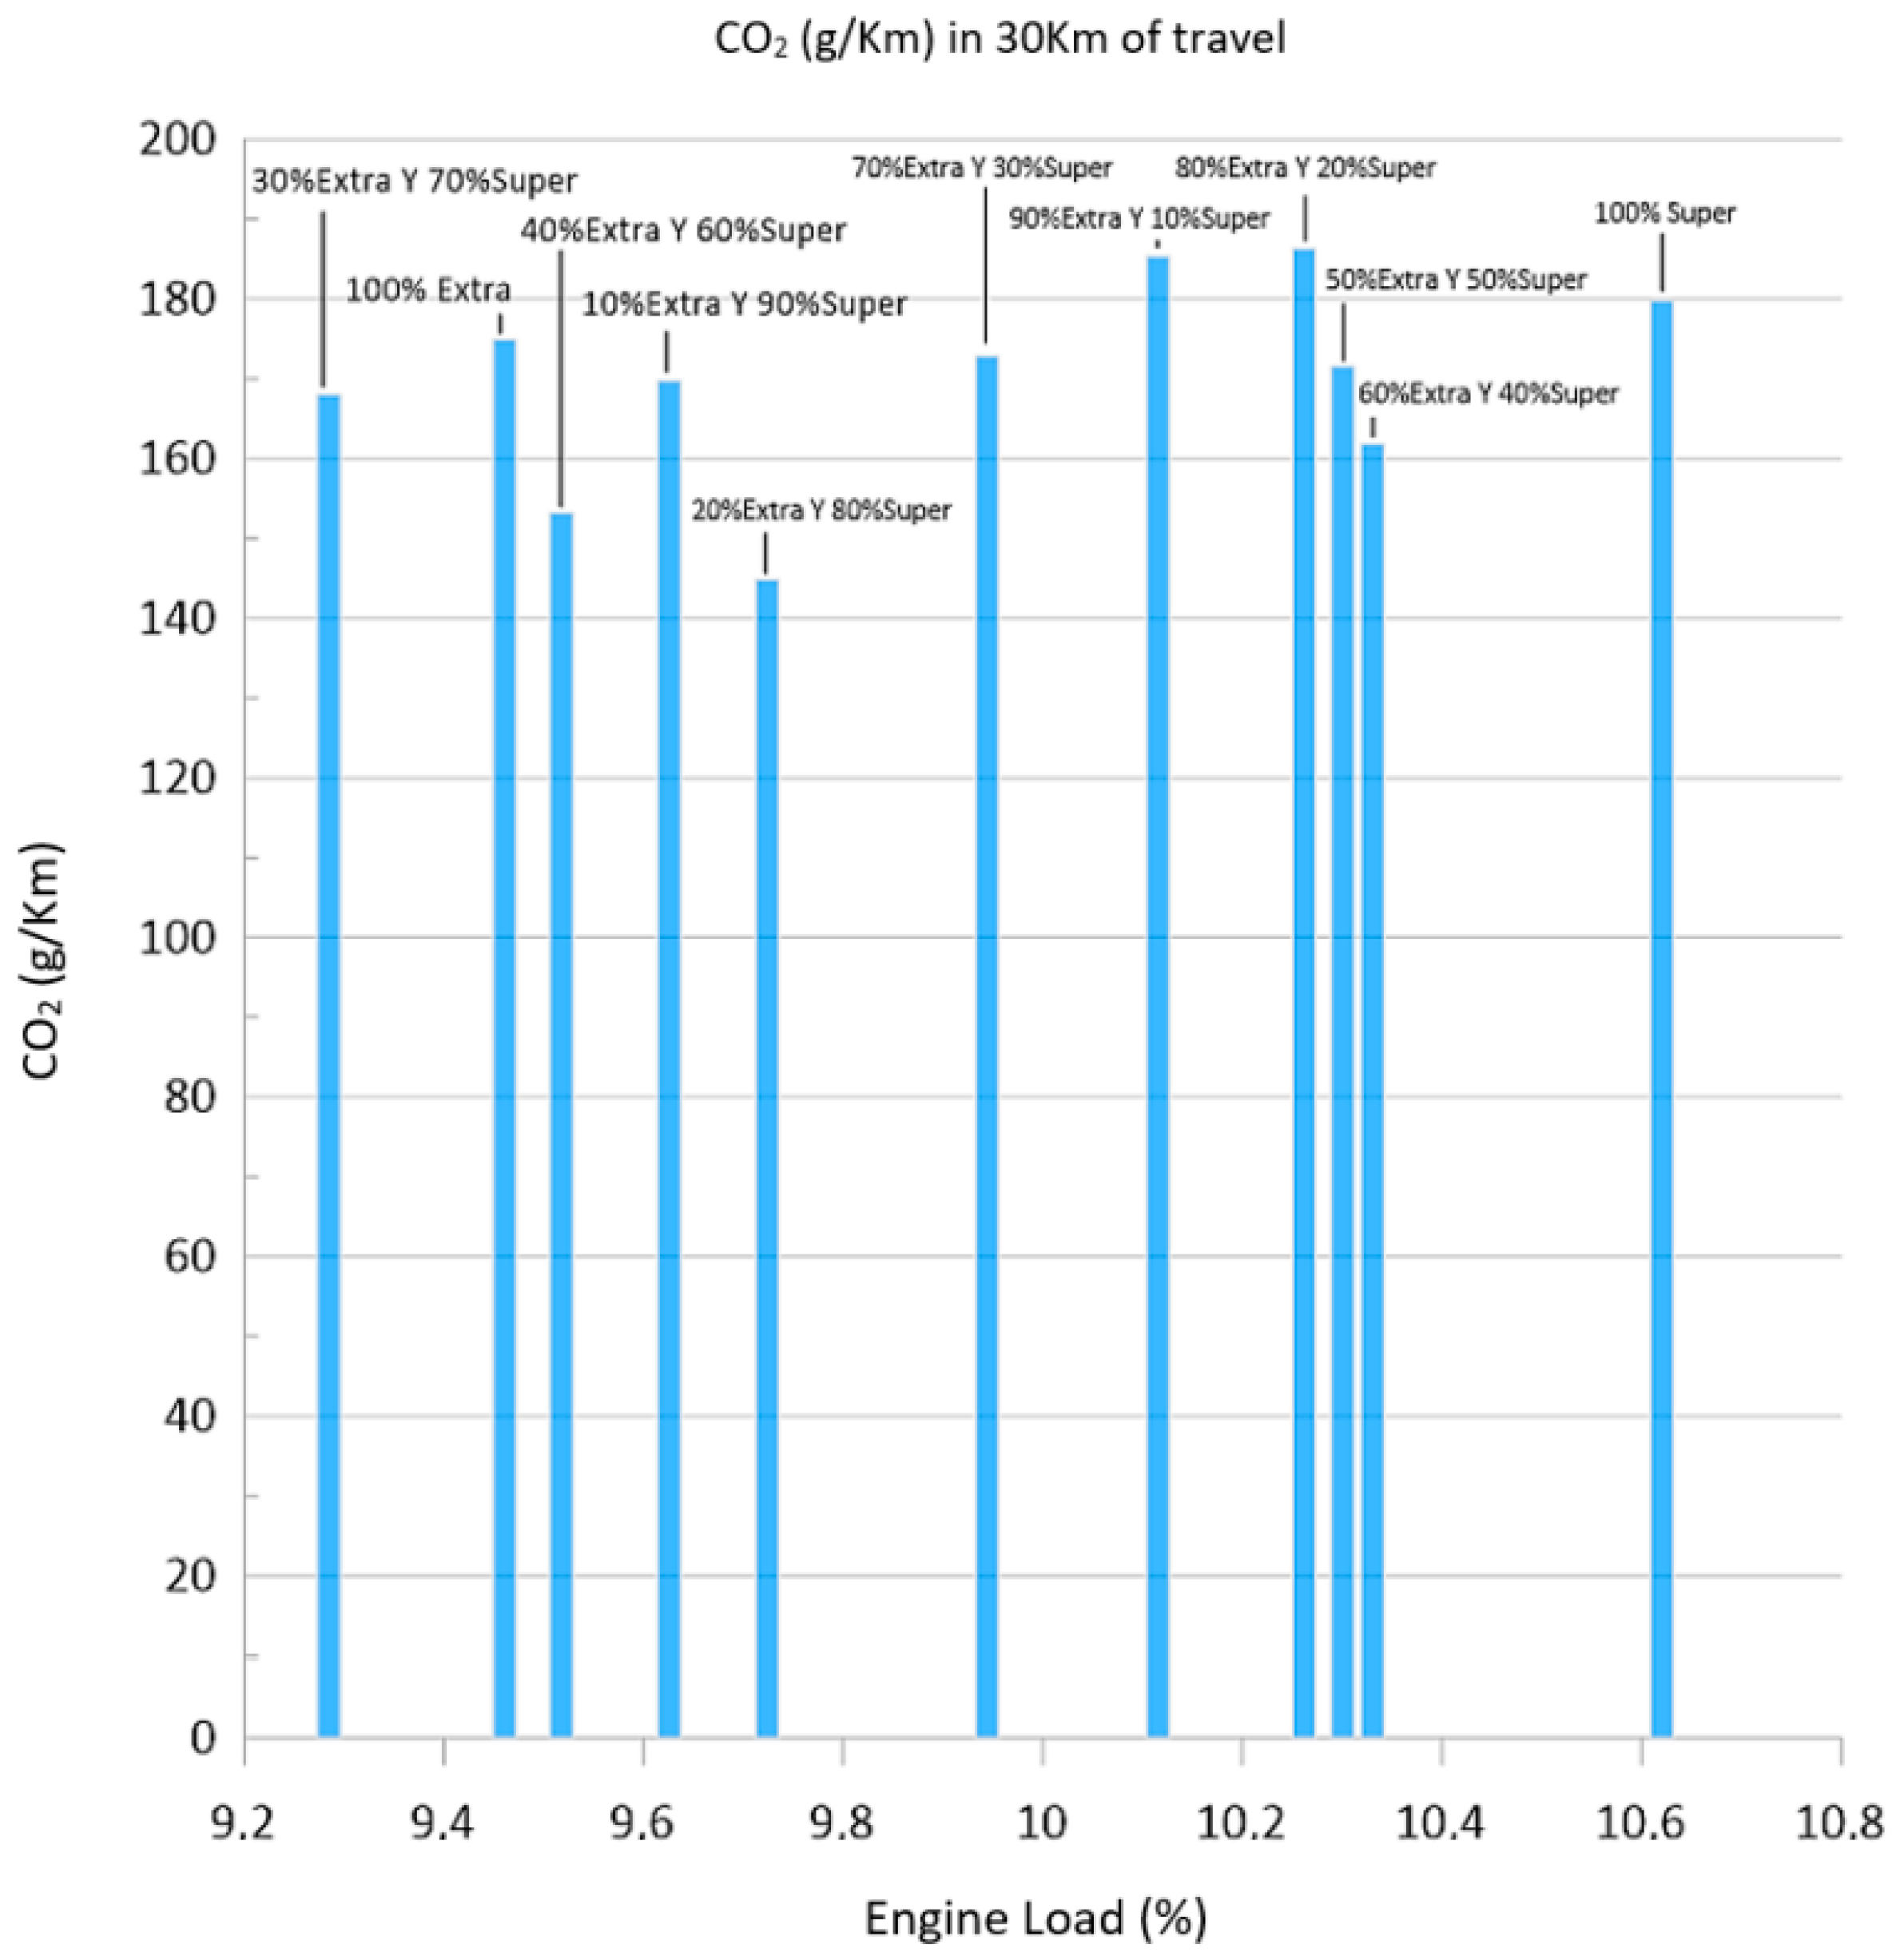
- The mixture of extra with 10% ethanol (E10) reduced the CO2 emissions and the vehicle had better performance and autonomy when compared to a value of 100% extra, showing a decrease in CO2 of 15.13% in generation. This is the most optimal mixture dosing for both repair and fuel consumption.
- After the analysis, we deduced that the mixture of 5% and 10% ethanol, when mixed with super, had a low performance in the vehicle due to the increase in the number of RON in the mixture.
- It was found that on Simón Bolívar Highway, the mix between extra and super maintained the same consumption depending on the driving mode. This is because it is a road with stable average speed conditions, according to the existing traffic during peak hours.
- The ethanol mixture affects the vehicle due to its high vaporization content, which was analyzed as the content of stabilizers and additives to maintain the mixture is extremely relevant to keeping the stability of the blended gasoline. Ethanol showed a considerable improvement in fuel RON, in addition to considerably reducing the combustion emissions in the exhaust phase, improving fuel consumption in mainly traffic conditions and in stable road speed conditions.
- Due to the low compression ratio of the vehicle, it was not possible to mix gasoline with concentrations of E15 and E20, since the engine had ignition problems. In order to increase the amount of ethanol, engines with compression ratios greater than 10:1 must be used to avoid ignition problems, since ethanol decreases the calorific value of the mixture.
6. Recommendations
- It is recommended to make ethanol blends for direct injection vehicles with compression ratios greater than or equal to 10:1.
- Generate a database of the parameters obtained from the mixture of ethanol and gasoline to analyze volatility.
- Review the octane parameters of the ethanol and gasoline blends to verify the number of RON generated by each blend.
Author Contributions
Funding
Institutional Review Board Statement
Informed Consent Statement
Data Availability Statement
Acknowledgments
Conflicts of Interest
References
- Objetivos de Desarrollo Sostenible | Programa De Las Naciones Unidas Para El Desarrollo. Available online: https://www.undp.org/es/sustainable-development-goals#accion-por-el-clima (accessed on 18 January 2023).
- Cáceres, L.; Mejía, R.; Ontaneda, G. Evidencias del cambio climático en Ecuador. Bull. L’institut Français D’études Andin. 1998, 27. Available online: https://www.redalyc.org/articulo.oa?id=12627319 (accessed on 18 January 2023). [CrossRef]
- Guzmán, A.R.; Cueva, E.; Peralvo, A.; Revelo, M.; Armas, A. Estudio del rendimiento dinámico de un motor Otto al utilizar mezclas de dos tipos de gasolinas: “Extra” y “Súper”. Enfoque UTE 2018, 9, 208–220. [Google Scholar] [CrossRef]
- INEN. Productos Derivados de Petróleo. Gasolina. Requisitos; NTE INEN 935 Novena Revisión; PRODUC; INEN: Quito, Ecuador, 2016; Available online: https://www.normalizacion.gob.ec/buzon/normas/NTE_INEN_935.pdf (accessed on 27 January 2023).
- Eyidogan, M.; Ozsezen, A.N.; Canakci, M.; Turkcan, A. Impact of alcohol–gasoline fuel blends on the performance and combustion characteristics of an SI engine. Fuel 2010, 89, 2713–2720. [Google Scholar] [CrossRef]
- Phuangwongtrakul, S.; Wechsatol, W.; Sethaput, T.; Suktang, K.; Wongwises, S. Experimental study on sparking ignition engine performance for optimal mixing ratio of ethanol–gasoline blended fuels. Appl. Therm. Eng. 2016, 100, 869–879. [Google Scholar] [CrossRef]
- Verma, A.; Dugala, N.S.; Singh, S. Experimental investigations on the performance of SI engine with Ethanol-Premium gasoline blends. Mater. Today Proc. 2021, 48, 1224–1231. [Google Scholar] [CrossRef]
- Catapano, F.; Sementa, P.; Vaglieco, B.M. Air-fuel mixing and combustion behavior of gasoline-ethanol blends in a GDI wall-guided turbocharged multi-cylinder optical engine. Renew. Energy 2016, 96, 319–332. [Google Scholar] [CrossRef]
- Gomez, A.; Zacarias, A. Modeling and Optimization of an Otto Cycle Using the Ethanol-Gasoline Blend. Rev. Mex. Ing. Química 2017, 16, 1065–1075. [Google Scholar]
- Valdivieso, J.C.; Godoy, C.R.; Sayuri, M.B.; Velarde, J.I.; Sánchez, G.V.; Sánchez, E.D.; Ramírez, R.A. Estudio comparativo de potencia, torque y emisiones contaminantes en un motor de combustión interna de encendido provocado (MEP) con combustible extra, e5 y e10 a una altura de 2700 MSNM. Infociencia 2017, 11, 132–138. [Google Scholar]
- Lema Parra, E.F. Comprobación del Comportamiento de un Motor de Combustión Interna Electrónico Ciclo Otto Usando Bioetanol Con Mezclas E5. Bachelor’s Thesis, Universidad Técnica del Norte, Ibarra, Ecuador, 2019; p. 87. [Google Scholar]
- Suarez, Y.R.; Mesa, Y.M.; Herranz, A.H. Thermodynamic Evaluation of Using Ethanol-Gasoline Blends in Spark Ignition Engine. Rev. Cienc. Técnicas Agropecu. 2020, 29, 24–31. [Google Scholar]
- Espinoza, F.; Tacuri, F.; Urgiles, W.R.C.; Vázquez, J. Algoritmo de predicción del consumo de combustible para mezcla de etanol anhídrido en ciudades de altura. Ingenius 2020, 25, 41–49. [Google Scholar] [CrossRef]
- Hsieh, W.-D.; Chen, R.-H.; Wu, T.-L.; Lin, T.-H. Engine performance and pollutant emission of an SI engine using ethanol–gasoline blended fuels. Atmos. Environ. 2002, 36, 403–410. [Google Scholar] [CrossRef]
- Li, D.; Yu, X.; Du, Y.; Xu, M.; Li, Y.; Shang, Z.; Zhao, Z. Study on combustion and emissions of a hydrous ethanol/gasoline dual fuel engine with combined injection. Fuel 2021, 309, 122004. [Google Scholar] [CrossRef]
- Al-Harbi, A.A.; Alabduly, A.J.; Alkhedhair, A.M.; Alqahtani, N.B.; Albishi, M.S. Effect of operation under lean conditions on NOx emissions and fuel consumption fueling an SI engine with hydrous ethanol–gasoline blends enhanced with synthesis gas. Energy 2021, 238, 121694. [Google Scholar] [CrossRef]
- Kaya, G. Experimental comparative study on combustion, performance and emissions characteristics of ethanol-gasoline blends in a two stroke uniflow gasoline engine. Fuel 2022, 317, 120917. [Google Scholar] [CrossRef]
- Wu, C.-W.; Chen, R.-H.; Pu, J.-Y.; Lin, T.-H. The influence of air–fuel ratio on engine performance and pollutant emission of an SI engine using ethanol–gasoline-blended fuels. Atmos. Environ. 2004, 38, 7093–7100. [Google Scholar] [CrossRef]
- Topgül, T.; Yücesu, H.S.; Çinar, C.; Koca, A. The effects of ethanol–unleaded gasoline blends and ignition timing on engine performance and exhaust emissions. Renew. Energy 2006, 31, 2534–2542. [Google Scholar] [CrossRef]
- Mohammed, M.K.; Balla, H.H.; Al-Dulaimi, Z.M.H.; Kareem, Z.S.; Al-Zuhairy, M.S. Effect of ethanol-gasoline blends on SI engine performance and emissions. Case Stud. Therm. Eng. 2021, 25, 100891. [Google Scholar] [CrossRef]
- Ghazikhani, M.; Hatami, M.; Safari, B.; Ganji, D.D. Experimental investigation of exhaust temperature and delivery ratio effect on emissions and performance of a gasoline–ethanol two-stroke engine. Case Stud. Therm. Eng. 2014, 2, 82–90. [Google Scholar] [CrossRef]
- Xie, M.; Li, Q.; Fu, J.; Yang, H.; Wang, X.; Liu, J. Chemical kinetic investigation on NOx emission of SI engine fueled with gasoline-ethanol fuel blends. Sci. Total Environ. 2022, 831, 154870. [Google Scholar] [CrossRef]
- Can, Ö.; Çelikten, I.; Usta, N. Effects of ethanol addition on performance and emissions of a turbocharged indirect injection Diesel engine running at different injection pressures. Energy Convers. Manag. 2004, 45, 2429–2440. [Google Scholar] [CrossRef]
- Kim, Y.; Kim, W.I.; Min, B.; Seo, J.; Lee, K. Experimental investigation of combustion characteristics of ethanol–gasoline blended fuel in a T-GDI engine. Appl. Therm. Eng. 2022, 208, 118168. [Google Scholar] [CrossRef]
- Yusuf, A.A.; Yahyah, H.; Farooq, A.A.; Buyondo, K.A.; Olupot, P.W.; Nura, S.S.; Sanni, T.; Hannington, T.; Ukundimana, Z.; Hassan, A.S.; et al. Characteristics of ultrafine particle emission from light-vehicle engine at city transport-speed using after-treatment device fueled with n-butanol-hydrogen blend. Case Stud. Chem. Environ. Eng. 2021, 3, 100085. [Google Scholar] [CrossRef]
- Yusuf, A.A.; Inambao, F.L. Effect of low bioethanol fraction on emissions, performance, and combustion behavior in a modernized electronic fuel injection engine. Biomass-Convers. Biorefinery 2019, 11, 885–893. [Google Scholar] [CrossRef]
- Abdel-Rahman, A.A.; Osman, M.M. Experimental investigation on varying the compression ratio of SI engine working under different ethanol–gasoline fuel blends. Int. J. Energy Res. 1997, 21, 31–40. [Google Scholar] [CrossRef]
- Pan, J.; Hu, Z.; Pan, Z.; Shu, G.; Wei, H.; Li, T.; Liu, C. Auto-ignition and knocking characteristics of gasoline/ethanol blends in confined space with turbulence. Fuel 2021, 294, 120559. [Google Scholar] [CrossRef]
- Said, Z.; Nguyen, T.H.; Sharma, P.; Li, C.; Ali, H.M.; Nguyen, V.N.; Pham, V.V.; Ahmed, S.F.; Van, D.N.; Truong, T.H. Multi-attribute optimization of sustainable aviation fuel production-process from microalgae source. Fuel 2022, 324, 124759. [Google Scholar] [CrossRef]
- Iodice, P.; Cardone, M. Ethanol/Gasoline Blends as Alternative Fuel in Last Generation Spark-Ignition Engines: A Review on CO and HC Engine out Emissions. Energies 2021, 14, 4034. [Google Scholar] [CrossRef]
- KONNWEI. User´s Manual OBDII–EOBD SCANER No. 319 Building. Available online: http://konnwei.com/upload/KW901%20KW902%20KW903%20BT%20user%20manual.pdf (accessed on 25 October 2022).
- Rosero, G.M.; Erazo, G.; Quiroz, J. Implementación de un Banco de Pruebas Automatizado para el Diagnóstico del Motor Optra 1.8 del Laboratorio de Autotrónica. 2014, p. 1. Available online: http://repositorio.espe.edu.ec/handle/21000/8178 (accessed on 23 September 2022).
- EL COMERCIO. Unos 30 Minutos Toma Salir de Sitios Congestionados en Quito. Quito. March 2022. Available online: https://www.elcomercio.com/actualidad/quito/minutos-demora-congestion-avenidas-quito-transito.html (accessed on 21 September 2022).
- EL UNIVERSO. ARC Garantiza Octanaje de Gasolinas Extra y Súper y Demuestra Cómo es el Proceso de Medición. Quito. April 2022. Available online: https://www.eluniverso.com/noticias/economia/como-se-mide-el-octanaje-de-las-gasolinas-extra-y-super-en-el-laboratorio-de-la-agencia-de-regulacion-y-control-de-energia-nota/ (accessed on 1 October 2022).
- Asamblea Nacional. Reglamento a Ley de Transporte Terrestre Tránsito y Seguridad Vial. Ley. 2012, pp. 1–91. Available online: https://www.obraspublicas.gob.ec/wp-content/uploads/downloads/2015/03/Decreto-Ejecutivo-No.-1196-de-11-06-2012-REGLAMENTO-A-LA-LEY-DE-TRANSPORTE-TERRESTRE-TRANSITO-Y-SEGURIDAD-VIA.pdf (accessed on 1 October 2022).
- Beltran, J. Análisis del uso de Diferentes Tipos de Gasolinas y Aditivos en la Vida Útil de Algunos Elementos de un Motor de Combustión Interna: Analysis of the Use of Different Types of Gasoline and Additives in the Useful Life of Some Elements of an Internal Combustion Engine. Revista de Investigación IST Central Técnico, 3rd Edition. 2020. Available online: http://www.investigacionistct.ec/ojs/index.php/investigacion_tecnologica/article/view/35 (accessed on 27 January 2023).
- Celik, M.B. Experimental determination of suitable ethanol–gasoline blend rate at high compression ratio for gasoline engine. Appl. Therm. Eng. 2008, 28, 396–404. [Google Scholar] [CrossRef]
- NTE INEN 2204; Gestión Ambiental. Aire. Vehículos Automotores. Límites Permitidos de Emisiones Producidas por Fuentes Móviles Terrestres que Emplean Gasolina. Inst. Ecuatoriano Norm.: Quito, Ecuador, 2017.


| Mixtures | Power (HP) | Torque (Nm) |
|---|---|---|
| Extra | 77.6 | 86.8 |
| Super | 79.4 | 89.2 |
| 50% Super and 50% Extra | 81.3 | 86.4 |
| 70% Super and 30% Extra | 79.9 | 86.6 |
| Combustibles | Research Octane Number (RON) |
|---|---|
| 100% Extra | 85.4 |
| 100% Super | 92.0 |
| 50% Super and 50% Extra | 88.8 |
| 70% Super and 30% Extra | 89.8 |
| Vehicle | Engine | Year | Compression Ratio | Torque (kg) | Power (HP) |
|---|---|---|---|---|---|
| Chevrolet Optra | T18SED | 2008 | 9.8:1 | 17.40 | 122 |
| City | Height | Average Temperature |
|---|---|---|
| Quito (Ecuador) | ≈2850 m above sea level | 17 °C |
| Route | Distance [km] | Type |
|---|---|---|
| Maldonado Avenue from Cutulagua to the Villaflora roundabout | 28.4 | Avenue |
| Av. Simón Bolívar from the El Ciclista roundabout to the Guajaló Bridge | 59.7 | Highway |
| 88.1 | Total |
| Properties | Gasoline | Ethanol |
|---|---|---|
| Chemical formula | C5H10aC9H18 | C2H5OH |
| Physical state | Liquid | Liquid |
| Molecular weight composition (wt%) | 100–105 | 46 |
| Carbon | 85–88 | 52.2 |
| Oxygen | 0 | 34.7 |
| Specific gravity (15.5 °C) | 0.72–0.78 | 0.796 |
| Boiling temperature | 27–225 | 78 |
| Freezing temperature (°C) | −40 | −114 |
| Reid vapor pressure (bar) | 0.55–1.034 | 0.16 |
| Calorific power (MJ/Kg) | 44–47.3 | 27 |
| Research octane number (Ecuador) | 87–92 | 113 |
| Mixture | Engine Load (%) | CO2 (g/km) | Consumption (L/100 km) | Consumption in Route (L/30 km) |
|---|---|---|---|---|
| 100% Extra | 9.461 | 174.957 | 0.795 | 3.432 |
| 100% Super | 10.620 | 179.801 | 0.350 | 3.050 |
| 90% Extra and 10% Super | 10.115 | 185.366 | 0.211 | 3.252 |
| 80% Extra and 20% Super | 10.262 | 186.310 | 0.258 | 3.154 |
| 70% Extra and 30% Super | 9.944 | 172.832 | 0.169 | 3.411 |
| 60% Extra and 40% Super | 10.330 | 161.871 | 0.171 | 2.923 |
| 50% Extra and 50% Super | 10.301 | 171.548 | 0.217 | 2.645 |
| 40% Extra and 60% Super | 9.518 | 153.222 | 0.141 | 2.654 |
| 30% Extra and 70% Super | 9.285 | 168.040 | 0.140 | 2.754 |
| 20% Extra and 80% Super | 9.724 | 144.816 | 0.152 | 2.921 |
| 10% Extra and 90% Super | 9.626 | 169.772 | 0.160 | 2.712 |
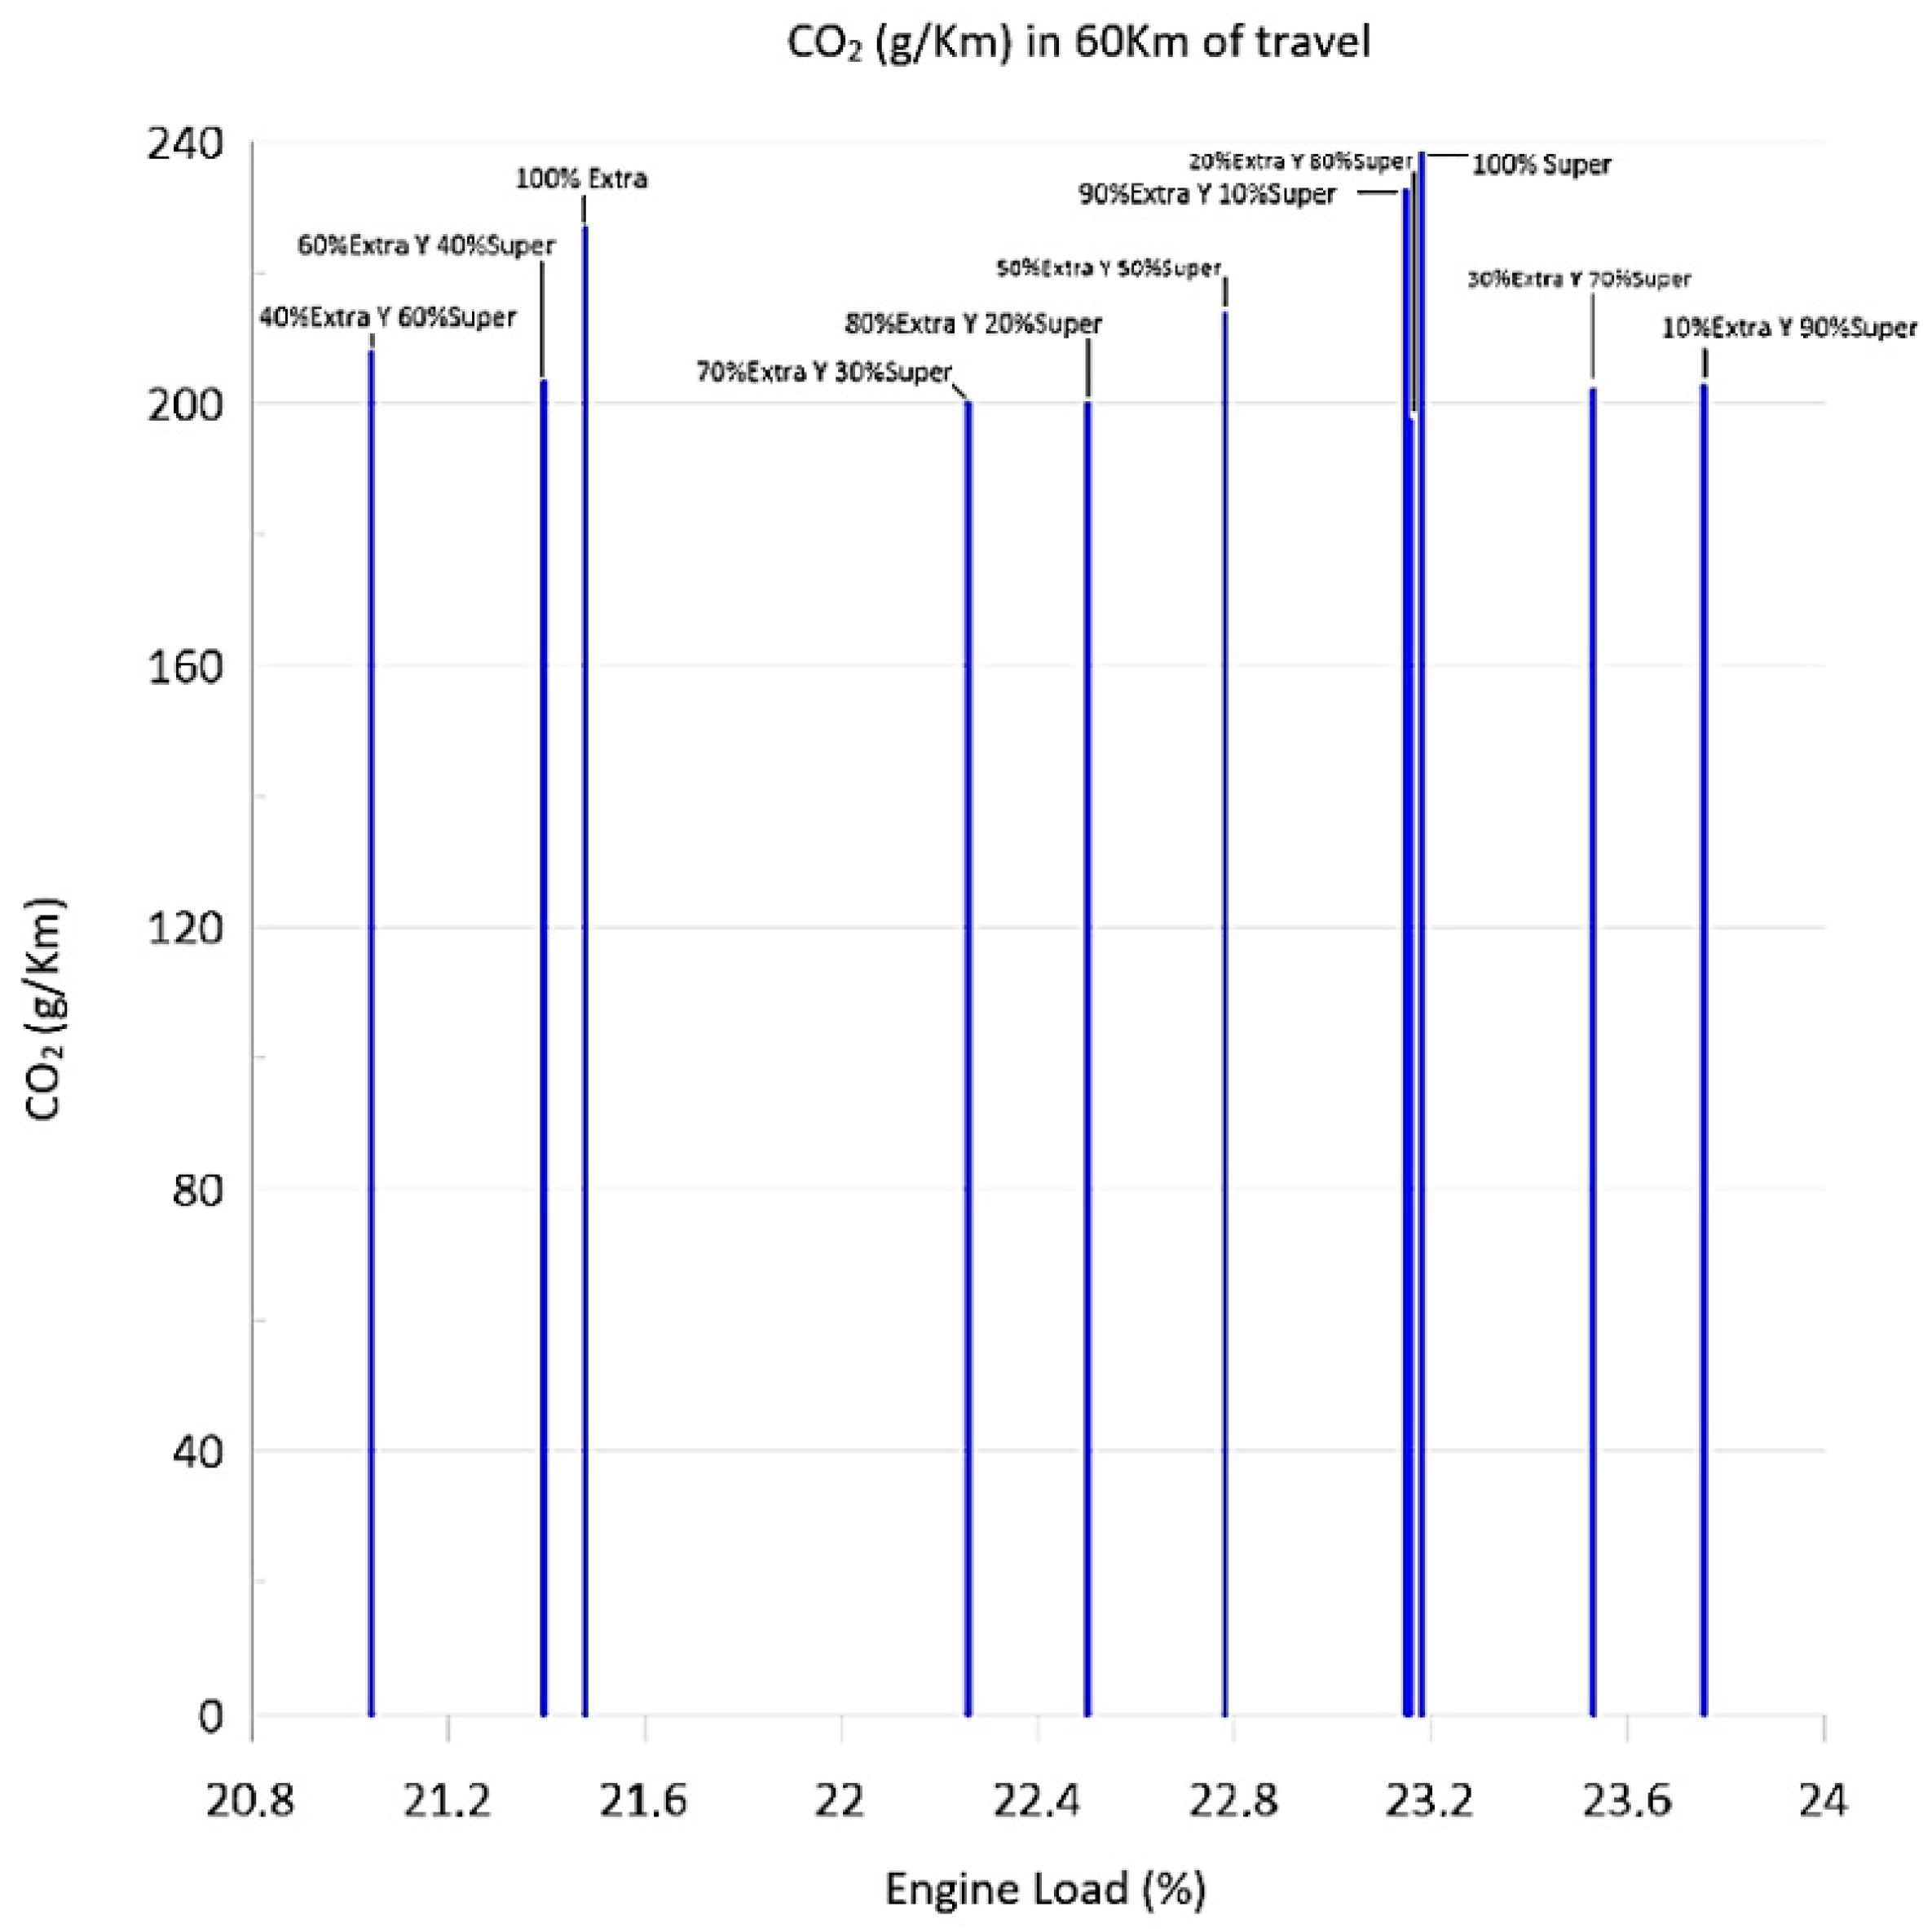
| Mixture | Engine Load (%) | CO2 (g/km) | Consumption (L/100 km) | Consumption in Route (L/60 km) |
|---|---|---|---|---|
| 100% Extra | 21.478 | 226.854 | 0.113 | 5.421 |
| 100% Super | 23.181 | 238.371 | 0.096 | 4.932 |
| 90% Extra and 10% Super | 23.148 | 232.598 | 0.075 | 4.254 |
| 80% Extra and 20% Super | 22.501 | 199.946 | 0.068 | 4.456 |
| 70% Extra and 30% Super | 22.258 | 200.149 | 0.062 | 4.654 |
| 60% Extra and 40% Super | 21.395 | 203.462 | 0.057 | 5.154 |
| 50% Extra and 50% Super | 22.780 | 213.660 | 0.085 | 5.323 |
| 40% Extra and 60% Super | 21.043 | 208.001 | 0.053 | 4.851 |
| 30% Extra and 70% Super | 23.530 | 202.225 | 0.049 | 4.126 |
| 20% Extra and 80% Super | 23.157 | 197.581 | 0.053 | 3.91 |
| 10% Extra and 90% Super | 23.755 | 202.769 | 0.043 | 4.554 |
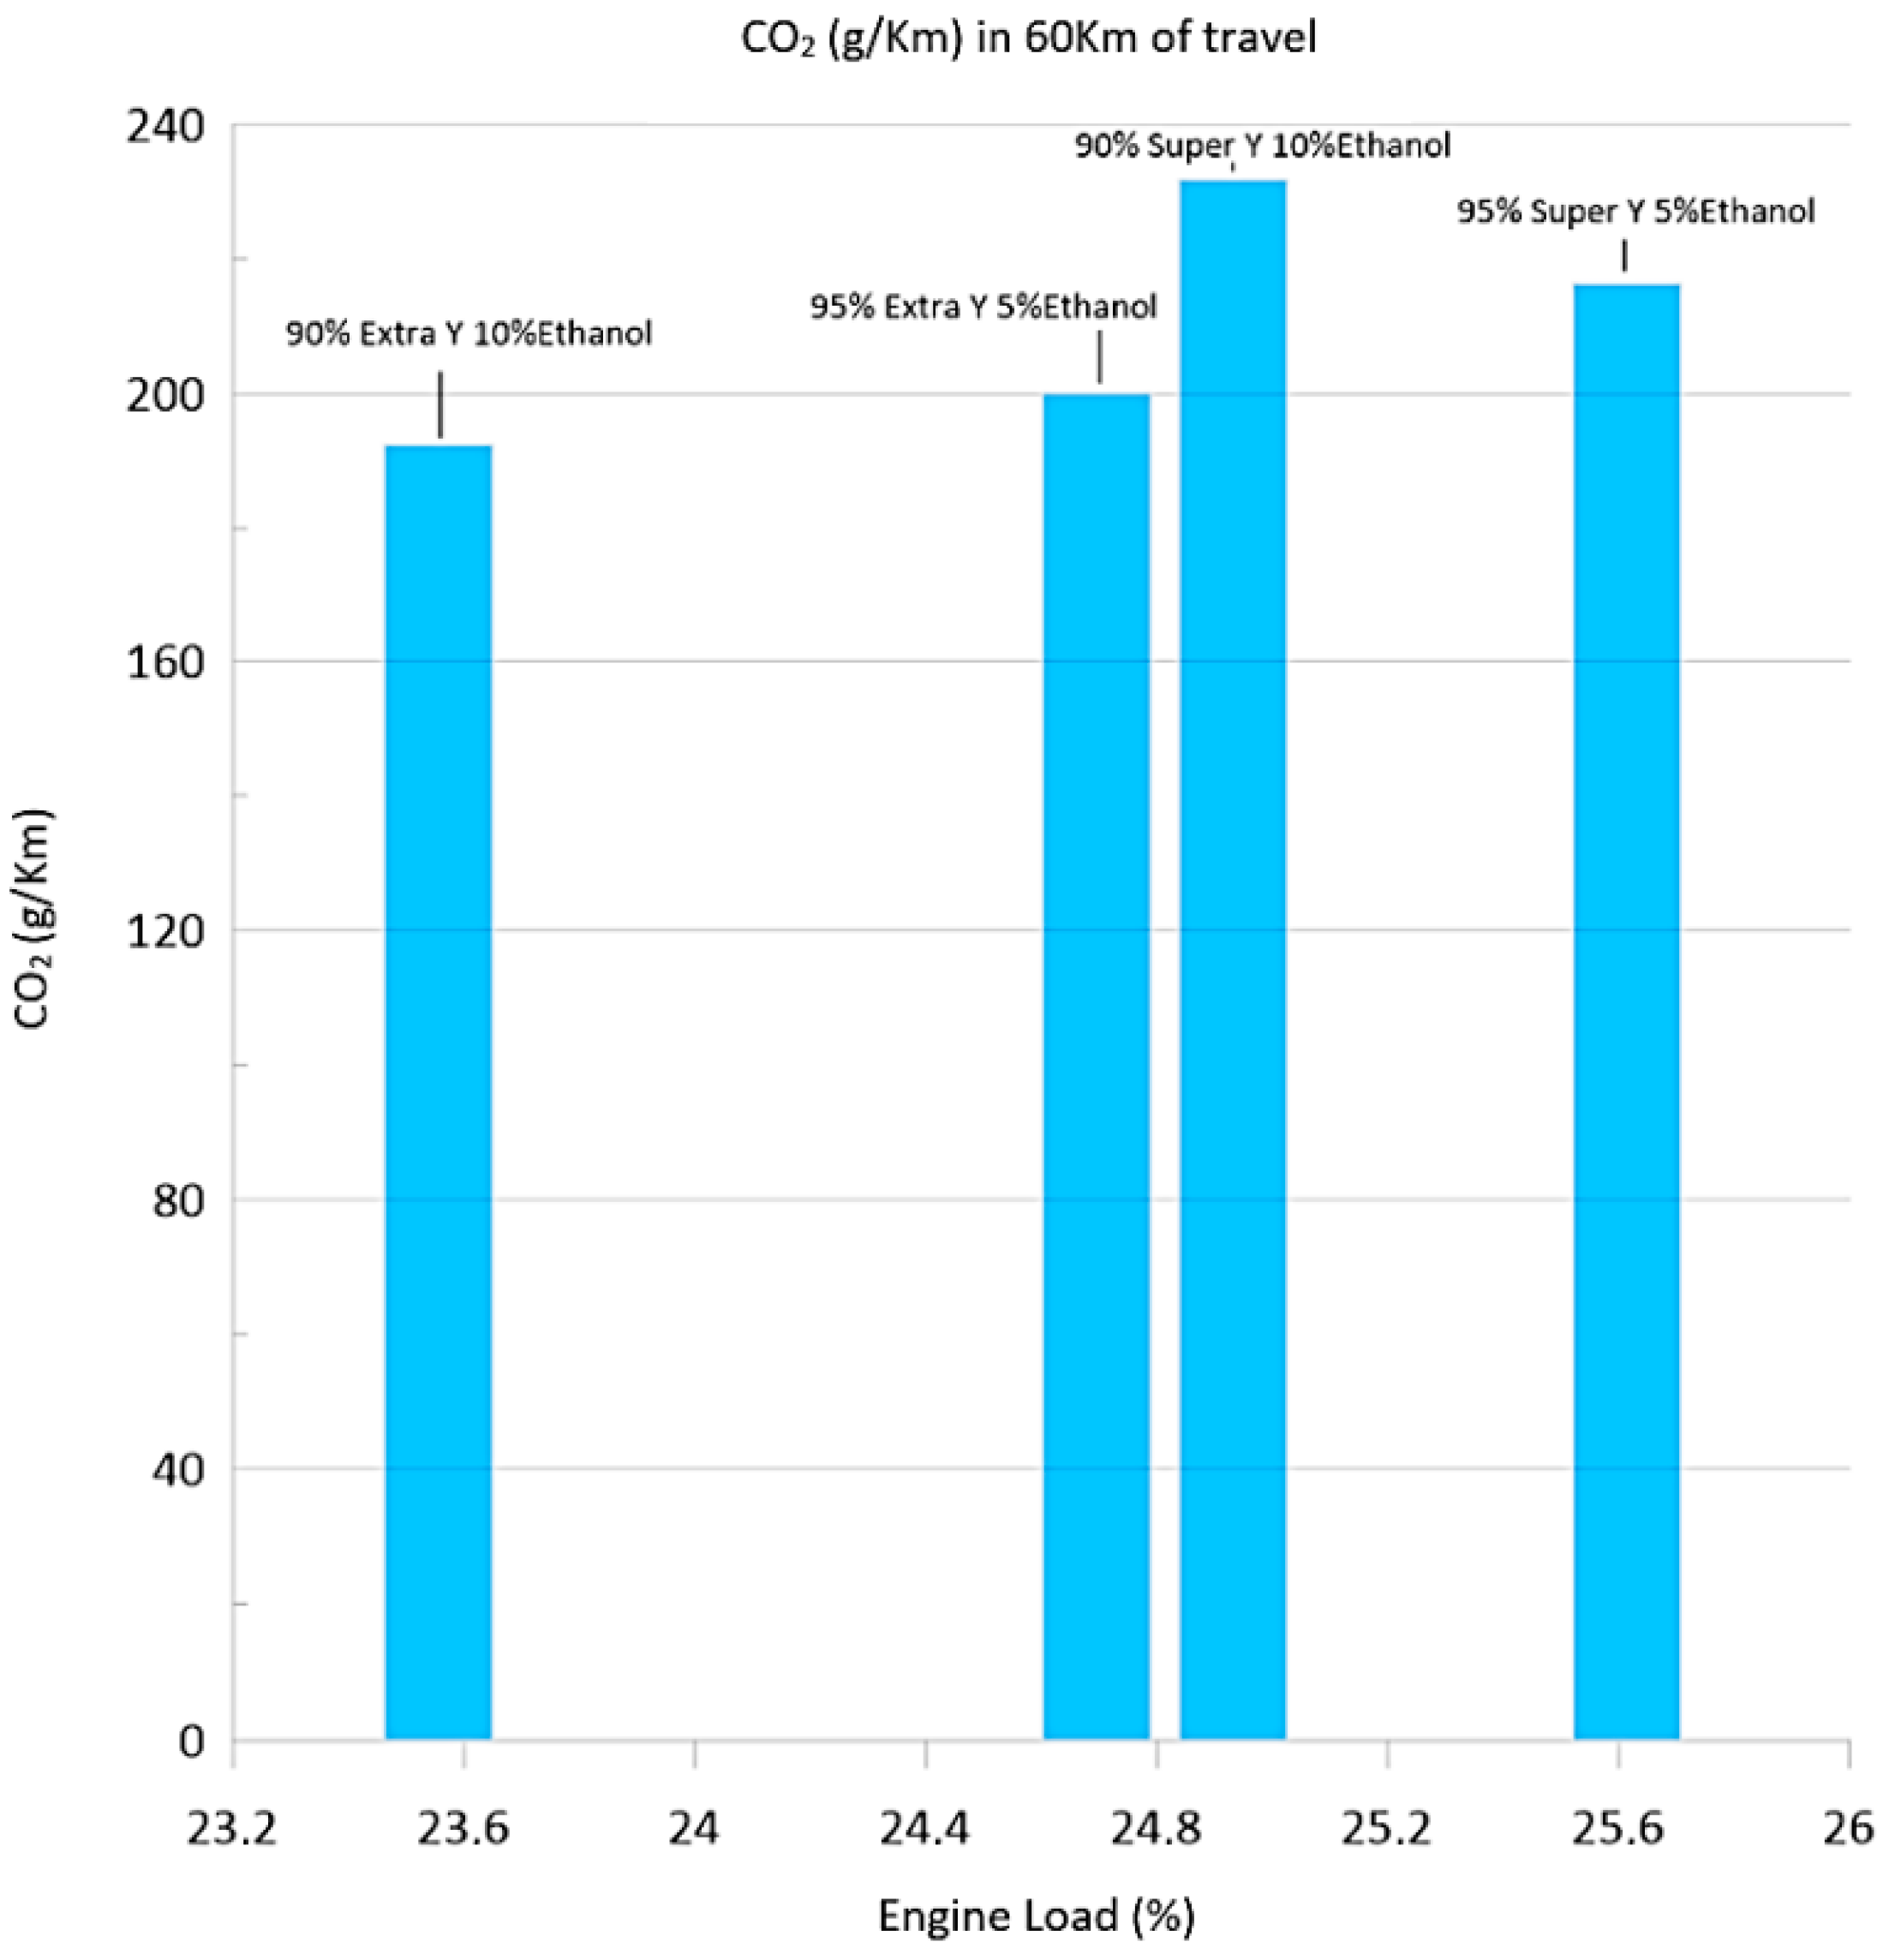
| Mixture | Engine Load (%) | CO2 (g/km) | Consumption (L/100 km) | Consumption in Route (L/60 km) |
|---|---|---|---|---|
| 95% Extra and 5% Ethanol | 24.696 | 200.178 | 0.041 | 5.1 |
| 90% Extra and 10% Ethanol | 23.555 | 192.521 | 0.039 | 4.40 |
| 95% Super and 5% Ethanol | 25.614 | 216.459 | 0.037 | 4.50 |
| 90% Super and 10% Ethanol | 24.932 | 231.912 | 0.035 | 4.60 |
Disclaimer/Publisher’s Note: The statements, opinions and data contained in all publications are solely those of the individual author(s) and contributor(s) and not of MDPI and/or the editor(s). MDPI and/or the editor(s) disclaim responsibility for any injury to people or property resulting from any ideas, methods, instructions or products referred to in the content. |
© 2023 by the authors. Licensee MDPI, Basel, Switzerland. This article is an open access article distributed under the terms and conditions of the Creative Commons Attribution (CC BY) license (https://creativecommons.org/licenses/by/4.0/).
Share and Cite
Rojas-Reinoso, V.; Alvarez-Loor, J.; Zambrano-Becerra, H.; Soriano, J.A. Comparative Study of Gasoline Fuel Mixture to Reduce Emissions in the Metropolitan District. Sustainability 2023, 15, 2921. https://doi.org/10.3390/su15042921
Rojas-Reinoso V, Alvarez-Loor J, Zambrano-Becerra H, Soriano JA. Comparative Study of Gasoline Fuel Mixture to Reduce Emissions in the Metropolitan District. Sustainability. 2023; 15(4):2921. https://doi.org/10.3390/su15042921
Chicago/Turabian StyleRojas-Reinoso, Vicente, Janko Alvarez-Loor, Henrry Zambrano-Becerra, and José Antonio Soriano. 2023. "Comparative Study of Gasoline Fuel Mixture to Reduce Emissions in the Metropolitan District" Sustainability 15, no. 4: 2921. https://doi.org/10.3390/su15042921
APA StyleRojas-Reinoso, V., Alvarez-Loor, J., Zambrano-Becerra, H., & Soriano, J. A. (2023). Comparative Study of Gasoline Fuel Mixture to Reduce Emissions in the Metropolitan District. Sustainability, 15(4), 2921. https://doi.org/10.3390/su15042921