Abstract
The industry of e-commerce (EC) has become more popular and creates tremendous business opportunities for many firms. Modern societies are gradually shifting towards convenient online shopping as a result of the emergence of EC. The rapid growth in the volume of the data puts users in a big challenge when purchasing products that best meet their preferences. The reason for this is that people will be overwhelmed with many similar products with different brands, prices, and ratings. Consequently, they will be unable to make the best decision about what to purchase. Various studies on recommendation systems have been reported in the literature, concentrating on the issues of cold-start and data sparsity, which are among the most common challenges in recommendation systems. This study attempts to examine a new clustering technique named the Ordered Clustering-based Algorithm (OCA), with the aim of reducing the impact of the cold-start and the data sparsity problems in EC recommendation systems. A comprehensive review of data clustering techniques has been conducted, to discuss and examine these data clustering techniques. The OCA attempts to exploit the collaborative filtering strategy for e-commerce recommendation systems to cluster users based on their similarities in preferences. Several experiments have been conducted over a real-world e-commerce data set to evaluate the efficiency and the effectiveness of the proposed solution. The results of the experiments confirmed that OCA outperforms the previous approaches, achieving higher percentages of Precision (P), Recall (R), and F-measure (F).
1. Introduction
Nowadays, in many modern societies, the industry of e-commerce (EC) is rapidly growing and creates tremendous business opportunities for many firms and people. This huge development in EC took place due to the fact that people in these modern societies are gradually tending to prefer online shopping which results in saving their time, effort, and money [1,2,3,4,5,6,7]. However, due to the information overload on the internet generally and EC in particular, where hundreds to thousands of products and items are added and/or sold every day, users face a big challenge to find and purchase the products that best meet their preferences [1,3,5,6,7,8]. Furthermore, it is also difficult for users to find and purchase relevant items that are compatible with each other. For instance, when a user buys a new shirt, he might also need to buy new trousers that best suit the shirt. This is because people will be overwhelmed with a variety of similar products with different brands, prices, and ratings. They will be unable to choose the products that are best suited to their choices.
The World Wide Web has reformed the conventional model of commerce and business in which people purchase goods from the market in person [9]. Online services such as e-commerce have turned out to be the most preferred platform for shopping as the Internet provides the necessary resources to access online stores from anywhere and at any time [9,10]. Recommendation systems are designed to recommend items automatically and address the well-known issue of information overload [9,11,12,13,14,15]. It is one of the most beneficial strategies applied over many EC platforms to attract prospective customers, convert visitors to buyers, and increase their revenue [4,11,12,13,16,17,18,19]. Much attention has been paid to the design and development of personalized e-commerce recommendation systems that monitor and learn from the users’ behavior to introduce items that best fit their preferences [9,10,14].
A key challenge in e-commerce systems is how to recommend relevant items from hundreds of thousands of products stored in the database by exploiting the past user transactions and the actual nature of the products. In many real cases, the user might not be able to identify the items that he/she is interested in, due to the large variety of products offered in these online stores. Hence, the user might end up with unsatisfactory results. To resolve this issue and to provide a better experience to the user during the purchasing activity, a smart recommendation system is needed, one that helps users to make the most appropriate decision and buy products that best fit their preferences [1,2,3,5,6,7,8,16,20,21].
An analysis of the literature reveals that most of the traditional recommendation systems rely on using either data popularity or data recency or both as properties to recommend products for customers [9,11,13]. Nevertheless, in most real-world cases, this recommendation based on data popularity or data recency might not fit with the users’ preferences [10,12,13,22,23]. On the other hand, some of the existing personalized e-commerce recommendation systems do not attempt to filter the number of items to recommend based on the product rate behavior of a user. Thus, product recommendation is another issue that requires a new solution to effectively select and recommend items to customers while they are shopping online [9,10,11,12,13].
Traditionally, three strategies have been applied in most e-commerce recommendation systems. These include collaboration-based filtering, content-based filtering, and hybrid methods [22,23,24,25]. The collaboration-based filtering method involves clustering similar users in a group based on their shopping patterns [17,18,19,24,25]. The collaboration-based recommendation system creates customized recommendations for users based on their previous online shopping behavior. The collaboration-based filtering methods have difficulty generating reliable recommendations when data are sparse, and they cannot recommend items with no ratings from users. They have problems with scalability, data sparsity, and cold-start recommendations [9,10,22,23]. It is due to the fact that the CF algorithms use clustering algorithms to detect the similarities between users, and then group the users into different clusters according to these similarities. This approach assumes that users with similar past behavior will likely have similar tastes in the future. However, most real-world recommendation systems are based on large datasets. This may lead to extremely large and sparse user-item matrices for collaborative filtering, which may affect the performance of the recommendation system. Furthermore, the cold start problem is also a significant challenge for CF, since new items or users are difficult to recommend. In contrast, the content-based recommendation system groups items based on the similarity of content and recommends products from the selected clusters based on the similarity of content between the items and the user profile. Before presenting the newly-added products to customers, it analyzes the content of a given user’s shopping behavior. As new items are inserted, the recommender system calculates their similarity to the user’s content-based profile and rates them accordingly [9,26,27]. Items with the highest ratings are recommended to users. The content-based filtering methods cannot provide accurate recommendations to a new user who has made few transactions [14]. Hybrid recommendation methods combine two or more techniques to improve performance and lessen their drawbacks [22,28,29,30]. Most often, collaboration-based filtering strategies are combined with other techniques aiming at avoiding their weaknesses [9,23].
Clustering has been a rich subject of research in the area of recommendation systems and numerous clustering algorithms have been proposed in the literature [31]. This includes, but is not limited to, K-Means [30,32,33], Fuzzy C-Means [34,35,36], Bi-Clustering [37], Evolutionary Clustering [38,39,40], and Locality Sensitive Hashing [41].
Many of the previous studies on collaborative filtering recommendation systems focused on the issues of cold-start and data sparsity using different techniques of clustering. The cold-start and data sparsity are among the most common challenges raised in recommendation systems [42].
In the EC context, the problem of cold-start raises when a new user attempts to join the system or a new product is added to the online store. In these cases, the recommendation system is unable to provide accurate recommendations due to the lack of the necessary information about the user and the product. The second problem is the data sparsity problem in which users might not provide any information regarding their experience when purchasing some products [42]. This might include no feedback or rating for the product is given by the user. Thus, it is not easy to predict the user’s opinion about the product and fail to provide accurate recommendations for the product to other users in the same cluster [43].
The issue of reducing the impact of the cold-start and the data sparsity problems in EC recommendation systems requires a new strategy in utilizing both the rich user profile and the other users’ activities who have similar preferences to assist the e-commerce recommendation system in achieving accurate and diverse recommendations of products and items. Thus, identifying a strategy to effectively recommend preferred items for the user considering both the user profile and the other users’ transactions and positive ratings is vital. In addition, this paper attempts to answer the following two questions. First, how to improve the quality of the clustering process in e-commerce recommendation using the Ordered Clustering technique? Second, how to evaluate the efficiency and the effectiveness of the proposed technique in the context of e-commerce?
Therefore, this work aims to propose a new clustering algorithm that takes into account both e-commerce nature as well as online shopper behavior to resolve the problem of the cold-start and the data sparsity in EC recommendation systems. Our approach focuses on improving the accuracy of the generated results on these recommendation systems and on retrieving the most relevant products that best suit the users’ preferences. This research work concentrates on exploiting Ordered Clustering (OC) collaborative filtering as a recommendation technique for e-commerce platforms.
The following points summarize the contributions of this paper:
- We discuss the problem of cold-start and data sparsity in data clustering in the domain of e-commerce recommendation systems.
- We conduct a comprehensive review of the leading studies conducted on data clustering. This covers previous approaches designed for e-commerce recommendation systems. The review examines and highlights the strengths and weaknesses of each approach.
- A new ordered clustering-based approach for e-commerce collaborative filtering recommendation system clustering users in e-commerce based on their similarities in preferences is proposed. The proposed approach can handle both types of data (numeric and non-numeric). Thus, our proposed strategy has a wider application for real-world e-commerce applications. In addition, our proposed solution treats the issue of data incompleteness. Thus, any incomplete record that does not have one of the column values will be removed. After that, the initial data set will be transformed into a matrix of ratings (RM) to fit as the input of the clustering algorithm.
- We evaluate the efficiency and the effectiveness of the proposed solution through several experiments using real data sets. The experiments demonstrate the effectiveness and the performance of the proposed solution in terms of Precision (P), Recall (R), and F-measure (F).
The remainder of the paper is organized as follows: The types of filtering approaches are represented in Section 2. The previous clustering techniques applied to recommendation systems have been explained in Section 3. Next, the detailed steps of the proposed approach for e-commerce recommendation systems have been presented and explained in Section 4. Section 5 reports and discusses the experiment results. Finally, the conclusion and some future work recommendations are outlined in Section 6.
2. Types of Filtering Approaches
From the literature, we have concluded that three filtration approaches have been proposed in the area of personalized recommendation systems [19,43]. These approaches are content-based filtering, collaborative filtering, and hybrid filtering. Further details for each approach have been given in the following subsections.
2.1. Content-Based Filtering
Most contemporary recommendation systems incorporate an intelligent recommendation engine that takes into consideration different information about the user. It builds profiles related to each user and each item. The item profile contains all the information and attributes describing it such as the category, main functions, and color. These features are represented using different types of values such as Booleans, integers, and strings. The user profile contains a description of the items that were previously purchased and were rated positively. The content-based recommendation approach compares the information of both the profiles of items and the active user profile using different distances and similarity measures such as nearest neighbors and Euclidean distance. After comparison, the approach suggests items to the target user with the items that best match with the user’s profile [26]. Figure 1 illustrates the basic cycle of the content-based recommendation process. The content-based filtering approach can recommend the users with new items that did not receive any sort of interaction, which is the reason this approach has been widely used in the literature as well as in real-world applications. The traditional content-based approach relies on retrieving items based mostly on their subjective attributes. This limitation results in low recommendation accuracy due to the difficulty of distinguishing between items of similar attributes. Furthermore, it is difficult to recommend items with insufficient information compared with the content of the user’s profile [44].
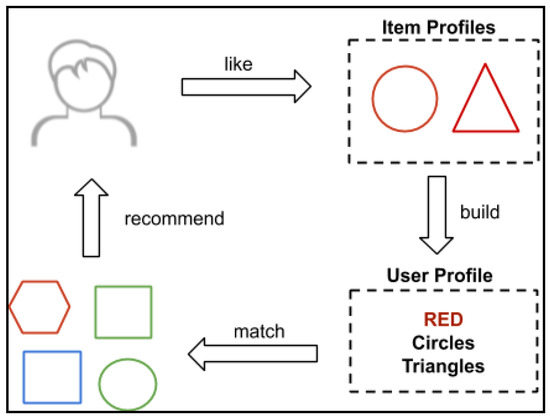
Figure 1.
The cycle of the content-based recommendation process.
2.2. Collaborative Filtering
Collaborative filtering recommends items that have been purchased or positively rated by other users who have shown similar preferences to this user. This approach predicts the preferences of an active user based on the collected information about the behavior of other users with similar interests. Like the content-based approach, a user profile is constructed that contains the collected preferences of the user. The collection of information about user interests can either be explicit or implicit. CF uses clustering algorithms to detect the similarities between users, then groups the users into different clusters according to these similarities. This approach assumes that users with similar past behavior will likely have similar tastes in the future [45]. Collaborative filtering can be categorized into memory-based and model-based. Memory-based CF involves the use of similarity measures to calculate the similarities and distances between users and/or items for clustering. While the model-based method of CF uses machine learning and data mining techniques such as clustering, latent dimensionality reduction, and singular value decomposition techniques to generate models for users and items [18,22,24,25,34]. Figure 2 depicts the detailed components of the collaborative filtering technique.
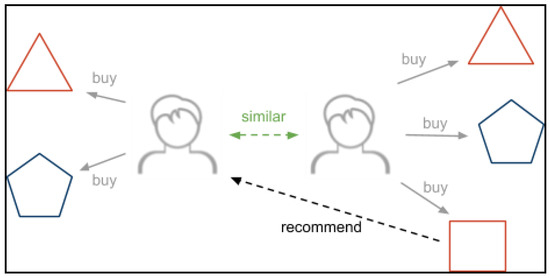
Figure 2.
Collaborative filtering.
2.3. Hybrid Filtering
The hybrid filtering exploits both filtering techniques, namely: content-based and collaborating filtering approaches. It attempts to take the advantage of their basic techniques, namely the profiling of items and users in a content-based approach, and the clustering of users with similar preferences in the collaborative approach. In this case, problems such as the difficulty in extracting information profiles of items in content-based filtering and the sparsity of data in collaborative filtering are reduced. The models of hybrid filtering presented in the literature differ in the way its sub-methods work together. There are four ways of combining CBF and CF in a hybrid recommendation model [46,47]. CBF and CF can work and give separate recommendation results and then their results are combined, or the system chooses better results among them. The system can also use the characteristics of one method in the other method; either by adding the features of CB to the CF approach such as maintaining content-based profiles to describe the user preferences, or by using the characteristics of CF in the CB method by grouping the profiles of users to reduce their dimensionality.
3. Clustering Techniques Applied on Recommendation Systems
Clustering is an unsupervised learning approach that receives a data set as input while the expected results are unknown. The goal is to learn about the structure of data and the relations between its components. In other words, clustering is meant to discover the patterns and groups in the data without specifying any expected information or values. The output of the clustering process would be several clusters that describe the structure of the data, such as the clusters of users with similar purchase behavior and clusters of users with similar reading interests. Recommendation systems, specifically collaborative filtering systems, use these clusters to provide users with accurate and fast recommendations from a variety of items [31,48].
There are many clustering algorithms suggested in the literature that fall into different categories depending on several factors such as the problem to be solved, the structure of the data set, the method used, and the expected form of output. Some of the well-known categories of clustering algorithms are centroid-based, hierarchical, and density-based clustering. Firstly, centroid-based clustering methods build clusters from the data objects by calculating the distance between them based on other objects, called centroids, that do not necessarily belong to the data set. K-Means, K-Medoids, and Fuzzy C-Means are common centroid-based algorithms [49].
Hierarchical clustering consists of the gradual building of clusters whether it is down-top (agglomerative) or top-down (divisive). Agglomerative clustering algorithm creates as many clusters as the number of data elements where each cluster takes one element at first, then continues to calculate the distances between the created clusters and merges the closest clusters in the distance until all the clusters remain unchanged or a specified condition is satisfied. The divisive approach works the opposite way, starting from a single cluster that contains all the data elements. This cluster keeps splitting based on the distance between elements until no cluster changes or a certain stop condition is satisfied [49]. Finally, density-based clustering is less used in recommendation systems than in the previous categories of clustering algorithms. DBSCAN (Density-Based Spatial Clustering of Applications with Noise) is the most common algorithm in this category [50]. In summary, many clustering approaches can be used in recommendation systems and each approach has its specifications and solves a certain problem. The remainder of this section describes briefly some of the common clustering algorithms used in the reviewed studies of e-commerce recommendation systems.
3.1. K-Means
The K-Means technique takes the initial number of cluster centroids and the data set as an input. The first phase is the estimation of the number k of centroids. It can either be randomly generated or selected from the data set. Secondly, assign each of the items to the nearest centroid. This is performed by calculating the distance between each item and the centroids using a distance measure such as the Euclidean distance. The third and final phase is calculating the mean of all items assigned to each centroid and updating its previous value. The last two steps are repeated until a termination condition is satisfied [32,51]. The termination condition could be, for example, the content of a cluster remains unchanged, the loop reached a minimum sum of distances or reached a max number of iterations specified initially. The problem with k-means is the ability to produce noise. Sometimes it assigns a certain item to a cluster even if they are far away from each other. Additionally, there is no efficient way to identify the initial k number of clusters to create [49]. Also, the work in [32] proposed the LeaderRank approach inspired by the leader-follower relation in social networks groups to solve the sensitivity of k-means of the initial selection of centroids and improve the clustering quality. Yang, 2018 [30] suggested an improvement for k-means-based clustering to solve the low accuracy and scalability issues of recommendation. Their main idea was to normalize the input data first, select five initial centroids with the same extension then feed this data into the algorithm and finally execute it until the centers become unchangeable.
3.2. Fuzzy C-Means
Fuzzy C-means is an overlapping partitional clustering technique. It is similar to the k-means in the way that the initial number of clusters is determined at the beginning. However, it is considered non-exclusive because the items can belong to more than one cluster, unlike k-means where every item appears only once. In FCM, a weight value that determines the degree of membership to the cluster is assigned to each item and ranges between zero and one, so that the sum of degrees of an item’s membership is equal to one [34,35,52]. The work in [35] proposed a model for the retailer classification approach based on multi-criteria decision making and fuzzy clustering. It consisted of two phases: determination of the status of retailers in specific shopping malls using MCDM and the clustering of stores through product prices using FCM. Fuzzy C-means are better than k-means in the detection and rectification of noises and misclassifications, but it takes more computation time when dealing with large data sets. This technique is often used in e-commerce recommendation systems.
3.3. Bi-Clustering
Bi-clustering is a recent technique that consists of simultaneous clustering of both rows and columns of the user-item matrix (matrix of ratings) to create the largest possible clusters of similar users. The work in [37] proposed the use of a bi-clustering algorithm called Bi-Max to solve high dimensional and dynamic data in an online e-commerce recommendation system with the help of social networks. The paper tried to address the cold-start problem using multiple filtering techniques: by creating a friendship matrix with the similarity matrix to get more accurate clusters, by using the location information (latitude and longitude values) of users and calculating the distances between them, and by considering the target user’s own product interest pattern and how it varies over a specific period.
3.4. Evolutionary Clustering
The evolutionary clustering technique processes temporal data to generate clusters across time. It is used in e-commerce recommendation systems to incorporate the changing of users’ preferences with time [40]. The work in [39] proposed a dynamic evolutionary algorithm for a collaborative recommendation system to reduce computation complexity and to improve the accuracy of recommendations.
3.5. Locality Sensitive Hashing
LSH is an advanced algorithm to solve the near-neighbor search problem and clustering. It uses hash functions to hash the items in high dimensional data sets and guarantees a high chance of collision for similar items and a low chance of collision for dissimilar ones. The work in [41] proposed a model with an improved LSH algorithm and a non-negative matrix factorization technique for user-based collaborative filtering to solve high dimensional data and low recommendation accuracy. Table 1 summarizes the analysis of the clustering algorithms proposed for e-commerce recommendation systems by the previous research works considered in this research work. The table illustrates the adopted clustering algorithms, the associated techniques, the addressed issues, and the similarity measures.

Table 1.
Summary of the previous clustering algorithms proposed for e-commerce recommendation systems.
4. The Proposed Approach of Clustering
This section explains the detailed steps of the proposed clustering approach for e-commerce recommendation systems. The main idea of the Ordered Clustering approach is to create clusters of users sorted in descending order based on the similarity rates between the users. The proposed approach, which is called Ordered Clustering (OC), exploits the collaborative filtering technique for e-commerce recommendation systems. The idea of OC has been inspired by the work presented in [10]. The OC approach proposed by Darvishy [10] addresses the scalability issue in news recommendation systems aiming at providing more accurate recommendations for online readers. The results of their experiments demonstrated that OC displayed a high performance compared to the K-means algorithm and can produce an effective cluster’s structure which results in more accurate recommendations. The proposed approach comprises three phases, namely: data preprocessing, similarity measurement, and clustering of users, as illustrated in Figure 3. These phases are further explained in the following subsections.
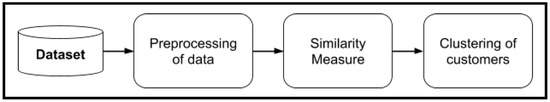
Figure 3.
The phases of the proposed approach.
Based on the fact that news articles can be categorized under multiple categories of topics, the OC was designed to build clusters of users taking into consideration that a user may be interested in more than one category of topics to read articles about, which resulted in users belonging to more than one cluster [9]. In this paper, we evaluate the performance of the OC algorithm on real e-commerce data where, unlike the news data, the clustering process was based on the ratings given by customers and not the reading behavior. The OC approach introduced in this paper has been greatly modified to fit the e-commerce recommendation systems. To ease the explanation of the Ordered Clustering approach, a running example of an e-commerce data set has been used throughout the paper, as demonstrated in Figure 4.
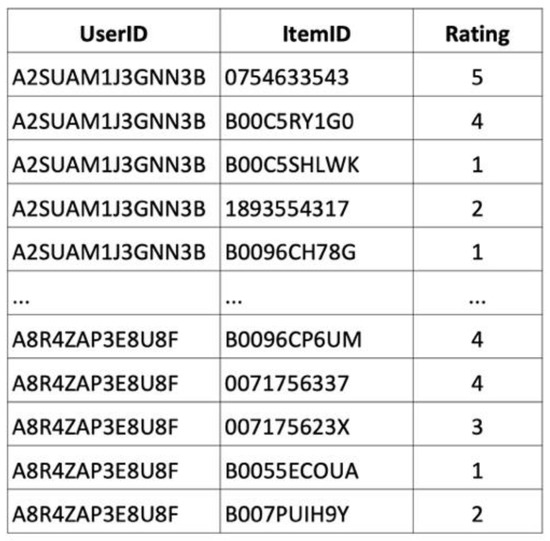
Figure 4.
An example of an e-commerce data set.
4.1. Preprocessing of Data
At this phase, the data set to be used as input for the proposed algorithm will be prepared before running the algorithm. The preparation consists of cleaning the data set from duplicates and irrelevant values, normalizing the values of different columns, and finally, the transformation of the shape of the data set. The original data set consists of the records of purchased items of different categories, along with the ratings given by the customers as illustrated in Figure 4.
The data set contains, in addition, a timestamp indicating the time of the creation of each record. Figure 4 demonstrates the representation of the real-world e-commerce data set in which the first column denotes the UserID (customer). While the second column represents the ItemID that has been rated by the customer. Lastly, the third column indicates the rating value that has been given by the customer. From the example, the rating values range between (1–5) in which one indicates that the user does not recommend the item, while 5 means the item is highly recommended by the customer. From Figure 4, we can notice that the values identifying the customers and the items are represented in a string format (series of letters and numbers) which represents a unique ID of the object in the database. However, string values make the process of clustering very slow and will affect the results. Thus, reformatting them to simple unique integer values before applying the clustering algorithm would result in saving a significant amount of time for processing and obtaining a clear and quality output. The fourth column of the data set which shows the time of the creation of each purchase record is removed from the data set since it will not contribute to the process of clustering. Finally, any incomplete record that does not have one of the column values will be removed. After that, the initial data set is transformed into a 2-D matrix of ratings (RM) to fit as the input of the clustering algorithm. The records of the data set are transformed into a matrix RMij where the rows represent the users and the columns represent the reviewed items, and every entry of the matrix represents the rating score given by the customer i to item j. It has to be noted that certain entries have no rating value because the user has not given any rating to the item. These entries will be set to zero to prevent sudden stops or errors of validation during the clustering process. Figure 5 depicts an example of the output of this phase.
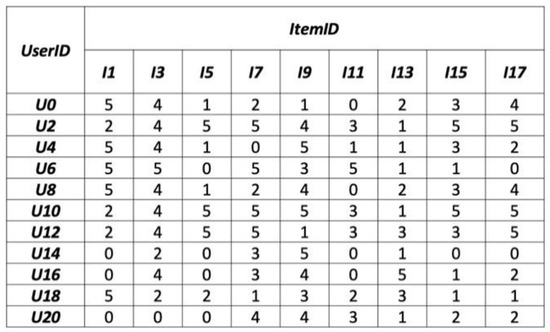
Figure 5.
The matrix of ratings (RM) of the E-commerce example.
4.2. Similarity Measurement
The main purpose of this phase is to perform pairwise calculations on the rows of the matrix of ratings (RM) to estimate the similarity value between each pair of users based on their given ratings. The algorithm iterates through all the existing items for every pair of users and calculates their similarity using the Pearson Correlation Coefficient as given in Equation (1). In the equation, n indicates the total number of rated items by the customers x and y, xi and yi are the ratings of the customers x and y, respectively, on item i, and are the average values of ratings by the customers x and y, respectively. The Pearson Correlation Coefficient (PCC) is better suited to compare the ratings, that have multiple values, between two customers. In contrast, the Jaccard Coefficient considers the number of similar values rather than the values themselves [32]. Therefore, it is better suited for data containing binary entries that represent two options such as “A user Ui bought/did not buy the item Ij” or “A user Ui read/did not read the article Aj”. The value of PCC varies from −1 to +1, where the closest values to +1 show perfect correlation and thus higher similarity in users’ preferences. In contrast, the closest values to −1 indicate dissimilar preferences.
The results are then stored in a matrix of similarities (SM) where both the rows and columns represent the set of users and the entries SMij represent the similarity value between the user i and the user j. Figure 6 illustrates the result of the similarity matrix of our example.
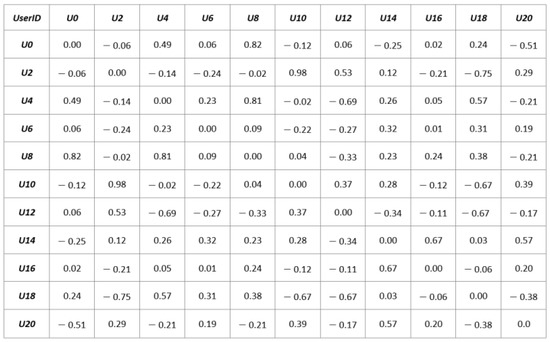
Figure 6.
The similarity matrix (SM) of the e-commerce example.
4.3. Clustering of Users
The clustering of the user’s phase aims at further simplifying the recommendation process in an e-commerce data set by grouping the set of users into smaller clusters based on their similarity values. In this case, the users with similar purchase and rating behavior are grouped into one cluster. It takes the similarity matrix (SM) and a list of users as input. The clustering operation chooses the highest similarity values and creates clusters for their corresponding users. The operation is repeated until all the entries of the similarity matrix are read, which results in clusters of users in descending order and every pair of users have more similar preferences than the next pair from left to right in the cluster. In other words, the proposed algorithm attempts to identify and select a pair of users with the highest similarity ratio in the SM and then groups these users into the same cluster. This process continues with the next highest similarity ratio. Thus, users in the same cluster are sorted in decreasing order based on the similarity ratios between the users. In consequence, the left-hand side neighbors of a user uj of cluster Ci are more similar than the neighbors on the right-hand side of the user uj. The formal formulas of the similarities between users are as follows:
Sim(Ux, Uy) > Sim(Uy, Uz) … and Sim(Uj − 1, Uj) > Sim(Uj, Uj + 1) … and Sim(Ul − 2, Ul − 1) > Sim(Ul − 1, Ul)
For instance, three users Ux, Uy, and Uz that belong to the same cluster are put in this order if the entry of the similarity matrix SM(Ux, Uy) is greater than the entry SM(Uy, Uz). Figure 7 illustrates the output format of a cluster where Sim(Ux, Uy) > Sim(Uy, Uz), Sim(Uj − 1, Uj) > Sim(Uj, Uj + 1) and Sim(Un−2, Un−1) > Sim(Un−1, Un).
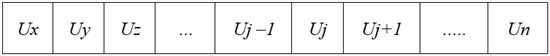
Figure 7.
Format of the customers’ cluster.
Algorithm 1 clarifies the detailed steps of the Ordered Clustering algorithm. The input of the algorithm is the matrix of similarities (SM), while the output is the list of clusters C of users. The algorithm works as follows: in step 1, read the first entry of SMij in the similarity matrix. If the value of Smij is positive (step 2) then set Highest to be the highest similarity ratio in SM (step 3). Next, find the cluster Ck in the set of clusters C where k is equal to the similarity value Smij (step 4). If the cluster Ck does not exist in C, then a new empty cluster Ck will be created (step 6) where k corresponds to the similarity value SMij. After that, the users Ui and Uj will be inserted into Ck (steps 7 and 8). In case of the cluster Ck existing already in C, the algorithm will check if the user Ui exist in the cluster Ck. If not, user Ui will be inserted into Ck (step 11). Then, the algorithm checks for Uj, if it does not exist in Ck, it will be inserted in Ck (step 14). This process continues until each positive entry in the similarity matrix SM is read. Finally, the algorithm sorts the set clusters C based on their k values in descending order (step 19), and then returns the set of clusters C (step 20). Moreover, the time complexity of our proposed approach is O(n ∗ log(n)).
| Algorithm 1: The proposed clustering algorithm |
| Input: Similarity Matrix SM, |
| Output: Set of clusters C, C = {C1, C2, …, Ck} |
| 1. Foreach entry SMij in SM Do |
| 2. If SMij > 0 Then |
| 3. Let Highest = the highest value in SM, SMij |
| 4. Find in C the cluster Ck where k = SMij |
| 5. If Not Found Then |
| 6. Create empty cluster Ck in C with k = SMij |
| 7. Insert User i in Ck |
| 8. Insert User j in Ck |
| 9. Else |
| 10. If User i does not exist in Ck Then |
| 11. Insert User i in Ck |
| 12. End |
| 13. If User j does not exist in Ck Then |
| 14. Insert User j in Ck |
| 15. End |
| 16. End |
| 17. End |
| 18. End |
| 19. Sort C by k in descendent order |
| 20. Return the set of clusters C |
Figure 8 demonstrates the result of the clustering process that has been conducted on our running data set as an example. From the figure, it can be seen that nine clusters have been generated (C1, C2, C3, C4, C5, C6, C7, C8, C9) in descending order based on the similarity score. Where cluster C1 contains the users with the highest rating similarity value and C9 contains the users with the lowest rating similarity value. This will help obtain the most accurate predictions in the phase of recommendation since only the highest values of similarity are considered. The figure also shows that some users belong to more than one cluster, which reflects the non-exclusivity of the clustering approach.
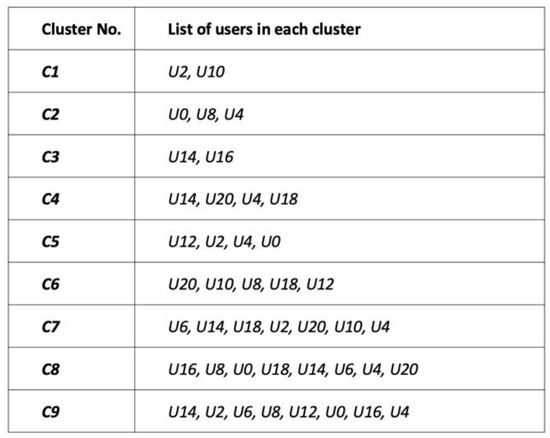
Figure 8.
The result of the clustering process.
As shown in Figure 8, it is clear that nine clusters have formed, namely C1, C2, C3, C4, C5, C6, C7, C8, and C9. It can also be seen that a user is a member of more than one cluster in the results. For example, users U0, U2, U4, U14, U12, U8, U18, U10, U16, U6, and U20. Cluster Matrix (CM) represents the results of clustering users as shown in Figure 9. By referring to the CM matrix and the active user U14, the clusters to which U14 belongs to are identified. Hence, clusters C3 and C4 and C7, C8, C9 are selected. Using these clusters, a selection of users that appeared on the left-hand side of U14 is made as shown in Table 2.
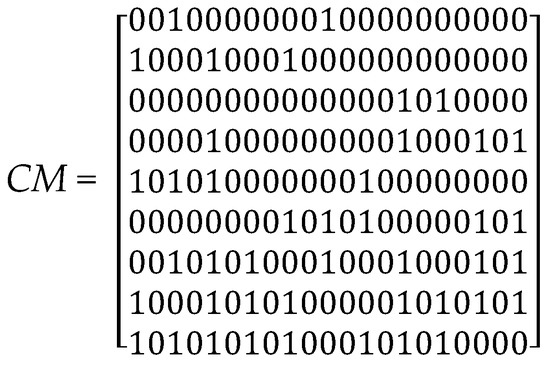
Figure 9.
Cluster Matrix.
Table 2.
The Clusters Consisting of U14.
It appears that users on U14’s left-hand side are more similar than those on U14’s right-hand side. Consequently, user U16 is selected from cluster C3, users U20, U4, U18 are selected from cluster C4, users U6, U2, U10 are identified from cluster C7. Moreover, users U0 and U8 are selected from cluster C8 while user U12 is selected from cluster C9. The following is a list of the items that these users rated according to the RM matrix illustrated in Figure 5.
where 𝐿i is the set of items rated by user Ui. The user U14’s similarity ratios to other selected similar users in all clusters C3, C4, C7, C8, and C9 are identified to weight all of the selected Items. This is demonstrated as follows:
L0 = {I1, I3, I5, I7, I9, I13, I15, I17}
L2 = {I1, I3, I5, I7, I9, I11, I13, I15, I17}
L4 = {I1, I3, I5, I9, I11, I13, I15, I17}
L6 = {I1, I3, I7, I9, I11, I13, I15}
L8 = {I1, I3, I5, I7, I9, I13, I15, I17}
L10 = {I1, I3, I5, I7, I9, I11, I13, I15, I17}
L12 = {I1, I3, I5, I7, I9, I11, I13, I15, I17}
L16 = {I3, I7, I9, I13, I15, I17}
L18 = {I1, I3, I5, I7, I9, I11, I13, I15, I17}
L20 = {I7, I9, I11, I13, I15, I17}
𝐿 = 𝑆𝑖𝑚(U14, U0){I1, I3, I5, I7, I9, I13, I15, I17}
+ 𝑆𝑖𝑚(U14, U2) {I1, I3, I5, I7, I9, I11, I13, I15, I17}
+ 𝑆𝑖𝑚(U14, U4) {I1, I3, I5, I9, I11, I13, I15, I17}
+ 𝑆𝑖𝑚(U14, U6) {I1, I3, I7, I9, I11, I13, I15}
+ 𝑆𝑖𝑚(U14, U8) {I1, I3, I5, I7, I9, I13, I15, I17}
+ 𝑆𝑖𝑚(U14, U10) {I1, I3, I5, I7, I9, I11, I13, I15, I17}
+ 𝑆𝑖𝑚(U14, U12) {I1, I3, I5, I7, I9, I11, I13, I15, I17}
+ 𝑆𝑖𝑚 (U14, U16) {I3, I7, I9, I13, I15, I17}
+ 𝑆𝑖𝑚 (U14, U18) {I1, I3, I5, I7, I9, I11, I13, I15, I17}
+ 𝑆𝑖𝑚 (U14, U20) {I7, I9, I11, I13, I15, I17}
L represents the rated items based on similar user ratings in the collaboration-based filtering method. The 𝑆𝑖𝑚(𝑢𝑖,𝑢𝑗) values are as demonstrated in the Similarity Matrix in Figure 6. Finally, the items are sorted in decreasing order based on the item weight.
5. Experiment Results and Discussion
This section presents and discusses the experimental results of the proposed approach presented in this paper. We elaborate on the experiment settings to evaluate the performance of the proposed approach of clustering for an e-commerce collaborative filtering recommendation system. The section also presents and discusses the experimental results of the proposed approach over the real data set. To validate the robustness of the proposed solution, every experiment has been accomplished five times and the average value has been reported in the result. Lastly, the performance of the proposed approach has been measured in terms of precision (P), recall (R), and F-measure (F).
5.1. Experimental Settings
To evaluate the efficiency and the performance of our proposed Ordered Clustering approach designed for the e-commerce collaborative filtering recommendation system, we compared our approach with the most recent relevant approaches. This includes Hierarchical Clustering Algorithm (HCA) proposed in [53] and the recent version of the K-means clustering approach. The three approaches considered in this work have been implemented using the Python programming language. The set of experiments was accomplished on Intel(R) Core (TM) i7-4600U CPU @ 2.10 GHz with 12 GB memory and Linux Ubuntu 18.04.3 LTS platform. A real data set from Amazon (http://jmcauley.ucsd.edu/data/amazon/, accessed on 15 March 2020) e-commerce has been used to carry out the experiments. Amazon’s e-commerce data set contains real purchase records of users along with the ratings they give to the purchased items. The main reasons behind selecting this data set are as follows. First, the data are recorded from an online shopping website which meets our research work focus on the context of e-commerce, Second, it contains real data that reflects the typical scenario of e-commerce systems. Lastly, the Amazon e-commerce data set perfectly fits with our experiment as it contains the (userId, itemId, rating) combinations which will be used in the phases of clustering of users and prediction of ratings. Table 3 summarizes the characteristics of the Amazon data set. Additionally, to investigate the performance of the proposed clustering approach, further experiments have been conducted on four additional e-commerce data sets extracted from Amazon’s real data set based on the categories of items. From more than 20 data sets, we choose four data sets of purchased and rated items that fall under the categories: groceries, health and personal care, electronics, and office products. For each data set, we fixed the number of records used for experiments. Table 4 depicts the details of the four data sets extracted from the Amazon e-commerce real data set. The table shows the number of records, the number of users, and the number of items for each category.
Table 3.
The characteristics of Amazon e-commerce data set.
Table 4.
The characteristics of the four Amazon e-commerce data sets are based on categories.
5.2. Experiment Evaluation
This section presents and examines the results of the experiments accomplished in this work. We first explain the detailed process of rating prediction, followed by calculating the evaluation metrics and the experimental results.
5.2.1. Rating Prediction
To test and evaluate the effectiveness of our proposed clustering approach, we take the pairs of (user, item) from the test set which is 20% that we split from the original data set, then the rating prediction process is performed on this portion to get the rating scores based on the clusters generated. Since the users are not allowed to give more than one rating on the same item, we consider each pair of (user, item) unique. To calculate the rating value of the pair (u, i), we first look at the user v that belongs to the same cluster as the user u. If we found that the user v has rated item i before, then the rating value is given by the user v to the item i is multiplied by the similarity value of the users u and v. In other words, a weighted average of each rating given by the users of the same cluster is calculated, where the weight value is the similarity score between u and v. Equation (2) shows the prediction function [16]. Where Vi is the set of users who have rated the item I, Sim(u, v) is the similarity value between the users u and v, Rating(v, i) is the rating score given by the user u for the item i.
Algorithm 2 depicts the detailed process of the prediction of ratings based on the results of our proposed approach. The algorithm receives as input the test set without the rating values TS, the training set TR, and the set of clusters C. The output of the algorithm would be the test set filled with the predicted rating scores. The algorithm starts by reading the user u and the item i of the first entry of TS (TSui) (step 1). Then, it would look for the first cluster Ck in C where the value k is positive, and the user u belongs to Ck (step 2). After that, the algorithm initializes the variables X and Y which represent, respectively, the numerator and the denominator of the rating score (steps 3 and 4). The algorithm then iterates through the training set TR and checks for every entry TRwj if the user w belongs to the current cluster Ck, and the item j is the same item as i (step 6). If the condition is satisfied, the variable X is incremented by the rating score of the entry TRwj multiplied by the similarity value k between the users u and w (step 7). Next, the variable Y is incremented by the absolute value of k. After iterating through all the users of the cluster Ck, the value of X is divided by the value of Y to get the final predicted rating score of the user u on item i and write it in the corresponding entry of the test set TS (step 11). Finally, the test set TS with all the predicted ratings is returned (step 13).
| Algorithm 2: The rating prediction algorithm |
| Input: Original Test Set T, Predicted Test Set TS |
| Output: Values of Precision, Recall and F-measure |
| 1. Let TP = 0 |
| 2. Let TN = 0 |
| 3. Let FP = 0 |
| 4. Let FN = 0 |
| 5. Let i = 0 |
| 6. Let j = 0 |
| 7. While i < Length Ti Do |
| 8. While j < Length Tj Do |
| 9. If Tij > 3 and TSij > 3 Then |
| 10. TP = TP + 1 |
| 11. Else If TSij > 3 and Tij <= 3 Then |
| 12. FP = FP + 1 |
| 13. Else If Tij <= 3 and TSij <= 3 Then |
| 14. TN = TN + 1 |
| 15. Else If TSij <= 3 and Tij > 3 Then |
| 16. FN = FN + 1 |
| 17. End |
| 18. End |
| 19. End |
| 20. Let precision = TP/(TP + FP) |
| 21. Let recall = TP/(TP + FN) |
| 22. Let f-measure = (2 ∗ precision ∗ recall)/(precision + recall) |
| 23. Return precision, recall, f-measure |
5.2.2. Calculation of the Evaluation Metrics
This section highlights the calculation of the evaluation metrics to analyze the accuracy and precision of our experiment results. In this research work, we assume that rate values range from 1 to 5. 1 indicate the lowest rating, while 5 indicates the highest rating. In addition, we also consider a positive rating for every rating value greater than 3 (r > 3) and a negative rating for every rating value less than or equal to 3 (r <= 3). Algorithm 3 demonstrates the detailed steps of the evaluation algorithm. The input of the algorithm includes the original test set with real rating values, and the test set with the predicted rating values, while the output includes the scores of the evaluation metrics: Precision (P), Recall (R), and F-measure (F). The algorithm starts by initializing the values of TP (true positives), TN (true negatives), FP (false positives), and FN (false negatives) to 0, then reading the first rating value in both test sets. The algorithm checks if both ratings are greater than three which represents a positive rating, increment the number of TP by one (step 10), if not, check if the rating in the original set is negative (<=3) and the rating in the predicted set is positive, increment the number of FP by one, check if both ratings are negatives, then increment the number TN by one, otherwise (the rating in the predicted set is negative while the rating in the original set is positive) increment the number FN by one. These checks are repeated for every entry in the test set. After that, the algorithm calculates the scores of the evaluation metrics based on the above values: precision (step 20), recall (step 21), and F-measure (step 22). Finally, the results are returned in (step 23).
| Algorithm 3: The evaluation algorithm |
| Input: Test Set with null rating values TS, Training Set TR, Set of clusters C |
| Output: Test Set with predicted rating values TS |
| 1. Foreach entry TSui in TS Do |
| 2. Find cluster Ck where k > 0 And User u exist in Ck |
| 3. Let X = 0 |
| 4. Let Y = 0 |
| 5. Foreach entry TRwj in TR Do |
| 6. If User w exist in Ck and Item i = Item j Then |
| 7. X = X + (TRwj ∗ k) |
| 8. Y = Y + k |
| 9. End |
| 10. End |
| 11. Let TSui = X/Y |
| 12. End |
| 13. Return Test Set with predicted rating values TS |
5.2.3. Experiment Results
This section highlights the experiment results of the rating predictions carried out based on the output of our proposed approach (Ordered Clustering) against the output of the most recent techniques, namely: the Hierarchical Clustering Algorithm (HCA) [53] and K-Means Clustering technique. The first set of experiments is performed on the Amazon e-commerce data set that contains ratings of items of different categories. Since the initial data set file is large, we chose to fix the minimum number of occurrences of users and items. We excluded the users who rated less than 20 items and we ignored the items that appeared less than 40 times in the data set. It was decided to remove the low-rated users from the data set since they do not have a stored ranking that could be used in the evaluation. The lower and higher bands are considered noisy data in the sample selection process of data mining and should be ignored. During the data cleaning process, there may be a user with a very high ranking that should be deleted. Furthermore, if a group of users has a very low ranking, this will result in a significant reduction in the accuracy of the results due to data sparsity. It is important, however, to consider all users when analyzing real-world applications.
Figure 10 demonstrates the experimental results of recommendations based on the output of the proposed Ordered Clustering, Hierarchical Clustering Algorithm (HCA) [53], and K-Means Clustering algorithms. From the figure, it is obvious that our approach outperforms both the Hierarchical Clustering Algorithm (HCA) [53] and the recent K-Means approach in terms of Precision (P), Recall (R), and F-measure (F), with 11.03% improvement in Precision, 33.58% improvement in Recall and 22.86% improvement in F-measure.
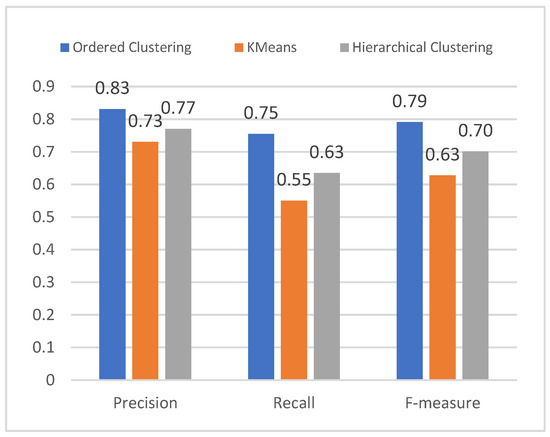
Figure 10.
The result of experiments of OC and K-Means on the Amazon real data set.
Figure 11a–d explains the experiment results of recommendations on the grocery data set, health and personal care data set, electronics data set, and office products data set, respectively. Figure 11a illustrates the results of experiments on the grocery data set. The parameters fixed for this data set are 20 of the minimum number of items rated by each user and at least 40 occurrences of each item. The results show that the OC approach gives the highest values of precision and recall compared to both the Hierarchical Clustering Algorithm (HCA) [53] and K-means method with an improvement of 16.23% in precision, 12.89% improvement in recall, and 14.44% improvement in F-measure. These results of recommendations are based on 68 clusters of users generated by the OC algorithm, 42 clusters generated by the Hierarchical Clustering Algorithm (HCA) [53], and only 14 clusters generated by the K-means technique.
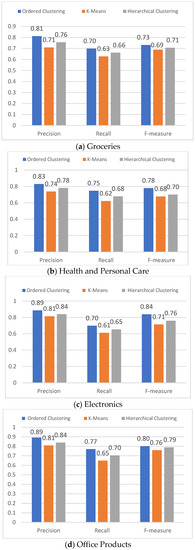
Figure 11.
The result of experiments on the derived four data sets based on category.
Figure 11b shows the results of experiments on the health and personal care data set. The three algorithms received a fixed minimum number of occurrences of users and items, with at least 30 occurrences of each user and 40 occurrences of each item. Based on these parameters, the OC algorithm generates 80 clusters of users while the Hierarchical Clustering Algorithm (HCA) [53], and K-means algorithms created 54 clusters and 16 clusters, respectively. The results show that OC gives better output than both the Hierarchical Clustering Algorithm (HCA) [53] and K-means in terms of the three measures with a difference of 8.2% in precision and 11.2% in the recall.
The results of the tests conducted on the electronics data set are presented in Figure 11c. The minimum number of occurrences items and users are fixed at 150 and 50, respectively. We can see from the figure that the difference in the metrics scores between OC, HCA [53] and K-Means is higher compared to the difference in the results of the other data set. This can be explained by the fact that electronic items in e-commerce platforms receive more ratings than other categories of items. The reason why we obtained more than 50,000 records of 1539 users who rated more than 7000 items is that the number of minimum occurrences of users and items is bigger compared to the rest of the experiments’ fixed parameters. The figure shows the scores of OC are higher than the scores of HCA and K-Means in precision with 10% and 18.81%, respectively. Moreover, the result also depicts that the OC method achieved a higher percentage of recall in comparison with HCA and K-means with up to 10.6% and 20.17%, respectively. Finally, Figure 11d depicts the results of experiments on the e-commerce data set of office products. Based on the output of OC, HCA, and K-Means algorithms are 85 clusters generated by the OC algorithm and only 59 clusters are generated by HCA, and 14 clusters are generated by K-Means. The recommendation process registered a higher percentage of the three measures from OC compared to both HCA and K-Means. We can notice an improvement in precision by 10.24%. The recall of OC improved by 14.55% and the F-measure improved by 11.23% compared to the HCA method.
6. Conclusions and Future Works
This paper highlights the effect of the issues of cold-start and data sparsity on the accuracy of e-commerce recommendation systems. A new clustering approach is called Ordered Clustering (OC), which is designed for the clustering of users in an e-commerce data set based on their similarities in preferences. The approach performs pairwise similarity calculations of the Pearson Correlation Coefficient on the history of users’ purchase and rating behavior. The results of the experiments show that OC can reduce the impact of cold-start and sparsity issues and can provide a more accurate recommendation of items for users since only the clusters with high similarity scores are considered in the prediction phase. The performance of the proposed approach was compared to recent previous clustering approaches, namely: Hierarchical Clustering Algorithm (HCA) and K-means clustering using real e-commerce Amazon data sets concerning precision (P), recall (R), and F-measure (F). This study contributes to the literature of the area of clustering and recommendation systems by providing an empirical study to investigate the feasibility of applying Ordered Clustering (OC) technique over e-commerce recommendation systems. In addition, this study also is very beneficial for the interested researchers to investigate more on the area of clustering in recommendation systems. Furthermore, the implementation and testing of the algorithm in this study could help the developers of recommendation systems apply the proposed technique in online environments.
As future work, we plan to further investigate the efficiency and the effectiveness of the proposed approach over other domains such as stock exchange, multi-criteria decision support systems, and location-based recommendation systems. The focus can be given to examining to what extent the OC can be exploited over these domains. Furthermore, the evaluation of the proposed approach has been conducted in an offline manner with real data. Nevertheless, a better evaluation can be performed in an online recommendation system. Thus, to achieve more precise results, assessment should be carried out in a real online environment. Another way to evaluate a new clustering algorithm such as OC is computing inter-clustering and intra-clustering to compare with well-known clustering algorithms. Last but not least, a fuzzy version of Ordered Clustering can be designed and utilized in other recommendation systems such as music, movies, books, etc. The fuzzy version of OC could be evaluated with various of items recommendation.
Author Contributions
Conceptualization, Y.G., A.A.A., R.M.A., A.Z.A. and M.O.; Methodology, Y.G., A.A.A. and R.M.A.; Software, A.A.A. and M.O.; Validation, Y.G. and A.A.A.; Formal analysis, Y.G., A.A.A., A.Z.A. and M.O.; Investigation, A.A.A.; Resources, M.O.; Data curation, A.A.A. and M.O.; Writing—original draft, A.A.A. and M.O.; Writing—review & editing, Y.G., A.A.A., R.M.A. and A.Z.A.; Visualization, A.A.A., R.M.A., A.Z.A. and M.O.; Supervision, A.A.A.; Project administration, Y.G.; Funding acquisition, Y.G. and A.A.A. All authors have read and agreed to the published version of the manuscript.
Funding
This work was supported by the Deanship of Scientific Research, Vice Presidency for Graduate Studies and Scientific Research, King Faisal University, Saudi Arabia Project No. GRANT473.
Data Availability Statement
Not applicable.
Acknowledgments
The publication of this work was supported by the Deanship of Scientific Research, Vice Presidency for Graduate Studies and Scientific Research, King Faisal University, Saudi Arabia, under Project GRANT473.
Conflicts of Interest
The authors declare no conflict of interest.
References
- Gu, Y.; Ding, Z.; Wang, S.; Yin, D. Hierarchical User Profiling for E-commerce Recommender Systems. In Proceedings of the 13th International Conference on Web Search and Data Mining (WSDM ‘20), Houston, TX, USA, 3–7 February 2020. [Google Scholar]
- Jadidinejad, A.H.; Macdonald, C.; Ounis, I. The Simpson’s Paradox in the Offline Evaluation of Recommendation Systems. ACM Trans. Inf. Syst. 2022, 40, 1–22. [Google Scholar] [CrossRef]
- Liu, G.; Fu, Y.; Chen, G.; Xiong, H.; Chen, C. Modeling Buying Motives for Personalized Product Bundle Recommendation. ACM Trans. Knowl. Discov. Data 2017, 11, 1–26. [Google Scholar] [CrossRef]
- Silva, N.; Carvalho, D.; Pereira, A.C.; Mourão, F.; Rocha, L. The Pure Cold-Start Problem: A deep study about how to conquer first-time users in recommendations domains. Inf. Syst. 2019, 80, 1–12. [Google Scholar] [CrossRef]
- Wu, C.; Yan, M. Session-aware Information Embedding for E-commerce Product Recommendation. In Proceedings of the 2017 ACM on Conference on Information and Knowledge Management CIKM ‘17, Singapore, 6–10 November 2017. [Google Scholar]
- Xu, Z.; Han, Y.; Zhang, Y.; Ai, Q. E-commerce Recommendation with Weighted Expected Utility. In Proceedings of the 29th ACM International Conference on Information & Knowledge Management (CIKM ‘20), Virtual Event, Ireland, 19–23 October 2020. [Google Scholar]
- Zhao, Q. E-commerce Product Recommendation by Personalized Promotion and Total Surplus Maximization. In Proceedings of the Ninth ACM International Conference on Web Search and Data Mining (WSDM ‘16), San Francisco, CA, USA, 22–25 February 2016. [Google Scholar]
- Zhao, W.X.; Wang, J.; He, Y.; Wen, J.-R.; Chang, E.Y.; Li, X. Mining Product Adopter Information from Online Reviews for Improving Product Recommendation. ACM Trans. Knowl. Discov. Data 2016, 10, 1–23. [Google Scholar] [CrossRef]
- Darvishy, A.; Ibrahim, H.; Sidi, F.; Mustapha, A. HYPNER: A Hybrid Approach for Personalised News Recommendation. IEEE Access 2020, 8, 46877–46894. [Google Scholar] [CrossRef]
- Darvishy, A.; Ibrahim, H.; Sidi, F.; Mustapha, A. A Customized Non-Exclusive Clustering Algorithm for News Recommendation Systems. J. Univ. Babylon Pure Appl. Sci. 2019, 27, 368–379. [Google Scholar] [CrossRef]
- Ahlem, D.; Houssem, E.Z.; Hocine, C. EnsVAE: Ensemble variational autoencoders for recommendations. IEEE Access 2020, 8, 188335–188351. [Google Scholar]
- Ahlem, D.; Saadeddine, S.; Hocine, C. An Interactive Attention Network with Stacked Ensemble Machine Learning Models for Recommendations. In Optimization and Machine Learning: Optimization for Machine Learning and Machine Learning for Optimization; Wiley Online Library: Hoboken, NJ, USA, 2022; pp. 119–150. [Google Scholar]
- Ahlem, D.; Houssem, E.Z.; Hocine, C. Context-awareness in ensemble recommender system framework. In Proceedings of the International Conference on Electrical, Communication, and Computer Engineering (ICECCE), Kuala Lumpur, Malaysia, 12–13 June 2021; pp. 1–6. [Google Scholar]
- Lu, Z.; Dou, Z.; Lian, J.; Xie, X.; Yang, Q. Content-based Collaborative Filtering for News Topic Recommendation. In Proceedings of the 29th AAAI Conference on Artificial Intelligence, Austin, TX, USA, 25–30 January 2015. [Google Scholar]
- Karimi, M.; Jannach, D.; Jugovac, M. News Recommender Systems—Survey and Roads Ahead. J. Inf. Process. Manag. 2018, 54, 1203–1227. [Google Scholar] [CrossRef]
- Katarya, R. Movie recommender system with metaheuristic artificial bee. Neural Comput. Appl. 2018, 30, 1983–1990. [Google Scholar] [CrossRef]
- Chakraverty, S.; Saraswat, M. Review based emotion profiles for cross domain recommendation. Multimed. Tools Appl. 2017, 76, 25827–25850. [Google Scholar] [CrossRef]
- Cheng, W.; Shen, Y.; Zhu, Y.; Huang, L. Delf: A dual-embedding based deep latent factor model for recommendation. In Proceedings of the 27th IJCAI International Joint Conference on Artificial Intelligence, Stockholm, Sweden, 13–19 July 2018. [Google Scholar]
- Wang, H.; Lian, D.; Tong, H.; Liu, Q.; Huang, Z.; Chen, E. HyperSoRec: Exploiting Hyperbolic User and Item Representations with Multiple Aspects for Social-aware Recommendation. ACM Trans. Inf. Syst. 2022, 40, 1–28. [Google Scholar] [CrossRef]
- Boratto, L.; Carta, S. The rating prediction task in a group recommender system that automatically detects groups: Architectures, algorithms, and performance evaluation. J. Intell. Inf. Syst. 2015, 45, 221–245. [Google Scholar] [CrossRef]
- Guo, L.; Cai, X.; Hao, F.; Mu, D.; Fang, C.; Yang, L. Exploiting Fine-Grained Co-Authorship for Personalized Citation Recommendation. IEEE Access 2017, 5, 12714–12725. [Google Scholar] [CrossRef]
- Zhu, T.; Liu, G.; Chen, G. Social Collaborative Mutual Learning for Item Recommendation. ACM Trans. Knowl. Discov. Data 2020, 14, 1–19. [Google Scholar] [CrossRef]
- Lu, Y.; Koki, T.; Chakraborty, G.; Matsuhara, M. Performance comparison of clustering algorithm based collaborative filtering recommendation system. In Proceedings of the 7th Multidisciplinary in International Social Networks Conference and the 3rd International Conference on Economics, Management and Technology (MISNC2020&IEMT2020), Kaohsiung, Taiwan, 31 October–2 November 2020; ACM Publisher: New York, NY, USA, 2020; pp. 1–6. [Google Scholar]
- Wang, J.; Song, M.; Bi, Q.; Liu, Y. Incremental weighted bipartite algorithm for large-scale recommendation systems. Turk. J. Electr. Eng. Comput. Sci. 2016, 24, 448–463. [Google Scholar]
- Moradi, P.; Ahmadian, S.; Akhlaghian, F. An effective trust-based recommendation method using a novel graph clustering algorithm. Phys. A Stat. Mech. Its Appl. 2015, 436, 462–481. [Google Scholar] [CrossRef]
- Deldjoo, Y.; Elahi, M.; Cremonesi, P.; Garzotto, F.; Piazzolla, P.; Quadrana, M. Content-Based Video Recommendation System Based on Stylistic Visual Features. J. Data Semant. 2016, 5, 99–113. [Google Scholar] [CrossRef]
- Shu, J.; Shen, X.; Liu, H.; Yi, B.; Zhang, Z. A content-based recommendation algorithm for learning resources. Multimed. Syst. 2018, 24, 163–173. [Google Scholar] [CrossRef]
- Chandak, M.; Girase, S.; Mukhopadhyay, D. Introducing Hybrid Technique for Optimization of Book Recommender System. Procedia Comput. Sci. 2015, 45, 23–31. [Google Scholar] [CrossRef]
- Kaššák, O.; Kompan, M.; Bieliková, M. Personalized hybrid recommendation for group of users: Top-N multimedia recommender. Inf. Process. Manag. 2016, 52, 459–477. [Google Scholar] [CrossRef]
- Yang, F. A hybrid recommendation algorithm–based intelligent business recommendation system. J. Discret. Math. Sci. Cryptogr. 2018, 1317, 21–1322. [Google Scholar] [CrossRef]
- Zhu, X.; Li, Y.; Wang, J.; Zheng, T.; Fu, J. Automatic Recommendation of a Distance Measure for Clustering Algorithms. ACM Trans. Knowl. Discov. Data 2020, 15, 1–22. [Google Scholar] [CrossRef]
- Kant, S.; Mahara, T.; Kumar Jain, V.; Kumar Jain, D.; Sangaiah, A.K. LeaderRank based k-means clustering initialization method for collaborative filtering. Comput. Electr. Eng. 2018, 69, 598–609. [Google Scholar] [CrossRef]
- Lenka, R.K.; Barik, R.K.; Panigrahi, S.; Panda, S.S. An Improved Hybrid Distributed Collaborative Filtering Model for Recommender Engine using Apache Spark. Int. J. Intell. Syst. Appl. 2018, 10, 74–81. [Google Scholar] [CrossRef]
- Koohi, H.; Kiani, K. User based Collaborative Filtering using fuzzy C-means. Measurement 2016, 91, 134–139. [Google Scholar] [CrossRef]
- Oner, S.C.; Oztaysi, B. An interval type 2 hesitant fuzzy MCDM approach and a fuzzy c means clustering for retailer clustering. Soft Comput. 2018, 4971, 22–4987. [Google Scholar] [CrossRef]
- Raju, V.; Srinivasan, N. Prediction of User Future Request Utilizing the Combination of Both ANN and FCM in Web Page Recommendation. J. Intell. Syst. 2018, 29, 583–595. [Google Scholar] [CrossRef]
- Akshaya, B.; Akshaya, S.K.; Gayathri, S.; Sarava, P. Investigation of Bi-max algorithm for on -line purchase recommender system using social networks. Indian, J. Sci. Technol. 2016, 9, 44. [Google Scholar] [CrossRef]
- Chakrabarti, D.; Kumar, R.; Tomkins, A. Evolutionary clustering. In Proceedings of the 12th ACM SIGKDD International Conference on Knowledge Discovery and Data Mining (KDD 2006), Philadelphia, PA, USA, 20–23 August 2006; pp. 554–661. [Google Scholar]
- Chen, J.; Wei, L.; Uliji; Zhang, L. Dynamic evolutionary clustering approach based on time weight and latent attributes for collaborative filtering recommendation. Chaos Solitons Fractals 2018, 114, 8–18. [Google Scholar] [CrossRef]
- Rana, C.; Jain, S.K. An extended evolutionary clustering algorithm for an adaptive recommender system. Soc. Netw. Anal. Min. 2014, 4, 1–13. [Google Scholar] [CrossRef]
- Wu, Y.; Li, Y.; Qian, R. NE-UserCF: Collaborative filtering recommender system model based on NMF and E2LSH. Int. J. Perform. Eng. 2017, 13, 610–619. [Google Scholar] [CrossRef]
- Mirbakhsh, N.; Ling, X.C. Improving Top-N Recommendation for Cold-Start Users via Cross-Domain Information. ACM Trans. Knowl. Discov. Data 2015, 9, 1–19. [Google Scholar] [CrossRef]
- Adomavicius, G.; Tuzhilin, A. Toward the next generation of recommender systems: A survey of the state-of-the-art and possible extensions. IEEE Trans. Knowl. Data Eng. 2005, 17, 734–749. [Google Scholar] [CrossRef]
- Blanco-Fernández, Y.; Pazos-Arias, J.J.; Gil-Solla, A.; Ramos-Cabrer, M.; López-Nores, M. Providing entertainment by content-based filtering and semantic reasoning in intelligent recommender systems. IEEE Trans. Consum. Electron. 2008, 54, 727–735. [Google Scholar] [CrossRef]
- Zhang, F.; Gong, T.; Lee, V.E.; Zhao, G.; Rong, C.; Qu, G. Fast algorithms to evaluate collaborative filtering recommender systems. Knowl. Based Syst. 2016, 96, 96–103. [Google Scholar] [CrossRef]
- Guo, Y.; Wang, M.; Li, X. An Interactive Personalized Recommendation System Using the Hybrid Algorithm Model. Symmetry 2017, 9, 216. [Google Scholar] [CrossRef]
- Kuzelewska, U. Clustering Algorithms in Hybrid Recommender System on MovieLens Data. Stud. Log. Gramm. Rhetor. 2014, 37, 125–139. [Google Scholar] [CrossRef]
- Guo, F.; Lu, Q. A novel e-commerce customer continuous purchase recommendation model research based on colony clustering. Int. J. Wirel. Mob. Comput. 2016, 11, 309. [Google Scholar] [CrossRef]
- Zahra, S.; Ghazanfar, M.A.; Khalid, A.; Azam, M.A.; Naeem, U.; Prugel-Bennett, A. Novel centroid selection approaches for KMeans-clustering based recommender systems. Inf. Sci. 2015, 320, 156–189. [Google Scholar] [CrossRef]
- Wang, X.; Zhang, H.; Wang, L.; Ning, Z. A Demand-Supply Oriented Taxi Recommendation System for Vehicular Social Networks. IEEE Access 2018, 6, 41529–41538. [Google Scholar] [CrossRef]
- Maju, M.; David, G.L. Scalable nearest neighbor algorithms for high dimensional data. IEEE Trans. Pattern Anal. Mach. Intell. 2014, 36, 2227–2240. [Google Scholar]
- Zhang, L.; Lu, W.; Liu, X.; Pedrycz, W.; Zhong, C. Fuzzy C-Means clustering of incomplete data based on probabilistic information granules of missing values. Knowl. Based Syst. 2016, 99, 51–70. [Google Scholar] [CrossRef]
- Zheng, H.; Wu, J. Which, when, and how: Hierarchical clustering with human–machine cooperation. Algorithms 2016, 9, 88. [Google Scholar] [CrossRef]


Disclaimer/Publisher’s Note: The statements, opinions and data contained in all publications are solely those of the individual author(s) and contributor(s) and not of MDPI and/or the editor(s). MDPI and/or the editor(s) disclaim responsibility for any injury to people or property resulting from any ideas, methods, instructions or products referred to in the content. |
© 2023 by the authors. Licensee MDPI, Basel, Switzerland. This article is an open access article distributed under the terms and conditions of the Creative Commons Attribution (CC BY) license (https://creativecommons.org/licenses/by/4.0/).