Article

Assessing Transformation Practices in China under Energy and Environmental Policy Goals: A Green Design Perspective

1
College of Mechanical Engineering and Automation, Huaqiao University, Xiamen 361021, China
2
School of Public Affairs, Chongqing University, Chongqing 400044, China
3
Center for Public Economy & Public Policy Research, Chongqing University, Chongqing 400044, China
*
Author to whom correspondence should be addressed.
Sustainability 2023, 15(4), 2948; https://doi.org/10.3390/su15042948
Submission received: 10 January 2023 / Revised: 28 January 2023 / Accepted: 30 January 2023 / Published: 6 February 2023

Abstract

:
To achieve energy and environmental policy goals, profound social changes have taken place in the Chinese society. Existing relevant research on energy assessment tends to focus on their respective fields, and policy-level support often requires an assessment of predictable effects based on the overall perspective. In response to this problem, this paper carries out an interdisciplinary study. We chose green design as a new perspective to assess this process. Green design has made important contributions to the sustainable development in the fields of building, construction, and urban planning, which deeply affect the energy consumption in the world. By combing through the development concepts and models of green design in various fields, a comprehensive index—green design index (hereafter referred as to GDI)—is first introduced. Further, a multi-level big data structure of GDI has been built and the development of green design in regions of China based on long-term series is quantitatively assessed. The results of this study show that green design in regions of China has been greatly improved during the inspection period, but there are huge regional differences. The required policies and implementation routes also need to be adapted to local conditions. This paper first introduces a credible quantitative analysis framework of green design, and a corresponding research foundation for energy transition research based on green design.

1. Introduction

Environmental problems have become increasingly serious with the rapid growth of energy consumption, especially in leading developing countries. The climate crisis is already causing panic [1]. In China, for example, the energy consumption experienced a tremendous growth, increasing from 1037.8 Mtce (million ton coal equivalent) in 1991 to 5240 Mtce in 2021 (Data source: WIND database). China’s energy consumption in the building construction industry was equivalent to the total energy demand of Norway, Vietnam, and the Philippines [2]. Consequently, governments are searching for energy transition solutions. Existing methods include technological progress, industrial structure adjustment, renewable energy substitution, factor market reform [3], etc.
Green innovation has a significant positive influence in enhancing energy efficiency across globe [4], some energy-related green design studies mainly discuss their respective fields, such as green manufacturing, green building, green transportation, green services, green agriculture, etc. While how to assess the impact of green design form overall perspective may have been ignored before. Green design is highly integrated with the concept of sustainable development, and its diffusion cost is very low compared to technological progress and industrial structure adjustment. However, alternative policy options usually require strict assessment. The main reason why green design is usually not considered in previous studies on energy transition is the lack of data. Green design development is usually scattered in various related fields, and there is a lack of data that can assess the overall green development in a region. It is fatal in policy analysis which causes policy makers to be unable to assess the amount of benefit from their policies. Consequently, it affects the policy’s support for green design. The work of this paper attempts to solve this problem by establishing a comprehensive assessment framework through a core index.
To be specific, the main contributions of this paper are as follows: (1) Through the development of interdisciplinary research, the GDI is constructed for the first time tentatively, providing the infrastructure for further research in this field. The green design is first constructed into a multi-level index, including the level of vision, realization, evaluation, and data. (2) A multi-level big data structure has been built for green design index that can be quantitatively assessed. (3) The development of green design index of various regions in China was comprehensively quantified. The structure of the rest paper is as follows. Section 2 reviews the literature related to the impact of green design on energy transition. Section 3 constructs and assesses China’s regional comprehensive green design index. Section 4 is the conclusion and policy implication.

2. Literature Review

Green design, also known as environmental design and life cycle design, refers to practices that aim to produce products with as little overall impact as possible on the environment [5]. Green design advocate reduce, reuse, recycle as its principles (which is called 3R principles) to conduct the design activities. “Reduce” refers to the first solution to the problem of excessive consumption by reducing natural resources. “Reuse” and “recycling” aim to use the products again in two approaches of conserving raw materials. “Reuse” refers to using the abandoned products again in the same form but in a different way, while “recycling” refers to changing their form (for example, by crushing, shredding, or melting them) to manufacture new products [6]. 3R principles could be an important reference for solving the energy problems.
Some previous research studied the relationship between the green design and energy transition by analyzing the product’s life cycle. Peder and Joyce (2004) [7] presented a method of performing life cycle energy analysis (LCEA) for the purpose of material selection. In their study, material options for a bumper-reinforcing beam on a 1030 kg vehicle were compared, and glass fiber composites and high-strength steel beams resulted in the lowest life cycle energy consumption. Green design, with its distinct advantages, has an impact on energy consumption in wide range of industries, such as green buildings, green transportation, green manufacturing, green services, and green agriculture. Buildings are the dominant contributor of energy consumption and greenhouse gas (GHG) emissions, contributing about 40% of total global final energy use and 30% of total energy-related GHG emissions [8,9]. Green building is considered as an important approach to save energy [10], which mainly focuses on the issue that green buildings can significantly reduce energy consumption per square foot [11]. To evaluate and promote the green building, nearly 60 countries around the world have developed their own rating systems [10]. The British Research Establishment Environmental Assessment Method (BREEAM) and the American Leadership in Energy and Environmental Buildings (LEED) are the leading and most internationally recognized environmental assessment methods for green buildings [12,13]. Transportation accounts for approximately 25% of global energy-related greenhouse gas emissions [14]. Eco-driving, one of the green design methods, was studied that could reduce fossil fuel consumption as well as improving energy efficiency. It is used in its broadest sense that includes three strands [15]. The first is strategic decisions which refer to vehicle selection and maintenance. The fuel economy of a car is 38% better than a pickup truck on average [16]. Different tires of the same size cause different rolling resistance. TRB estimates that a 10% change in nominal rolling resistance will result in a 1–2% change in fuel economy [17]. The second is tactical decisions including route selection and vehicle load. Study found that the average fuel economy on highways is approximately 9% better than on the other roads [18]. The third is operational decisions related to driver behavior. In a test performed by Reed et al. (2005), moderate driving performed 31% better mileage than aggressive driving on average [19]. The research on green manufacturing was initiated in the 1990s. Green manufacturing has been defined as an economically driven, system-wide integrated approach to reduce and eliminate all waste streams generated in the process of product and material development, manufacturing, use, and disposal [20]. Green manufacturing could help making the same product using fewer resources and/or energy through preventing wastes that can be eliminated in the process as well as the product [21]. Reusing metal elements instead of mining can reduce the greenhouse gases, reduce the energy consumption, and also eliminate the environmental impact of e-waste. For example, compared to extracting metals from natural ore, recycling metals can save a lot of energy. Specifically, aluminum is saved by 95%, copper is saved by 85%, steel is saved by 60%, zinc is saved by 75%, and nickel is saved by 90% [22]. Green service also known as eco-efficient service is a popular topic in discussions on sustainability and eco-efficiency. The most significant green service design is the sharing service, such as home-sharing, ride-sharing, and bike-sharing, which are also called sharing economy. The sharing economy seemingly encompasses online peer-to-peer economic activities as diverse as rental (Airbnb), for-profit service provision (Uber), and gifting (Freecycle) [23]. Take ride-sharing as an example, Cici et al. [24] estimated that ride sharing, with friends’ friends, through using cellphone records and geotagged tweets, can reduce the number of cars in a city by 31%. Santi et al. (2014) concluded that sharing taxi trips can cut trip length by 40% or more by analyzing trip origins and destinations of taxi trips in New York City [25]. In the field of agriculture, facilities of green design such as passive solar agricultural greenhouse could offer energy equal to 35% of the heating requirements of an identical conventional greenhouse [26]. The UN Special Rapporteur emphasized the potential of agroecology and believed that this is the best way to realize the right to adequate food, which is manifested in the following dimensions: availability, accessibility, adequacy, sustainability, and participation [27]. Evaluation of Natural Resource Management Systems (MESMIS) which is an indicator-based framework proposed an integrated interdisciplinary approach to assess sustainability of farming systems, improve the likelihood of success in the design of alternatives and the implementation of development projects [28]. Smart Energy Systems take an integrated focus on electricity, heating, cooling, industry, buildings, and transportation [29], which could be helpful to the Smart City planning strategies [30], and allows consumers to make common choices for satisfying their energy needs through the optimal management of a set of multi-carrier energy technologies, by achieving better economic and environmental benefits compared to the business-as-usual scenario [31]. Figure 1 shows the impact of green design on energy transition in various fields.
Through the above literature review, it can be found that the existing research on green design and energy transition tends to be fragmented and scattered in various fields. The effect evaluation of existing research is often concentrated in a certain field, and there is no overall evaluation of the impact of macro-green development. Seeking support at the policy level often requires an overall evaluation of the expected effect required by policymakers. Aiming at this pain point, this paper attempts to supplement the deficiencies of existing research by constructing a comprehensive green design index and evaluating the impact of green design development.

3. Construct and Assess China’s Regional Comprehensive GDI

3.1. Construction of GDI

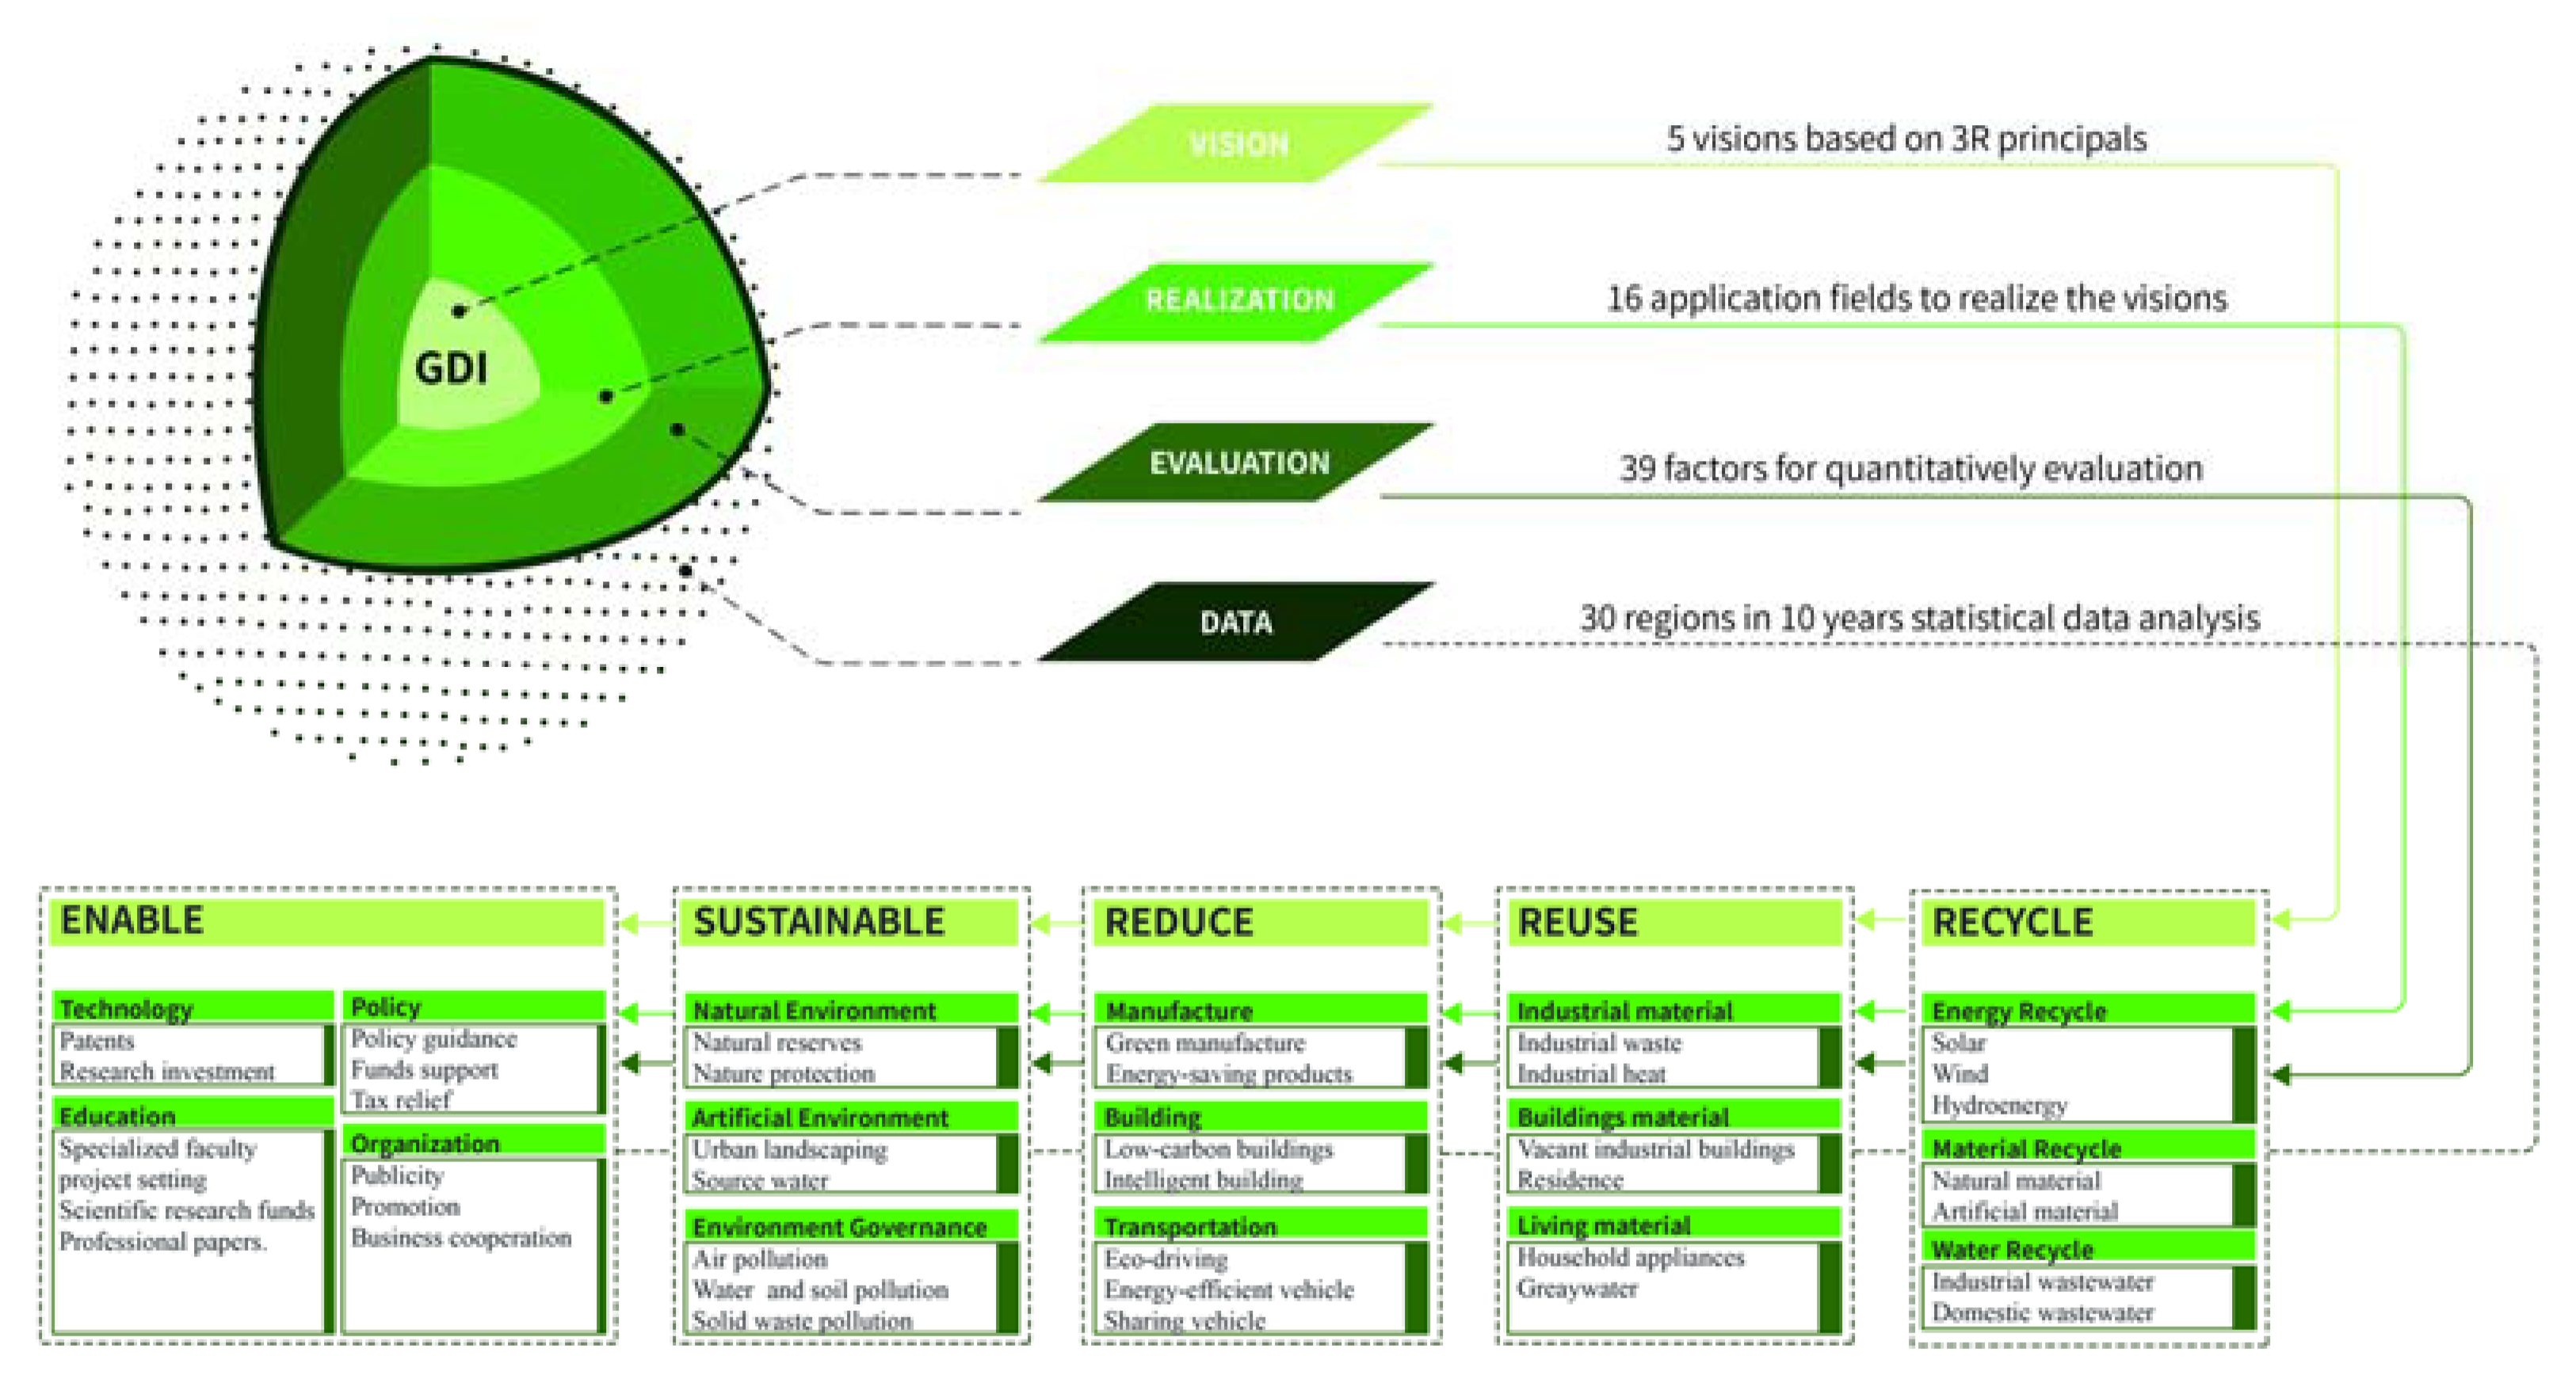
GDI is decomposed into four levels: vision, realization, evaluation, and data. In the first vision level there are five visions, which stand for the core ideas of green design. In the second realization level there are 16 application fields which explain how to realize the five visions in the upper-level. The third level is evaluation, which aims to specify the factors for quantitatively evaluating the realization level. According to each evaluation factors, the data are collected to constitute the fourth data level. To be specific, there are five visions which are extended from 3R principles; they are respectively Enable, Sustainable, Reduce, Reuse, and Recycle. Enable means to give objects the capability of green design. Chen et al. (2020) [32] pointed out that patenting in renewable energy technologies played an important role in developing the economy in China. Renewable energy technology could be seen as enable capability. Enable is further decomposed into green technology, green education, green policy, and green organization in the realization level. In the next level, green technology is decomposed into patent and research investment [33,34]. Green education is decomposed into specialized faculty, project, scientific research fund, and professional papers [35,36,37]. Green policy is decomposed into policy guidance, support fund, and tax relief [38,39]. Green organization is decomposed into publicity, promotion, business cooperation [40,41]. Sustainable stands for the environment conservation. With the deepening of human understanding of the environment, the view that the environment is a resource is more and more accepted by people. Air, water, soil, mineral resources, etc., are the natural wealth of the society and the material basis for the development of production, constituting the factors of productive forces. Protecting the environment in a healthy situation is protecting the input quality of the production which affects the energy efficient eventually. Der-Petrossian (2000) [42] outlined that the impacts of the construction industry on agricultural land, forests, water, and air are considered to improve energy efficiency. Sustainable is further decomposed into natural environment protection, artificial environment protection, and environment governance. In the evaluation level, natural environment protection consists of natural reserve, nature protection [43,44]. Artificial environment protection refers to urban landscaping, source water protection [45,46,47]. Environment governance refers to air pollution governance, water and soil pollution governance, solid waste pollution governance [48,49]. Reduce is decomposed into reduce the consumption of industrial manufacture, reduce the consumption of building, and reduce the consumption of transportation. Further, reduce the consumption of manufacture refers to green manufacture and energy-saving products promotion [50,51]. Reduce the consumption of building refers to low-carbon building and intelligent building [52,53]. Reduce the consumption of transportation refers to eco-driving, energy-saving vehicle and sharing vehicle [15,54,55]. Reuse is decomposed into reuse industrial material, reuse building material, and reuse living material. In the realization level, reuse industrial material consists of reuse industrial waste and industrial heat [56,57]. Reuse building material consists of reuse vacant factory and residence [58,59]. Reuse living material consists of reuse household appliance and greywater [60,61,62]. Recycle is decomposed into energy recycle, materials recycle, and water recycle. In the next level, energy recycle refers to solar recycle, wind recycle, and hydro energy recycle [63]. Material recycle refers to natural material recycle and artificial material recycle [64,65]. Water recycle refers to industrial wastewater recycle and domestic wastewater recycle [66,67]. The structure of the GDI is briefly outlined in a framework as Figure 2 shows.

3.2. Assessing the Development of GDI in Regions of China

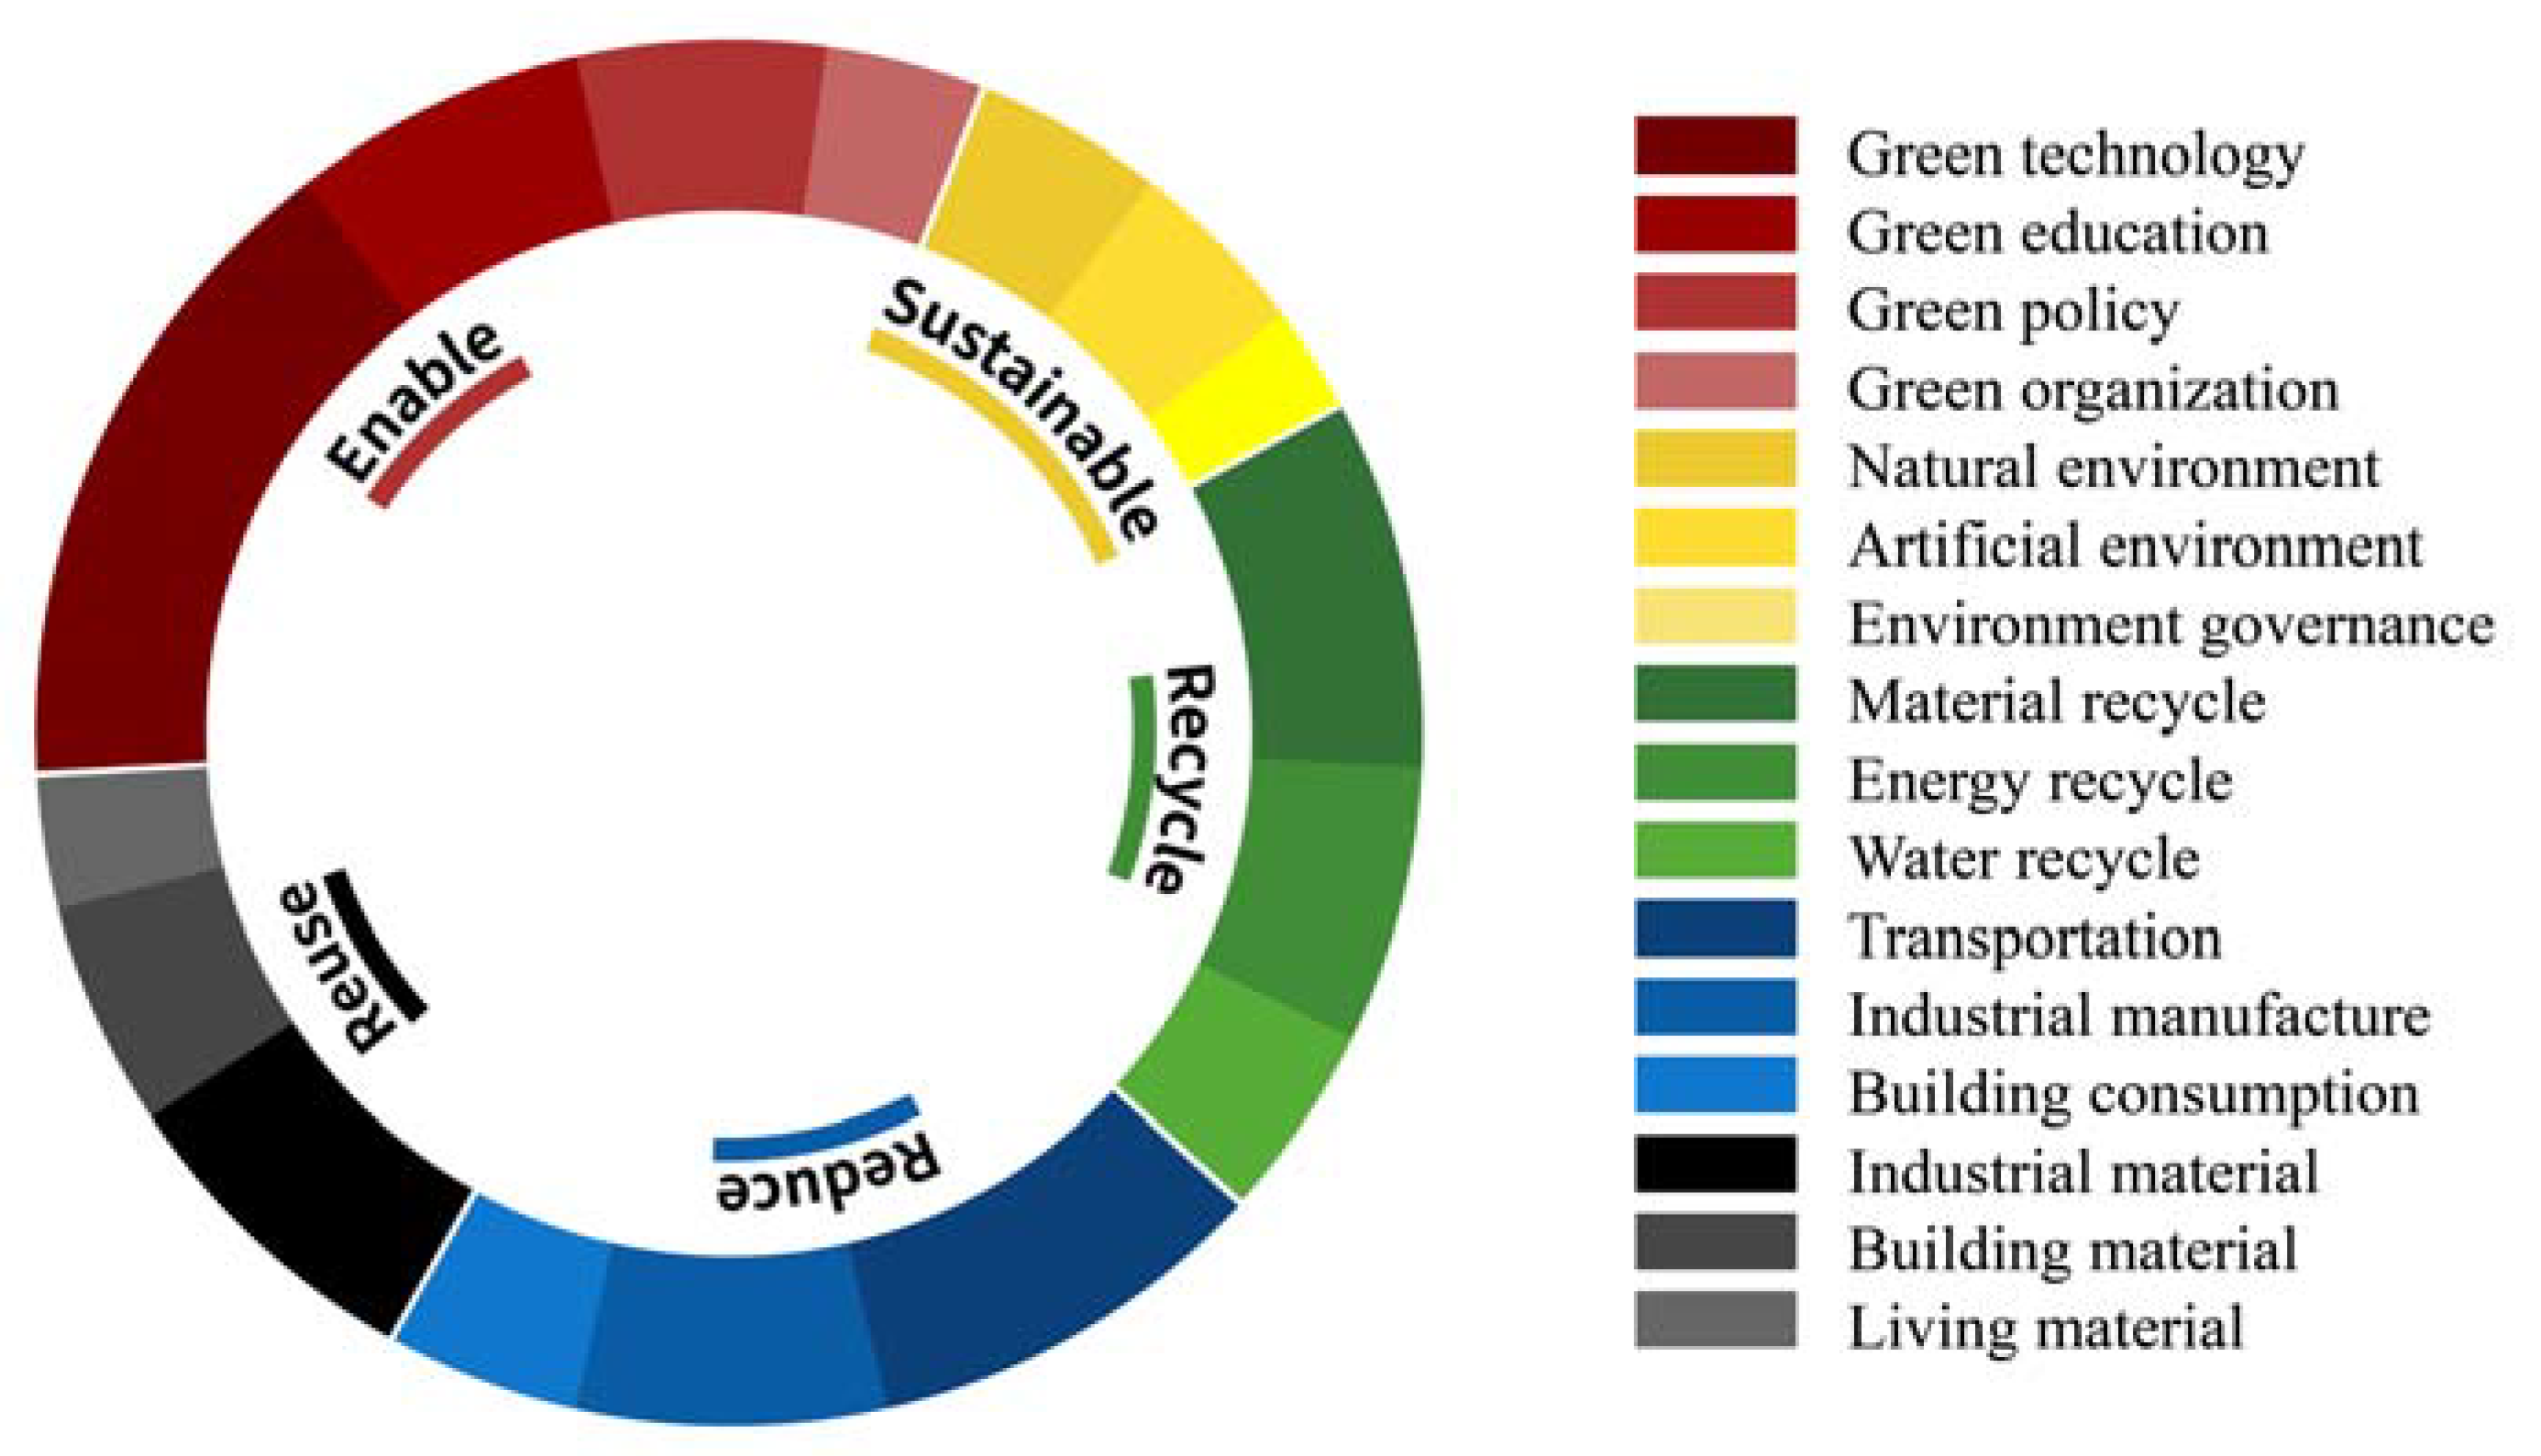
Based on the framework of the GDI established in the previous section, China’s regional GDI is further measured. First, a group of experts were invited to evaluate the weights of the five visions of the first level (vision level) and then the 16 application fields second level (realization level), and the analytic hierarchy process (AHP) method is applied in this process. The AHP was used to calculate the weight of the three competitiveness components. It is a multi-objective decision-making method, which is used in the fields of economy, society, and management science. The main theoretical basis is to use the hierarchical structure to help decision-makers have a deeper understanding of an uncertain situation and of research issues with multiple evaluation criteria, enabling solutions to complex decision-making problems [68,69]. The results are shown in Table 1 and Figure 3.
According to the quantitative 39 factors of the third level (evaluation level), data were collected from 30 provinces of China (Tibet is not included) over the period 2006 to 2015, which covers the 11th Five-Year Plan and the 12th Five-Year Plan. The data used are from the Chinese patent database and Chinese Statistical Yearbook in different fields. All the data were de-dimensionalized according to linear dimensionless methods [70]. Then the GDI in regions of China is calculated. Table 2 presents the summary of China’s regional GDI. It can be seen from the calculation results that China’s green design development has made considerable progress in recent years, and almost all regions have shown an increasing trend in time series.
Figure 4 shows the regional development trend of green design in China from 2006 to 2015. In this figure, the development of green design in China has formed a “head zone” (the first square) composed of Beijing, Tianjin, Zhejiang, Shanghai, and Jiangsu. It can be seen that this head zone is not consistent with the head zone of China’s regional economic development level. For example, Guangdong, which has a relatively high level of economic development, has a significant gap between its green design development level and the head area. Tianjin, although the level of economic development was not high, had always been in the forefront in green design index and rose to the second place in 2015. The possible reason is that with the gradual development of the Beijing–Tianjin–Hebei integration strategy of the Chinese government, the rapid development of Tianjin’s overall green design level may come from the positive radiation in the Beijing area. From China’s experience, the development of green design has the characteristics of obvious spatial agglomeration, and the head zone is formed around two central points in Beijing and Shanghai. The five regions of Guangdong, Anhui, Chongqing, Fujian, and Shandong rank behind the head zone, forming the “middle zone.” Among them, Guangdong owned the best foundation in 2005 compared with other regions, but the development speed is slower. By contrast, Anhui had the weakest foundation, but it developed very fast. Shandong province experienced a leap-forward development in 2013. It is speculated that it may be related to the strategy of “Building an Ecological Shandong” proposed by the local government in 2012 (The Shandong Provincial Government proposed the strategy of “Building an Ecological Shandong” in 2012). In addition, it is worth noting that the number of areas covered by the middle zone is small compared to the overall number. This situation is not optimistic for the development of green design, and it is difficult to play the role of the middle zone for connecting the preceding and following. After the middle zone, there are a large number of slow-developing “backward zone”, and as time goes by, the gap between the preceding zones and backward zone is increasing. In the backward zone, Shanxi, Gansu, Inner Mongolia, Guizhou, and Qinghai are the last five regions respectively. It is particularly worth noting that Shanxi province, which is ranked last, is an important energy supply province in China. This clearly indicates that the green design portends tremendous opportunities which may bring huge sustainable benefits.
Figure 5 presents the Kernel density evolution of GDI in China. From the figure, we can see that the distribution of GDI shows a clear right deviation, that is, GDI in a few regions is much higher than other regions, which also illustrates the development process of green design in China is quite inconsistent. At present, most regions of China are in backward area, which means that China has a huge room for green design development, which is of great significance to the sustainable development of China and the world.

4. Conclusions and Policy Implications

This paper discusses the transformation practices in China under energy and environmental policy goals from the green design perspective. By combing the current green design research in the fields of building, transportation, manufacture, service, and agriculture etc., we constructed an analysis framework for overall evaluation of green design from the policy level, and quantitatively explored the development of green design in an important country with huge resource consumption. Based on the newly introduced GDI, a comprehensive evaluation research is carried out. The results show that China has made great progress in the development of green design in recent years, and almost all regions have shown an increasing trend in time series. At present, the development of green design in China has formed the first square of Beijing, Tianjin, Zhejiang, Shanghai, and Jiangsu. Interestingly, this square does not coincide with the first square of economic development in China. For example, there is a clear gap between the first square and Guangdong, which has a higher level of economic development. Meanwhile, Tianjin’s economic development level usually does not appear in the second position in the ranking of most indexes in China. The policy implications behind it are important: that is, the development of green design does not entirely come from economic development. A region can improve the level of green design through policy guidance and other means to obtain better sustainable benefits. At the same time, this article also tends to think that Tianjin’s green design development comes from Beijing’s spatial “contagion” of green design policies and concepts. From China’s experience, the development of green design has obvious spatial agglomeration characteristics. The “first square” is formed around the two central points in Beijing and Shanghai. For some reasons, Guangdong has not yet become the central point of China’s green design development. However, in the future, it may improve with the planning of the “Guangdong-Hong Kong-Macao Greater Bay Area”. The overall green design transition trend in each region of China at a data level could support policy design in terms of energy and environment.
From the above results, it can be seen that the GDI can provide energy and environmental policy support for policymakers from the level of big data. Different regions have different levels and trends of development, and the required policies and implementation routes also need to be adapted to local conditions. In addition, the GDI provides a unique perspective on innovative research on energy efficiency. As far as we are aware, there exist four strands in the previous literature concerning energy efficiency improvement. The first strand emphasizes the technologies development and technology spillovers from abroad could increase energy efficiency, meanwhile substitution of energy for human capital increases energy intensity [71,72]. The second strand shows that population density has positive effects on energy efficiency [73,74,75]. The third strand goes further from the market perspective such as market instruments, energy price and scale [76,77]. The fourth strand of the literature measures and discusses the impact of institutional quality on energy efficiency and different categories as well as variables were collected and calculated to show that institutional quality positively affects the energy efficiency [4,78]. Green design may be a new parameter affecting energy efficiency and deserves further research.
There are some limitations in this paper which should be noted. As little research has been done on quantitative evaluation of green design from the macro level in the existing literature, this paper attempted to build a preliminary framework. Limited to the availability of multi-dimensional data across disciplines, the core index design and research dimensions of this article could not cover all the subdivisions of green design. At the same time, in a longer time span, whether green design will show different characteristics, and how to quantify the policy cost of green design, are still worthy of further research.

Author Contributions

Conceptualization, S.Y. and C.Z.; Methodology, S.Y.; Software, C.Z.; Data curation, S.Y.; Writing—original draft, S.Y.; Writing—review & editing, C.Z. All authors have read and agreed to the published version of the manuscript.

Funding

This work was supported by the National Social Science Foundation of China under Grant No. 17CJY020 and the Fundamental Research Funds for the Central Universities Project No. 2018CDXYGG0054& No. 106112016CDJSK01XK04.

Institutional Review Board Statement

Not applicable.

Informed Consent Statement

Not applicable.

Data Availability Statement

Restrictions apply to the availability of these data. Data was obtained from [Wind] and are available [from the authors/at https://orcid.org/0000-0003-1270-8623] with the permission of [Wind].

Conflicts of Interest

The authors declare no conflict of interest.

References

  1. Pierrehumbert, R. There is no Plan B for dealing with the climate crisis. Bull. At. Sci. 2019, 75, 215–221. [Google Scholar] [CrossRef]
  2. Lin, B.; Liu, H. CO2 mitigation potential in China’s building construction industry: A comparison of energy performance. Build. Environ. 2015, 94, 239–251. [Google Scholar] [CrossRef]
  3. Lin, B.; Du, K. Energy and CO2 emissions performance in China’s regional economies: Do market-oriented reforms matter? Energy Policy 2015, 78, 113–124. [Google Scholar] [CrossRef]
  4. Sun, H.; Edziah, B.K.; Sun, C.; Kporsu, A.K. Institutional quality, green innovation and energy efficiency. Energy Policy 2019, 135, 111002. [Google Scholar] [CrossRef]
  5. Glantschnig, W.J. Green design: An introduction to issues and challenges. IEEE Trans. Compon. Packag. Manuf. Technol. Part A 1994, 17, 508–513. [Google Scholar] [CrossRef]
  6. Oskamp, S. A sustainable future for humanity? How can psychology help? Am. Psychol. 2000, 55, 496. [Google Scholar] [CrossRef] [PubMed]
  7. Fitch, P.E.; Smith Cooper, J. Life cycle energy analysis as a method for material selection. J. Mech. Des. 2004, 126, 798–804. [Google Scholar] [CrossRef]
  8. Alam, M.; Zou, P.X.; Stewart, R.A.; Bertone, E.; Sahin, O.; Buntine, C.; Marshall, C. Government championed strategies to overcome the barriers to public building energy efficiency retrofit projects. Sustain. Cities Soc. 2019, 44, 56–69. [Google Scholar] [CrossRef]
  9. Nejat, P.; Jomehzadeh, F.; Taheri, M.M.; Gohari, M.; Majid, M.Z.A. A global review of energy consumption, CO2 emissions and policy in the residential sector (with an overview of the top ten CO2 emitting countries). Renew. Sustain. Energy Rev. 2015, 43, 843–862. [Google Scholar] [CrossRef]
  10. Berardi, U. Sustainable construction: Green building design and delivery. Intell. Build. Int. 2013, 5, 65–66. [Google Scholar] [CrossRef]
  11. MacNaughton, P.; Cao, X.; Buonocore, J.; Cedeno-Laurent, J.; Spengler, J.; Bernstein, A.; Allen, J. Energy savings, emission reductions, and health co-benefits of the green building movement. J. Expo. Sci. Environ. Epidemiol. 2018, 28, 307–318. [Google Scholar] [CrossRef]
  12. Xu, Z.; Lau, S.S.Y. Introduction to the building research establishment environmental assessment method (BREEAM) in UK. New Archit. 2002, 80, 55–58. [Google Scholar]
  13. Larson, A.; Meier, M.; York, J. Rating environmental performance in the building industry: Leadership in Energy and Environmental Design (LEED). Darden Bus. Publ. Cases 2017, 1–20. [Google Scholar] [CrossRef]
  14. McCollum, D.L.; Wilson, C.; Bevione, M.; Carrara, S.; Edelenbosch, O.Y.; Emmerling, J.; Guivarch, C.; Karkatsoulis, P.; Keppo, I.; Krey, V.; et al. Interaction of consumer preferences and climate policies in the global transition to low-carbon vehicles. Nat. Energy 2018, 3, 664–673. [Google Scholar] [CrossRef]
  15. Sivak, M.; Schoettle, B. Eco-driving: Strategic, tactical, and operational decisions of the driver that influence vehicle fuel economy. Transp. Policy 2012, 22, 96–99. [Google Scholar] [CrossRef]
  16. EPA Fuel Economy Guide. 2011. Available online: http://www.fueleconomy.gov/feg/download.shtml (accessed on 9 January 2023).
  17. Menzies, T.R., Jr. New TRB Special Report: Tires and Passenger Vehicle Fuel Economy: Informing Consumers, Improving Performance. TR News, 14 September 2006; pp. 22–23. [Google Scholar]
  18. Garcha, A.; Norup, S.; Kormylo, A. 2007 Canadian Vehicle Survey: Summary Report; Office of Energy Efficiency: Ottawa, Canada, 2009. [Google Scholar]
  19. Reed, P. We Test the Tips: What Really Saves Gas? And How Much? 2009. Available online: http://www.edmunds.com/fuel-economy/we-test-the-tips.html (accessed on 9 January 2023).
  20. Handfield, R.B.; Walton, S.V.; Seegers, L.K.; Melnyk, S.A. ‘Green’value chain practices in the furniture industry. J. Oper. Manag. 1997, 15, 293–315. [Google Scholar] [CrossRef]
  21. Deif, A.M. A system model for green manufacturing. J. Clean. Prod. 2011, 19, 1553–1559. [Google Scholar] [CrossRef]
  22. Sahajwalla, V.; Pahlevani, F.; Maroufi, S.; Rajarao, R. Green manufacturing: A key to innovation economy. J. Sustain. Metall. 2016, 2, 273–275. [Google Scholar] [CrossRef]
  23. Martin, C.J. The sharing economy: A pathway to sustainability or a nightmarish form of neoliberal capitalism? Ecol. Econ. 2016, 121, 149–159. [Google Scholar] [CrossRef]
  24. Cici, B.; Markopoulou, A.; Frias-Martinez, E.; Laoutaris, N. Assessing the potential of ride-sharing using mobile and social data: A tale of four cities. In Proceedings of the 2014 ACM International Joint Conference on Pervasive and Ubiquitous Computing, Seattle, WA, USA, 13–17 September 2014; pp. 201–211. [Google Scholar]
  25. Santi, P.; Resta, G.; Szell, M.; Sobolevsky, S.; Strogatz, S.H.; Ratti, C. Quantifying the benefits of vehicle pooling with shareability networks. Proc. Natl. Acad. Sci. USA 2014, 111, 13290–13294. [Google Scholar] [CrossRef]
  26. Santamouris, M.; Argiriou, A.; Vallindras, M. Design and operation of a low energy consumption passive solar agricultural greenhouse. Sol. Energy 1994, 52, 371–378. [Google Scholar] [CrossRef]
  27. Schutter, O.D. Report Submitted by the Special Rapporteur on the Right to Food, Olivier de Schutter: Women’s Rights and the Right to Food; United Nations: Geneva, Switzerland, 2012. [Google Scholar]
  28. López-Ridaura, S.; Masera, O.; Astier, M. Evaluating the sustainability of complex socio-environmental systems. The MESMIS framework. Ecol. Indic. 2002, 2, 135–148. [Google Scholar] [CrossRef]
  29. Lund, H.; Østergaard, P.A.; Connolly, D.; Mathiesen, B.V. Smart energy and smart energy systems. Energy 2017, 137, 556–565. [Google Scholar] [CrossRef]
  30. Yarashynskaya, A.; Prus, P. Smart Energy for a Smart City: A Review of Polish Urban Development Plans. Energies 2022, 15, 8676. [Google Scholar] [CrossRef]
  31. Di Somma, M.; Buonanno, A.; Caliano, M.; Graditi, G.; Piazza, G.; Bracco, S.; Delfino, F. Stochastic Operation Optimization of the Smart Savona Campus as an Integrated Local Energy Community Considering Energy Costs and Carbon Emissions. Energies 2022, 15, 8418. [Google Scholar] [CrossRef]
  32. Chen, Y.; Lin, B. Decomposition analysis of patenting in renewable energy technologies: From an extended LMDI approach perspective based on three Five-Year Plan periods in China. J. Clean. Prod. 2020, 269, 122402. [Google Scholar] [CrossRef]
  33. Hall, B.H.; Helmers, C. Innovation and diffusion of clean/green technology: Can patent commons help? J. Environ. Econ. Manag. 2013, 66, 33–51. [Google Scholar] [CrossRef]
  34. Bian, J.; Zhang, G.; Zhou, G. Manufacturer vs. consumer subsidy with green technology investment and environmental concern. Eur. J. Oper. Res. 2020, 287, 832–843. [Google Scholar] [CrossRef]
  35. Dabaieh, M.; Lashin, M.; Elbably, A. Going green in architectural education: An urban living lab experiment for a graduation green design studio in Saint Catherine, Egypt. Sol. Energy 2017, 144, 356–366. [Google Scholar] [CrossRef]
  36. Shonnard, D.R.; Allen, D.T.; Nguyen, N.; Austin, S.W.; Hesketh, R. Green engineering education through a US EPA/Academia collaboration. Environ. Sci. Technol. 2003, 37, 5453–5462. [Google Scholar] [CrossRef]
  37. Geng, Y.; Liu, K.; Xue, B.; Fujita, T. Creating a “green university” in China: A case of Shenyang University. J. Clean. Prod. 2013, 61, 13–19. [Google Scholar] [CrossRef]
  38. Fullerton, D.; Wu, W. Policies for green design. J. Environ. Econ. Manag. 1998, 36, 131–148. [Google Scholar] [CrossRef]
  39. Eichner, T.; Runkel, M. Efficient policies for green design in a vintage durable good model. Environ. Resour. Econ. 2005, 30, 259–278. [Google Scholar] [CrossRef]
  40. Carpenter, C. Businesses, green groups and the media: The role of non-governmental organizations in the climate change debate. Int. Aff. 2001, 77, 313–328. [Google Scholar] [CrossRef]
  41. Hartman, C.L.; Stafford, E.R. Green alliances: Building new business with environmental groups. Long Range Plan. 1997, 30, 184–196, 148–149. [Google Scholar] [CrossRef]
  42. Der-Petrossian, B.; Johansson, E. Construction and Environment-Improving energy efficiency. Build. Issues 2000, 2, 1–21. [Google Scholar]
  43. Schonewald-Cox, C.M.; Bayless, J.W. The boundary model: A geographical analysis of design and conservation of nature reserves. Biol. Conserv. 1986, 38, 305–322. [Google Scholar] [CrossRef]
  44. Bonheur, N.; Lane, B.D. Natural resources management for human security in Cambodia’s Tonle Sap Biosphere Reserve. Environ. Sci. Policy 2002, 5, 33–41. [Google Scholar] [CrossRef]
  45. Tian, L. Analysis of the artistic effect of garden plant landscaping in urban greening. Comput. Intell. Neurosci. 2022, 2022, 1–8. [Google Scholar] [CrossRef]
  46. Autixier, L.; Mailhot, A.; Bolduc, S.; Madoux-Humery, A.S.; Galarneau, M.; Prévost, M.; Dorner, S. Evaluating rain gardens as a method to reduce the impact of sewer overflows in sources of drinking water. Sci. Total Environ. 2014, 499, 238–247. [Google Scholar] [CrossRef]
  47. Camagni, R.; Capello, R.; Nijkamp, P. Towards sustainable city policy: An economy-environment technology nexus. Ecol. Econ. 1998, 24, 103–118. [Google Scholar] [CrossRef]
  48. Zhang, M.; Liu, X.; Ding, Y.; Wang, W. How does environmental regulation affect haze pollution governance?—An empirical test based on Chinese provincial panel data. Sci. Total Environ. 2019, 695, 133905. [Google Scholar] [CrossRef] [PubMed]
  49. Bhuiyan, S.H. A crisis in governance: Urban solid waste management in Bangladesh. Habitat Int. 2010, 34, 125–133. [Google Scholar] [CrossRef]
  50. Tseng, M.L.; Tan, R.R.; Siriban-Manalang, A.B. Sustainable consumption and production for Asia: Sustainability through green design and practice. J. Clean. Prod. 2013, 40, 1–5. [Google Scholar] [CrossRef]
  51. Choe, C.; Fraser, I. On the flexibility of optimal policies for green design. Environ. Resour. Econ. 2001, 18, 367–371. [Google Scholar] [CrossRef]
  52. Griffiths, S.; Sovacool, B.K. Rethinking the future low-carbon city: Carbon neutrality, green design, and sustainability tensions in the making of Masdar City. Energy Res. Soc. Sci. 2020, 62, 101368. [Google Scholar] [CrossRef]
  53. Kua, H.W.; Lee, S.E. Demonstration intelligent building—A methodology for the promotion of total sustainability in the built environment. Build. Environ. 2002, 37, 231–240. [Google Scholar] [CrossRef]
  54. Litman, T. Efficient vehicles versus efficient transportation. Comparing transportation energy conservation strategies. Transp. Policy 2005, 12, 121–129. [Google Scholar] [CrossRef]
  55. Chen, W.; Liu, Q.; Zhang, C.; Mi, Z.; Zhu, D.; Liu, G. Characterizing the stocks, flows, and carbon impact of dockless sharing bikes in China. Resour. Conserv. Recycl. 2020, 162, 105038. [Google Scholar] [CrossRef]
  56. Park, J.Y. Assessing determinants of industrial waste reuse: The case of coal ash in the United States. Resour. Conserv. Recycl. 2014, 92, 116–127. [Google Scholar] [CrossRef]
  57. Stijepovic, M.Z.; Linke, P. Optimal waste heat recovery and reuse in industrial zones. Energy 2011, 36, 4019–4031. [Google Scholar]
  58. Ball, R. Developers, regeneration and sustainability issues in the reuse of vacant industrial buildings. Build. Res. Inf. 1999, 27, 140–148. [Google Scholar] [CrossRef]
  59. Langston, C.; Wong, F.K.; Hui, E.C.; Shen, L.Y. Strategic assessment of building adaptive reuse opportunities in Hong Kong. Build. Environ. 2008, 43, 1709–1718. [Google Scholar] [CrossRef]
  60. Bovea, M.D.; Ibáñez-Forés, V.; Pérez-Belis, V.; Quemades-Beltrán, P. Potential reuse of small household waste electrical and electronic equipment: Methodology and case study. Waste Manag. 2016, 53, 204–217. [Google Scholar] [CrossRef] [PubMed]
  61. Truttmann, N.; Rechberger, H. Contribution to resource conservation by reuse of electrical and electronic household appliances. Resour. Conserv. Recycl. 2006, 48, 249–262. [Google Scholar] [CrossRef]
  62. Dixon, A.; Butler, D.; Fewkes, A. Water saving potential of domestic water reuse systems using greywater and rainwater in combination. Water Sci. Technol. 1999, 39, 25–32. [Google Scholar] [CrossRef]
  63. Matsuo, T.; Schmidt, T.S. Managing tradeoffs in green industrial policies: The role of renewable energy policy design. World Dev. 2019, 122, 11–26. [Google Scholar] [CrossRef]
  64. Nelen, D.; Manshoven, S.; Peeters, J.R.; Vanegas, P.; D’Haese, N.; Vrancken, K. A multidimensional indicator set to assess the benefits of WEEE material recycling. J. Clean. Prod. 2014, 83, 305–316. [Google Scholar] [CrossRef]
  65. Fortelný, I.; Michálková, D.; Kruliš, Z. An efficient method of material recycling of municipal plastic waste. Polym. Degrad. Stab. 2004, 85, 975–979. [Google Scholar] [CrossRef]
  66. Klemeš, J.J. Industrial water recycle/reuse. Curr. Opin. Chem. Eng. 2012, 1, 238–245. [Google Scholar] [CrossRef]
  67. Jefferson, B.; Laine, A.; Parsons, S.; Stephenson, T.; Judd, S. Technologies for domestic wastewater recycling. Urban Water 2000, 1, 285–292. [Google Scholar] [CrossRef]
  68. Hsiao, S.W. Fuzzy logic based decision model for product design. Int. J. Ind. Ergon. 1998, 21, 103–116. [Google Scholar] [CrossRef]
  69. Partovi, F.Y. An analytic model for locating facilities strategically. Omega 2006, 34, 41–55. [Google Scholar] [CrossRef]
  70. Guo, Y.J.; Yi, P.T. Character analysis of linear dimensionless methods. Stat. Res. 2008, 25, 93–100. [Google Scholar]
  71. Stern, D.I. Modeling international trends in energy efficiency. Energy Econ. 2012, 34, 2200–2208. [Google Scholar] [CrossRef]
  72. Marin, G.; Palma, A. Technology Invention and Diffusion in Residential Energy Consumption. A Stochastic Frontier Approach. Stoch. Front. Approach 2015. Available online: https://papers.ssrn.com/sol3/papers.cfm?abstract_id=2662362 (accessed on 9 January 2023).
  73. Otsuka, A.; Goto, M. Estimation and determinants of energy efficiency in J apanese regional economies. Reg. Sci. Policy Pract. 2015, 7, 89–101. [Google Scholar] [CrossRef]
  74. Jiang, L.; Folmer, H.; Ji, M.; Tang, J. Energy efficiency in the Chinese provinces: A fixed effects stochastic frontier spatial Durbin error panel analysis. Ann. Reg. Sci. 2017, 58, 301–319. [Google Scholar] [CrossRef]
  75. Jebali, E.; Essid, H.; Khraief, N. The analysis of energy efficiency of the Mediterranean countries: A two-stage double bootstrap DEA approach. Energy 2017, 134, 991–1000. [Google Scholar] [CrossRef]
  76. Lin, B.; Long, H. A stochastic frontier analysis of energy efficiency of China’s chemical industry. J. Clean. Prod. 2015, 87, 235–244. [Google Scholar] [CrossRef]
  77. Song, F.; Yu, Y. Modelling energy efficiency in China: A fixed-effects panel stochastic frontier approach. Econ. Political Stud. 2018, 6, 158–175. [Google Scholar] [CrossRef]
  78. Sarkodie, S.A.; Adams, S. Renewable energy, nuclear energy, and environmental pollution: Accounting for political institutional quality in South Africa. Sci. Total Environ. 2018, 643, 1590–1601. [Google Scholar] [CrossRef] [PubMed]
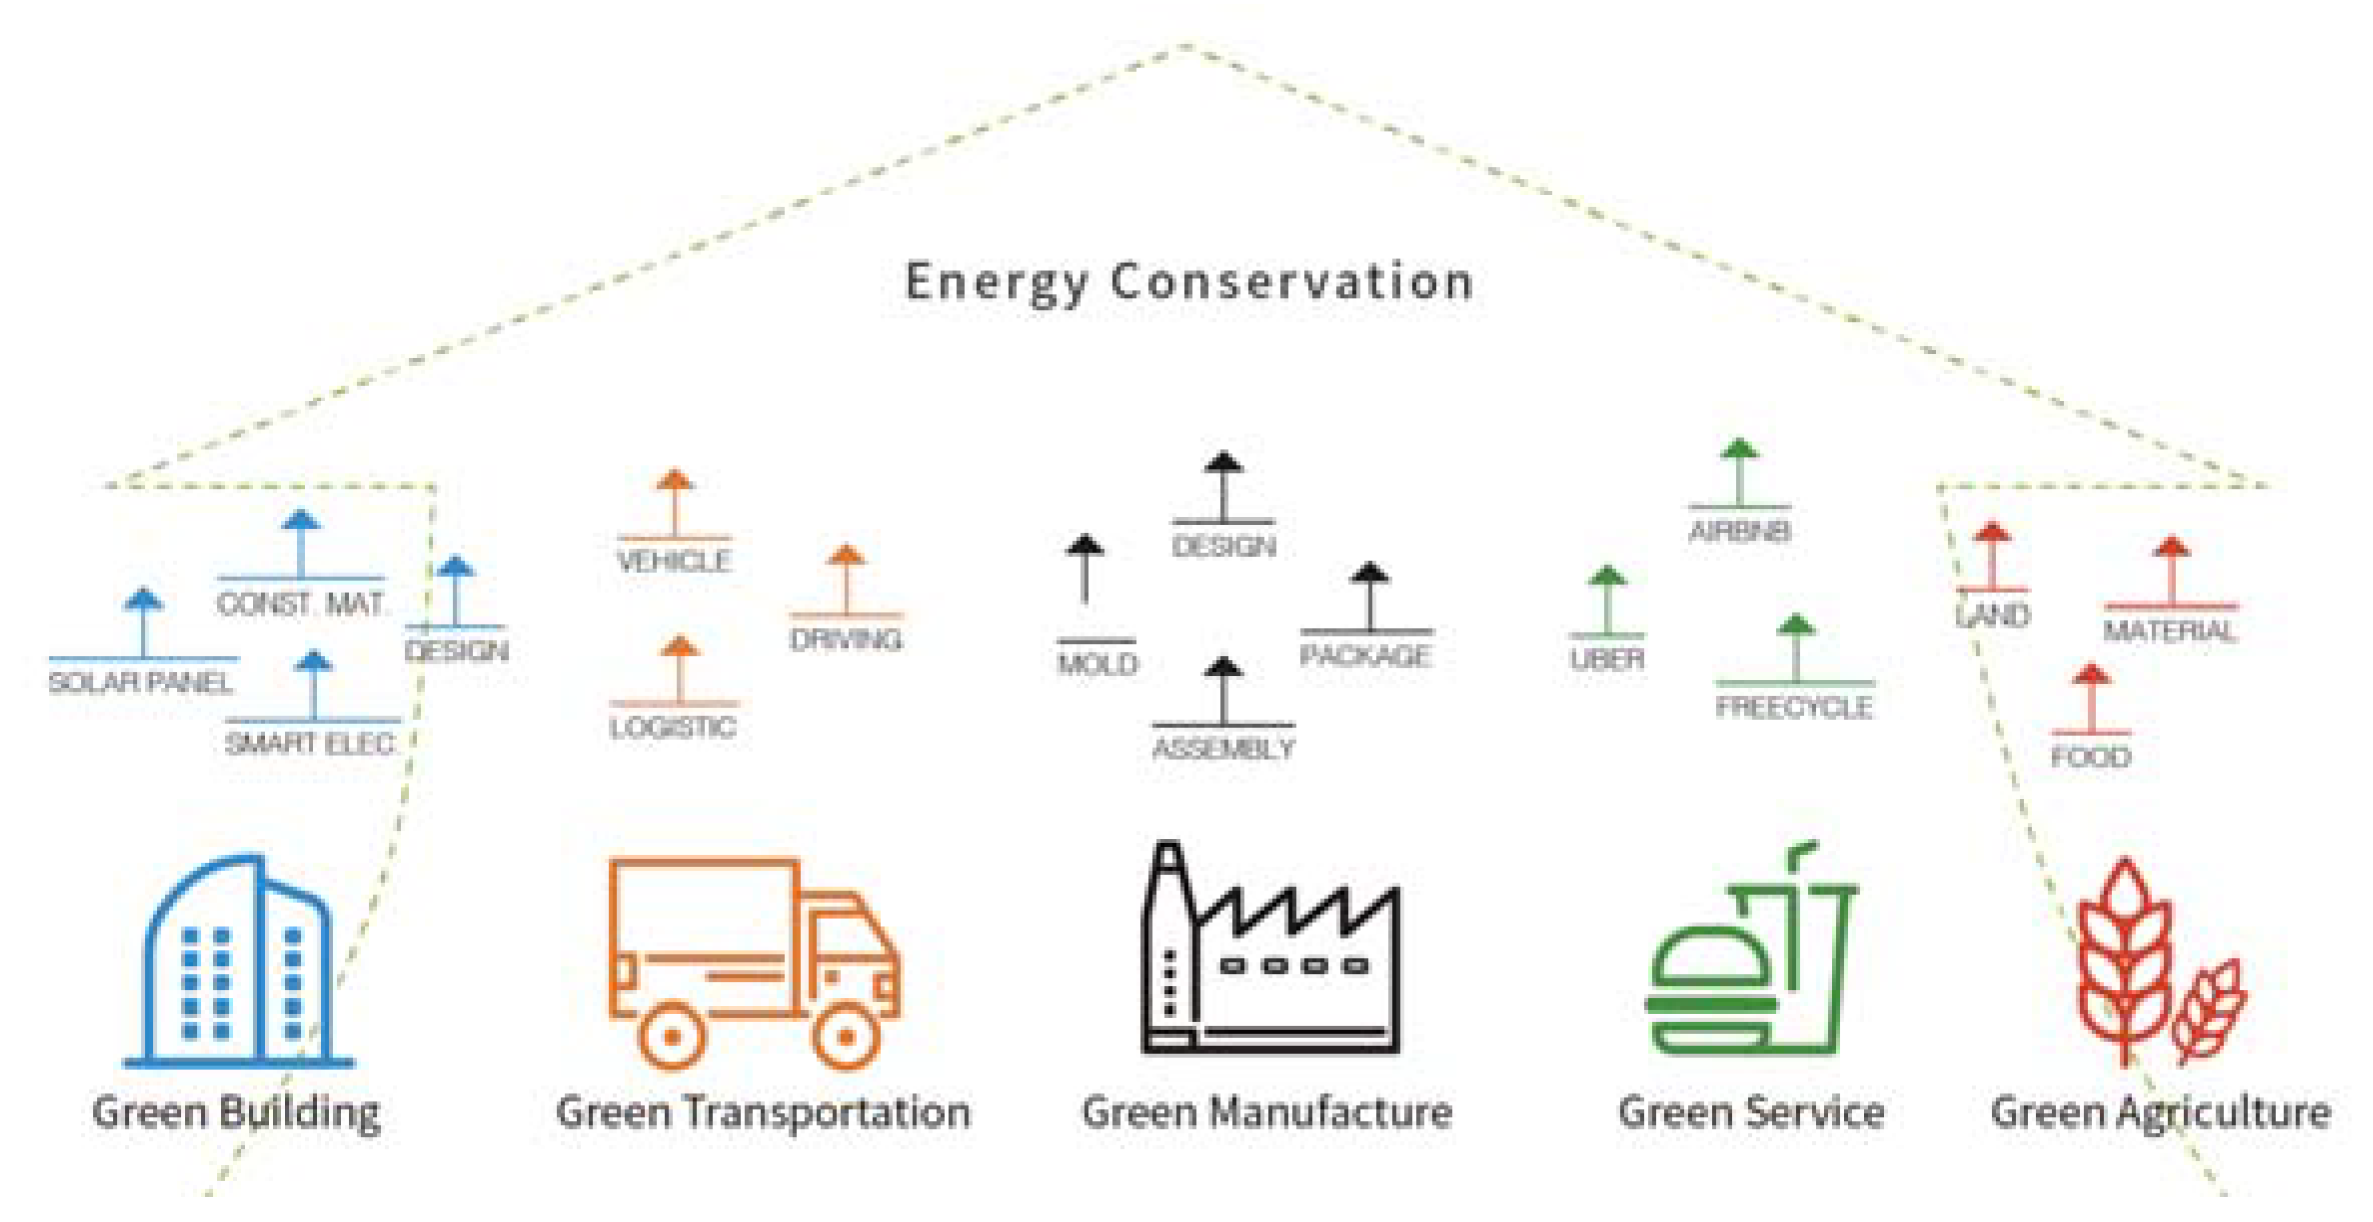
Figure 1. The impact of green design on energy transition in various fields.
Sustainability 15 02948 g001
Figure 2. The structure of GDI.
Sustainability 15 02948 g002
Figure 3. The weights of GDI factors.
Sustainability 15 02948 g003
Figure 4. Regional development trend of green design in China (2006–2015).
Sustainability 15 02948 g004
Figure 5. Kernel density evolution of GDI in China.
Sustainability 15 02948 g005
Table 1. The weights of different components in GDI.
Vision LevelRealization LevelWeights
EnableGreen technology0.139
Green education0.068
Green policy0.063
Green organization0.049
SustainableNatural environment0.045
Artificial environment0.045
Environment governance0.022
RecycleEnergy recycle0.067
Material recycle0.082
Water recycle0.048
ReduceReduce the consumption of industrial manufacture0.075
Reduce the consumption of building0.043
Reduce the consumption of transportation.0.094
ReuseReuse building material0.035
Reuse industrial material0.078
Reuse living material0.048
Table 2. Summary of China’s regional GDI.
YearN *MinimumMaximumMeanNGDIn < Mean
2006300.67 (Gansu)6.66 (Beijing)1.5923
2007300.79 (Gansu)7.53 (Beijing)1.8323
2008300.95 (Guizhou)9.20 (Beijing)2.2722
2009301.11 (Gansu)10.14 (Beijing)2.6522
2010301.36 (Gansu)10.34 (Beijing)2.9621
2011301.57 (Guizhou)11.43 (Beijing)3.6321
2012301.76 (Qinghai)14.51 (Beijing)4.2621
2013301.92 (Qinghai)15.48 (Beijing)4.8019
2014302.00 (Qinghai)16.10 (Beijing)4.8522
2015302.29 (Shanxi)17.54 (Beijing)5.6620
* Note: “N” refers to the number of observation and “NGDIn < Mean” refers to the number of region whose GDI values are less than the mean value.
Disclaimer/Publisher’s Note: The statements, opinions and data contained in all publications are solely those of the individual author(s) and contributor(s) and not of MDPI and/or the editor(s). MDPI and/or the editor(s) disclaim responsibility for any injury to people or property resulting from any ideas, methods, instructions or products referred to in the content.