Abstract
Globally, most higher educational institutions can no longer house their students within their campuses due to the increased number of enrolments and the unavailability of land for spatial expansion, especially in urban areas. This leads to studentification which negatively impacts university towns. Developing resilience against the negative impacts of studentification will make university towns more sustainable. However, there is no existing community resilience index designed for that purpose. Thus, this study develops a composite resilience index for university towns, using Akoka, a university town in Lagos, Nigeria, as a case study. The composites of the index were determined by prioritizing online user-generated content mined from Twitter between 1 January 2010 and 31 December 2021 using artificial intelligence, while the elements of resilience and risk reduction were developed through the Delphi and analytic hierarchy process. The research outcomes showed that the physical, economic, social, and cultural criteria subjected to comparisons represented ≥70% of the total weights. These criteria made up the outcome indicators, while the integrated community-based risk reduction program model was adopted for the process indicators. Both outcome and process indicators formed the localized composite resilience index for Akoka, Lagos, Nigeria. This proposed composite resilience index would help the town to assess and build resilience against the negative impacts of studentification and provide a methodology for other university towns to create theirs using similar methods.
1. Background
1.1. Introduction
As the world experiences geometric growth in population and youth bulge in the 21st century, radical changes have to be made to higher education funding in most countries to meet the increasing demand for university education [1]. In most countries such as the United Kingdom and the United States, these changes have also led to a shift in the funding of most higher educational institutions (HEIs) away from the state, which increased the marketization of higher education [2,3]. According to Brooks, Byford and Sela [2], the United Kingdom’s commercialization of higher education has changed the narratives. Students now “see degrees as private investments rather than public good”. To obtain the best “investment”, students now travel far away from home in search of “quality” when making their higher education choices. Related to this, Kinton, Smith, Harrison, and Culora [1] emphasized that global competition among HEIs for student “customers” have made universities more responsive, increased their teaching quality and focus on providing more conducive learning environments. For students, framing “students-as-consumers” clearly extends beyond selecting universities and courses, to other aspects of university life, such as residential decision making, cost of living, and students’ lifestyle. As a result of the above, there has been a growing global debate on the changing trends of student geographies. Housing developments are changing from traditional living pathways (on-campus accommodation) to off-campus shared housing with multiple occupancies (HMOs) and purpose built students accommodation (PBSA) enclaves, which gradually change the morphology of university towns and affect their sustainability [1,4,5]. These changes are known in the literature as studentification.
Broadly, studentification refers to the processes of community change and the challenges university towns face because of the growing students’ concentration off-campus due to the inability of universities to house all their students within their campuses [4,6,7,8]. These community changes often have five major dimensions, which include social, cultural, physical (environmental), economic, and institution and governance [9,10]. Situmorang et al. [11] posited that socially, studentification leads to structural gentrification and segregation. Culturally, the social clusters or concentrations of youths with shared students’ culture, lifestyle, and consumption practices lead to the introduction of new sub-cultures in the area. Physically, the environment may either be upgraded to cater to the new teaming customers (especially in retail and service infrastructure) or downgraded to a slum over time. In addition, economically, housing stock changes carried out to accommodate the students’ population often lead to higher densities, and inflation of property and rental prices. Local businesses also change their models over time to satisfy the needs of the students. With such rapid new complexities in the university towns, governance issues gradually manifest.
Studentification occurs globally in university towns due to several imperatives, which often include the following: the growth of the knowledge-based economy and the need for a more skilled global workforce [12,13], funding and expansion of HEIs [13], increased mortgage financing, low-interest rates and economic capital [14], deregulation in the real estate sector and the encouragement of the private sector to meet the housing deficit in some global economies [15], lack of adequate statutory enforcement of planning laws and the power to regulate free-market economies [16], and finally, the shift in global ideologies in the transition from childhood to adulthood and the assumption of the right to attain a college or university degree [17].
Although studentification is often portrayed as a negative phenomenon both in the media and in the literature, the town–gown relationship is not all parasitic. Some of the benefits of studentification to the university towns and their residents include the following: the provision of a young and educated workforce, cheaper labor and increased volunteerism [18], bringing diversity and vibrancy to local cultures and raising the aspirations of the local youths [19], enhancing the spending power, improving the local economy, creating more jobs and sustaining the local retail businesses [20], supporting the local real estate sector and its associated trades (agency, insurance, finance etc.), driving up demands for quality housing provision [16], as well as making the town more attractive to tourists and investors [21]. However, shreds of evidence from earlier studies show that the negative impacts of studentification over the years outweigh the benefits [22,23,24].
To make university towns sustainable, resilience must be improved. To perform this, the communities within them should be able to identify their challenges and vulnerabilities and build local capacity to withstand the chronic stresses and shocks induced by studentification. Resilient communities suffer less from the negative impacts of studentification and can build sustainability easily through absorption of the stresses (through resistance or adaptation), and still be able to maintain their functions [25]. Review of extant studentification literature show that there are no studies looking at the negative impacts of studentification from the community resilience perspective or developing a composite resilience index (CRI) for university towns using user-generated content (textual big data) to deal with the challenges of studentification [26]. Therefore, the aim of this study is to demonstrate how a localized CRI for university towns can be developed using user-generated content. The objectives include helping university towns to identify and analyze the elements of a resilient university town and the risk reduction elements proposed by the town’s residents and visitors, using user-generated content from Twitter (textual big data), the Delphi method, and analytical hierarchy process (AHP) modeling.
To perform this, this study adopted Akoka, a university town in Lagos, Nigeria, as a case study. Akoka is home to the university and college with the highest students enrolments in Nigeria. Both HEIs house less than 20% of their students within campus, making Akoka the most studentified university town in Nigeria. The proposed CRI would help Akoka to become resilient, generally contribute to reducing bias in assessing the level of resilience against studentification, provide a methodology for other university towns to develop their own CRI, and contribute to the resilience body of knowledge.
1.2. Studentification in Akoka, Lagos, Nigeria
Akoka is located at 6°31′40.9″ N and 3°23′34.4″ E. Figure 1 shows the location of Akoka within Nigeria. Akoka is the home to the University of Lagos and the Federal College of Education in Lagos, Nigeria. The university town has drastically changed over the years to cater for the needs of the HEIs located within it and others. In return, these HEIs have taken over the identity of the town, especially the University of Lagos. Efforts by the HEIs to make the town more liveable have been ongoing for decades. This includes co-policing, infrastructure upgrades, and community integration through open-campus policies, amongst others. However, more efforts need to be put in place to identify the increasing community challenges and systematically solve them through a holistic and participatory community engagement. This can be performed through traditional community consultations or using new innovative and resource-efficient tools that make the processes faster and cheaper for iteration of the process.
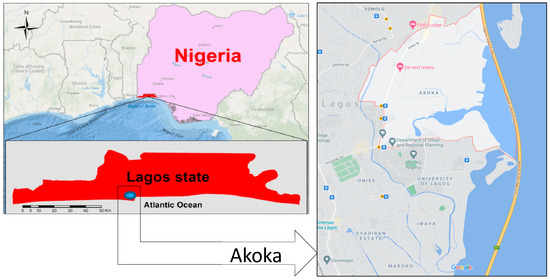
Figure 1.
Map of Nigeria showing Lagos and Akoka.
With recent innovations in big data mining and pre-processing through artificial intelligence, identifying community challenges due to studentification has become easier and more accurate [27]. Building on previous works in the area of textual data mining (user-generated contents) from microblogs, machine learning (ML) and natural language processing (NLP) methods for longitudinal studies by Alharbi et al. [28], Asghar et al. [29], Khan et al. [30], Jansen et al. [31], Abumalloh et al. [32], Carlos et al. [33], Shah et al. [34], Nilashi et al. [35], Sun et al. [36], Ahani et al. [37], and Ahani et al. [38], and Abdul-Rahman, Chan, Wong, Irekponor, and Abdul-Rahman [27] developed a comprehensive mining and pre-processing framework with algorithms that can accurately identify community challenges for the urban planning sector. Since this framework is recent and has a high accuracy level, there is no need to duplicate the effort here. Abdul-Rahman [39] used the framework to mine textual big data from six university towns, including Akoka, from 1 January 2010 to 31 December 2020 (10 years). This data, in its pre-processed form, are available online in a repository via Abdul-Rahman [39] and also Abdul-Rahman et al. [40]. These contain 935,822 user-generated contents (Tweets). These tweets were from 935,822 Twitter users comprising of residents and visitors to Akoka. The residents include students and non-student residents, property owners, agents, business owners who operate in the town, HEIs management, and students, markets, and residents’ associations official twitter handles. The algorithm also mined data from twitter users who visited Akoka and complained about anything related to studentification. Some of these visitors include former residents in the town. The data mining, pre-processing, topic modeling and sentiments analysis procedures and algorithms are published in Abdul-Rahman, Adegoriola, McWilson, Soyinka and Adenle [40] so there is no need to repeat them here. The data extracted for this study are presented here in Table 1.

Table 1.
Twitter Data Analytics (Result from Topic Modeling and Sentiment Analysis of 935,822 Tweets extracted from Abdul-Rahman, Adegoriola, McWilson, Soyinka and Adenle [40], pg. 23).
The data show 35 major community resilience challenges the town faces as a result of studentification and the ranking of those community challenges by the residents and visitors based on the 10 years of big data. In Table 1, the negative tweets (negTweets) represent displeasure, the neutral tweets (neuTweets) mean the residents are indifferent about the situation, while the positive tweets (posTweets) mostly contain the residents and visitors’ views on how to fix the community challenges (negative tweets). This study explored the positive tweets to draw out criteria and elements of a resilient community and elements of risk reduction needed to develop the CRI for Akoka, instead of using a questionnaire survey to obtain small data on the challenges faced as a result of studentification in Akoka and the perceived solutions by the residents and visitors. With this method, 935,822 opinions were sampled to draw a list of community challenges and potential solutions for expert modeling using Delphi method and AHP. While AHP helps to fix complex problems involving multiple criteria and actors (Satty, 1980), Delphi helps the many actors (or experts) to systematically reach a consensus [41,42,43]. Both methods are well used in the resilience domain [44,45].
Generally, community resilience challenges vary from one university town to the other. Therefore, every CRI needs to be localized based on the specific challenges affecting the university town and the local solutions that work in such a place [25,46].
1.3. Developing a Localized Composite Resilience Index Based on Delphi and Analytical Hierarchy Process
Theoretically and conceptually, we adopted the definition of resilience steaming from the ecological resilience concepts [47,48,49]. This frames community resilience as the ability of the community to withstand or adapt to shocks or stresses, reorganize itself, undergo some structural changes and still be able to maintain its function and identity [50]. Community resilience is often seen as a step closer to risk reduction and sustainability. However, building community resilience remains a challenge despite the numerous theoretical underpinnings over the years due to the complex nature of human communities (as adaptive ecological systems), especially when they are processes and outcomes from the ecological and social perspective [51,52]. To date, only a few studies within the community resilience literature (e.g., Sherrieb, Norris and Galea [46], Cutter et al. [53]) provide suggestions on how the ecological resilience concept can be quantified and used to build community resilience at the local level.
This study proposed a novel approach to develop a CRI for Akoka by synthesizing residents and visitors’ views on building community resilience into elements of resilient community and risk reduction elements using Delphi technique and AHP. Delphi technique is generally used to assess the variables that are intangibles or covered in uncertainty by extricating on the knowledge and experience of a diverse group of experts through a method of anonymous and iterative consultation [54]. This method is well-suited for consensus-building through the use of a series of questionnaire delivered using multiple iteration process to collect data from the panel of selected experts [55]. The data collected from this panel of experts is often complicated and unstructured. Therefore, another multi-criterial decision-making method such as AHP is needed to integrate the subjective and objective perceptions of the experts and harmonize the criteria and the alternative elements into a hierarchical structure [56]. These two methods are commonly used together because they complement each other in a non-fuzzy environment [57]. A common practice in the literature is to use Delphi technique in the preliminary stage of the research to shortlist and identify the more prominent variables and use AHP subsequently to determine the weightage of the selected variables and develop the decision-making model required [58,59,60,61,62]. However, in situations where the criteria and alternative elements are not clear, multi-criteria decision-making tools based on fuzzy logic can be adopted [63].
In the community resilience and education nexus, this method has been used to develop indices for the management of coastlines [64], for solving urban decay [65], for disaster resilience, risk reduction and management [44,45], and management of cooperative education [66]. Delphi and AHP were used in this study to prioritize the criteria and elements that best describe a resilient Akoka community from the user-generated contents (Twitter location-based historic big data) containing potential criteria and elements of a resilient community and elements of risk reduction. A framework was designed (Figure 2) and used to determine the outcome indicators of the CRI for resilience against the negative impacts of studentification in Akoka. The use of social media big data to mine the opinions of residents and visitors to the university town as well as using selected members of the town and experts from the HEIs to develop an index using Delphi technique and AHP is the first of its kind in Nigeria and the studentification corpus.
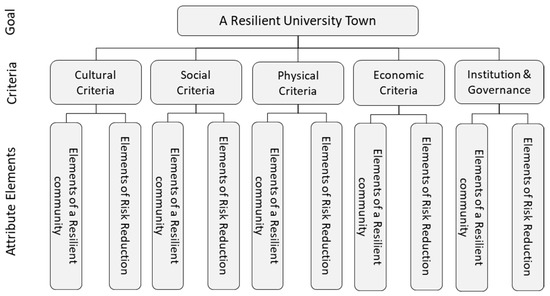
Figure 2.
The AHP model used for prioritization.
2. Materials and Methods
A hierarchical framework was proposed with three tiers representing components that best describe a resilient university town in an AHP model (Figure 2). The first tier represents the overall goal of the university town or the aim the CRI was designed to achieve (a resilient university town). The second tier contains the criteria determined based on the five community resilience dimensions [9,10]. These include cultural criteria (CC), social criteria (SC), physical criteria (PC), economic criteria (EC), and institution and governance criteria (IGC). The third and last tier contains attributes elements under each of the criterion in the second tier. These attribute elements include elements of a resilient community (ERC) and elements of risk reduction (ERR). Table 2 contains the attribute elements under each criterion. The opposites of the 35 community challenges form the ERC, while the ERR were extracted from the positive using latent Dirichlet allocation (LDA) [27,67]. This could be conducted manually using the search tool in Excel since the textual data is saved in .csv but we chose to use LDA. Jelodar, Wang, Yuan, Feng, Jiang, Li, and Zhao [67] provide good information on how to use LDA so there is no need to repeat that here. According to Saaty [68], the maximum number of ERC and ERR can only be seven. Therefore, the decision-makers were asked to validate and reduce the number of ERC and ERR to a maximum of seven components in the first round of survey.
Table 2.
Components of a resilient university town based on residents and visitors’ aspiration for Akoka and experts’ prioritization.
2.1. The Decision-Makers
The twenty-three decision-makers comprised seventeen resilience and sustainability experts from the two HEIs in Akoka, two senior management officers in charge of students’ affairs in the two HEIs, one town planner in the local government office and three local community leaders. The studentification phenomenon was easier for them to understand because of its huge impacts on the local communities within the university town and their knowledge and experiences. Delphi method was used for the prioritization process [69,70,71].
2.2. Weights of Alternative Criteria and Elements in the AHP Model
The weights of alternative criteria and elements for achieving a resilient university town were calculated in a consistent matrix using paired comparison and ratio-scale. The formula is:
where n = number of alternatives or size of the matrix (a1, a2, a3….an). see Saaty [68] and Vargas [72].
This study, therefore, had 10 comparisons involving 5 alternative criteria each with 3 to 21 comparisons of alternative elements. The products of the paired comparisons represent the judgments of the decision-makers over another pair based on a pair-wise rating scale (Table 3) with values ranging from 1–9 [72,73,74]. In cases where decision-makers decide that both alternatives i and j are equally important, the comparison formula becomes aij = aji = 1. However, when alternative i is considered to be extremely important compared to j, then aij = 9 and aji–1/9. The distribution of these score in a square matrix gave us the reciprocal matric in Equation (2) [75].
where A = [aij] represents the intensity of decision-makers preferences for one alternative over another aij and for all compared alternatives ij = 1, 2, 3, 4,…n. The comparison was conducted over three rounds until there was stability in the sum of scores. To generate good approximations for the elements’ weights for each alternative, comparison scores of the alternative criteria and elements were multiplied in each row of the reciprocal matrix, and taking the nth root of the products as follows:
Table 3.
The rating scale for pair-wise comparison.
The summations of weights in a column were used to calculate the normalized eigenvector wij for each alternative as shown below:
When wij was multiplied by matrix A or by the maximum eigenvalue , a new priority eigenvector nwij was formed [76].
The significance of the criteria and elements in achieving a resilient university town was determined by a high nwij value for each criterion and element. This is the sum of the products of the normalized wij in each column and the elements in each row as seen in Equation (5).
Since this is a consistent matrix, the values of nwij for each criterion and element represent the weights.
2.3. Building Consensus on the Criteria and Elements
The final scores were determined using the Delphi technique which helps multiple experts to arrive at a consensus in a systematic manner [41,42,43]. The scores of the paired comparisons for all the criteria and elements were calculated based on their geometric means. All scores were entered into the matrix once a consensus was met. Both nwij values and the consensus scores were accepted once they meet a certain degree of consistency determined by the consistency index (CI) (Equation (6) below).
where is the maximum eigenvalue calculated by taking the average of all eigenvalues and n represents the number of criteria and elements listed for prioritization. The eigenvalues are individually calculated using Equation (7) below.
The CI was then compared to the consistency random index (RI) of the paired comparisons in the matrix to generate the consistency ratio (CR) presented in Table 4, using Equation (8). The CR is used to determine the acceptability of the scores and weights of the criteria and elements. A decision-maker’s judgment or prioritization was accepted to be valid if the CR score or weight is ≤0.10 [72,75].
Table 4.
Random index of consistency for n = 10 [68,73,76].
The criteria and elements were selected using a top-down approach. This entails the selection of alternative elements for achieving a resilient university town and subjecting them to comparison once their criteria are prioritized by the decision-makers. New nwij values with consistency ratios ≤ 0.10 (now assigned as respective weights) are used for ranking both the criteria and elements within the AHP model.
Within the AHP model, an analytical process was used to adopt criteria and elements with ≥70 per cent representation within the second and third tier of the model. This percentage was introduced to provide an optimal number of components in each hierarchy and to reduce the criteria and elements to only those with high importance for the achievement of the overall community goal in tier one. Criteria and elements below this benchmark were discarded. The percentage represents the sum of the ratio of individual criteria and elements weights and the overall weight, as expressed in the equation:
3. Results
The matrix at the second tier of the AHP model (criteria for building a resilient community) was consistent with a CR value of 0.07 (Table 5). From the computed weights, “PC” and “IGC” ranked the highest and lowest, respectively. The top-ranked criteria; “PC”, “EC”, “SC”, and “CC” were picked based on the sum of their weights which represented 92% of the total weights in tier two of the AHP model. The alternative elements of these four criteria were further subjected to prioritization and selection. Elements of a resilient community; PCERC1, PCERC3, PCERC4, PCERC6, and PCERC7 and elements for risk reduction; PCERR5, PCERR6, PCERR1, PCERR3, and PCERR7 make up 90% and 81%, respectively, of the physical criteria (PC) for achieving a resilient university town. Both groups of elements have CR scores of 0.03 and 0.10 (Table 6).
Table 5.
Ranking the criteria for a resilient university town using weights (priority vector values nwij).
Table 6.
Ranks and weights of the elements that make up the selected criteria for a resilient university town.
Prioritizations were further conducted for EC, SC, and CC as shown in Table 6. For EC, elements of a resilient community; ECERC3, ECERC1, and ECERC4 and elements for risk reduction ECERR1, ECERR2, and ECERR3 represented 81% and 99% of the total elements, respectively. Both groups also have 0.07 and 0.09 CR scores.
For SC, the elements SCERC1, SCERC3, SCERC6, SCERC2, and SCERC4 were selected as elements of a resilient community, while SCERR1, SCERR3, and SCERR5 were selected as elements of risk reduction (Table 6). Both groups of elements accounted for 88% and 74% and have 0.07 and 0.02 CR scores, respectively. Finally, the elements of a resilient community CCERC1, CCERC3, CCERC5, and CCERC6, and risk reduction elements CCERR1, CCERR5, CCERR4, and CCERR6 (Table 6) accounted for 83% and 80%, respectively, of all attributes within the physical criteria for achieving a resilient university town. Both groups of elements have CR scores of 0.07 and 0.08, respectively.
4. Discussion
4.1. Harmonizing the Criteria and Alternative Elements in an AHP Model Using a Delphi Technique
The Delphi technique was used to obtain the consensus on the scores of paired comparisons within the AHP model. The multi-stakeholder decision-making process was fully harmonized after three rounds with the help of a strong facilitator. The decision-makers were of various educational backgrounds with varying experiences and knowledge of both the university town and the resilience domain, so a facilitator was needed to expound and organize the opinions of the decision-makers until consensus was met on all criteria and alternative elements [77].
Following the work of Yu et al. [78], a rating scale for the pair-wise comparison was adopted for easy scoring (Table 2). This made it easier for the decision-makers to assign quantitative measurements to the qualitative data (alternatives). Since the paired comparisons were in a consistent matrix, alternatives placed diagonally across from each other (Equation (2)) were scored using the rule of thumb [79]. This means when a prioritization favors the alternative on the left-hand side, an absolute score was given (1–9), but when the alternative on the right-hand side is prioritized, a reciprocal score was assigned (1/2–1/9) [80].
4.2. The Prioritized Criteria and Elements for a Resilient Akoka Town
Although the four major criteria for achieving a resilient university town are similar to the five core dimensions of resilience [9,10,81], their importance was never investigated, measured or ranked for achieving resilience in any university town or community against the negative impacts of studentification.
The PC was the most important criterion for describing a resilient Akoka. This is because the impacts of studentification on the environment are usually the highest in most university towns around the world [1,22]. The decision-makers came to a consensus defining a resilient Akoka town to be one in which the conversion of family homes to HMOs is prohibited. Hubbard [15] posited that this will reduce the competition for residential housing, control the increase in rental prices, and reduce the gentrification of non-students’ residents (PCERC1). Other elements that represent a resilient Akoka town include reduced environmental pollution (noise from students clusters and talking loudly on the streets, playing loud music from their car stereos and homes, defacing the environment with graffiti and posters as well as indiscriminate waste disposal) (PCERC6), constantly upgrading the run-down areas of the town (buildings, roads, and infrastructure) to reduce the broken-window effect in the town [82] (PCERC3), functional mass transport system to reduce traffic congestions during rush hours (PCERC4), and reduced congestions and overcrowding in public spaces and commercial areas such as shops and markets.
To reduce the physical (environmental) risks imposed by studentification in Akoka, the decision-makers proposed reduction in noise in students clusters (off-campus halls) (PCERR5), improving the waste management system within the town and continuously enlightening the residents on recycling and other best practices (PCERR6), enforcements of existing planning laws that prohibit the illegal conversion of land-uses and family homes to HMOs without proper permits (PCERR1), increasing and upgrading the carrying capacities of existing urban basic services and shopping facilities within the town (PCERR3) and improving the traffic management systems, introducing more mass transit buses, and working with HEI to schedule their closing hours so that not all students resume lectures same time in the morning and all of them end their lectures at the same time in the afternoon or evening (PCERR7).
The EC was the second most important criterion prioritized by the decision-makers. This is because studentification often leads to a higher population density and competition for scarce resources [15,83,84]. Prioritized elements that define a resilient Akoka town include affordable cost of living (ECERC3), regulated rental prices within the town (ECERC1), and controlled informal sector activities such as selling alcohol to underage students or commercial activities by the walkways that cause human traffic (ECERC4). The decision-makers also proposed the introduction of a rental and price (goods and services) control mechanism in the town to regulate inflation due to high demand and check the artificial manipulation of the market (ECERR1), creating an enabling environment for real estate investors and giving them incentives to develop more affordable housing in places that are less congested within the town (ECERR2) and setting up a task force to control and regulate the activities of the informal traders within the town (ECERR3), as the risk reduction elements to eliminate the studentification-induced economic shocks and stresses in Akoka.
Studentification also affects the socio-cultural fabric of the communities within the university towns, especially those with a high concentration of undergraduate students’ population [6,85,86]. To be resilient against the social and cultural negative impacts of studentification in Akoka, the decision-makers chose SC and CC as the third and fourth criteria to make Akoka resilient. Under the SC, prioritized elements for a resilient town include orderliness and good social behavior (SCERC1), a drug-free town with regulated alcohol consumption to reduce alcohol abuse (SCERC3), regulated night-time entertainment ventures to reduce night-time noise and insecurities (SCERC6), well managed and secure students clusters including purpose-built students accommodation quarters (SCERC2), and a zero-tolerance for prostitution on and off-campus which is common within university towns in Nigeria (SCERC4). To reduce social risks and promote resilience in Akoka, the decision-makers proposed the enactments of strict laws to curb social disorder (including gangsterism and cultism) (SCERR1), a crackdown on drug peddlers and users, enacting a law prohibiting the sale of alcohol to persons under 18 years of age (SCERR3), and increasing the number of purpose-built students’ accommodation in the town to reduce the pressure on family homes and to cluster the students in specific areas for easy management (SCERR5).
Culturally, the decision-makers also envisioned a resilient Akoka with a low crime rate and respect for law and order (CCERC1), place attachment and consideration for all (CCERC3), community cohesion between students and non-student residents (CCERC5) and a place with great tolerance for tribal, cultural, racial, and religious diversity (CCERC6). To achieve the CC envisioned, the decision-makers prioritized effective community co-policing (CCERR1), integrating the students into the local communities through events (CCERR4), improving the social capital within the communities (CCERR5), and preaching the gains of cultural and religious diversity within the town (CCERR6).
4.3. Framing the Index and Matrices
A framework (Figure 3) was developed for the OI of the CRI using the important criteria and their associated elements in Section 4.2. The OI serves as a tool to evaluate and build the resilience of the university town. However, viewing resilience based on its outcomes alone creates limitations [51]. These include limitations in terms of human involvement and limitations in decentralizing the process of developing community resilience. To overcome these limitations, PI were added to the overall CRI [87]. Since the AHP model only provides the OI (Figure 4), the PI components were adopted from the ICBRR model. The ICBRR model (Figure 5), developed and used by the Canadian and Indonesian Red Cross Society [88,89] contains 10 key steps (processes) for implementing the ERR in the proposed AHP model which makes up the OI. As a result, the proposed CRI (Figure 6) for building a resilient and sustainable university town was developed based on the four criteria and their elements from the AHP model (OI) and the PI that contains the implementation processes.
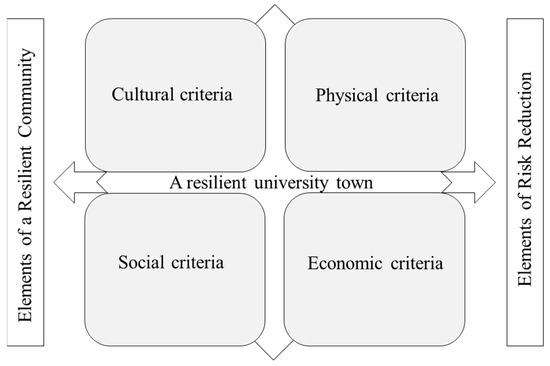
Figure 3.
The Analytic Hierarchy Process framework for the Outcome Indicator.
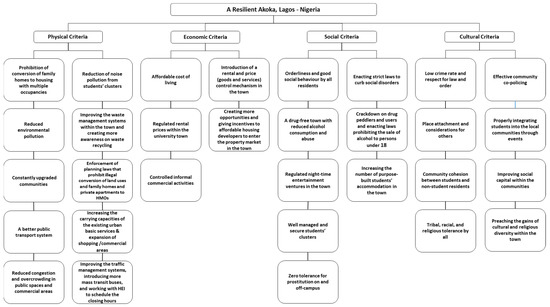
Figure 4.
The output indictors from the AHP model.
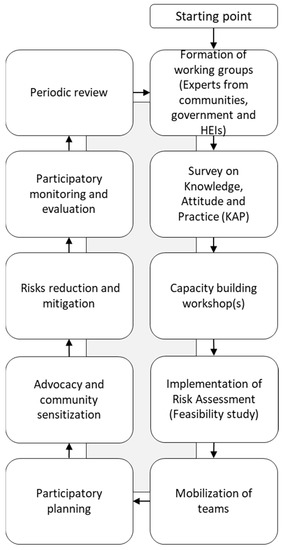
Figure 5.
Process indicators adapted from ICBRR [88,89].
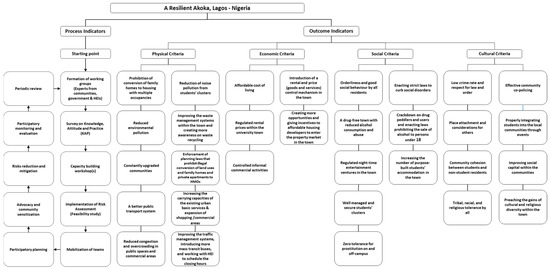
Figure 6.
A Composite Resilience Index (CRI) for Akoka, Lagos, Nigeria.
Literature reviews conducted by de FSM Russo and Camanho [90] on AHP showed that most indices developed using AHP stop after identifying the OP. Manyena [51] identified this shortcoming within the resilience literature but the research gap still remains. The practice generally, is to leave the implementation strategies for the management team to decide. This does not provide a holistic solution and gives room for bias [88,89].
4.4. Proposed Weighted Linear Combination Measurement for the Index
The CRI metrics followed a weighted linear combination (WLC) process for both the OI and PI [91]. The OI were given weights based on the intensification of the indicator scores taken from nwij values which determined the elements’ ranks in the AHP model. The linear scaling method [91] was used as shown in Equation (10).
where Wn is the criterion or element’s normalized weight. Wact is the original weight, and Wmin and Wmax are the minimum and maximum weights within the group.
While computing the matric for the four criteria and their elements, ECERR3 was not selected because its normalized weight was zero [92]. This left the economic criteria with only two risk reduction elements (ECERR1 and ECERR2). Table 7 shows the WLC outputs for all the selected criteria and elements.
Table 7.
Ranking Scale for the indicators.
The OI was calculated based on the element scores (ES) and ES were computed based on the attainment of a level of agreement among the decision-makers. On the scale used to attain the level of agreement, level five was the highest and one was the lowest. This scale was modified with adaptations from Twigg [25] for ranking indicators and measuring the progress of the CRI implementation. An additional level with a zero score was added to imply the non-existence of disaster risk reduction element(s) in the town or zero progress [93] (see Table 8).
Table 8.
Selected and normalized criteria and elements for a resilient Akoka.
All ES within each criterion were summed up to obtain the criteria score (CS) using Equation (11) [94].
where ERR represents elements of a resilient community and ERR represent elements of risk reduction. Wi represents the weights of all elements i, and ESj represent elements scores j. All the CS were combined to give the outcome indicator score (OIS) [95] as expressed by Equation (12).
where C represent criteria, Wi represents the weights of all elements i, and CSj represent the scores of each criterion j.
Similarly, the process indicator score (PIS) was calculated using Equation (12).
where P represents the process indicators based on the ICBRR model, Wi represents the weights of all elements i, and Rj represents ranks or value of the process indicator j.
The rating of both indicators (OI and PI) is based on the scale in Table 8. Since both indicators have Wi whose sum is 1, the Wi for each PI is 0.10.
The overall composite resilience index score (CRIS) [96] is the combination of both OIS and PIS as shown in Equation (14).
where OIS and PIS are the outcome and process indicator scores, and Wi represents the weights of the outcome and process indicators i.
4.5. Limitations of the Index and Future Research Directions
The CRI is made up of both outcome and process indicators developed through an analytic hierarchy process. Adopting Tsai, Lee, Lee, Chen, and Liu [54] and Liu and Zhang [97] methodology, the CRI was also designed to assess the level of attainment of each indicator. This helps during the periodic review of the implementation of the CRI in the town and allows fewer performing elements to be adjusted or upscaled [98]. The outcome indicators were developed from the mined opinions of the town’s residents and visitors from Twitter [39] and prioritized by 23 experts (decision-makers). However, the process indicators were directly adopted from the ICBRR model [88,89]. This follows the assumption that since such indicators were developed using a similar procedure that was tested and widely used by the International Red Cross Society in both developing and developed countries including Indonesia and Canada, they are also suitable for use in Nigeria. The weights of the outcome indicators vary because they were generated from the computations in the AHP model, but the process indicators were assigned equal weights manually. This may cause some limitations to the accuracy of the measurements since the weights are used in intensifying the scores of the assessments. Although the ranking scale (Table 7) will reduce the effects of any bias as a result of the above, future research can be carried out to test this assumption. Another AHP modeling can also be conducted for the process indicators to increase the objectivity of the overall evaluation.
Lastly, the distribution of tweets across demographics cannot be determined because the metadata does not include personal identifying data due to the Twitter API restriction to protect users’ privacy. Although, we could see the diversity of the users which ranges from students, non-student residents, agents/property managers, landlords, and institutional twitter handles, among others, from the tweets and sentiment analysis, the percentages cannot be accurately determined. Future studies can fix this limitation by developing a programmatic algorithm to classify users using their tweets or metadata.
5. Conclusions
The negative impacts of studentification in university towns across the world have been well documented in the literature. Some universities around the world have also implemented policies to make their university towns resilient against the shocks and stresses brought about by studentification, especially in the United Kingdom (University of Leeds, University of Durham, University of Salford, Loughborough University, University of Nottingham, University of Manchester, University of Northumbria, University of Brighton, etc.), the United States (Clemson University, University of Illinois, Texas State University, Colorado State University, University of Maryland, Miami University, Bowling Green State University, Georgetown University, Washington University, University of Massachusetts-Amherst, University of Oregon, etc.), and Canada (University of Guelph, Bishop’s University, etc.). However, there is no known index or model specifically designed to assess and develop community resilience in any university town. This motivated the need to develop a localized CRI for university towns starting with Akoka as a case study.
Delphi and AHP were used as a multicriteria decision-making tools to prioritize and select the criteria and elements that best describe a resilient Akoka. The Delphi method was coordinated by a strong facilitator to achieve the preferences of the decision-makers in selecting the final criteria and their elements. Physical, economic, social, and cultural criteria were the four criteria selected to describe the outcome indicators for a resilient Akoka, while the ICBRR model was adopted for the process indicators. Both outcome and process indicators were combined to form the CRI. A six-level scale was then developed to rate the existence and performance of the criteria, their elements, and the overall index.
The proposed CRI is expected to contribute to the holistic measurement of community resilience in Akoka, it will help to minimize bias in assessing the level of resilience, help to develop resilience in Akoka against the negative impacts of studentification, provide a methodology for other university towns to develop their own CRI, and generally contribute to the resilience body of knowledge. This study also lays the foundation of future research combining AI and textual big data [40] and multicriteria decision-making tools to develop indices for community resilience and sustainability, beyond studentification.
Author Contributions
Conceptualization, M.A.-R.; methodology, M.A.-R. and W.A.; formal analysis and data curation, M.A.-R. and W.A.; writing—original draft preparation and writing—review and editing, M.A.-R., W.A. and S.A. All authors have read and agreed to the published version of the manuscript.
Funding
This research work was part of a larger doctoral study titled “A community Resilience Assessment Framework for University Towns” supported by a PhD studentship from the Research Institute for Sustainable Development (RISUD) and the Department of Building and Real Estate of the Hong Kong Polytechnic University [research grant: G-R006.RJET].
Informed Consent Statement
Not applicable.
Acknowledgments
The authors acknowledge Edwin H.W. Chan and Man Sing Wong’s supervision, advise and mentorship for the PhD thesis “A community Resilience Assessment Framework for University Towns” (https://theses.lib.polyu.edu.hk/handle/200/11732, accessed on 7 November 2022) which led to the development of this manuscript.
Conflicts of Interest
The authors declare no conflict of interest. The funders had no role in the design of the study; in the collection, analyses, or interpretation of data; in the writing of the manuscript; or in the decision to publish the results.
References
- Kinton, C.; Smith, D.P.; Harrison, J.; Culora, A. New frontiers of studentification: The commodification of student housing as a driver of urban change. Geogr. J. 2018, 184, 242–254. [Google Scholar] [CrossRef]
- Brooks, R.; Byford, K.; Sela, K. Students’ unions, consumerism and the neo-liberal university. Br. J. Sociol. Educ. 2016, 37, 1211–1228. [Google Scholar]
- Brooks, R. The social construction of young people within education policy: Evidence from the UK’s Coalition government. J. Youth Stud. 2013, 16, 318–333. [Google Scholar]
- Smith, D.P.; Sage, J.; Balsdon, S. The geographies of studentification: ‘Here, there and everywhere’? Geography 2014, 99, 116. [Google Scholar]
- Holton, M.; Riley, M. Talking on the move: Place-based interviewing with undergraduate students. Area 2014, 46, 59–65. [Google Scholar] [CrossRef]
- Hubbard, P. Regulating the Social Impacts of Studentification: A Loughborough Case Study. Environ. Plan. A Econ. Space 2008, 40, 323–341. [Google Scholar] [CrossRef]
- Smith, D.P.; Hubbard, P. The segregation of educated youth and dynamic geographies of studentification. Area 2014, 46, 92–100. [Google Scholar] [CrossRef]
- Sage, J.; Smith, D.; Hubbard, P. The Diverse Geographies of Studentification: Living Alongside PeopleNotLike Us. Hous. Stud. 2012, 27, 1057–1078. [Google Scholar] [CrossRef]
- Smith, D.P. Patterns and Processes of Studentification in Leeds. Reg. Rev. 2002, 11, 17–19. [Google Scholar]
- Smith, D.P. Studentification. In The Wiley Blackwell Encyclopedia of Urban and Regional Studies; John Wiley & Sons: Hoboken, NJ, USA, 2006; pp. 1–3. [Google Scholar]
- Situmorang, R.; Sudikno, A.; Surjono, S.; Wicaksono, A.D. Conceptual Framework of Studentification Impacts in Malang City, Indonesia. Int. J. Adv. Sci. 2020, 29, 585–593. [Google Scholar]
- Smith, D.P. The Politics of Studentification and ‘(Un)balanced’ Urban Populations: Lessons for Gentrification and Sustainable Communities? Urban Stud. 2008, 45, 2541–2564. [Google Scholar] [CrossRef]
- Foote, N.S. Beyond studentification in United States College Towns: Neighborhood change in the knowledge nodes, 1980–2010. Environ. Plan. A 2017, 49, 1341–1360. [Google Scholar] [CrossRef]
- Eshelby, E. Gown and Town: The Unfolding Presence of Studentification in Clarendon Park, Leicester; University of Leicester: Leicester, UK, 2015. [Google Scholar]
- Hubbard, P. Geographies of Studentification and Purpose-Built Student Accommodation: Leading Separate Lives? Environ. Plan. A Econ. Space 2009, 41, 1903–1923. [Google Scholar] [CrossRef]
- Laidley, T.M. The Privatization of College Housing: Poverty, Affordability, and the U.S. Public University. Hous. Policy Debate 2014, 24, 751–768. [Google Scholar] [CrossRef]
- Smith, D.P.; Holt, L. Studentification and ‘Apprentice’ Gentrifiers within Britain’s Provincial Towns and Cities: Extending the Meaning of Gentrification. Environ. Plan. A Econ. Space 2016, 39, 142–161. [Google Scholar] [CrossRef]
- Smith, D.P. Studentification: A Guide to Opportunities, Challenges and Practice; Universities UK: London, UK, 2006; p. 52. [Google Scholar]
- Smith, D.P.; Fox, M. Studentification Guide for North America: Delivering Hermonious Town and Gown Associations; Loughborough University: Loughborough, UK; Mount Allison University: Sackville, NB, Canada, 2019; p. 73. [Google Scholar]
- Holton, M. Adapting relationships with place: Investigating the evolving place attachment and ‘sense of place’ of UK higher education students during a period of intense transition. Geoforum 2015, 59, 21–29. [Google Scholar] [CrossRef]
- He, S. Consuming urban living in ‘villages in the city’: Studentification in Guangzhou, China. Urban Stud. 2014, 52, 2849–2873. [Google Scholar] [CrossRef]
- Dewi, S.P.; Ristianti, N.S. The Implication of Studentification to Community’s Physical and Social Economicaspects in Tembalang Higher Education Area. J. Tek. Sipil Dan Perenc. 2019, 21, 1–8. [Google Scholar] [CrossRef][Green Version]
- Hu, S.; Song, W.; Li, C.; Lu, J. School-gentrifying community in the making in China: Its formation mechanisms and socio-spatial consequences. Habitat Int. 2019, 93, 102045. [Google Scholar] [CrossRef]
- Sun, C.; Cheng, J.; Lin, A.; Peng, M. Gated university campus and its implications for socio-spatial inequality: Evidence from students’ accessibility to local public transport. Habitat Int. 2018, 80, 11–27. [Google Scholar] [CrossRef]
- Twigg, J. Characteristics of a Disaster-Resilient Community: A Guidance Note, 2nd ed.; DFID Disaster Risk Reduction NGO Interagency Group: Teddington, UK, 2009. [Google Scholar]
- Abdul-Rahman, M.; Chan, E.H.W.; Li, X.; Wong, M.S.; Xu, P. Big Data for Community Resilience Assessment: A Critical Review of Selected Global Tools. In Proceedings of the 24th International Symposium on Advancement of Construction Management and Real Estate; Springer: Singapore, 2021; pp. 1345–1361. [Google Scholar]
- Abdul-Rahman, M.; Chan, E.H.W.; Wong, M.S.; Irekponor, V.E.; Abdul-Rahman, M.O. A framework to simplify pre-processing location-based social media big data for sustainable urban planning and management. Cities 2020, 109, 102986. [Google Scholar] [CrossRef]
- Alharbi, A.N.; Alnnamlah, H.; Liyakathunisa. Classification of Customer Tweets Using Big Data Analytics. In 5th International Symposium on Data Mining Applications; Advances in Intelligent Systems and Computing; Springer: Cham, Switzerland, 2018; pp. 169–180. [Google Scholar]
- Asghar, Z.; Ali, T.; Ahmad, I.; Tharanidharan, S.; Nazar, S.K.A.; Kamal, S. Sentiment Analysis on Automobile Brands Using Twitter Data. Commun. Comput. Inf. Sci. 2019, 932, 76–85. [Google Scholar] [CrossRef]
- Khan, I.; Naqvi, S.K.; Alam, M.; Rizvi, S.N.A. A framework for twitter data analysis. Adv. Intell. Syst. Comput. 2018, 654, 297–303. [Google Scholar] [CrossRef]
- Jansen, B.J.; Zhang, M.; Sobel, K.; Chowdury, A. Twitter power: Tweets as electronic word of mouth. J. Am. Soc. Inf. Sci. Technol. 2009, 60, 2169–2188. [Google Scholar] [CrossRef]
- Abumalloh, R.A.; Ibrahim, O.; Nilashi, M. Loyalty of young female Arabic customers towards recommendation agents: A new model for B2C E-commerce. Technol. Soc. 2020, 61, 101253. [Google Scholar] [CrossRef]
- Carlos, M.A.; Nogueira, M.; Machado, R.J. Analysis of dengue outbreaks using big data analytics and social networks. In Proceedings of the 2017 4th International Conference on Systems and Informatics (ICSAI), Hangzhou, China, 11–13 November 2017; pp. 1592–1597. [Google Scholar]
- Shah, A.M.; Yan, X.; Tariq, S.; Ali, M. What patients like or dislike in physicians: Analyzing drivers of patient satisfaction and dissatisfaction using a digital topic modeling approach. Inf. Process. Manag. 2021, 58, 102516. [Google Scholar] [CrossRef]
- Nilashi, M.; Ibrahim, O.; Yadegaridehkordi, E.; Samad, S.; Akbari, E.; Alizadeh, A. Travelers decision making using online review in social network sites: A case on TripAdvisor. J. Comput. Sci. 2018, 28, 168–179. [Google Scholar] [CrossRef]
- Sun, Y.; Ma, H.; Chan, E.H.W. A Model to Measure Tourist Preference toward Scenic Spots Based on Social Media Data: A Case of Dapeng in China. Sustainability 2018, 10, 43. [Google Scholar]
- Ahani, A.; Nilashi, M.; Ibrahim, O.; Sanzogni, L.; Weaven, S. Market segmentation and travel choice prediction in Spa hotels through TripAdvisor’s online reviews. Int. J. Hosp. Manag. 2019, 80, 52–77. [Google Scholar] [CrossRef]
- Ahani, A.; Nilashi, M.; Yadegaridehkordi, E.; Sanzogni, L.; Tarik, A.R.; Knox, K.; Samad, S.; Ibrahim, O. Revealing customers’ satisfaction and preferences through online review analysis: The case of Canary Islands hotels. J. Retail. Consum. Serv. 2019, 51, 331–343. [Google Scholar] [CrossRef]
- Abdul-Rahman, M. A Community Resilience Assessment Framework for University Towns; The Hong Kong Politechnic University PolyU Electronic Thesis Library: Hongkong, China, 2022. [Google Scholar]
- Abdul-Rahman, M.; Adegoriola, M.I.; McWilson, W.K.; Soyinka, O.; Adenle, Y.A. Novel Use of Social Media Big Data and Artificial Intelligence for Community Resilience Assessment (CRA) in University Towns. Sustainability 2023, 15, 1295. [Google Scholar] [CrossRef]
- Chiu, Y.-H.; Lee, M.-S.; Wang, J.-W. Culture-led urban regeneration strategy: An evaluation of the management strategies and performance of urban regeneration stations in Taipei City. Habitat Int. 2019, 86, 1–9. [Google Scholar] [CrossRef]
- Wey, W.-M.; Huang, J.-Y. Urban sustainable transportation planning strategies for livable City’s quality of life. Habitat Int. 2018, 82, 9–27. [Google Scholar] [CrossRef]
- Yau, Y.; Chiu, S.M. Combating building illegality in Hong Kong: A policy Delphi study. Habitat Int. 2015, 49, 349–356. [Google Scholar] [CrossRef]
- Carreño, M.L.; Cardona, O.D.; Barbat, A.H. A disaster risk management performance index. Nat. Hazards 2007, 41, 1–20. [Google Scholar] [CrossRef]
- Chen, G.-h.; Tao, L.; Zhang, H.-w. Study on the methodology for evaluating urban and regional disaster carrying capacity and its application. Saf. Sci. 2009, 47, 50–58. [Google Scholar]
- Sherrieb, K.; Norris, F.H.; Galea, S. Measuring Capacities for Community Resilience. Soc. Indic. Res. 2010, 99, 227–247. [Google Scholar] [CrossRef]
- Holling, C.S. Resilience and stability of ecological systems. Annu. Rev. Ecol. Syst. 1973, 4, 1–23. [Google Scholar]
- Holling, C.S. Engineering resilience versus ecological resilience. Eng. Ecol. Constraints 1996, 31, 32. [Google Scholar]
- Holling, C.S.; Gunderson, L.H. Panarchy: Understanding Transformations in Human and Natural Systems; Island Press: Washington, DC, USA, 2002. [Google Scholar]
- Walker, B.; Gunderson, L.; Kinzig, A.; Folke, C.; Carpenter, S.; Schultz, L. A handful of heuristics and some propositions for understanding resilience in social-ecological systems. Ecol. Soc. 2006, 11, 13. [Google Scholar] [CrossRef]
- Manyena, S.B. The concept of resilience revisited. Disasters 2006, 30, 434–450. [Google Scholar]
- Adger, W.N. Social and ecological resilience: Are they related? Prog. Hum. Geogr. 2000, 24, 347–364. [Google Scholar]
- Cutter, S.L.; Barnes, L.; Berry, M.; Burton, C.; Evans, E.; Tate, E.; Webb, J. A place-based model for understanding community resilience to natural disasters. Glob. Environ. Chang. 2008, 18, 598–606. [Google Scholar]
- Tsai, H.-C.; Lee, A.-S.; Lee, H.-N.; Chen, C.-N.; Liu, Y.-C. An application of the fuzzy Delphi method and fuzzy AHP on the discussion of training indicators for the regional competition, Taiwan national skills competition, in the trade of joinery. Sustainability 2020, 12, 4290. [Google Scholar]
- Lin, C.J.; Belis, T.T.; Caesaron, D.; Jiang, B.C.; Kuo, T.C. Development of sustainability indicators for employee-activity based production process using fuzzy Delphi method. Sustainability 2020, 12, 6378. [Google Scholar] [CrossRef]
- Wang, J.C.; Huang, K.-T.; Ko, M.Y. Using the fuzzy delphi method to study the construction needs of an elementary campus and achieve sustainability. Sustainability 2019, 11, 6852. [Google Scholar]
- Arof, A.M. The application of a combined Delphi-AHP method in maritime transport research-a review. Asian Soc. Sci. 2015, 11, 73. [Google Scholar]
- Rosa Pires da Cruz, M.; Ferreira, J.J.; Garrido Azevedo, S. Key factors of seaport competitiveness based on the stakeholder perspective: An Analytic Hierarchy Process (AHP) model. Marit. Econ. Logist. 2013, 15, 416–443. [Google Scholar]
- Chung, C.-C.; Her, M.-T. Port State Control Perception of the Safe Management of Bulk Carriers. In Proceedings of the International Forum on Shipping, Ports and Airports (IFSPA) 2013: Trade, Supply Chain Activities and Transport, Hongkong, China, 3–5 June 2013. [Google Scholar]
- Lee, C.B.; Wan, J.; Shi, W.; Li, K. A cross-country study of competitiveness of the shipping industry. Transp. Policy 2014, 35, 366–376. [Google Scholar]
- Moradi, A.; Etebarian, A.; Shirvani, A.; Soltani, I. Development of a fuzzy model for Iranian marine casualties management. J. Fuzzy Set Valued Anal. 2014, 2014, 1–17. [Google Scholar] [CrossRef]
- Khan, M.R.; Alam, M.J.; Tabassum, N.; Khan, N.A. A systematic review of the Delphi–AHP method in analyzing challenges to public-sector project procurement and the supply chain: A developing country’s perspective. Sustainability 2022, 14, 14215. [Google Scholar]
- Keshavarz Ghorabaee, M.; Amiri, M.; Zavadskas, E.K.; Antucheviciene, J. A new hybrid fuzzy MCDM approach for evaluation of construction equipment with sustainability considerations. Arch. Civ. Mech. Eng. 2018, 18, 32–49. [Google Scholar] [CrossRef]
- Ryu, J.; Leschine, T.M.; Nam, J.; Chang, W.K.; Dyson, K. A resilience-based approach for comparing expert preferences across two large-scale coastal management programs. J. Environ. Manag. 2011, 92, 92–101. [Google Scholar] [CrossRef] [PubMed]
- Lee, G.K.; Chan, E.H. The analytic hierarchy process (AHP) approach for assessment of urban renewal proposals. Soc. Indic. Res. 2008, 89, 155–168. [Google Scholar]
- Wudhikarn, R. An approach to enhancing the human capital of enterprises associated with cooperative education. Int. J. Learn. Intellect. Cap. 2015, 12, 61–81. [Google Scholar] [CrossRef]
- Jelodar, H.; Wang, Y.; Yuan, C.; Feng, X.; Jiang, X.; Li, Y.; Zhao, L. Latent Dirichlet allocation (LDA) and topic modeling: Models, applications, a survey. Multimed. Tools Appl. 2019, 78, 15169–15211. [Google Scholar]
- Saaty, T.L. Fundamentals of Decision Making and Priority Theory with the Analytic Hierarchy Process; RWS Publications: Pittsburgh, PA, USA, 2000; Volume 6. [Google Scholar]
- Linstone, H.A.; Turoff, M. The Delphi Method; Addison-Wesley Reading: Boston, MA, USA, 1975. [Google Scholar]
- Skulmoski, G.J.; Hartman, F.T.; Krahn, J. The Delphi method for graduate research. J. Inf. Technol. Educ. Res. 2007, 6, 1–21. [Google Scholar]
- Chen, C.-S.; Chiu, Y.-H.; Tsai, L. Evaluating the adaptive reuse of historic buildings through multicriteria decision-making. Habitat Int. 2018, 81, 12–23. [Google Scholar] [CrossRef]
- Vargas, L. Prediction, Projection and Forecasting: Applications of the Analytic Hierarchy Process in Economics, Finance, Politics, Games and Sports; Springer: Dordrecht, The Netherlands, 1991. [Google Scholar]
- Satty, T.L. The Analytic Hierarchy Process; McGraw-Hill: New York, NY, USA, 1980. [Google Scholar]
- Dragićević, S.; Lai, T.; Balram, S. GIS-based multicriteria evaluation with multiscale analysis to characterize urban landslide susceptibility in data-scarce environments. Habitat Int. 2015, 45, 114–125. [Google Scholar] [CrossRef]
- Alonso, J.A.; Lamata, M.T. Consistency in the analytic hierarchy process: A new approach. Int. J. Uncertain. Fuzziness Knowl.-Based Syst. 2006, 14, 445–459. [Google Scholar] [CrossRef]
- Saaty, T.L. Multicriteria Decision Making: The Analytic Hierarchy Process: Planning, Priority Setting Resource Allocation; RWS Publications: Pittsburgh, PA, USA, 1990. [Google Scholar]
- Markmann, C.; Darkow, I.-L.; Von Der Gracht, H. A Delphi-based risk analysis—Identifying and assessing future challenges for supply chain security in a multi-stakeholder environment. Technol. Forecast. Soc. Chang. 2013, 80, 1815–1833. [Google Scholar]
- Yu, A.; Jia, Z.; Zhang, W.; Deng, K.; Herrera, F. A dynamic credit index system for TSMEs in China using the delphi and analytic hierarchy process (AHP) methods. Sustainability 2020, 12, 1715. [Google Scholar]
- Sneesl, R.; Jusoh, Y.Y.; Jabar, M.A.; Abdullah, S.; Bukar, U.A. Factors Affecting the Adoption of IoT-Based Smart Campus: An Investigation Using Analytical Hierarchical Process (AHP). Sustainability 2022, 14, 8359. [Google Scholar]
- Teknomo, K. Analytic Hierarchy Process Tutorial. 2006. Available online: http://people.revoledu.com/kardi/tutorial/AHP (accessed on 1 October 2022).
- Sharifi, A. A critical review of selected tools for assessing community resilience. Ecol. Indic. 2016, 69, 629–647. [Google Scholar] [CrossRef]
- Harcourt, B.E.; Ludwig, J. Broken windows: New evidence from New York City and a five-city social experiment. Univ. Chic. Law Rev. 2006, 73, 271. [Google Scholar]
- Baron, M.G.; Kaplan, S. The Impact of Studentification on the Rental housing Market. In Proceedings of the 50th Congress of the European Regional Science Association, Jönköping, Sweden, 19–23 August 2010. [Google Scholar]
- Prada, J. Understanding studentification dynamics in low-income neighbourhoods: Students as gentrifiers in Concepcion (Chile). Urban Stud. 2019, 56, 2863–2879. [Google Scholar] [CrossRef]
- Fabula, S.; Boros, L.; Kovács, Z.; Horváth, D.; Pál, V. Studentification, diversity and social cohesion in post-socialist Budapest. Hung. Geogr. Bull. 2017, 66, 157–173. [Google Scholar] [CrossRef]
- Woldoff, R.A.; Weiss, K.G. Studentification and Disorder in a College Town. City Community 2018, 17, 259–275. [Google Scholar] [CrossRef]
- Kafle, S. How resilient are our communities. Continuity 2010, 2, 28–29. [Google Scholar]
- Kafle, S.K. Integrated community based risk reduction: An approach to building disaster resilient communities. In Proceedings of the AIWEST-DR 2010: 5th Annual International Workshop & Expo on Sumatra Tsunami Disaster & Recovery, Banda Aceh, Indonesia, 23–24 November 2010; pp. 1–20. [Google Scholar]
- Kafle, S.K. Measuring disaster-resilient communities: A case study of coastal communities in Indonesia. J. Bus. Contin. Emerg. Plan. 2012, 5, 316–326. [Google Scholar]
- de FSM Russo, R.; Camanho, R. Criteria in AHP: A systematic review of literature. Procedia Comput. Sci. 2015, 55, 1123–1132. [Google Scholar] [CrossRef]
- Yin, S.; Li, J.; Liang, J.; Jia, K.; Yang, Z.; Wang, Y. Optimization of the weighted linear combination method for agricultural land suitability evaluation considering current land use and regional differences. Sustainability 2020, 12, 10134. [Google Scholar] [CrossRef]
- Vafaei, N.; Ribeiro, R.A.; Camarinha-Matos, L.M. Normalization techniques for multi-criteria decision making: Analytical hierarchy process case study. In Proceedings of the Doctoral Conference on Computing, Electrical and Industrial Systems, Costa de Caparica, Portugal, 11–13 April 2016; pp. 261–269. [Google Scholar]
- Laininen, P.; Hämäläinen, R.P. Analyzing AHP-matrices by regression. Eur. J. Oper. Res. 2003, 148, 514–524. [Google Scholar] [CrossRef]
- Albayrak, E.; Erensal, Y.C. Using analytic hierarchy process (AHP) to improve human performance: An application of multiple criteria decision making problem. J. Intell. Manuf. 2004, 15, 491–503. [Google Scholar] [CrossRef]
- Jiang, F.; Liu, T.; Zhou, H.; Rakofsky, J.J.; Liu, H.; Liu, Y.; Tang, Y.-L. Developing medical record-based, healthcare quality indicators for psychiatric hospitals in China: A modified Delphi-analytic hierarchy process study. Int. J. Qual. Health Care 2019, 31, 733–740. [Google Scholar] [CrossRef]
- Moghadas, M.; Asadzadeh, A.; Vafeidis, A.; Fekete, A.; Kötter, T. A multi-criteria approach for assessing urban flood resilience in Tehran, Iran. Int. J. Disaster Risk Reduct. 2019, 35, 101069. [Google Scholar]
- Liu, Y.; Zhang, X. Evaluating the Undergraduate Course based on a Fuzzy AHP-FIS Model. Int. J. Mod. Educ. Comput. Sci. 2020, 12, 55–66. [Google Scholar]
- Leccese, F.; Salvadori, G.; Rocca, M.; Buratti, C.; Belloni, E. A method to assess lighting quality in educational rooms using analytic hierarchy process. Build. Environ. 2020, 168, 106501. [Google Scholar]


Disclaimer/Publisher’s Note: The statements, opinions and data contained in all publications are solely those of the individual author(s) and contributor(s) and not of MDPI and/or the editor(s). MDPI and/or the editor(s) disclaim responsibility for any injury to people or property resulting from any ideas, methods, instructions or products referred to in the content. |
© 2023 by the authors. Licensee MDPI, Basel, Switzerland. This article is an open access article distributed under the terms and conditions of the Creative Commons Attribution (CC BY) license (https://creativecommons.org/licenses/by/4.0/).