

Research on Passengers’ Preferences and Impact of High-Speed Rail on Air Transport Demand


Abstract
:1. Introduction
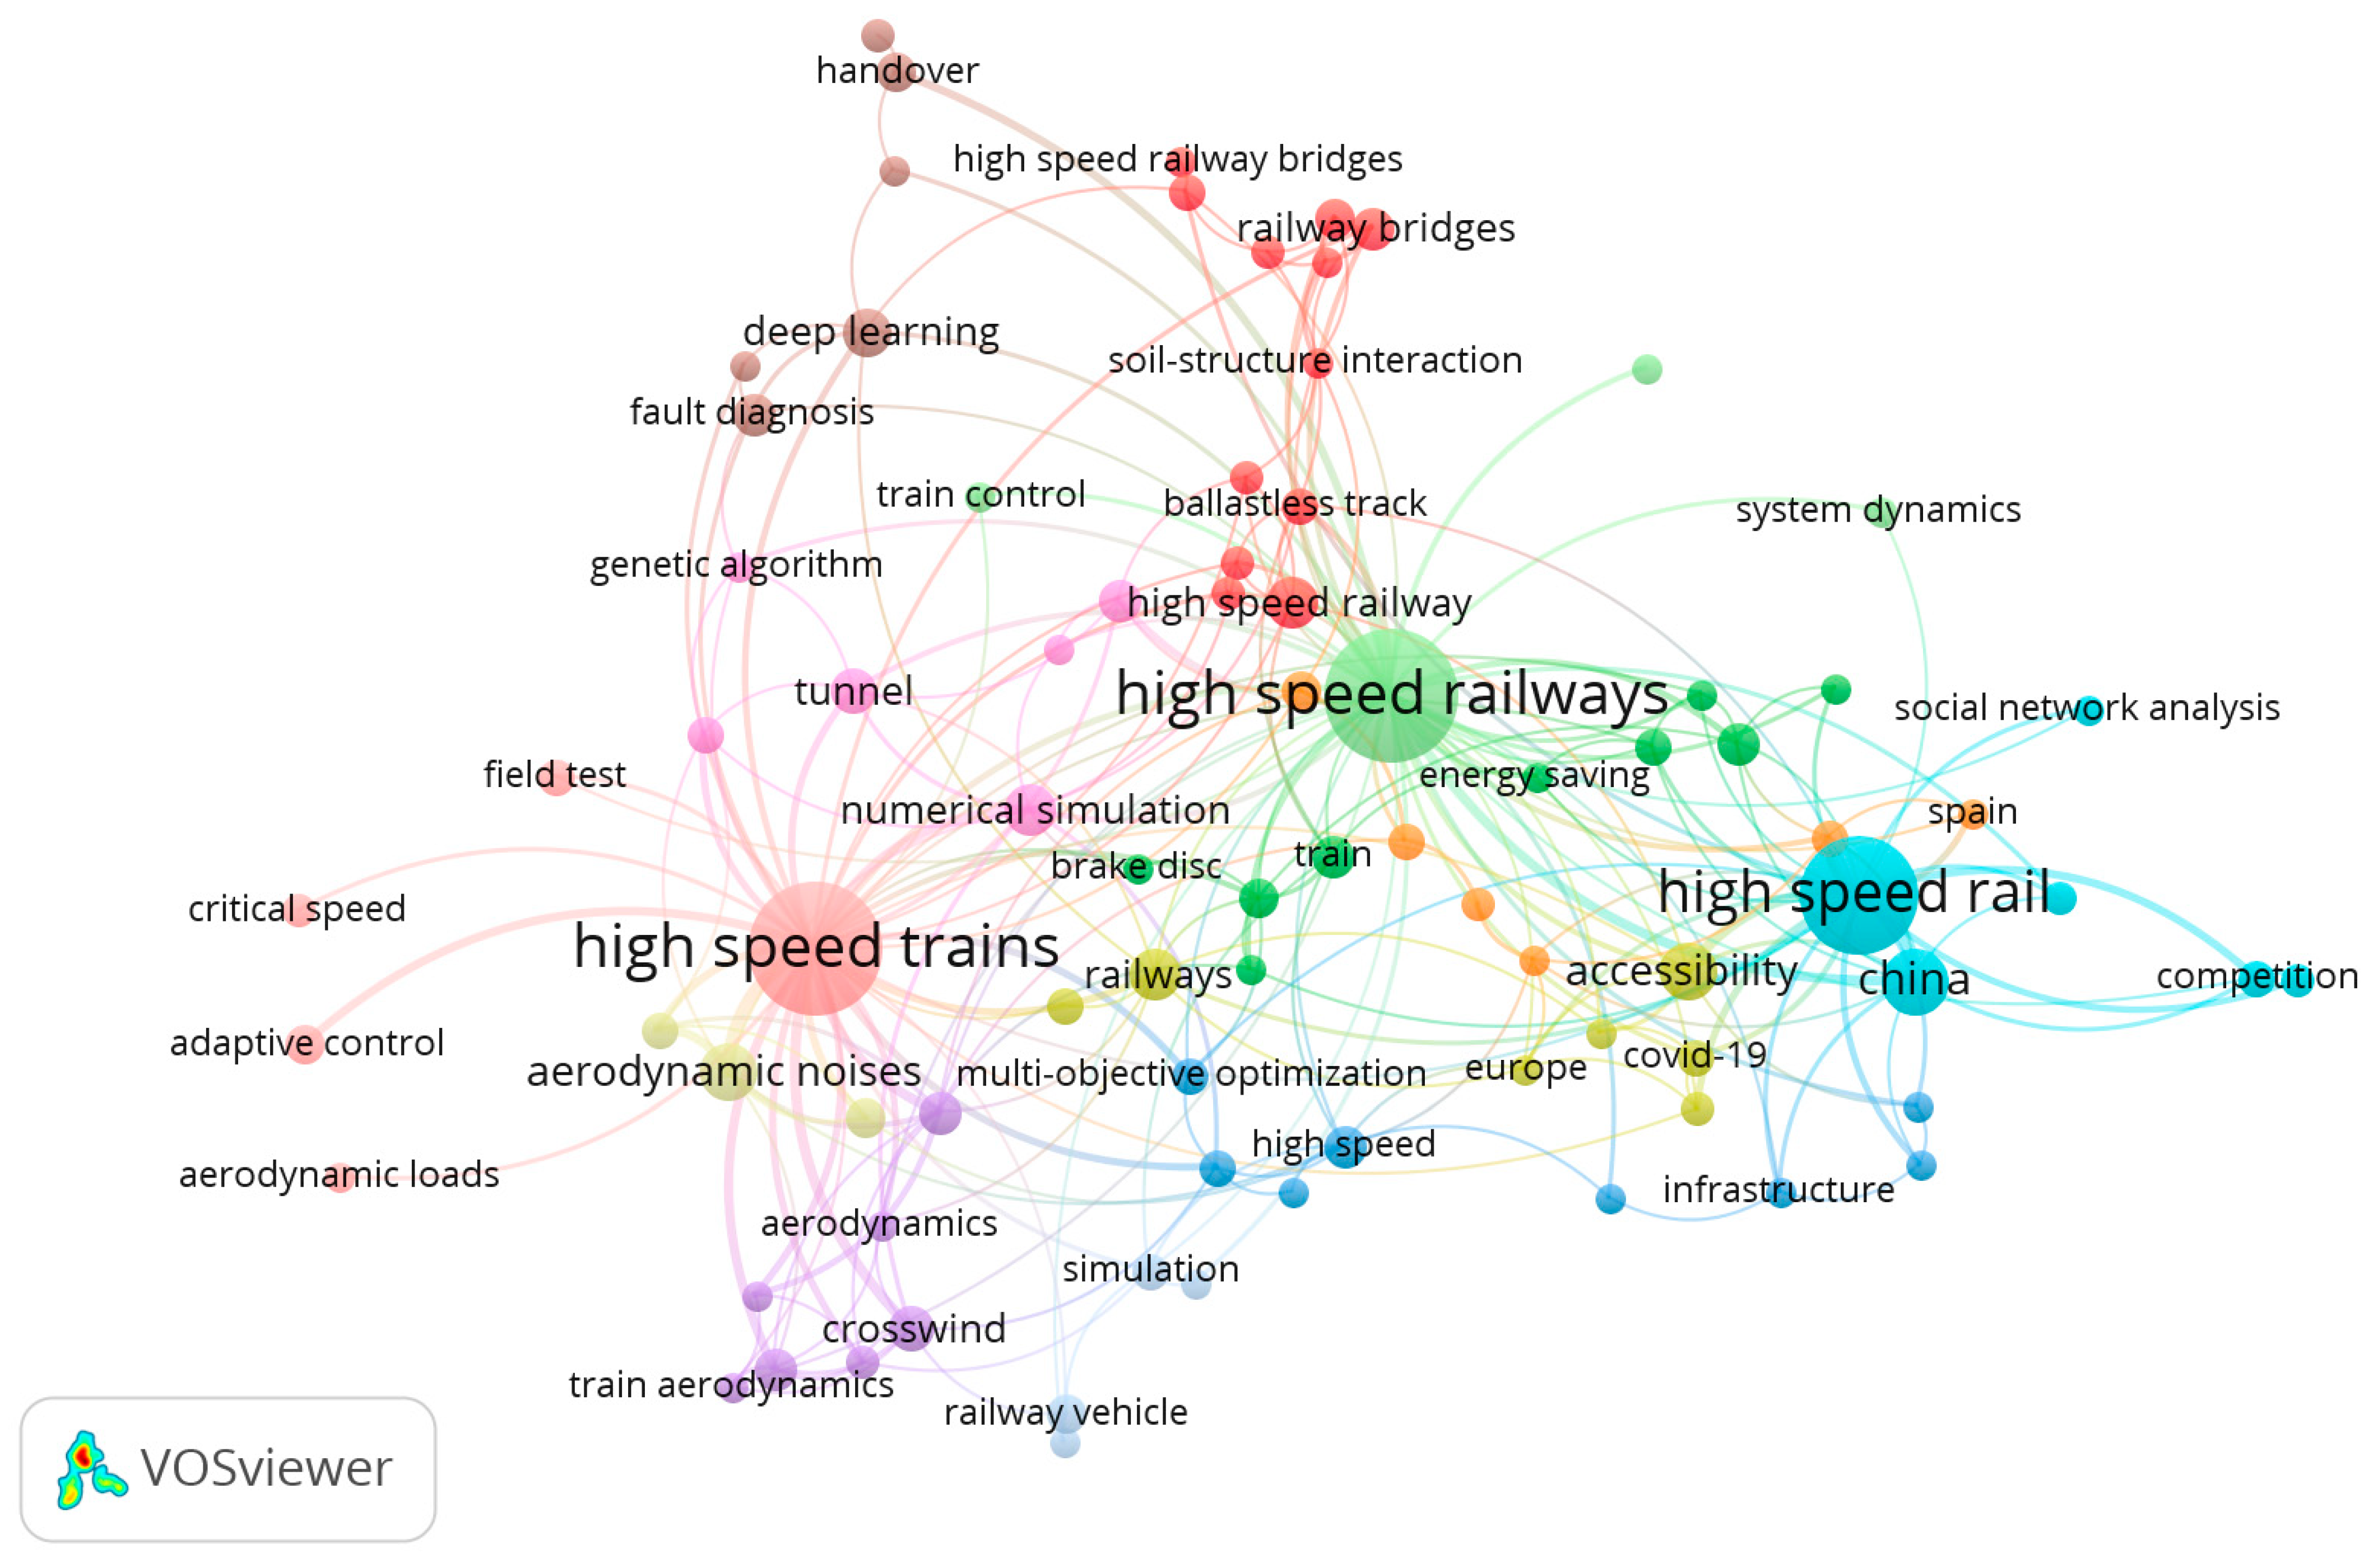
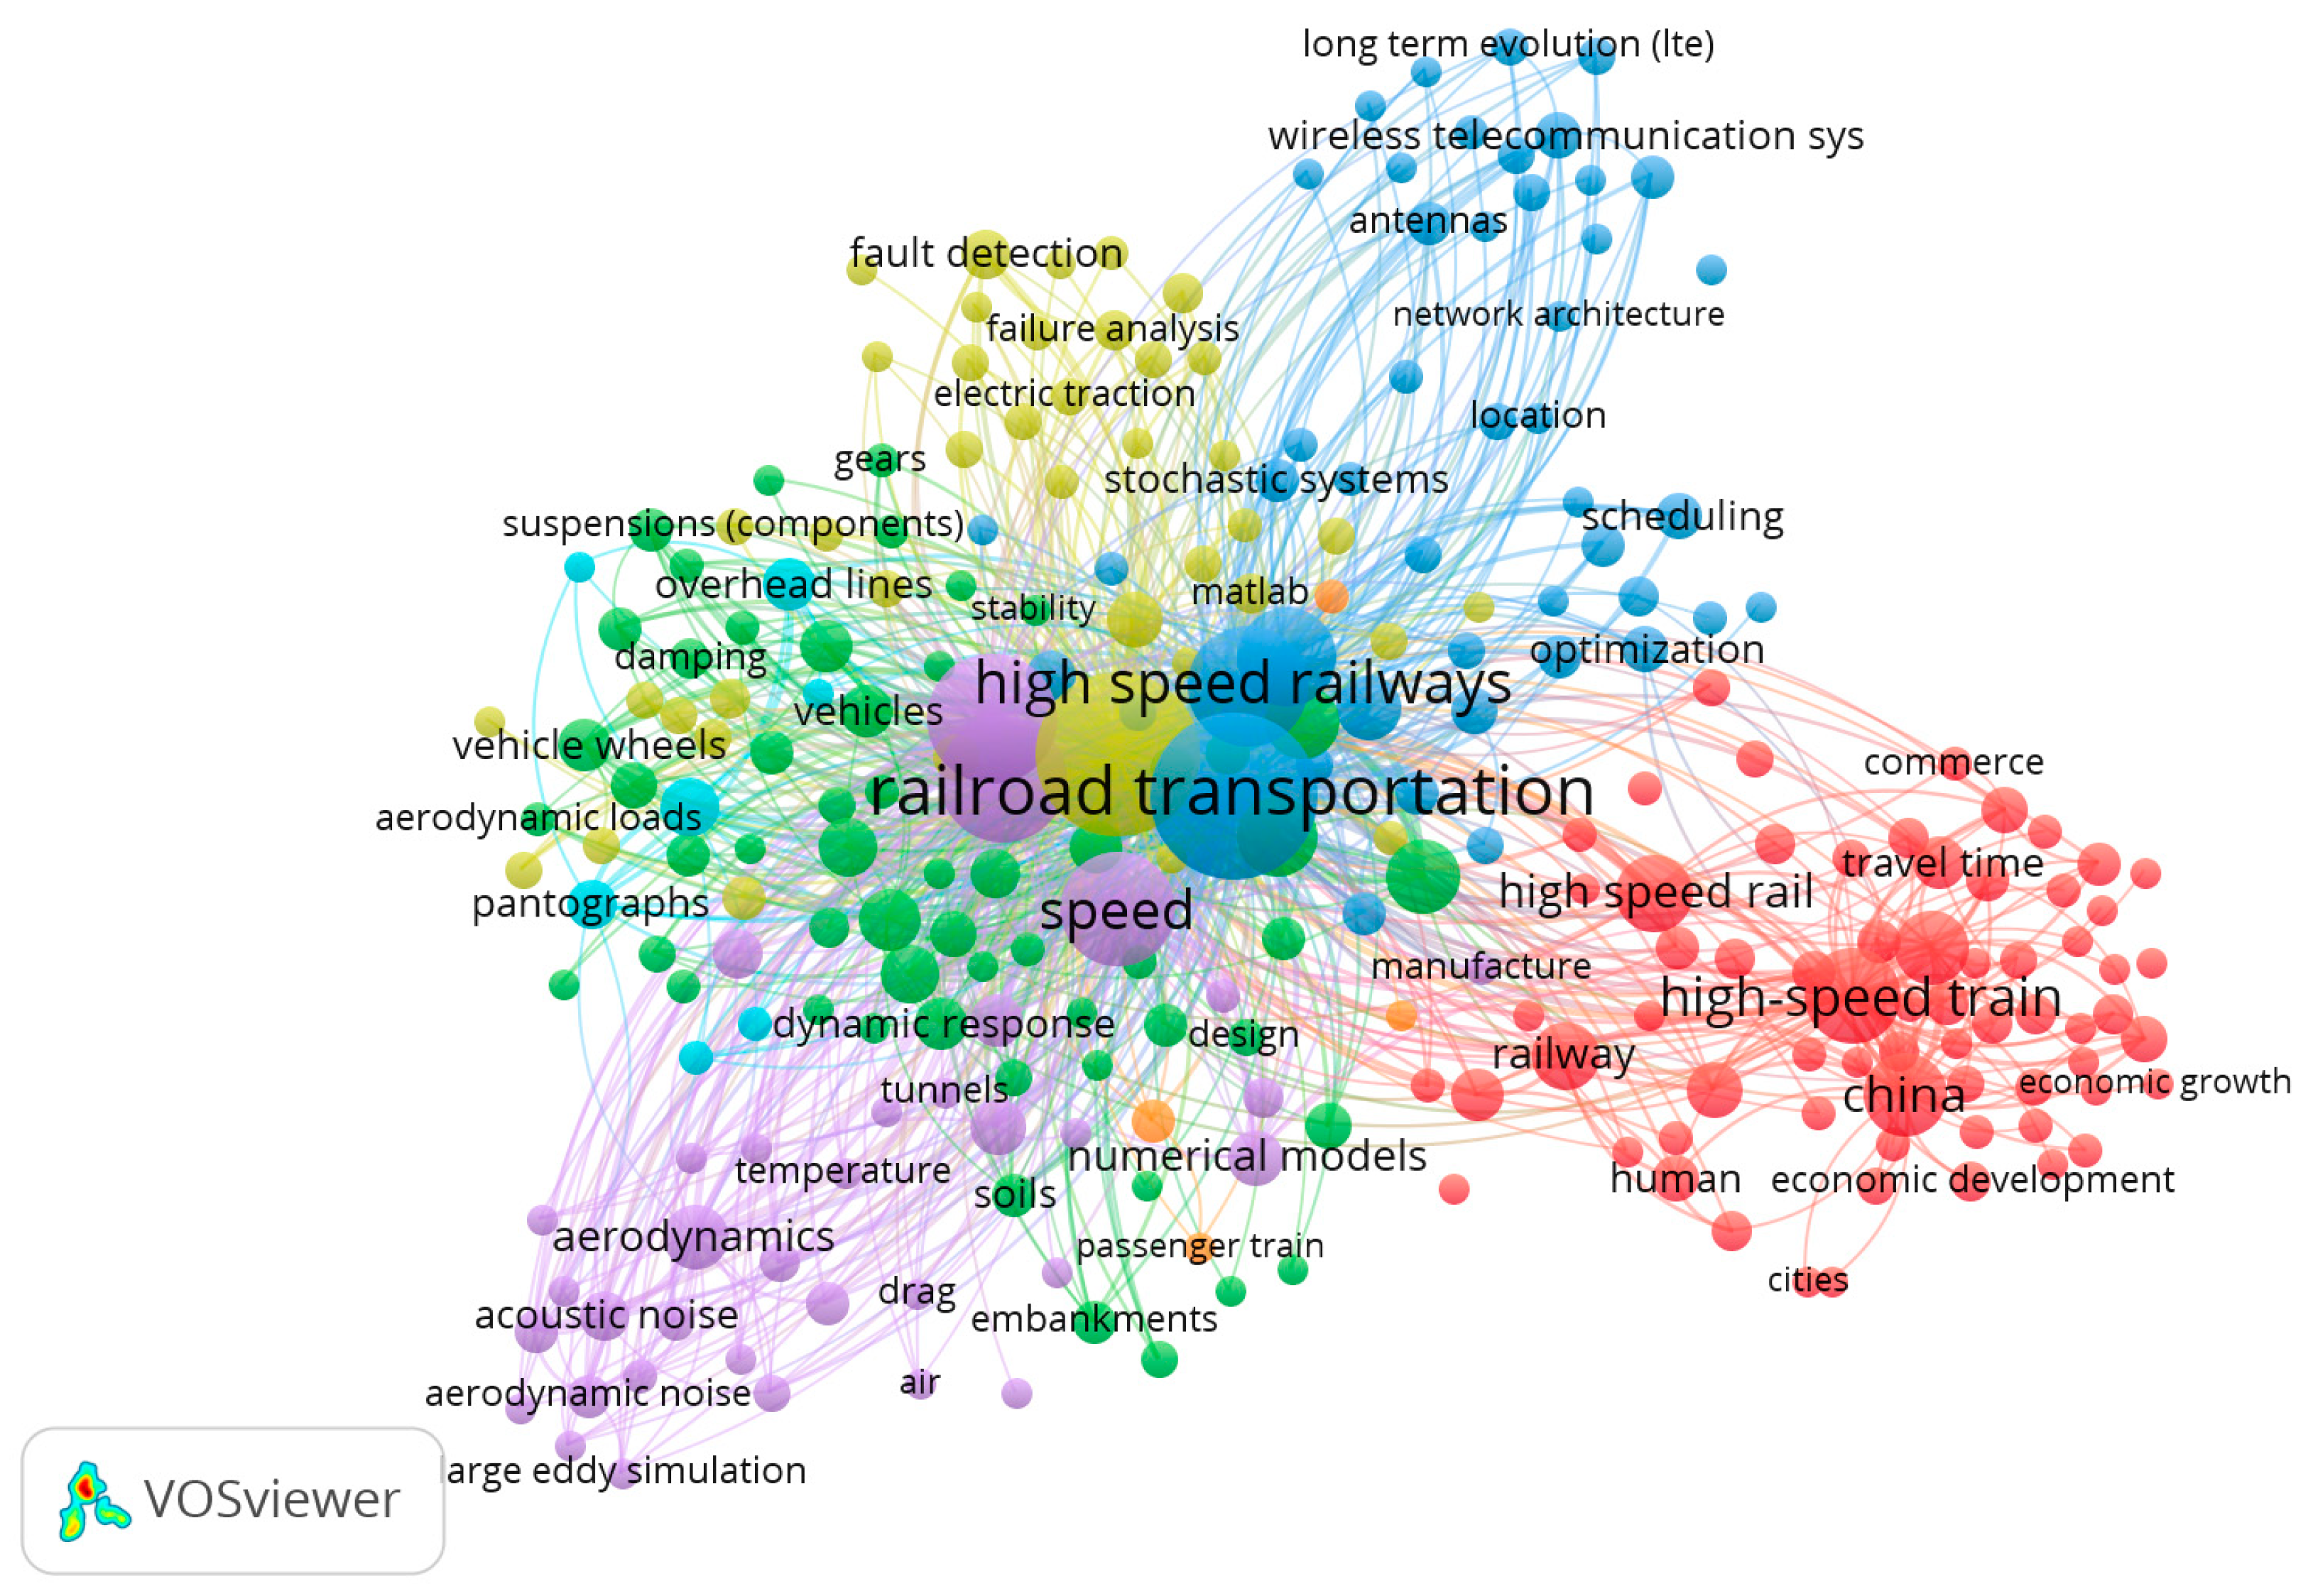
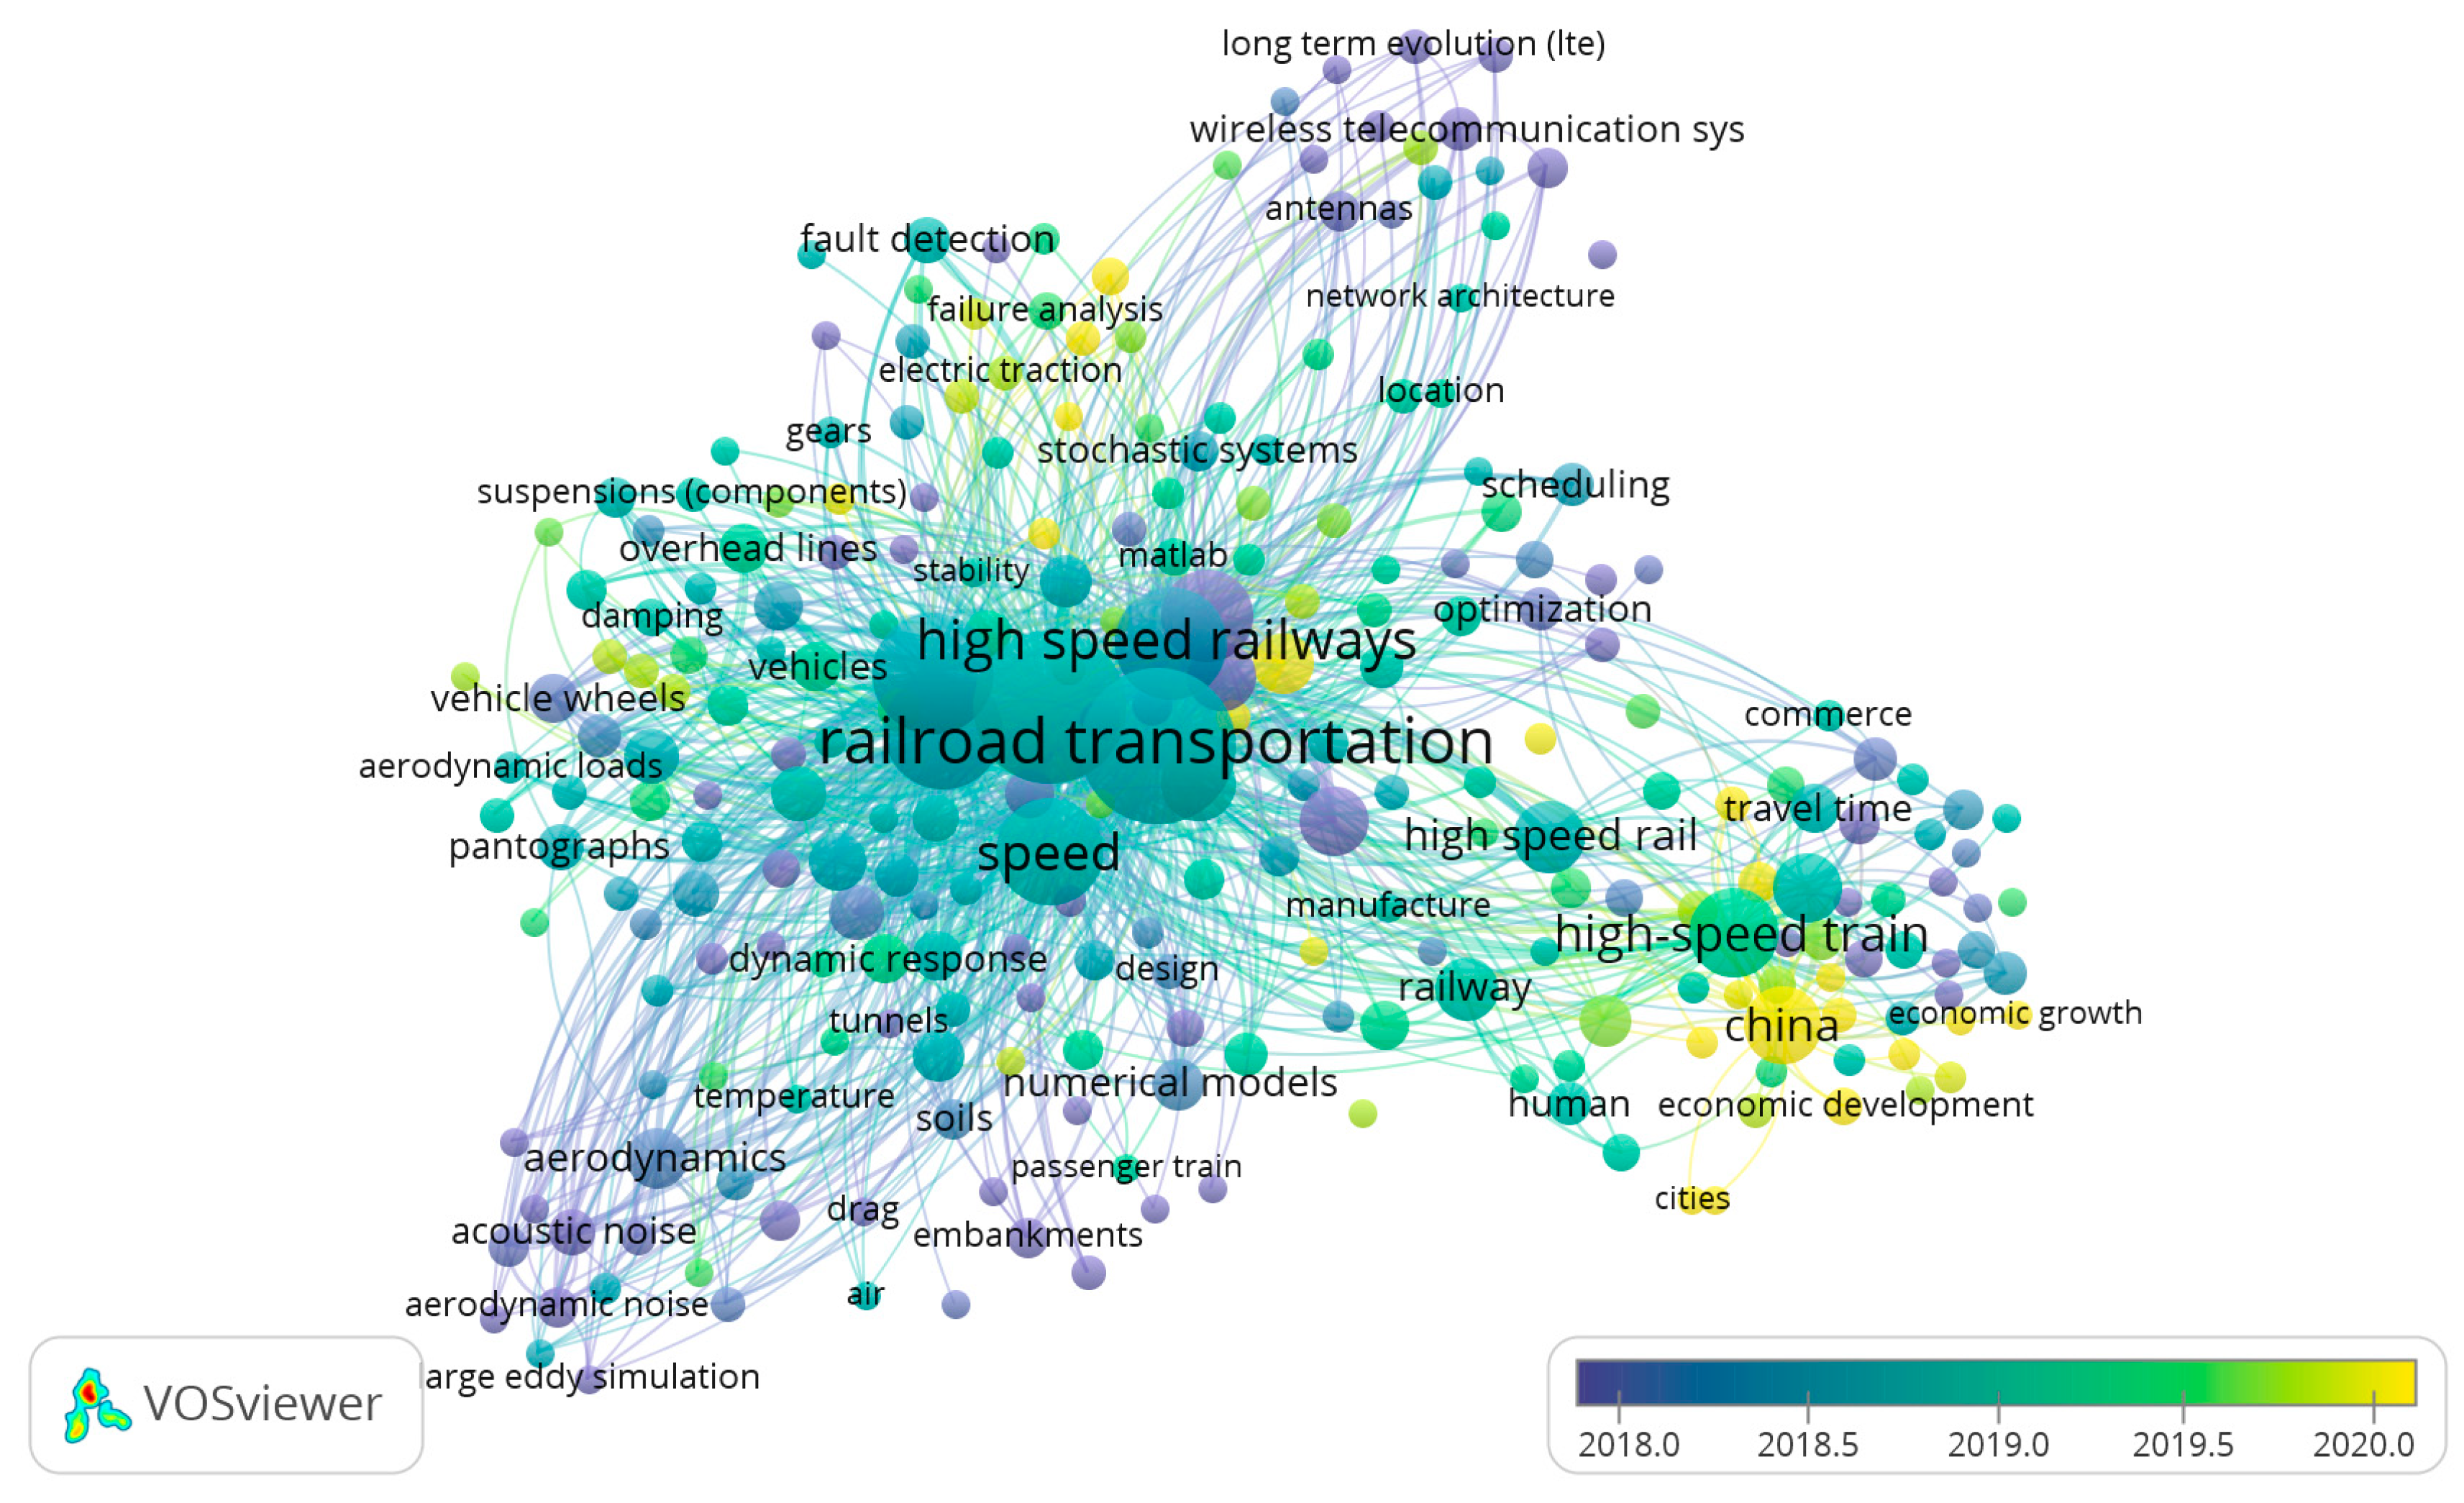
2. Bibliometric Analysis
3. Literature Review
3.1. Mode Choice Model and Parameter Estimation
3.2. Attributes That Influence Travellers’ Mode Choices
3.3. Impact of High-Speed Rail on Air Transport Demand
4. Gaps and Limitations
4.1. Travel Speed
4.2. Research Method and Type of Model
4.3. HSR Travel Attributes
4.4. Negative Impact of HSR Operation
5. Conclusions
Author Contributions
Funding
Institutional Review Board Statement
Informed Consent Statement
Data Availability Statement
Acknowledgments
Conflicts of Interest
Appendix A
| Papers | Variables of Choice | Type of Model | Research Method | Case Study | Dist. | Results |
| [8] | Fare, frequency, distance | Binary logit model | RP | Seoul–Daegu (South Korea) | 293 | Air traffic dropped 28% after HSR operation. |
| [10] | Access time, waiting time, travel cost, headway, in-vehicle time | Nested logit model | SP and RP | Madrid–Barcelona (Spain) | 625 | The market reach of the Madrid–Barcelona high-speed rail exceeds the previously estimated 35% analysis by about 50%. |
| [50] | Fare, air passenger, distance, number of passengers, route | Regression models (OLS) | Level year panel data (route) | World | - | This conclusion implies that low-cost carriers do not consider airport or route dominance/concentration when setting prices, and so do not levy price surcharges. |
| [43] | Frequency, access time, egress time, travel cost, reliability, travel time, comfort | Nested logit model | SP and RP | Madrid–Barcelona (Spain) | 625 | The air transport fare price and access-egress times may have a significant impact on HSR market share. |
| [11] | Access time, egress time, travel cost, travel time | Nested logit mode choice model | Survey | Rome–Naples | - | In general, car users are inflexible when it comes to HSR travel time and cost. |
| [65] | Fare, frequency, travel time | Regression models | - | Europe | - | The most critical variable in the battle between HSR and AT is travel/journey time. |
| [20] | Fare, distance, frequency, travel time | Multinomial and mixed logit models | SP | United Kingdom and France | - | The key determining elements in the competition between HSR and AT are travel time and service frequency. |
| [76] | Distance, access time, speed, fix cost, seat cost, GBT, VOT, Operating hours | - | - | China | - | Price and scheduling frequency are both treated as choice variables in a numerical study of China’s markets. |
| [19] | Transit time. comfort, fix cost | - | Data | Spain | - | The extension of the high-speed rail has become a major competitor in the air radial and interior connections that run parallel to an AVE line, forcing airlines to employ smaller planes and even causing the cancellation of some routes. |
| [69] | Fare, distance, GDP | Econometric model | City-pairs and airfare monthly data | Europe | - | The price levels of the business and leisure segments are reduced as a result of rivalry between FSCs; the average fare decreases in the business and leisure classes are EUR 232 and 113, respectively. |
| [51] | Fare, distance, population, licence | Regression models (OLS) | route-year-quarter level | USA | - | New competition can be formed as a result of a merger, and the consequent fare reductions must be recorded to counteract the effects of lost competition. |
| [66] | Fare, frequency, transit time | Regression models | - | - | - | - |
| [23] | Travel time, population, GDP, fuel process, density | Regression models (OLS) | Level year panel data (route) | Europe | - | Low-cost carriers have had a greater impact on expanding air travel, mainly through medium routes, which have seen a 50% decline in air traffic due to increased daily HSR trips. |
| [75] | Frequency, distance, transit time, population, GDP, number of ait transit, seat availability | Weighted CLAD | Level cross sectional data | Europe | - | With shorter HSR travel times, fewer air seats and frequencies are available. The impact of HSR journey time on air services is substantially greater than the impact of HSR frequency. |
| [22] | Fare, distance, seat cost, population, GDP | Multivariate econometric regression | Level year panel data (route) | Europe | - | HSR can provide feeding services to long-haul air services in hub airports, especially in hub airports with HRS stations, according to evidence. |
| [21] | Population, number passenger, number of air transfer, unemployment rate | Dynamic linear regression | Time series monthly data | Madrid–Barjas | - | The air transport mode accounted for only 13.9% of HSR passenger demand. |
| [39] | Fare, frequency, access time, egress time, travel time | Nested-logit model | SP | Japan | - | Even after the Linear Chuo Shinkansen commences service, the introduction of LCCs to/from Tokyo-Haneda airport will raise total aviation demand. |
| [21] | Population, number of passengers, number of ait transit, Unemployment rate | Dynamic linear regression | Time series monthly data | Spain | - | The air mode accounted for only 13.9% of HSR passenger demand. |
| [36] | Access time, egress time, travel time, income, trip purpose | Regression models | SP | Beijing-Guangzhou, China | The most critical aspect impacting the AH service’s market share is the en route travel/journey time. | |
| [40] | Distance, population, GDP, LCC | D-in-D estimator | Level year panel data (route) | China, Japan, South Korea | - | A more significant reduction in seat capacity for airlines in China than in Japan and Korea with the same high-speed rail service. |
| [7] | Frequency, travel cost, travel time, safety, free duty shopping area | Mixed logit model | SP | Seoul–Jeju, South Korea | - | Business travellers were more likely than leisure passengers to choose a safe method of transportation regardless of fee, whereas leisure passengers preferred to buy at duty-free shops. |
| [68] | Gender, age, travel time, number of cars, licence, income, occupancy, type of residence, number of elders and children, stay time, number traveling together | Logistic regression model | Collected data (RP) | Beijing | - | The logistic regression mode is outperformed by this cluster-based logistic regression model. It has a higher prediction accuracy for data, especially when it comes to forecasting the mode of transportation. |
| [46] | Travel cost, travel time, on time delivery, percentage delay delivery | Multinomial logit and mixed logit | SP | Rio Grande do Sul, Brazil | - | Initiatives and investments to promote multimodality should place a premium on increasing the reliability of intermodal options and combining cost-cutting and reliability policies. |
| [2] | Fare, frequency, distance, travel time, population, GDP | Econometric models | Level year panel data (route) | China | - | In the fight between HSR and AT, fares play a crucial role. |
| [52] | Access time, egress time, travel time, service, GTB | Regression models | Data | Shanghai–Wuhan | 830 | When the hub airport is constrained in capacity and air–rail integration is not prohibitively expensive, reducing air–rail connection time improves societal welfare. |
| [74] | Fare, travel time | Demand functions | Observations on a monthly | Spain | - | Demand for air travel has decreased as a result of greater competition from high-speed rail. |
| [35] | Distance, population, GDP, OD contains a hub city | DID approach | Panel data | China | - | The effects are substantially more pronounced for air routes that connect large hubs within a distance of 500 to 800 km. |
| [18] | Fare, frequency, travel time, population, GDP | Regression models | Panel data | China | - | In general, the introduction of new HSR lines reduces air transport demand by 27%. |
| [70] | Travel time, safety | DID method | Panel data | China | - | The impact of HSR speed on airline traffic is greater than the impact of HSR speed on airline fare. |
| [41] | Fare, transit time, comfort | Binomial logit model | Survey | Tehran–Isfahan, Iran | The most crucial determinant in influencing the percentage of each mode is travel time, and which passengers are more sensitive to than the others. | |
| [28] | Age, gender, education level, job, income, trip purpose, fare, travel time, mode to airport | Binomial logit model, logistic regression | SP | Jakarta–Surabaya, Indonesia | 718 | The amount of passengers’ income is the most relevant passenger feature in this study. |
| [9] | Fare, frequency, distance, access time, population, GDP, average internet usage of arrival and departure city | D-in-D estimator | Level year panel data (route) | China | - | Due to an increase in the frequency of daily HSR journeys, shows a 50% drop in air travel. |
| [53] | Fare, travel time, population, GDP | Regression models (OLS) | Panel data | Beijing–Shanghai | - | Following the introduction of HSR, there was a lesser decline in both airfare and air travel demand on the routes served. |
| [54] | Fare, population, GDP, LCC | Regression models (OLS) | Panel data | China and Japan | - | As HSR connectivity or accessibility improves, airport domestic and overall traffic declines on average in China, but little changes in Japan. |
| [12] | Distance, population, GDP | Regression models | Panel data | China | - | When the difference in in-vehicle travel time between HSR and air reduces, the impact of HSR entry increases at a faster pace for air passenger volumes. |
| [102] | Fare, travel time | Binomial logit model, regression | SP | Jakarta–Surabaya, Indonesia | 718 | The operation of the high-speed train between Jakarta and Surabaya has a negative influence on air transport demand, particularly for passenger planes. |
| [85] | Distance, population, income, number of passengers, number of air transits, tourist | The HHI and Lerner index | Paned data | China | - | The arrival of HSR reduced market power as measured by the Lerner indices, both unweighted and weighted. |
| [103] | Fare, frequency, access time, egress time, travel time | Multinomial distribution and full enumeration | SP | Lebanon | - | Modelling single trip/day decisions rather than weekly decisions would result in model estimates that were limited in terms of the full impact of the suggested policies over longer time periods. |
| [30] | Fare, frequency, traffic, profit, profit railway, | Regression models | Panel data | Paris–Marseille | - | The operation of the independently owned LCR has an impact on current rail, FSR and air traffic. |
| [55] | Fare, frequency, travel time, comfort | Regression models | Panel data | Beijing–Guangzhou | The method separates the market from the traveller’s personal characteristics, allowing it to forecast the deep-level passenger flow structure. | |
| [17] | Frequency, travel time, population, GDP, seat availability, welfare, route | Regression models (OLS) | Panel data | China | - | If the HSR travel time is more than 5 h greater than the air travel time, air traffic tends to grow. |
| [1] | Distance, gender, age, income, job, education level | Binary and multinomial logit | Survey | Chongqing, China | - | Reveals that the pricing, travel habits and amenities for long-distance trips are all important variables that prevent passengers from using the HSR system. |
| [25] | Frequency, distance | Econometric models | Panel data | China | - | Proposes that all types of carriers, particularly low-cost carriers (LCCs) and high-speed rail (HSR) operators, contribute effective competition to the aviation market by lowering airline profitability and airfares. |
| [104] | Travel cost, gender, age, travel time, number of cars, income, type of residence, education level, household type | Random forest technique and Bayesian network analysis | Survey | Malaysia | - | The researchers discovered the ten most important characteristics impacting university students’ usage of ride-sharing for various travel objectives, as well as the most important predictors of ride-sharing use among students for school, shopping and leisure. |
| [56] | Population, GDP | Regression models | Panel data | Beijing–Tianjin–Hebei | - | The centre city gains more from expanded air–HSR (high speed rail) intermodal connectivity because it may draw air passengers from nearby non-centre cities; therefore, improved intra-city-cluster rail connectivity worsens the air-connectivity gap inside the city cluster. |
| [42] | Fare, travel time | Binomial logit model (regression) | SP | Jakarta–Surabaya, Indonesia | 718 | The operation of the high-speed train between Jakarta and Surabaya would have a negative influence on the demand for executive train passengers. |
| [6] | Fare, distance, travel time, population, income, route | DID (Difference in Differences) | Survey | Japan | - | The effects of the HSR extension on FSC’s airfares were consistently negative, with the negative effects being more pronounced in the short-haul sectors. |
| [105] | Access time, gender, age, travel time, number of cars, income, trip purpose, safety, job, access mode, departure mode, departure time, ticketing purchasing method | Bayesian binary logit | Survey | China | - | The intercity travel mode competition is influenced by factors such as travel distance, intercity travel cost, intercity travel time, safety, comfort, punctuality, access time and departure time. |
| [106] | Travel time, occupancy, flow | Neural network and binary logistic regression model | Panel data | Los Angeles and California | With a worldwide accuracy of 79.50%, the neural network model outperformed the binary logistic regression model in forecasting crashes. | |
| [57] | Fare, frequency, distance | Regression models | Panel data | Shanghai and Beijing, China | It reduces HSR service frequencies, but it reduces HSR service frequencies with a short number of stops even more. | |
| [67] | Fare, travel time | Logit model (regression models) | RP | Jakarta–Bandung, Indonesia | 142 | Passengers are transferred from the current train to the Jakarta–Bandung high-speed rail. |
| [47] | Fare, access time, travel time and frequency | MNL and NL logit models | SP | South Korea | - | When it comes to passenger choice, access time and travel time are quite essential. |
| [38] | Travel time, fare, comfort, and service delay | Nested logit model | SP and RP | Santiago–Conception (Chile) | 434 | In the rivalry between HSR and AT, reliability is the most crucial factor. |
| [107] | - | - | Survey | Paris–Lyons (France) | 275 | On the basis of surveys carried out both before and after its inauguration, a negative impact on AT demand was found. |
| [48] | Time, frequency, first class fare, economy fare, discount economy, off peak, family discount | Multinomial logit model | SP | Sydney–Canberra (Australia) | 247 | The estimate derived from our data is 26% of diverted air transport traffic. |
| [49] | Total number of trips, travel time, cost, time interval (frequency), income, work trip, population, capital stock | Multinomial logit model | SP | Spain | - | Railways’ market share will increase from 8.9% in 2000 to 22.8% in 2010, and HSR will be able to compete with AT over lengths greater than 500 km. |
| [108] | Cost, frequency, check-in, parking, mode airport (car) | Binomial and mixed logit models | SP and RP | Madrid –Barcelona (Spain) | 625 | The key determining variables in the competition between HSR and AT are fare pricing and service frequency. |
| [33] | - | - | Data | Wuhan–Guangzhou (China) | 1069 | HSR can reduce AT frequency by up to 32% on a daily basis. |
| [80] | - | - | Data | Europe and South Korea | Two–four years following the implementation of HSR, induced demand will be in the range of 10–20%. | |
| [81] | - | - | Data | China | In China, HSR has the potential to reduce AT’s market share for medium-haul travel. | |
| [71] | Population, GDP, access, distance, number air passengers | D-in-D estimation | Level year panel data (route) | East Asian regions (Mainland China, Japan, South Korea and Taiwan) | In medium-haul routes, the substitution effect is most noticeable (between 500 and 1000 km). | |
| [14] | Air passengers, train passengers, Iberia market share, distance | 2SLS-IV | Level monthly panel data (route) | Spain | - | Shows that air operations are reduced by 17% due to the introduction of high-speed rail. |
| [77] | Distance, number of air passengers, frequency, population, GDP | FGLS with Lerner index | Level quarterly panel data (route) | China | The advent of HSR puts downward pressure on the airline Lerner index and yield by 15.5% and 14.6%, respectively. | |
| [58] | Fare, market share, HHI, booking day, holiday | Regression-GLS | Level daily panel data (route) | Italy | - | On routes with less competition, air fares are higher; on routes with more competition, air fares are lower closer to departure date. |
| [59] | Market share, inter-modal competition, booking day, off-peak | Regression-GLS | Level daily panel data (route) | Italy | - | The Rome Fiumicino–Milan Linate route is 15.5% cheaper, and the Rome Fiumicino–Milan Linate route is 29% cheaper. HSR competition on the Milan–Malpensa route. |
| [60] | Fare, travel time, booking day, HHI | Regression-GLS | Level daily panel data (route) | Italy | - | Airlines can raise air fares by 3.9% due to a 10% increase in train journey time. |
| [61] | Frequency, distance, population, GDP, HHI, airport access, tourism, road quality | - | Level monthly panel data (route) | Europe | - | Based on the full sample, HSR may exert positive pressure on airline flight frequencies, although no statistically significant influence was identified in subsamples of short-haul routes (less than 550 km). |
| [109] | Seat/flight, market size, distance, HHI | Regression models (OLS) | Level cross-sectional data (route) | World | - | There was no discernible effect of HSR on air passenger demand. |
| [44] | Frequency, transfer, Fare, distance | Nested logit model | Intercity travel survey | Japan | - | Only markets with a medium access/egress distance compete with air transport. |
| [45] | Fare, travel time, distance, frequency, the number of departures and total seat capacity | Nested logit model | SP | Tokyo–Osaka | 503 | The key determining elements in competitiveness are travel time, frequency of service and fare price. |
| [82] | In-vehicle time, access and exit time from/to the airport, reliability, price, frequency | Discrete choice | SP and RP | Bari–Rome and Brindisi–Rome | - | Found that air transportation (air-to-HSR) and conventional rail services are more likely to cause a demand shift (rail-to-HSR). |
| [21] | Fare, population, GDP, distance | Dynamic linear regression model | Panel data (route) | Spain | - | During the period 1999–2012, air travel accounted for only 13.9% of HSR passenger demand. |
| [62] | Passengers, frequency, GDP, population, pollution, speed, rail time | Regression models | Panel data | China | - | HSR travel time has a shock effect on flight transportation. |
| [12] | Population, GDP, distance | Regression models | Panel data | China | - | The inclusion of HSR reduces air passenger volume by 17.88% and flight frequency by 15.80%. |
| [14] | Air passengers, air operations, train passengers, distance, GDP | Regression models | Route-level data | Spain | - | The inclusion of HSR reduces air travel demand by 17%. |
| [63] | Travel time, daily departure options, fares, and the inconvenience associated with transferring at airports | Regression models | Survey | The Netherlands | - | There is a reduction in flight frequency due to HSR. |
| [31] | GDP, population, distance, administrative level | Regression models | Panel data OD | China | - | Cities that have HSR networks have very good activities when compared to cities that are only connected by air transportation. |
| [72] | Ticket price, travel time, frequency | Monte Carlo simulation | SP | Dallas and Houston, USA | - | Service frequency when choosing a means of transportation between Dallas and Houston is crucial. |
| [64] | GDP, population, industrial structure, distance, speed, LCC, HHI | Regression models | Panel data | China | - | Number of airline passengers declined by 29.84% for all market segments. |
| [83] | Launch, treatment route, accident | DID approach | Panel data | China | - | HSR as a low-end substitute for air travel in China. |
References
- Ren, X.; Chen, Z.; Wang, F.; Dan, T.; Wang, W.; Guo, X.; Liu, C. Impact of high-speed rail on social equity in China: Evidence from a mode choice survey. Transp. Res. Part A Policy Pract. 2020, 138, 422–441. [Google Scholar] [CrossRef]
- Zhang, Q.; Yang, H.; Wang, Q. Impact of high-speed rail on China’s Big Three airlines. Transp. Res. Part A Policy Pract. 2017, 98, 77–85. [Google Scholar] [CrossRef]
- Cheng, Y.-S.; Loo, B.P.; Vickerman, R. High-speed rail networks, economic integration and regional specialisation in China and Europe. Travel Behav. Soc. 2015, 2, 1–14. [Google Scholar] [CrossRef]
- D’Alfonso, T.; Jiang, C.; Bracaglia, V. Would competition between air transport and high-speed rail benefit environment and social welfare? Transp. Res. Part B Methodol. 2015, 74, 118–137. [Google Scholar] [CrossRef]
- Zhang, R.; Johnson, D.; Zhao, W.; Nash, C. Competition of airline and high-speed rail in terms of price and frequency: Empirical study from China. Transp. Policy 2019, 78, 8–18. [Google Scholar] [CrossRef]
- Mizutani, J.; Sakai, H. Which is a stronger competitor, High Speed Rail, or Low Cost Carrier, to Full Service Carrier?–Effects of HSR network extension and LCC entry on FSC’s airfare in Japan. J. Air Transp. Manag. 2021, 90, 101965. [Google Scholar] [CrossRef]
- Lee, J.-K.; Yoo, K.-E.; Song, K.-H. A study on travelers’ transport mode choice behavior using the mixed logit model: A case study of the Seoul-Jeju route. J. Air Transp. Manag. 2016, 56, 131–137. [Google Scholar] [CrossRef]
- Park, Y.; Ha, H.-K. Analysis of the impact of high-speed railroad service on air transport demand. Transp. Res. Part E Logist. Transp. Rev. 2006, 42, 95–104. [Google Scholar] [CrossRef]
- Li, H.; Strauss, J.; Lu, L. The impact of high-speed rail on civil aviation in China. Transp. Policy 2019, 74, 187–200. [Google Scholar] [CrossRef]
- Román, C.; Espino, R.; Martín, J.C. Competition of high-speed train with air transport: The case of Madrid–Barcelona. J. Air Transp. Manag. 2007, 13, 277–284. [Google Scholar] [CrossRef]
- Cascetta, E.; Papola, A.; Pagliara, F.; Marzano, V. Analysis of mobility impacts of the high speed Rome–Naples rail link using withinday dynamic mode service choice models. J. Transp. Geogr. 2011, 19, 635–643. [Google Scholar] [CrossRef]
- Chen, Z.; Wang, Z.; Jiang, H. Analyzing the heterogeneous impacts of high-speed rail entry on air travel in China: A hierarchical panel regression approach. Transp. Res. Part A Policy Pract. 2019, 127, 86–98. [Google Scholar] [CrossRef]
- Chantruthai, P.; Taneerananon, S.; Taneerananon, P. A Study of Competitiveness between Low Cost Airlines and High-Speed-Rail: A Case Study of Southern Corridor in Thailand. Eng. J. 2014, 18, 141–162. [Google Scholar] [CrossRef]
- Jiménez, J.L.; Betancor, O. When trains go faster than planes: The strategic reaction of airlines in Spain. Transp. Policy 2012, 23, 34–41. [Google Scholar] [CrossRef]
- Wetwitoo, J.; Kato, H. High-speed rail and regional economic productivity through agglomeration and network externality: A case study of inter-regional transportation in Japan. Case Stud. Transp. Policy 2017, 5, 549–559. [Google Scholar] [CrossRef]
- Xia, W.; Zhang, A. High-speed rail and air transport competition and cooperation: A vertical differentiation approach. Transp. Res. Part B Methodol. 2016, 94, 456–481. [Google Scholar] [CrossRef]
- Gu, H.; Wan, Y. Can entry of high-speed rail increase air traffic? Price competition, travel time difference and catchment expansion. Transp. Policy 2020, 97, 55–72. [Google Scholar] [CrossRef]
- Yang, H.; Burghouwt, G.; Wang, J.; Boonekamp, T.; Dijst, M. The implications of high-speed railways on air passenger flows in China. Appl. Geogr. 2018, 97, 1–9. [Google Scholar] [CrossRef]
- Pisonero, R. High speed rail (HSR) vs air transportation: Trendy competition in the transport geography of Spain. Inf. Technol. Res. J. 2012, 2, 8–19. Available online: http://resjournals.com/ITJ/Pdf/2012/April/Pisonero.pdf (accessed on 4 September 2022).
- Behrens, C.; Pels, E. Intermodal competition in the London–Paris passenger market: High-Speed Rail and air transport. J. Urban Econ. 2012, 71, 278–288. [Google Scholar] [CrossRef]
- Castillo-Manzano, J.I.; Pozo-Barajas, R.; Trapero, J.R. Measuring the substitution effects between High Speed Rail and air transport in Spain. J. Transp. Geogr. 2015, 43, 59–65. [Google Scholar] [CrossRef]
- Albalate, D.; Bel, G.; Fageda, X. Competition and cooperation between high-speed rail and air transportation services in Europe. J. Transp. Geogr. 2015, 42, 166–174. [Google Scholar] [CrossRef]
- Clewlow, R.R.; Sussman, J.M.; Balakrishnan, H. The impact of high-speed rail and low-cost carriers on European air passenger traffic. Transp. Policy 2014, 33, 136–143. [Google Scholar] [CrossRef]
- Chen, Z.; Xue, J.; Rose, A.Z.; Haynes, K.E. The impact of high-speed rail investment on economic and environmental change in China: A dynamic CGE analysis. Transp. Res. Part A Policy Pract. 2016, 92, 232–245. [Google Scholar] [CrossRef]
- Su, M.; Luan, W.; Fu, X.; Yang, Z.; Zhang, R. The competition effects of low-cost carriers and high-speed rail on the Chinese aviation market. Transp. Policy 2020, 95, 37–46. [Google Scholar] [CrossRef]
- Zhang, A.; Wan, Y.; Yang, H. Impacts of high-speed rail on airlines, airports and regional economies: A survey of recent research. Transp. Policy 2019, 81, A1–A19. [Google Scholar] [CrossRef]
- Cheng, J.; Chen, Z. Impact of High-Speed Rail on the Operational Capacity of Conventional Rail in China. Transp. Policy 2021, 110, 354–367. [Google Scholar] [CrossRef]
- Nurhidayat, A.Y.; Widyastuti, H.; Utomo, D.P. Model of transportation mode choice between aircraft and high speed train of Jakarta-Surabaya route. IOP Conf. Ser. Earth Environ. Sci. 2018, 202. [Google Scholar] [CrossRef]
- Wang, J.; Huang, J.; Jing, Y. Competition between high-speed trains and air travel in China: From a spatial to spatiotemporal perspective. Transp. Res. Part A Policy Pract. 2020, 133, 62–78. [Google Scholar] [CrossRef]
- Wang, Y.; Sun, L.; Teunter, R.H.; Wu, J.; Hua, G. Effects of introducing low-cost high-speed rail on air-rail competition: Modelling and numerical analysis for Paris-Marseille. Transp. Policy 2020, 99, 145–162. [Google Scholar] [CrossRef]
- Yang, H.; Dobruszkes, F.; Wang, J.; Dijst, M.; Witte, P. Comparing China’s urban systems in high-speed railway and airline networks. J. Transp. Geogr. 2018, 68, 233–244. [Google Scholar] [CrossRef]
- Bukovac, S.; Douglas, I. The potential impact of High Speed Rail development on Australian aviation. J. Air Transp. Manag. 2019, 78, 164–174. [Google Scholar] [CrossRef]
- Fu, X.; Zhang, A.; Lei, Z. Will China’s airline industry survive the entry of high-speed rail? Res. Transp. Econ. 2012, 35, 13–25. [Google Scholar] [CrossRef]
- Adler, N.; Pels, E.; Nash, C. High-speed rail and air transport competition: Game engineering as tool for cost-benefit analysis. Transp. Res. Part B Methodol. 2010, 44, 812–833. [Google Scholar] [CrossRef]
- Chen, Z. Impacts of high-speed rail on domestic air transportation in China. J. Transp. Geogr. 2017, 62, 184–196. [Google Scholar] [CrossRef]
- Li, Z.-C.; Sheng, D. Forecasting passenger travel demand for air and high-speed rail integration service: A case study of Beijing-Guangzhou corridor, China. Transp. Res. Part A Policy Pract. 2016, 94, 397–410. [Google Scholar] [CrossRef]
- Wu, D.; Martín, J.C. Research on Passengers’ Preference for High-Speed Railways (HSRs) and High-Speed Trains (HSTs). Sustainability 2022, 14, 1473. [Google Scholar] [CrossRef]
- Ortúzar, J.D.D.; Simonetti, C. Modelling the demand for medium distance air travel with the mixed data estimation method. J. Air Transp. Manag. 2008, 14, 297–303. [Google Scholar] [CrossRef]
- Inoue, G.; Ono, M.; Uehara, K.; Isono, F. Stated-preference analysis to estimate the domestic transport demand following the future entry of LCCs and the inauguration of the Linear Chuo Shinkansen in Japan. J. Air Transp. Manag. 2015, 47, 199–217. [Google Scholar] [CrossRef]
- Wan, Y.; Ha, H.-K.; Yoshida, Y.; Zhang, A. Airlines’ reaction to high-speed rail entries: Empirical study of the Northeast Asian market. Transp. Res. Part A Policy Pract. 2016, 94, 532–557. [Google Scholar] [CrossRef]
- Danapour, M.; Nickkar, A.; Jeihani, M.; Khaksar, H. Competition between high-speed rail and air transport in Iran: The case of Tehran–Isfahan. Case Stud. Transp. Policy 2018, 6, 456–461. [Google Scholar] [CrossRef]
- Utomo, D.P.; Lestari, P.D.R.; Sucipto, S.; Nurhidayat, A.Y. Impact of the Jakarta-Surabaya High-Speed Train on Passengers of the Jakarta-Surabaya Executive Train Corridor. Maj. Ilm. Pengkaj. Ind. 2020, 14, 1–10. [Google Scholar] [CrossRef]
- Román, C.; Martin, J.C. Potential demand for new high speed rail services in high dense air transport corridors. Int. J. Sustain. Dev. Plan. 2010, 5, 114–129. [Google Scholar] [CrossRef]
- Clever, R.; Hansen, M.M. Interaction of Air and High-Speed Rail in Japan. Transp. Res. Rec. 2008, 2043, 1–12. [Google Scholar] [CrossRef]
- Fu, X.; Oum, T.H.; Yan, J. An analysis of travel demand in Japan’s intercity market: Empirical estimation and policy simulation. J. Transp. Econ. Policy 2014, 48, 97–113. [Google Scholar]
- Larranaga, A.M.; Arellana, J.; Senna, L.A. Encouraging intermodality: A stated preference analysis of freight mode choice in Rio Grande do Sul. Transp. Res. Part A Policy Pract. 2017, 102, 202–211. [Google Scholar] [CrossRef]
- Jung, S.-Y.; Yoo, K.-E. Passenger airline choice behavior for domestic short-haul travel in South Korea. J. Air Transp. Manag. 2014, 38, 43–47. [Google Scholar] [CrossRef]
- Hensher, D.A. A practical approach to identifying the market potential for high speed rail: A case study in the Sydney-Canberra corridor. Transp. Res. Part A Policy Pract. 1997, 31, 431–446. [Google Scholar] [CrossRef]
- Martín, J.C.; Nombela, G. Microeconomic impacts of investments in high speed trains in Spain. Ann. Reg. Sci. 2007, 41, 715–733. [Google Scholar] [CrossRef]
- Hofer, C.; Windle, R.J.; Dresner, M.E. Price premiums and low cost carrier competition. Transp. Res. Part E Logist. Transp. Rev. 2008, 44, 864–882. [Google Scholar] [CrossRef]
- Brueckner, J.K.; Lee, D.; Singer, E.S. Airline competition and domestic US airfares: A comprehensive reappraisal. Econ. Transp. 2013, 2, 1–17. [Google Scholar] [CrossRef]
- Xia, W.; Zhang, A. Air and high-speed rail transport integration on profits and welfare: Effects of air-rail connecting time. J. Air Transp. Manag. 2017, 65, 181–190. [Google Scholar] [CrossRef]
- Ma, W.; Wang, Q.; Yang, H.; Zhang, A.; Zhang, Y. Effects of Beijing-Shanghai high-speed rail on air travel: Passenger types, airline groups and tacit collusion. Res. Transp. Econ. 2019, 74, 64–76. [Google Scholar] [CrossRef]
- Liu, S.; Wan, Y.; Ha, H.-K.; Yoshida, Y.; Zhang, A. Impact of high-speed rail network development on airport traffic and traffic distribution: Evidence from China and Japan. Transp. Res. Part A Policy Pract. 2019, 127, 115–135. [Google Scholar] [CrossRef]
- Zeng, N.; Wang, Z. Analysis of Beijing-Guangzhou High-Speed Railway Competitiveness Based on Generalized Travel Cost Model. IOP Conf. Ser. Earth Environ. Sci. 2020, 587, 012099. [Google Scholar] [CrossRef]
- Wang, K.; Jiang, C.; Ng, A.K.; Zhu, Z. Air and rail connectivity patterns of major city clusters in China. Transp. Res. Part A Policy Pract. 2020, 139, 35–53. [Google Scholar] [CrossRef]
- Wang, C.; Jiang, C.; Zhang, A. Effects of Airline Entry on High-Speed Rail. Transp. Res. Part B Methodol. 2021, 154, 242–265. [Google Scholar] [CrossRef]
- Bergantino, A.S.; Capozza, C. One price for all? Price discrimination and market captivity: Evidence from the Italian city-pair markets. Transp. Res. Part A Policy Pract. 2015, 75, 231–244. [Google Scholar] [CrossRef]
- Bergantino, A.S.; Capozza, C.; Capurso, M. The impact of open access on intra- and inter-modal rail competition. A national level analysis in Italy. Transp. Policy 2015, 39, 77–86. [Google Scholar] [CrossRef]
- Capozza, C. The effect of rail travel time on airline fares: First evidence from the Italian passenger market. Econ. Transp. 2016, 6, 18–24. [Google Scholar] [CrossRef]
- Bilotkach, V.; Fageda, X.; Flores-Fillol, R. Scheduled service versus personal transportation: The role of distance. Reg. Sci. Urban Econ. 2010, 40, 60–72. [Google Scholar] [CrossRef]
- Chai, J.; Zhou, Y.; Zhou, X.; Wang, S.; Zhang, Z.G.; Liu, Z. Analysis on shock effect of China’s high-speed railway on aviation transport. Transp. Res. Part A Policy Pract. 2018, 108, 35–44. [Google Scholar] [CrossRef]
- Kroes, E.; Savelberg, F. Substitution from Air to High-Speed Rail: The Case of Amsterdam Airport. Transp. Res. Rec. 2019, 2673, 166–174. [Google Scholar] [CrossRef]
- Yu, K.; Strauss, J.; Liu, S.; Li, H.; Kuang, X.; Wu, J. Effects of railway speed on aviation demand and CO2 emissions in China. Transp. Res. Part D Transp. Environ. 2021, 94, 102772. [Google Scholar] [CrossRef]
- Dobruszkes, F. High-speed rail and air transport competition in Western Europe: A supply-oriented perspective. Transp. Policy 2011, 18, 870–879. [Google Scholar] [CrossRef]
- Ntzoufras, I. Bayesian Modeling Using WinBUGS.; John Wiley & Sons: Hoboken, NJ, USA, 2008; Volume 148, pp. 1–492. [Google Scholar] [CrossRef]
- Rahmatunnisa, S.N.; Utami, A.; Nurhidayat, A.Y. Probability of Movement Passengers in Rail-Based Mass Transportation (Case Study between Argo Parahyangan and Jakarta Bandung High-speed Rail). Ge-STRAM 2021, 4, 91–96. [Google Scholar]
- Li, J.; Weng, J.; Shao, C.; Guo, H. Cluster-Based Logistic Regression Model for Holiday Travel Mode Choice. Procedia Eng. 2016, 137, 729–737. [Google Scholar] [CrossRef]
- Alderighi, M.; Cento, A.; Nijkamp, P.; Rietveld, P. Competition in the European aviation market: The entry of low-cost airlines. J. Transp. Geogr. 2012, 24, 223–233. [Google Scholar] [CrossRef]
- Wang, K.; Xia, W.; Zhang, A.; Zhang, Q. Effects of train speed on airline demand and price: Theory and empirical evidence from a natural experiment. Transp. Res. Part B Methodol. 2018, 114, 99–130. [Google Scholar] [CrossRef]
- Zhang, F.; Graham, D.J.; Wong, M.S.C. Quantifying the substitutability and complementarity between high-speed rail and air transport. Transp. Res. Part A Policy Pract. 2018, 118, 191–215. [Google Scholar] [CrossRef]
- Hong, S.-J.; Najmi, H. Impact of High-speed rail on air travel demand between Dallas and Houston applying Monte Carlo simulation. J. Air Transp. Manag. 2022, 102, 102222. [Google Scholar] [CrossRef]
- Schafer, A.; Victor, D.G. The future mobility of the world population. Transp. Res. Part A Policy Pract. 2000, 34, 171–205. [Google Scholar] [CrossRef]
- Gundelfinger-Casar, J.; Coto-Millán, P. Intermodal competition between high-speed rail and air transport in Spain. Util. Policy 2017, 47, 12–17. [Google Scholar] [CrossRef]
- Dobruszkes, F.; Dehon, C.; Givoni, M. Does European high-speed rail affect the current level of air services? An EU-wide analysis. Transp. Res. Part A Policy Pract. 2014, 69, 461–475. [Google Scholar] [CrossRef]
- Yang, H.; Zhang, A. Effects of high-speed rail and air transport competition on prices, profits and welfare. Transp. Res. Part B Methodol. 2012, 46, 1322–1333. [Google Scholar] [CrossRef]
- Zhang, Q.; Yang, H.; Wang, Q.; Zhang, A. Market power and its determinants in the Chinese airline industry. Transp. Res. Part A Policy Pract. 2014, 64, 1–13. [Google Scholar] [CrossRef]
- Delaplace, M.; Dobruszkes, F. From low-cost airlines to low-cost high-speed rail? The French case. Transp. Policy 2015, 38, 73–85. [Google Scholar] [CrossRef]
- Fourie, C.; Lubbe, B. Determinants of selection of full-service airlines and low-cost carriers—A note on business travellers in South Africa. J. Air Transp. Manag. 2006, 12, 98–102. [Google Scholar] [CrossRef]
- Givoni, M.; Dobruszkes, F. A Review of Ex-Post Evidence for Mode Substitution and Induced Demand Following the Introduction of High-Speed Rail. Transp. Rev. 2013, 33, 720–742. [Google Scholar] [CrossRef]
- Wang, J.; Jiao, J.; Du, C.; Hu, H. Competition of spatial service hinterlands between high-speed rail and air transport in China: Present and future trends. J. Geogr. Sci. 2015, 25, 1137–1152. [Google Scholar] [CrossRef]
- Bergantino, A.S.; Madio, L. Intermodal competition and substitution. HSR versus air transport: Understanding the socio-economic determinants of modal choice. Res. Transp. Econ. 2020, 79, 100823. [Google Scholar] [CrossRef]
- Wei, F.; Chen, J.; Zhang, L. Demand shocks, airline pricing, and high-speed rail substitution: Evidence from the Chinese market. J. Transp. Econ. Policy 2017, 51, 266–289. [Google Scholar] [CrossRef]
- 7 High-Speed Rail in the World; Katadata: Jakarta, Indonesia, 2018; Volume 1000, p. 2018.
- Zhang, Q.; Yang, H.; Wang, Q.; Zhang, A.; Zhang, Y. Impact of high-speed rail on market concentration and Lerner index in China’s airline market. J. Air Transp. Manag. 2020, 83, 101755. [Google Scholar] [CrossRef]
- Li, X.; Willems, P. Probabilistic flood prediction for urban sub-catchments using sewer models combined with logistic regression models. Urban Water J. 2019, 16, 687–697. [Google Scholar] [CrossRef]
- Aswi, A.; Cramb, S.; Duncan, E.; Hu, W.; White, G.; Mengersen, K. Bayesian Spatial Survival Models for Hospitalisation of Dengue: A Case Study of Wahidin Hospital in Makassar, Indonesia. Int. J. Environ. Res. Public Health 2020, 17, 878. [Google Scholar] [CrossRef]
- Meliza, B.D.; Bustan, M.N.; Sudarmin, S. Analisis Regresi Logistik dengan Metode Penduga Bayes untuk Menentukan Faktor-Faktor Yang Berpengaruh Terhadap Kejadian Kanker Payudara (Studi Kasus: Pasien Kanker Payudara di Rumah sakit Dr. Wahidin Sudirohusodo). VARIANSI J. Stat. Its Appl. Teach. Res. 2020, 2, 51–61. [Google Scholar] [CrossRef]
- Peer, S.; Koopmans, C.C.; Verhoef, E.T. Prediction of travel time variability for cost-benefit analysis. Transp. Res. Part A Policy Pract. 2012, 46, 79–90. [Google Scholar] [CrossRef]
- Marazi, N.F.; Majumdar, B.B.; Sahu, P.K.; Potoglou, D. Congestion pricing acceptability among commuters: An Indian perspective. Res. Transp. Econ. 2022, 95, 101180. [Google Scholar] [CrossRef]
- Chatterjee, D.; Mukherjee, B. Potential Hospital Location Selection using AHP: A Study in Rural India. Int. J. Comput. Appl. 2013, 71, 1–7. [Google Scholar] [CrossRef]
- D’Alfonso, T.; Jiang, C.; Bracaglia, V. Air transport and high-speed rail competition: Environmental implications and mitigation strategies. Transp. Res. Part A Policy Pract. 2016, 92, 261–276. [Google Scholar] [CrossRef]
- Strauss, J.; Li, H.; Cui, J. High-speed Rail’s impact on airline demand and air carbon emissions in China. Transp. Policy 2021, 109, 85–97. [Google Scholar] [CrossRef]
- Albalate, D.; Bel, G. High-Speed Rail: Lessons for Policy Makers from Experiences Abroad. Public Adm. Rev. 2012, 72, 336–349. [Google Scholar] [CrossRef]
- Li, H.; Wang, K.; Yu, K.; Zhang, A. Are conventional train passengers underserved after entry of high-speed rail?-Evidence from Chinese intercity markets. Transp. Policy 2020, 95, 1–9. [Google Scholar] [CrossRef]
- Wu, J.; Nash, C.; Wang, D. Is high speed rail an appropriate solution to China’s rail capacity problems? J. Transp. Geogr. 2014, 40, 100–111. [Google Scholar] [CrossRef]
- Zhao, J.; Zhao, Y.; Li, Y. The variation in the value of travel-time savings and the dilemma of high-speed rail in China. Transp. Res. Part A Policy Pract. 2015, 82, 130–140. [Google Scholar] [CrossRef]
- Wang, W.; Sun, H.; Wu, J. How does the decision of high-speed rail operator affect social welfare? Considering competition between high-speed rail and air transport. Transp. Policy 2020, 88, 1–15. [Google Scholar] [CrossRef]
- Tsunoda, Y. Transportation policy for high-speed rail competing with airlines. Transp. Res. Part A Policy Pract. 2018, 116, 350–360. [Google Scholar] [CrossRef]
- Socorro, M.P.; Viecens, M.F. The effects of airline and high speed train integration. Transp. Res. Part A Policy Pract. 2013, 49, 160–177. [Google Scholar] [CrossRef]
- Jiang, M.; Jiang, C.; Xiao, Y.-B.; Wang, C. Air-HSR cooperation: Impacts on service frequency and environment. Transp. Res. Part E Logist. Transp. Rev. 2021, 150, 102336. [Google Scholar] [CrossRef]
- Nurhidayat, A.; Utomo, D.; Fajar, R.; Sucipto; Widyastuti, H. Aircraft and High Speed Train Using the Logit Model A Case Study of The Jakarta-Surabaya Route; Atlantis Press: Dordrecht, The Netherlands, 2019; Volume 186, pp. 86–91. [Google Scholar] [CrossRef]
- Sfeir, G.; Abou-Zeid, M.; Kaysi, I. Multivariate count data models for adoption of new transport modes in an organization-based context. Transp. Policy 2020, 91, 59–75. [Google Scholar] [CrossRef]
- Aghaabbasi, M.; Asadi-Shekari, Z.; Shah, M.Z.; Olakunle, O.; Armaghani, D.J.; Moeinaddini, M. Predicting the use frequency of ride-sourcing by off-campus university students through random forest and Bayesian network techniques. Transp. Res. Part A Policy Pract. 2020, 136, 262–281. [Google Scholar] [CrossRef]
- Li, X.; Ma, R.; Guo, Y.; Wang, W.; Yan, B.; Chen, J. Investigation of factors and their dynamic effects on intercity travel modes competition. Travel Behav. Soc. 2021, 23, 166–176. [Google Scholar] [CrossRef]
- Wang, J.; Song, H.; Fu, T.; Behan, M.; Jie, L.; He, Y.; Shangguan, Q. Crash prediction for freeway work zones in real time: A comparison between Convolutional Neural Network and Binary Logistic Regression model. Int. J. Transp. Sci. Technol. 2021, 11, 484–495. [Google Scholar] [CrossRef]
- Bonnafous, A. The regional impact of the TGV. Transportation 1987, 14, 127–137. [Google Scholar] [CrossRef]
- Pagliara, F.; Vassallo, J.M.; Román, C. High-Speed Rail versus Air Transportation: Case Study of Madrid–Barcelona, Spain. Transp. Res. Rec. 2012, 2289, 10–17. [Google Scholar] [CrossRef]
- Givoni, M.; Rietveld, P. Airline’s choice of aircraft size–Explanations and implications. Transp. Res. Part A Policy Pract. 2009, 43, 500–510. [Google Scholar] [CrossRef]


| Number | Country | Documents | Citations | Total Link Strength |
|---|---|---|---|---|
| 1 | China | 1339 | 10,853 | 403 |
| 2 | United Kingdom | 189 | 3131 | 176 |
| 3 | United States | 113 | 1938 | 122 |
| 4 | Spain | 88 | 1546 | 47 |
| 5 | Italy | 59 | 1033 | 43 |
| 6 | Japan | 44 | 404 | 26 |
| 7 | South Korea | 43 | 272 | 12 |
| 8 | France | 37 | 364 | 21 |
| 9 | Hong Kong | 35 | 754 | 44 |
| 10 | Germany | 34 | 488 | 33 |
| 11 | Canada | 33 | 1081 | 48 |
| 12 | The Netherlands | 29 | 636 | 28 |
| 13 | Russian Federation | 27 | 117 | 4 |
| 14 | Australia | 26 | 592 | 33 |
| 15 | Sweden | 23 | 208 | 16 |
| 16 | Indonesia | 17 | 37 | 3 |
| 17 | Poland | 17 | 85 | 8 |
| 18 | Portugal | 17 | 243 | 23 |
| 19 | Taiwan | 17 | 75 | 5 |
| 20 | India | 16 | 58 | 5 |
| Type of Model | Research Method | Market | Papers |
|---|---|---|---|
| Binary logit model | Survey | Seoul–Daegu (South Korea), Iran, Indonesia, China | [1,8,28,41,42] |
| Nested logit model | Survey | Madrid–Barcelona (Spain), Italy, Japan | [10,11,39,43,44,45] |
| Multinomial logit model | Survey | UK, France, China, South Korea, Australia, Spain | [1,20,46,47,48,49] |
| Regression models | Panel data | USA, Spain, Japan, France, Italy, The Netherland | [12,14,17,18,21,22,23,30,31,50,51,52,53,54,55,56,57,58,59,60,61,62,63,64] |
| Regression models | Survey | Europe, China, Indonesia | [36,65,66,67] |
| Logistic regression model | Survey | China, Indonesia | [28,68] |
| Econometric models | Panel data | China, Europe | [2,22,25,69] |
| DID method | Panel data | China, Japan, South Korea, Taiwan | [6,9,35,40,70,71] |
| Monte Carlo simulation | Survey | Dallas and Houston, USA | [72] |
| Variables | Market | Papers |
|---|---|---|
| Travel time | South Korea, Spain, Italy, UK, France, Japan, China | [2,7,11,18,20,23,36,39,43,65,70,74] |
| Travel cost, fare | South Korea, Spain, Italy, UK, France, USA, Japan | [2,7,8,10,11,20,22,39,43,50,51,65] |
| Frequency | South Korea, Spain, UK, France, Japan | [2,7,8,20,39,43,65,75] |
| Distance | South Korea, UK, France, China, USA, Japan | [2,8,20,22,35,40,50,51,69,75,76] |
| Population | USA, Europe, Spain, China, Japan, South Korea | [2,21,22,23,40,51,75] |
| GDP | Europe, China, Japan, South Korea | [2,22,23,40,69,75] |
| Access time | Spain, Italy, China, Japan | [10,11,36,39,43,76] |
| Income | Spain, China | [21,28,36] |
| Waiting time | Spain | [10] |
| Comfort | Spain | [19,43] |
| Papers | Method | Dist. | Results |
|---|---|---|---|
| [8] | RP | 293 | Air traffic dropped 28% after HSR operation. |
| [10] | SP and RP | 625 | The market reach of the Madrid–Barcelona high-speed rail exceeds the previously estimated 35% analysis by about 50%. |
| [76] | - | - | Price and scheduling frequency are both treated as choice variables in a numerical study of China’s markets. |
| [19] | Data | - | The extension of the high-speed rail has become a major competitor in the air radial and interior connections that run parallel to an AVE line, forcing airlines to employ smaller planes and even causing the cancellation of some routes. |
| [69] | City-pairs and airfare monthly data | - | The price levels of the business and leisure segments are reduced as a result of rivalry between FSCs; the average fare decreases in the business and leisure classes are EUR 232 and 113, respectively. |
| [23] | Level year panel data (route) | - | Low-cost carriers have had a greater impact on expanding air travel, mainly through medium routes, which have seen a 50% decline in air traffic due to increased daily HSR trips. |
| [75] | Level cross sectional data | - | With shorter HSR travel times, fewer air seats and frequencies are available. The impact of HSR journey time on air services is substantially greater than the impact of HSR frequency. |
| [21] | Time series monthly data | - | The air transport mode accounted for only 13.9% of HSR passenger demand. |
| [36] | SP | The most critical aspect impacting the AH service’s market share is the en route travel/journey time. | |
| [7] | SP | - | Business travellers were more likely than leisure passengers to choose a safe method of transport regardless of fee, whereas leisure passengers preferred to buy at duty-free shops. |
| [74] | Observations on a monthly | - | Demand for air travel has decreased as a result of greater competition from high-speed rail. |
| [18] | Panel data | - | In general, the introduction of new HSR lines reduces air transport demand by 27%. |
| [70] | Panel data | - | The impact of HSR speed on airline traffic is greater than the impact of HSR speed on airline fare. |
| [9] | Level year panel data (route) | - | Due to an increase in the frequency of daily HSR journeys, shows a 50% drop in air travel. |
| [53] | Panel data | - | Following the introduction of HSR, there was a lesser decline in both airfare and air travel demand on the routes served. |
| [30] | Panel data | - | The operation of the independently owned LCR has an impact on current rail, FSR and air traffic. |
| [6] | Survey | - | The effects of the HSR extension on FSC’s airfares were consistently negative, with the negative effects being more pronounced in the short-haul sectors. |
| [57] | Panel data | It reduces HSR service frequencies, but it reduces HSR service frequencies with a short number of stops even more. | |
| [48] | SP | 247 | The estimate derived from our data is 26% of diverted air transport traffic. |
| [49] | SP | - | Railways’ market share will increase from 8.9% in 2000 to 22.8% in 2010, and HSR will be able to compete with AT over lengths greater than 500 km. |
| [33] | Data | 1069 | HSR can reduce AT frequency by up to 32% on a daily basis. |
| [80] | Data | Two–four years following the implementation of HSR, induced demand will be in the range of 10–20%. | |
| [81] | Data | In China, HSR has the potential to reduce AT’s market share for medium-haul travel. | |
| [71] | Level year panel data (route) | In medium-haul routes, the substitution effect is most noticeable (between 500 and 1000 km). | |
| [14] | Level monthly panel data (route) | - | Shows that air operations are reduced by 17% due to the introduction of high-speed rail. |
| [77] | Level quarterly panel data (route) | The advent of HSR puts downward pressure on the airline Lerner index and yield by 15.5 and 14.6%, respectively. | |
| [59] | Level daily panel data (route) | - | The Rome Fiumicino–Milan Linate route is 15.5% cheaper, and the Rome Fiumicino–Milan Linate route is 29% cheaper. HSR competition on the Milan–Malpensa route. |
| [60] | Level daily panel data (route) | - | Airlines can raise air fares by 3.9% due to a 10% increase in train journey time. |
| [61] | Level monthly panel data (route) | - | Based on the full sample, HSR may exert a positive pressure on airline flight frequencies, although no statistically significant influence was identified in subsamples of short-haul routes (less than 550 km). |
| [82] | SP and RP | - | Found that air transport (air-to-HSR) and conventional rail services are more likely to cause a demand shift (rail-to-HSR). |
| [21] | Panel data (route) | - | During the period 1999–2012, air travel accounted for only 13.9% of HSR passenger demand. |
| [62] | Panel data | - | HSR travel time has a shock effect on flight transport. |
| [12] | Panel data | - | The inclusion of HSR reduces air passenger volume by 17.88% and flight frequency by 15.80%. |
| [14] | Route-level data | - | The inclusion of HSR reduces air travel demand by 17%. |
| [63] | Survey | - | There is a reduction in flight frequency due to HSR. |
| [64] | Panel data | - | Number of airline passengers declined by 29.84% for all market segments. |
| [83] | Panel data | HSR as a low-end substitute for air travel in China. |
| Travel Attribute | Number of Studies | Percentage |
|---|---|---|
| Travel Time | 31 | 18.02% |
| Travel Cost/Fare | 28 | 16.28% |
| Frequency | 24 | 13.95% |
| Travel Distance | 24 | 13.95% |
| Population | 22 | 12.79% |
| GDP | 18 | 10.47% |
| Access Time | 14 | 8.14% |
| Level of Income | 11 | 6.40% |
| Total | 172 | 100% |
Disclaimer/Publisher’s Note: The statements, opinions and data contained in all publications are solely those of the individual author(s) and contributor(s) and not of MDPI and/or the editor(s). MDPI and/or the editor(s) disclaim responsibility for any injury to people or property resulting from any ideas, methods, instructions or products referred to in the content. |
© 2023 by the authors. Licensee MDPI, Basel, Switzerland. This article is an open access article distributed under the terms and conditions of the Creative Commons Attribution (CC BY) license (https://creativecommons.org/licenses/by/4.0/).
Share and Cite
Nurhidayat, A.Y.; Widyastuti, H.; Sutikno; Upahita, D.P. Research on Passengers’ Preferences and Impact of High-Speed Rail on Air Transport Demand. Sustainability 2023, 15, 3060. https://doi.org/10.3390/su15043060
Nurhidayat AY, Widyastuti H, Sutikno, Upahita DP. Research on Passengers’ Preferences and Impact of High-Speed Rail on Air Transport Demand. Sustainability. 2023; 15(4):3060. https://doi.org/10.3390/su15043060
Chicago/Turabian StyleNurhidayat, Asep Yayat, Hera Widyastuti, Sutikno, and Dwi Phalita Upahita. 2023. "Research on Passengers’ Preferences and Impact of High-Speed Rail on Air Transport Demand" Sustainability 15, no. 4: 3060. https://doi.org/10.3390/su15043060