Article

Revisiting the Value of Various Ecosystems: Considering Spatiality and Disaster Concern

by
Kento Komatsubara
,
Alexander Ryota Keeley
and
Shunsuke Managi
*
Urban Institute & Department of Civil Engineering, Kyushu University, 744 Motooka, Nishi-ku, Fukuoka 819-0395, Japan
*
Author to whom correspondence should be addressed.
Sustainability 2023, 15(4), 3154; https://doi.org/10.3390/su15043154
Submission received: 8 November 2022 / Revised: 12 January 2023 / Accepted: 7 February 2023 / Published: 9 February 2023

Abstract

:
Recently, concerns about ecosystem loss and the threat of disasters have emerged. Understanding people’s perception of the ecosystem’s value will lead to disaster adaptation through ecosystem conservation. We incorporated use and disaster attributes into a contingent valuation study to investigate Japanese peoples’ perceptions of the value of various ecosystems. We construct a concept representing ecosystems’ perceived disaster prevention and mitigation functions by investigating the effects of use status and disaster concerns on people’s preferences. Results revealed that almost all of the ecosystem’s disaster prevention and mitigation functions are not perceived by people. In some cases, people mistakenly avoid ecosystems that protect people from disasters. In conclusion, this concept and its findings facilitate an understanding of people’s perceptions of disaster prevention mitigation functions of ecosystems and promote the concrete practice of conserving ecosystems.

Graphical Abstract

1. Introduction

In recent years, with the increasingly intense climate change, concerns about coastal erosion, ecosystem loss (indeed, natural capital in many countries is declining [1]), and even the threat of disasters have emerged. Disasters caused by climate change and associated environmental degradation impact low-income people tremendously [2]. Therefore, disaster adaptation through ecosystem conservation has been identified as one of the most critical issues for achieving a sustainable society and combating climate change [3]. The Changwon Declaration noted that creating and restoring natural habitats will help protect coasts and watersheds and reduce their vulnerability to disasters. These natural habitats include beach, tidal, mangrove, seaweed, and kelp habitats, coral and shell reefs, and alternative complements to artificial structures. Such an approach is recognized as one of the practical ones [4].
Rapid global population growth and urbanization, associated with economic growth, increase the risk of natural disaster damage [5]. In particular, rapid population growth and population concentration in cities have resulted in development and land use in areas with high disaster-risk topography and geology and in areas where social disaster prevention infrastructure is lagging, thereby increasing the risk of disaster damage [6].
The urban population is expected to account for roughly two-thirds of the world’s population by 2050, raising the prospect of further degradation of natural capital as the link between population and nature weakens. Thus, resolving this issue will necessitate a greater understanding of the interdependence between ecosystem conservation and human well-being. However, markets and institutions need more economic incentives to conserve natural capital that is not traded in the markets, which may lead to the degradation of natural capital and insufficient provision of ecosystem services.
Thus, public understanding of the ecosystem’s benefits must be broadened to promote specific initiatives.

1.1. Disaster Prevention and Mitigation Functions of Ecosystem Services

Ecosystem services include provisioning, regulating, cultural, supporting, and preserving functions [7] (see Supplementary Data S1 for more detailed information on ecosystem services). The functions of disaster prevention and mitigation are included in the preserving services. Soil conservation, water source recharge, landslide prevention, surface erosion control, watershed storage, and flood mitigation are all functions of forests. Coastal and marine ecosystems such as coastal forests, mangroves, beaches, tidal flats, coral reefs, and seaweed beds serve as natural breakwaters, protecting people from high waves, storm surges, strong winds, blowing sand, and salt damage. Ecosystem provisioning services also include disaster prevention and mitigation functions, although these are often overlooked. Healthy ecosystems can provide water, fuel, and other resources needed for survival until lifelines are restored following a disaster, thereby reducing the vulnerability of local communities. Thus, in the event of a disaster, ecosystems can provide the necessary materials and recover autonomously to assist in recovering local industries and contributing to the restoration of local communities.
Natural ecosystems are also highly resilient to disturbances and adaptable to climate change. These functions, along with discussions on climate change and recent natural disasters, have piqued the interest of disaster prevention and mitigation professionals. However, quantitative discussion about how these functions affect people’s well-being is scant. Green regional planning based on how the enjoyment of disaster prevention and mitigation functions affects people’s welfare will contribute to a more equitable distribution of safety against disasters.
To that end, it is critical to promote understanding by quantitatively and economically assessing the effects of disaster prevention and mitigation functions on human well-being and the value of various ecosystem services provided regularly. The monetary value of the ecosystem and other services can be increased by quantifying ecosystem services, which are nonmarket goods, by their monetary value in virtual markets [8], and policies and institutions can be developed to reward the provision of ecosystem services [9].
Ecosystem services are delivered in a spatially dispersed manner. Thus, considering spatiality in the analysis of the value of various ecosystem services is critically important to make an accurate assessment.

1.2. Spatial Heterogeneity

From a spatial perspective, the costs and benefits of green regional planning are rarely evenly distributed across all areas affected by the project. The (1) relationship between the location of the ecosystem and the location of the population and (2) the availability and characteristics of alternative ecosystems are two spatially essential issues related to assessing project-related benefits. We must recognize that the economic value of ecosystem improvements may depend on the relative locations of people’s settlements and ecosystems. With this in mind, scholars have developed spatial demand models that are both flexible and sophisticated. One of the first economic valuation studies to address spatial issues was a contingent valuation study on the demand for water quality in the United States [10]. This study showed that the farther respondents lived from a river, the less likely they were to visit the river at least once in the previous year. Findings revealed that the visitation rate had a significant and positive impact on demand, and a one-dimensional “distance decay” spatial demand model was developed. However, ecosystem services are rarely distributed uniformly and continuously across the landscape but are patchy and more discrete. From this standpoint, it has been argued that representing spatial location with a single variable measuring distance to resources is overly simplistic [11,12]. As a result, when discussing distance decay, the emphasis is generally on the use status, implying that its effects are primarily related to the user’s preferences for the goods under consideration, and economic demand models must take this into account to make an accurate assessment [13].
Studies focusing on spatial characteristics have since expanded by focusing on the relationship between distance decay effects and the availability of substitutes and the relationship between distance decay effects and the extent of use (users and nonusers of the resource). As a result, research on distance decay in goods has shifted toward a model allowing more spatial patchiness in the preference structure. Pate and Loomis were the first to estimate a demand model and incorporate the availability of substitutes into the distance decay effect test [14]. They conducted a contingent valuation study, which combines distance decay measurements with the level and quantity of alternative resources. Results reveal that the two programs on wetlands and pollution control improvements have significant distance decay effects. They also discovered that the availability of substitutes, as measured by the number of wetland acres in the sampling area, affects demand. Bateman et al. (2008) allowed for more patchiness by examining the effects of distance to the nearest alternative water body and the shore [15]. With the effect of substitutes, WTP increased with increasing distance to the shore, but not at a significant level; Brouwer et al. (2010) used a choice experiment to evaluate the spatial heterogeneity of water quality improvements in both river basins and alternative water bodies simultaneously [16]. This empirical experiment suggests that spatial preferences exist and are significant. However, because the population benefiting from ecosystem improvements is expected to include both users and nonusers [17], both of these individuals are expected to be willing to pay for improvements associated with green regional planning implementation. The relationship between respondents’ current use or nonuse of goods and the spatial characteristics of the goods was first tested by Schaafsma et al. (2013) [18]. They found that users’ preferences are less sensitive to distance to goods than nonusers’ preferences and that nonuser demand decreases faster than user demand with distance to the resource.
The distance decay of multiple ecosystem services was first tested by Reynaud and Lanzanova (2017), who conducted a meta-analysis to address the problem of likelihood dependence on study conditions and predictions [19]. They focused on the interactions of ecosystem services. Their findings suggest several trade-offs between ecosystem services in bodies of water (value as habitat for organisms vs. value as recreation; supply services vs. regulating and cultural services). This also demonstrated that they are predictably based on geographical factors. However, considering a comprehensive green regional policy by only thinking about ecosystem services of a single type of ecosystem, such as a water body, is impossible. To the best of the authors’ knowledge, despite the need for comprehensive comparisons of various ecosystems, no significant studies compare different types of ecosystems. Although the interactions between ecosystem services have been studied, the extent to which these services are related to disaster prevention and mitigation functions has yet to be confirmed because disaster prevention and mitigation functions are a complex of regulating, provisioning, and preserving services. Hence, the relationship between WTP, respondents’ spatial location, the use of ecosystems, and disaster-related factors must be investigated. This study estimates a model that explicitly includes the interaction between disaster experience and anxiousness and respondents’ use status (respondents are categorized as users and nonusers). Furthermore, potential effects were directly compared between users and nonusers of 12 ecosystems. By examining the relationship between preferences for ecosystems and space, use, and disasters, the analytical framework presented in this study will allow us to discuss responses to frequent disasters caused by climate change. It is hoped that this study will result in evidence-based green regional planning, project implementation, and improved regional welfare.
The rest of this paper is structured as follows. Section 2 describes the materials and methods used in this study. Section 3 presents and discusses the empirical results. Finally, Section 4 presents the conclusions.

2. Materials and Methods

2.1. Data Description

The analysis is based on data from a contingent valuation survey on natural capital conservation conducted throughout Japan in February 2019. Figure 1 depicts the sample area. The questionnaire was distributed to a sample from an Internet panel to collect data. Internet panel sampling yielded data and results comparable to mail surveys in Japan. The sample consists of 7556 persons (households), resulting from collecting as many samples as possible within the budget of resources available for this research.
Personal attributes to be obtained were determined following the preceding studies introduced in the previous section, and some of the personal attributes such as disaster experience were also included to address the research question of this study. These attributes (age, gender, household income, educational background, subjective well-being, frequency of visits to the ecosystems, disaster experience, and residence at the 1 km square resolution) were collected in addition to respondents’ ecological preferences. Due to insufficient data, respondents with significantly shorter response times and those who answered “others”, “do not know”, or “do not want to answer” for household income and educational background were excluded from the analysis. After sorting the sample, we obtained an adequate sample size of 4851. The effective response rate was 64.20%. Figure 2 displays descriptive statistics for the variables in this study’s survey sample. Income is slightly larger than the parent set. Age ranges from 18 to 69. As shown in “family size”, there are similar proportions of one-person households, two-person households, three-person households with assumed nuclear families, and households with four or more members. As shown in “sex”, there is a bias toward male respondents. The head of the household was asked to respond to this survey. As shown in “live in a megalopolis”, 71% of respondents were from non-metropolitan areas. Since this study focuses on ecosystems, we wanted to collect a sample from non-metropolitan areas where many ecosystems are distributed. As shown in “graduate university”, about half of the respondents graduated from a university. This is similar to the percentage for Japan as a whole. About half of the respondents have visited land-based ecosystems such as rice paddies, fields, orchards, forests, and sandy beaches (about half have visited pastures). On the other hand, more than half of the respondents have never visited ecosystems in the sea, such as tidal flats, coral reefs, seaweed beds, and mangroves. As indicated by the fact that many respondents have been affected by storms, tornadoes, floods by heavy rain, heavy snow, avalanche, earthquake, and liquefaction, Japan is a region with many natural disasters. This is also why many respondents are concerned about all the disasters listed here. The values for earthquake and liquefaction in particular deserve special mention (see Supplementary Data S2 for more detailed information on the data and survey).
We define users as respondents who have previously visited the ecosystem under consideration and nonusers as respondents who have never visited the ecosystem. Therefore, “use value”, as used in this paper, is the value of all ecosystem services enjoyed by users and differs from use values commonly used in the context of ecosystem services. The “nonuse values”, as used in this paper, include all ecosystem services besides cultural services obtained only through visitation. Follow-up questions in the questionnaire yielded information on the respondents’ use status (Figure 2). The present study examines this disparity by asking respondents whether they have experienced or had concerns about each of the eight disasters, defining who has experienced and who has not, and who has and does not have concerns about each disaster. Follow-up questions in the questionnaire were used to elicit information about the respondents’ disaster-related status (Figure 2).
The survey estimates the WTP for the preservation of various ecosystems. A description of the functions of each ecosystem is provided before the WTP response to help respondents’ understanding of ecosystems. As an evaluation scenario, respondents were given the amount of ecological loss that would occur if nothing was done to maintain the ecosystem. This paper’s analysis is solely based on respondents’ assessment of ecosystem maintenance.
We used a geographic information system to calculate the distance between the respondent’s residence, the nearest point of 12 different ecosystems, and urban green spaces and coastlines as substitutes. The 12 ecosystems were identified and located using open-source spatial data. The information published by the Ministry of Land, Infrastructure, Transport, and Tourism was used to obtain the following data: detailed 100 m grid land-use mesh data from satellite imagery for rice paddies, fields, orchards, and pastures; forest area data for artificial forests, natural forests, and coastal disaster prevention forests; data on local resources and coastal protection facilities for beaches. Meanwhile, we obtained data from the Ministry of the Environment’s Basic Survey on Nature Conservation for tidal flats, coral reefs, mangroves, and seaweed beds. Figure 3 depicts the geographic location of the surveyed ecosystems. In this study, the habitat of tall algae such as kelp is defined as seaweed beds. Therefore, low-back algae such as eelgrass are not targeted in this study (see Supplementary Data S3 for more explicit information on the data).
Figure 4 depicts the geographic location of Japan’s three major metropolitan areas from the Ministry of Land, Infrastructure, Transport, and Tourism information. These are widely recognized as Japan’s three largest metropolitan areas. In these areas, production has always been the core of the industries that support the Japanese economy. The centers of these areas have a fragile ecological connection compared to other areas.

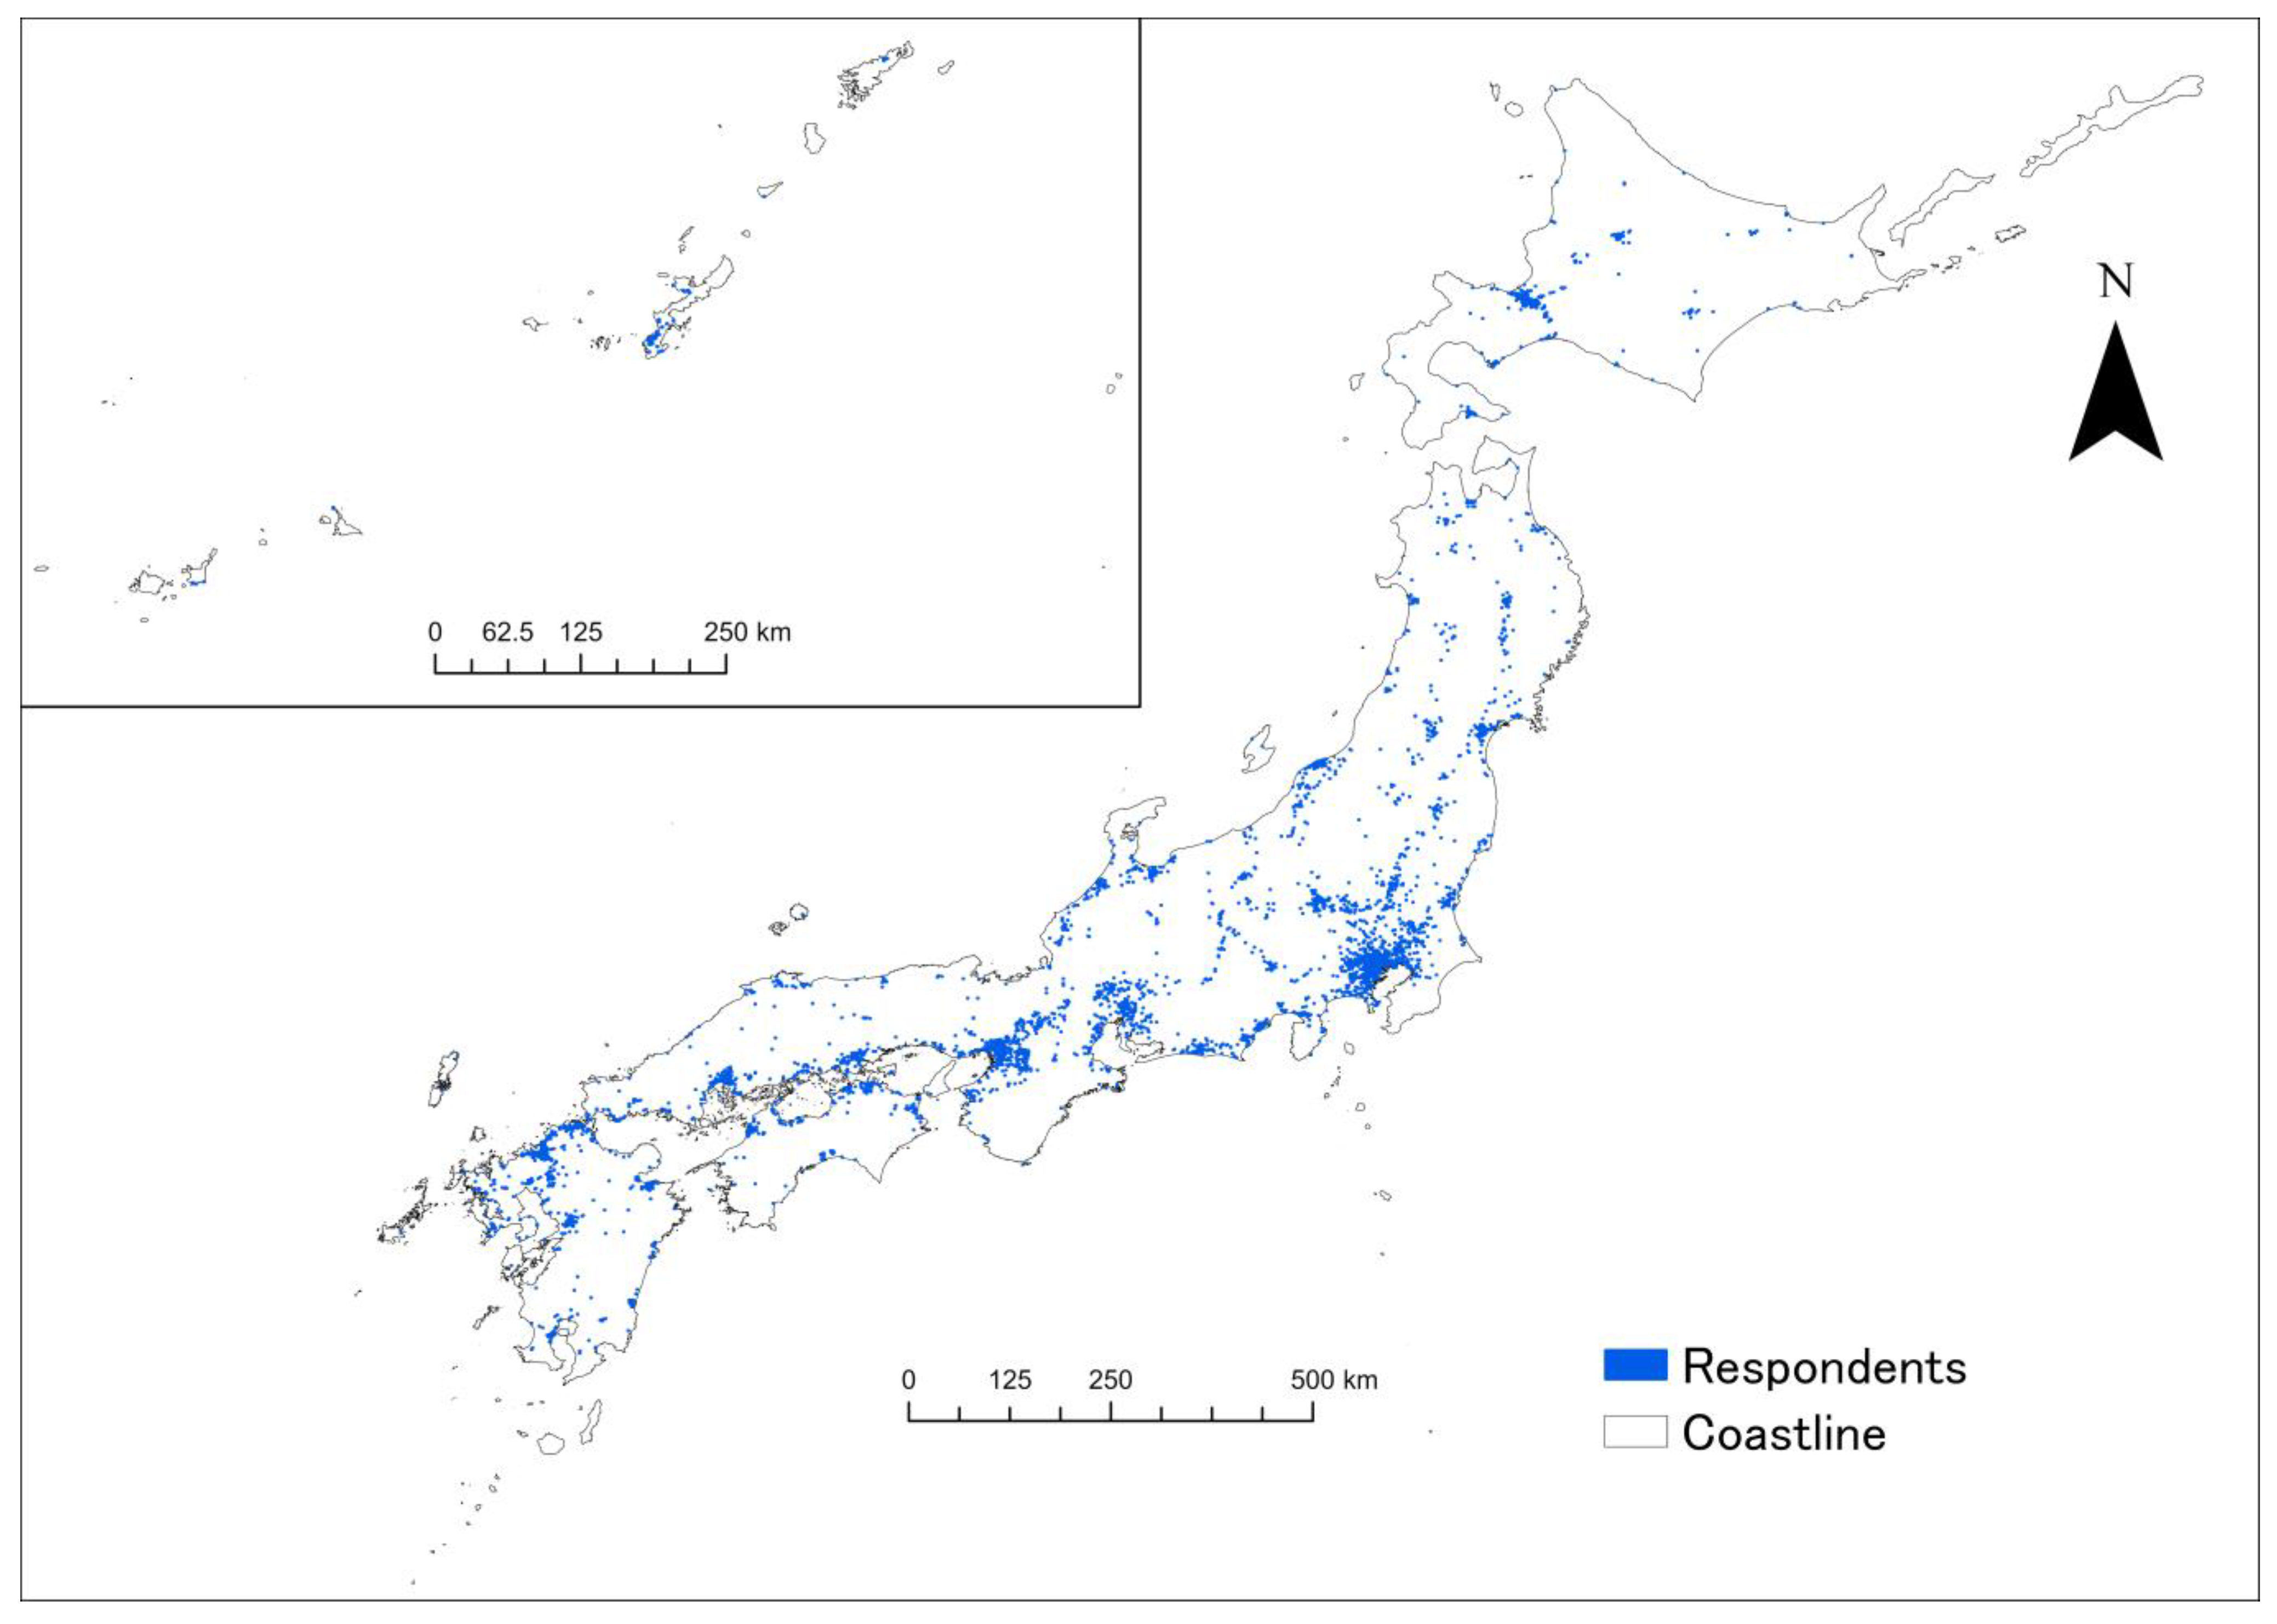
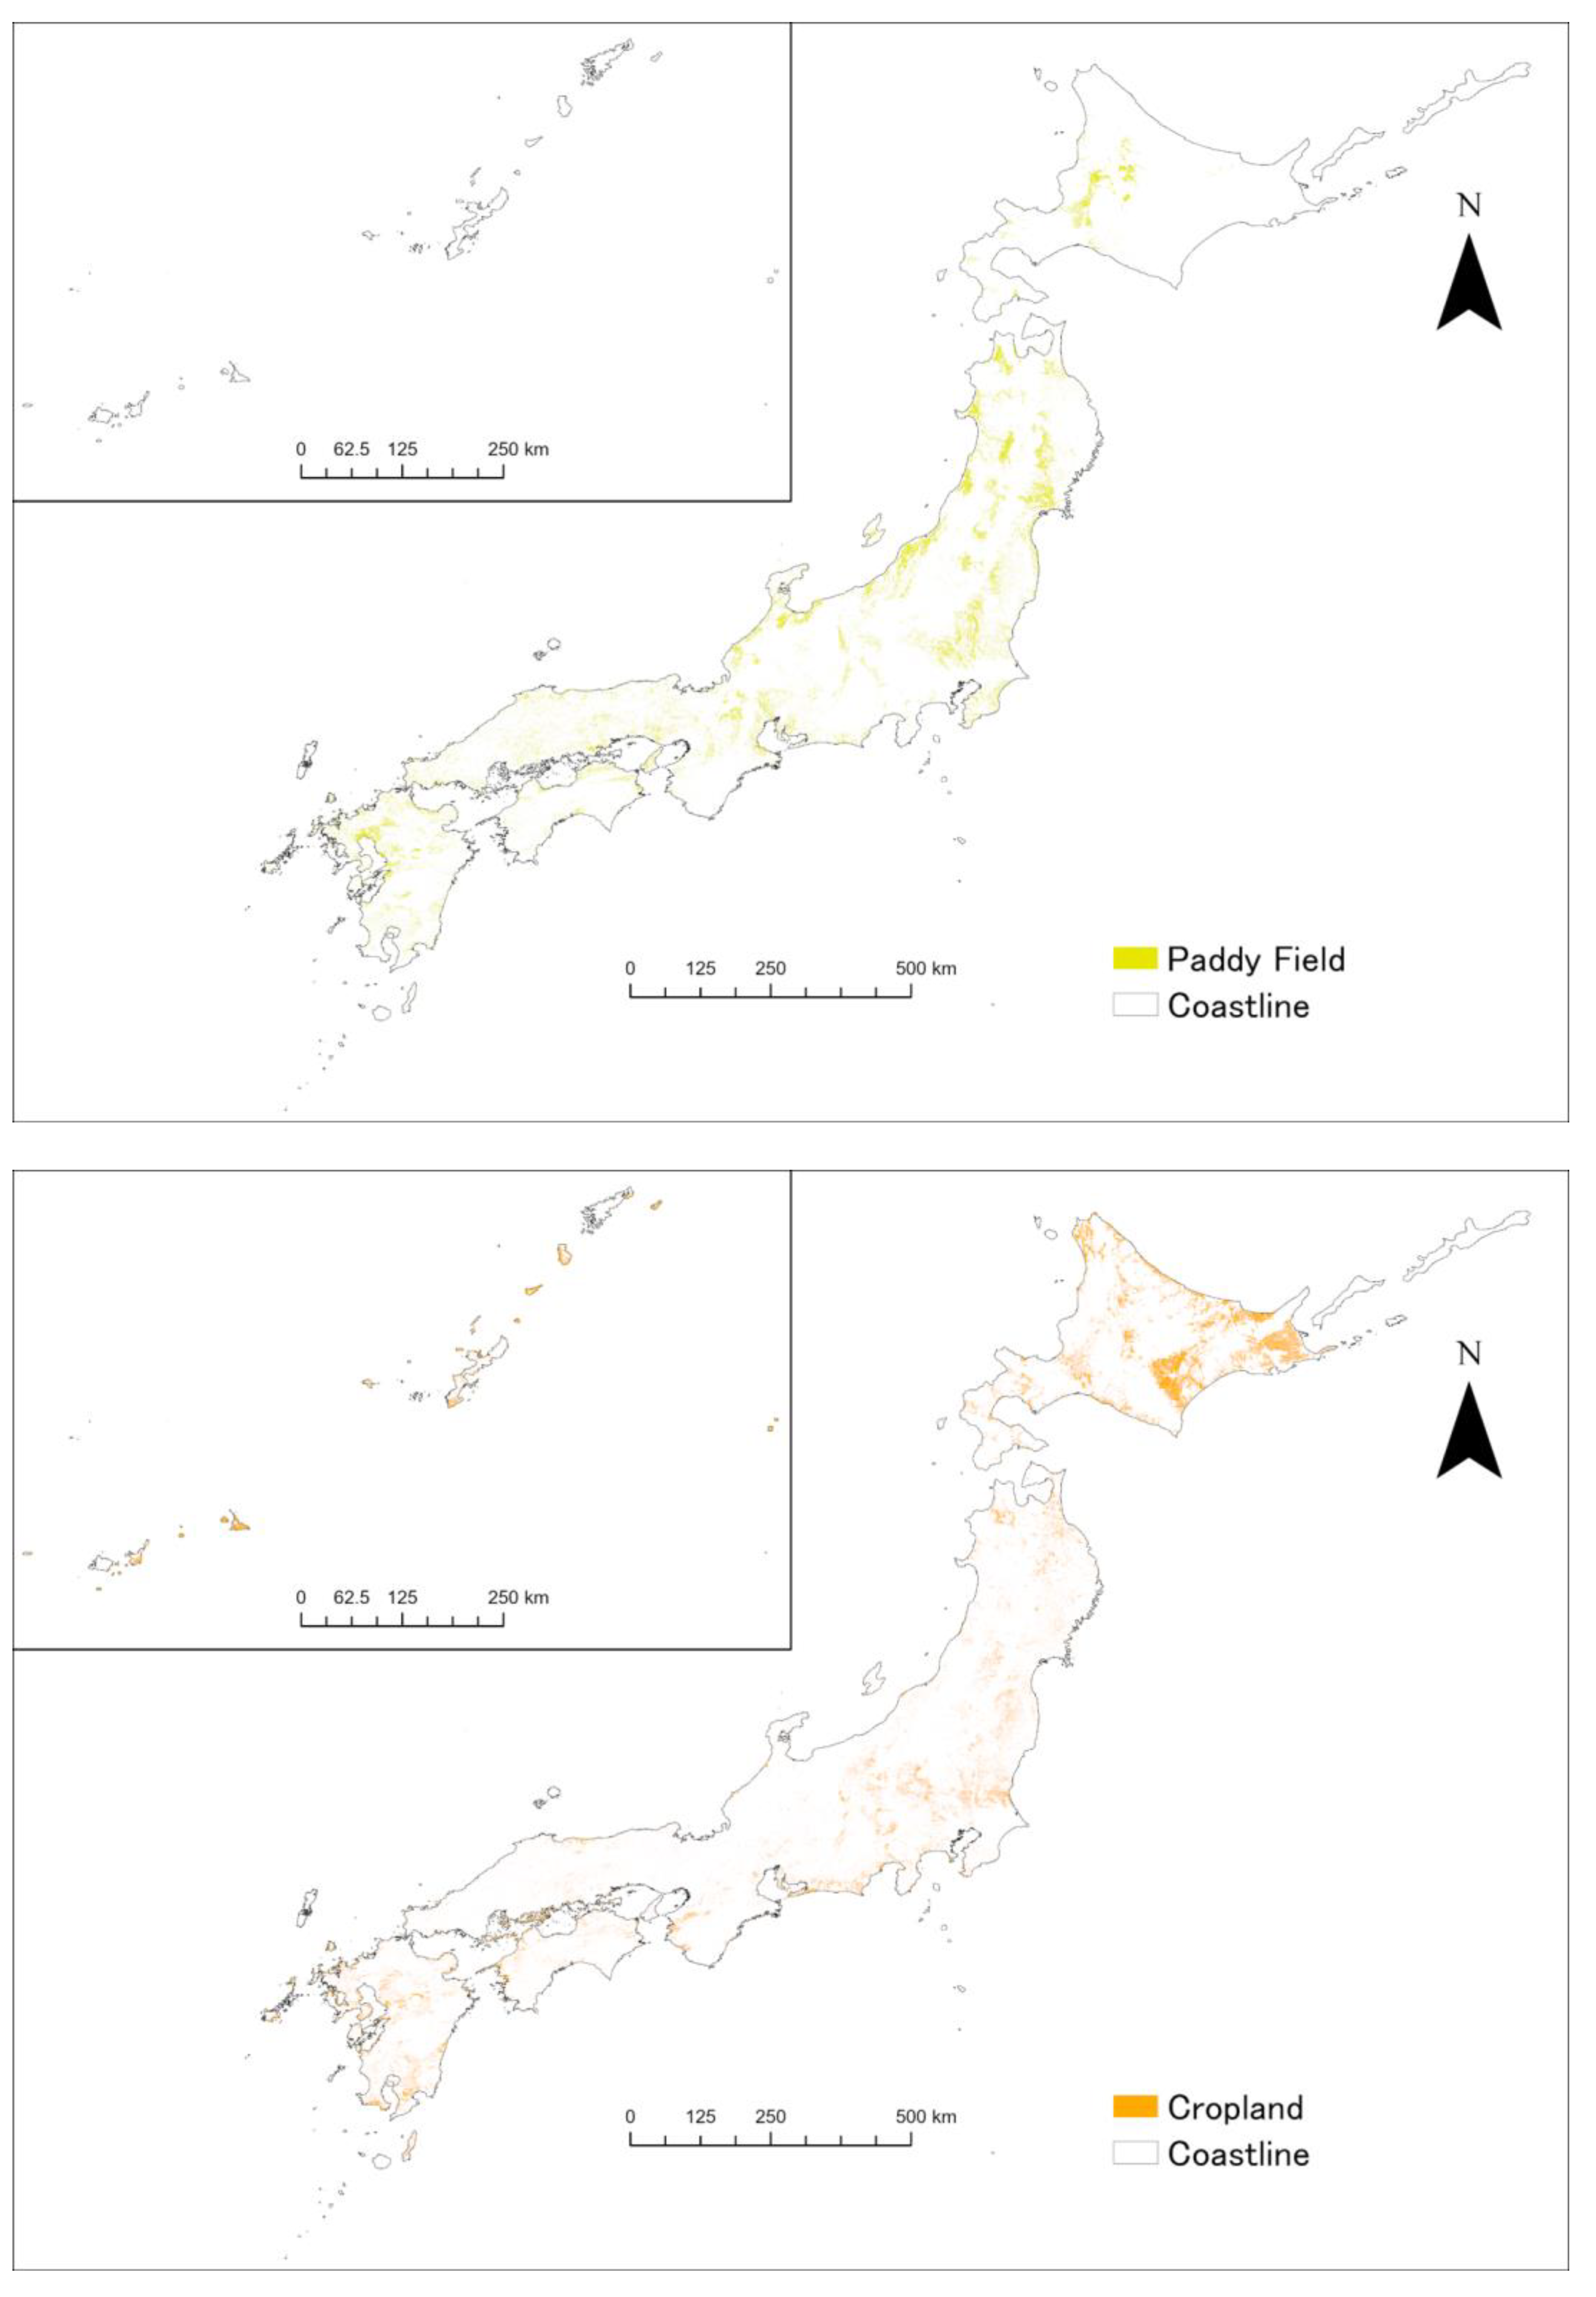
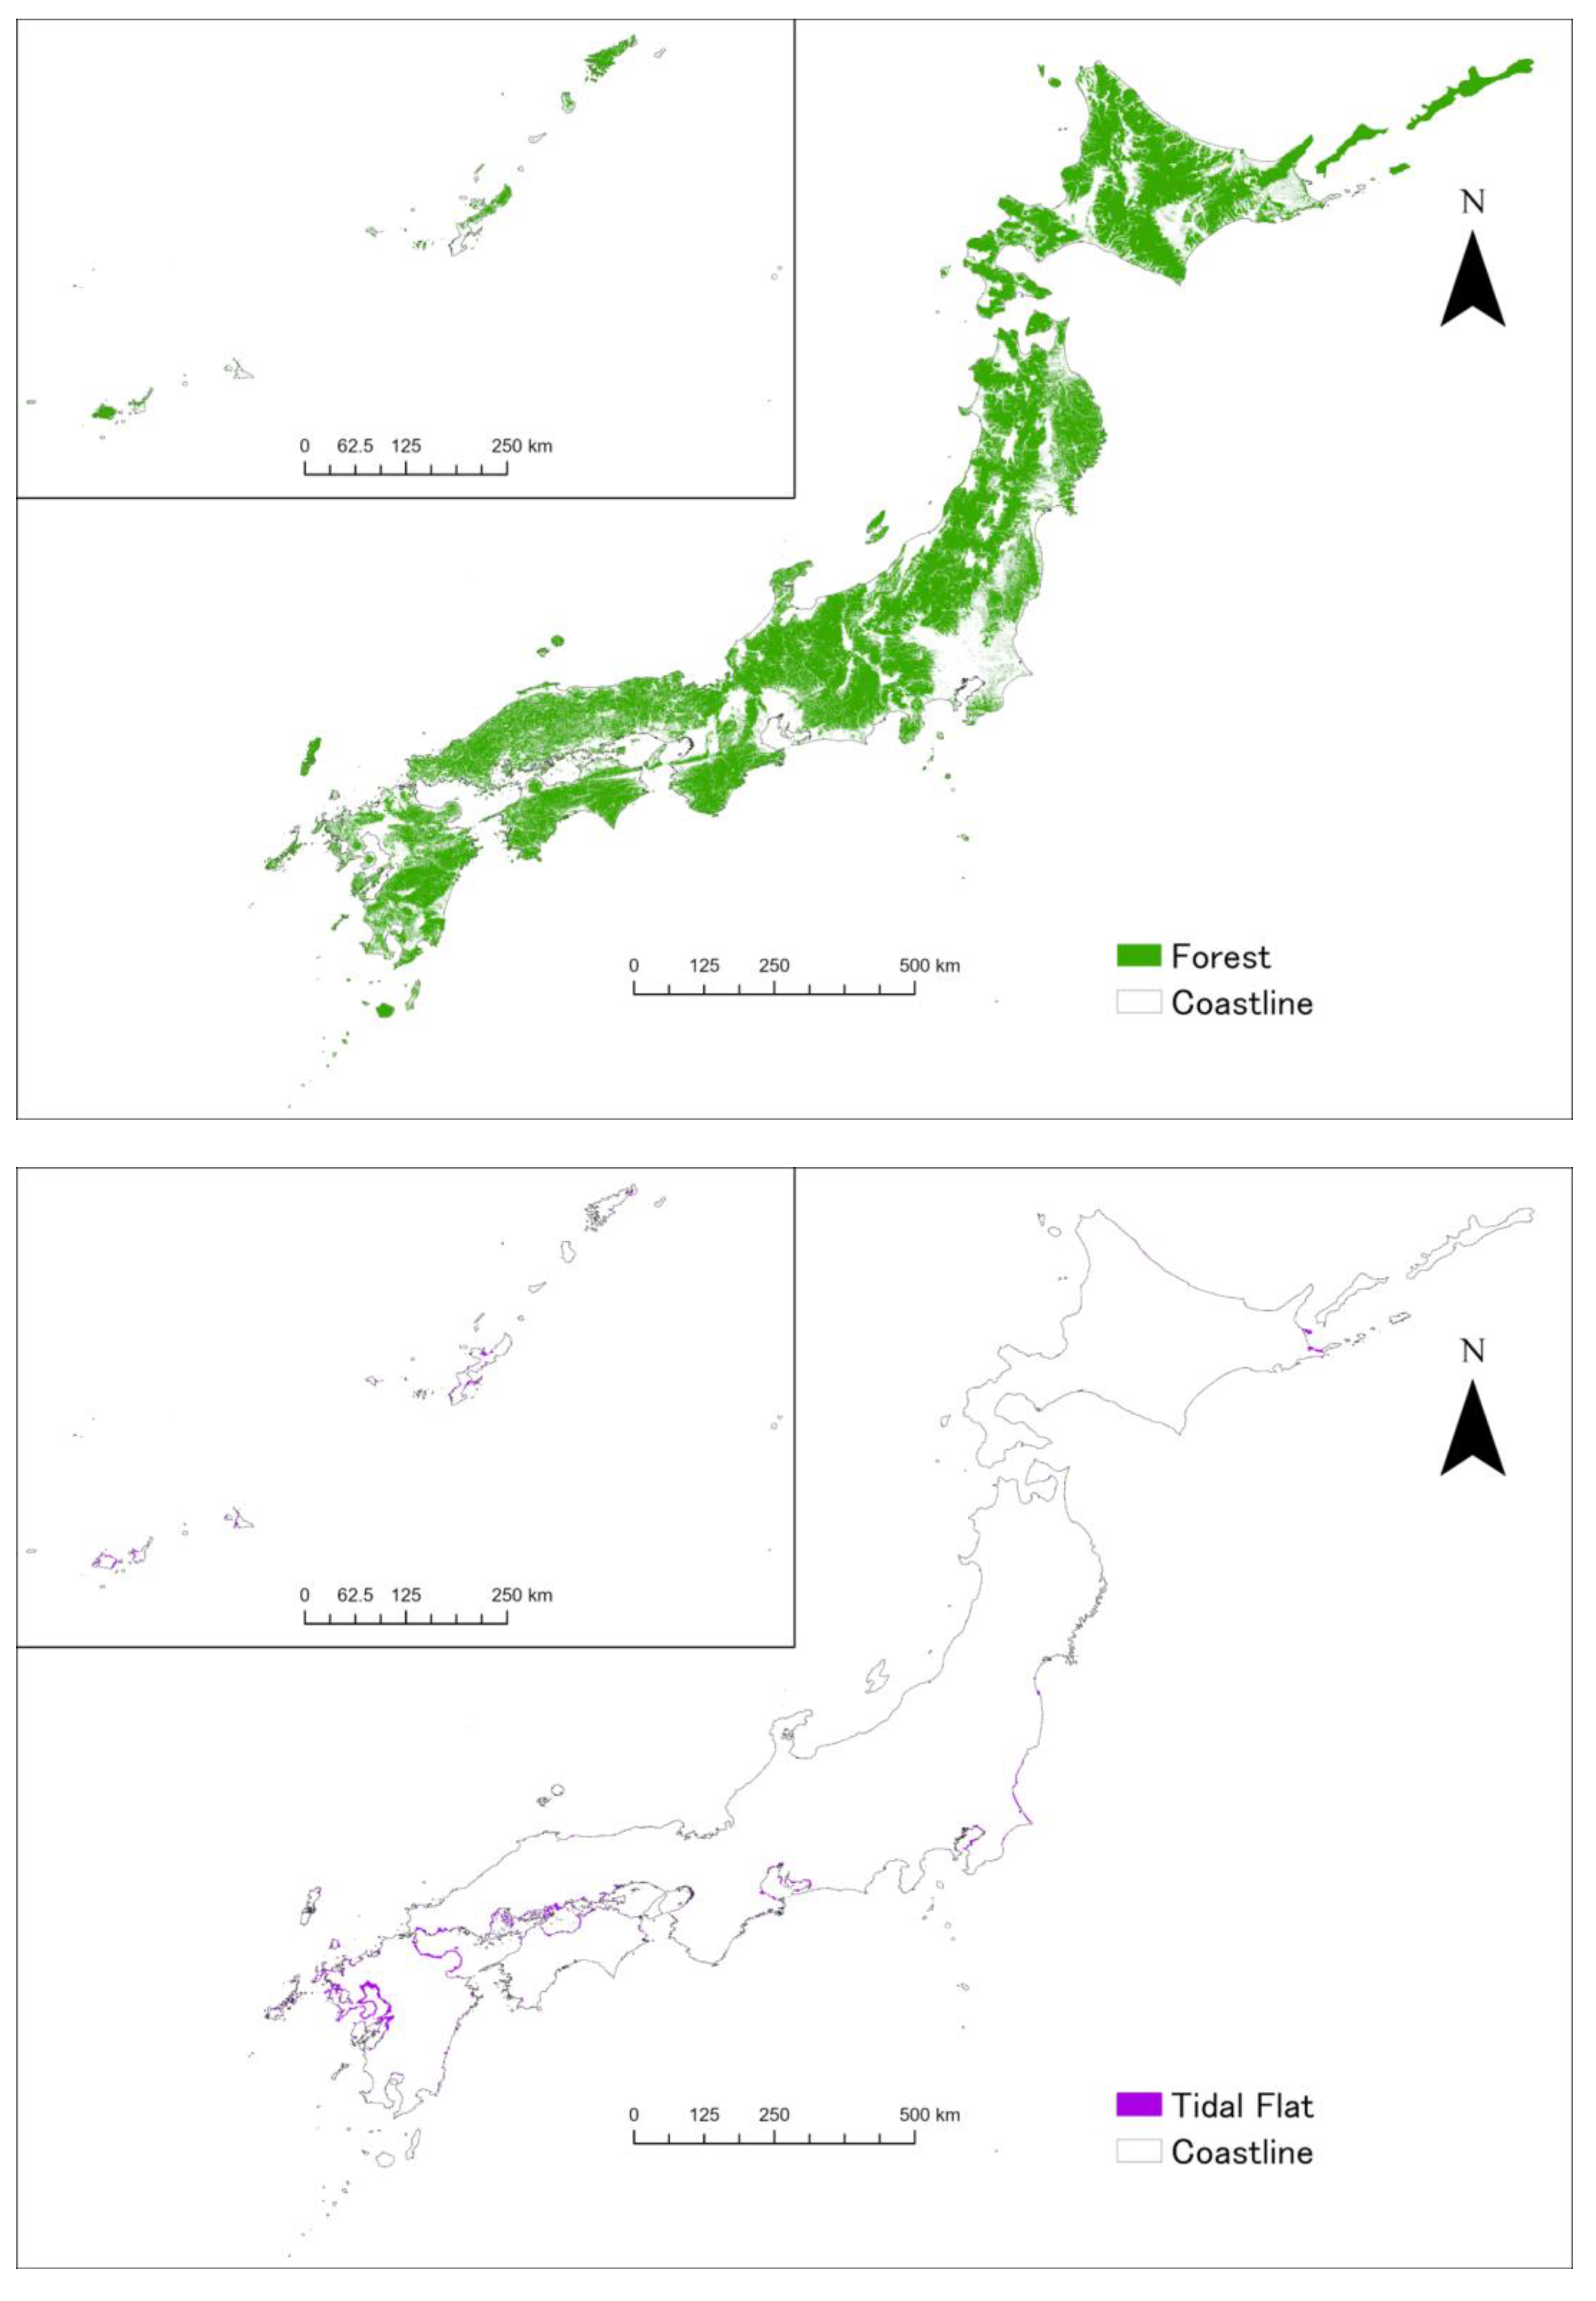
2.2. Description of the Study Area

The study area, that is, Japan, has many rapid rivers, large elevation differences from coast to mountain, and large longitudinal gradients [20]. Moreover, Japan is one of the world’s most seismically active countries, accounting for roughly 20% of major earthquakes [21]. It has four distinct seasons due to the influence of monsoons and a rainy climate with rainy seasons and typhoons. Moreover, volcanic eruptions, earthquakes, tsunamis, river floods, typhoons, and landslides have occurred numerous times throughout history because of these characteristics, causing significant damage to human society that claims lives and damage property. Simultaneously, against the backdrop of the country’s unique land characteristics, Japan has developed outstanding landscapes, unique ecosystems, and biodiversity unparalleled anywhere in the world. The country is recognized globally as an essential area for biodiversity conservation due to its diverse biota. Various disturbances from continental linkages and breakups, multiple geographic zones, topographic complexity, volcanic eruptions, earthquakes, tsunamis, river floods, typhoons, and landslides have created a variety of habitats [22].
To live in harmony with nature, local people have cultivated wisdom and a view of nature (see Supplementary Data S1 for more detailed information on usage of ecosystem services). However, the rapid changes in society that resulted from the rapid economic growth and development that accompanied population growth in many areas have resulted in a significant loss of biodiversity [23]. Traditional wisdom and perspectives on nature are dwindling. Additionally, expanding settlements into areas inherently vulnerable to natural disasters has resulted in the high cost of developing social infrastructure to ensure these areas’ safety. Although Japan is vulnerable to various natural disasters, human lives and property are concentrated in flood-prone areas (lowlands), which account for only a tiny proportion of the national land area. According to the World Risk Report 2016, Japan ranks 4th out of 171 countries in terms of the percentage of the population affected by five disasters (earthquakes, storms, floods, droughts, and sea-level rise) [24]. This demonstrates that the country is the most vulnerable to natural disasters, not only among developed countries but also among emerging countries. Climate change is expected to cause more severe weather disasters and massive earthquakes; thus, natural disasters may exceed previous assumptions and be challenging to cope with using traditional social capital alone. In fact, since 2017, there have been frequent mountain disasters and floods associated with heavy rains and typhoons [25]. Moreover, massive earthquakes are expected in this region, as are tsunamis and other natural disasters.
The overall level of land management will decline because of the land managers’ shortage and the expansion of underutilized land due to the rapid decline and aging of the population. Meanwhile, the cost of maintaining and managing social infrastructure rises yearly, and approximately JPY 30 trillion of the renewal costs required for the 50 years from 2011 to 2060 will not be secured [26]. In order to maintain existing facilities and realize new disaster preventionn and mitigation measures, it is necessary to revisit the use of national land, extend the service life of facilities, and develop and maintain the social infrastructure that maximizes their effectiveness [27].

2.3. Empirical Model

An ordinal logit model was used to analyze the respondents’ WTP level. This study employed the ordinal logit model because the responses were concentrated at JPY 0, JPY 1000 or less, JPY 2000 or less, and JPY 5000 or less, implying that respondents’ WTP is a discontinuous function with multiple threshold values rather than a continuous one (see Supplementary Data S4). Multiple explanatory variables are used in the final modeling approach to identify the determinants of the amount respondents are willing to pay:
y j * = β x j + ε j
where subscript j denotes an individual observation,  y j *  represents a latent variable representing the WTP of each respondent,  x j  represents an explanatory variable of each respondent,  β  represents a vector of regression coefficients to be estimated, and  ε j  is the error term.
According to the literature on stated preferences, the valuation of an ecosystem is influenced by various socioeconomic factors and the respondent’s relationship with the ecosystem in question. Economic theory and extensive stated preference research posit that WTP increases as income rises [28]. Several studies have also found that as the number of household members increases, WTP decreases with economic pressure [29]. Respondents who directly use the ecosystem under consideration value change more than those who do not [30,31]. Moreover, as the distance between the ecosystem under study and the respondents’ residence increases, especially for users, WTP tends to decrease [15]. The inverse distance decay effect of substitutes is stronger in nonusers than in users [32]. Furthermore, disaster fears have raised WTP, particularly among nonusers [32].
To develop a model that expands on existing models for evaluating ecosystems, we tested models that only use the explanatory variables in previous studies and models that incorporate disaster factors and use status factors as explanatory variables. The best-fitting model was identified using the Akaike Information Criterion (AIC).

3. Results and Discussion

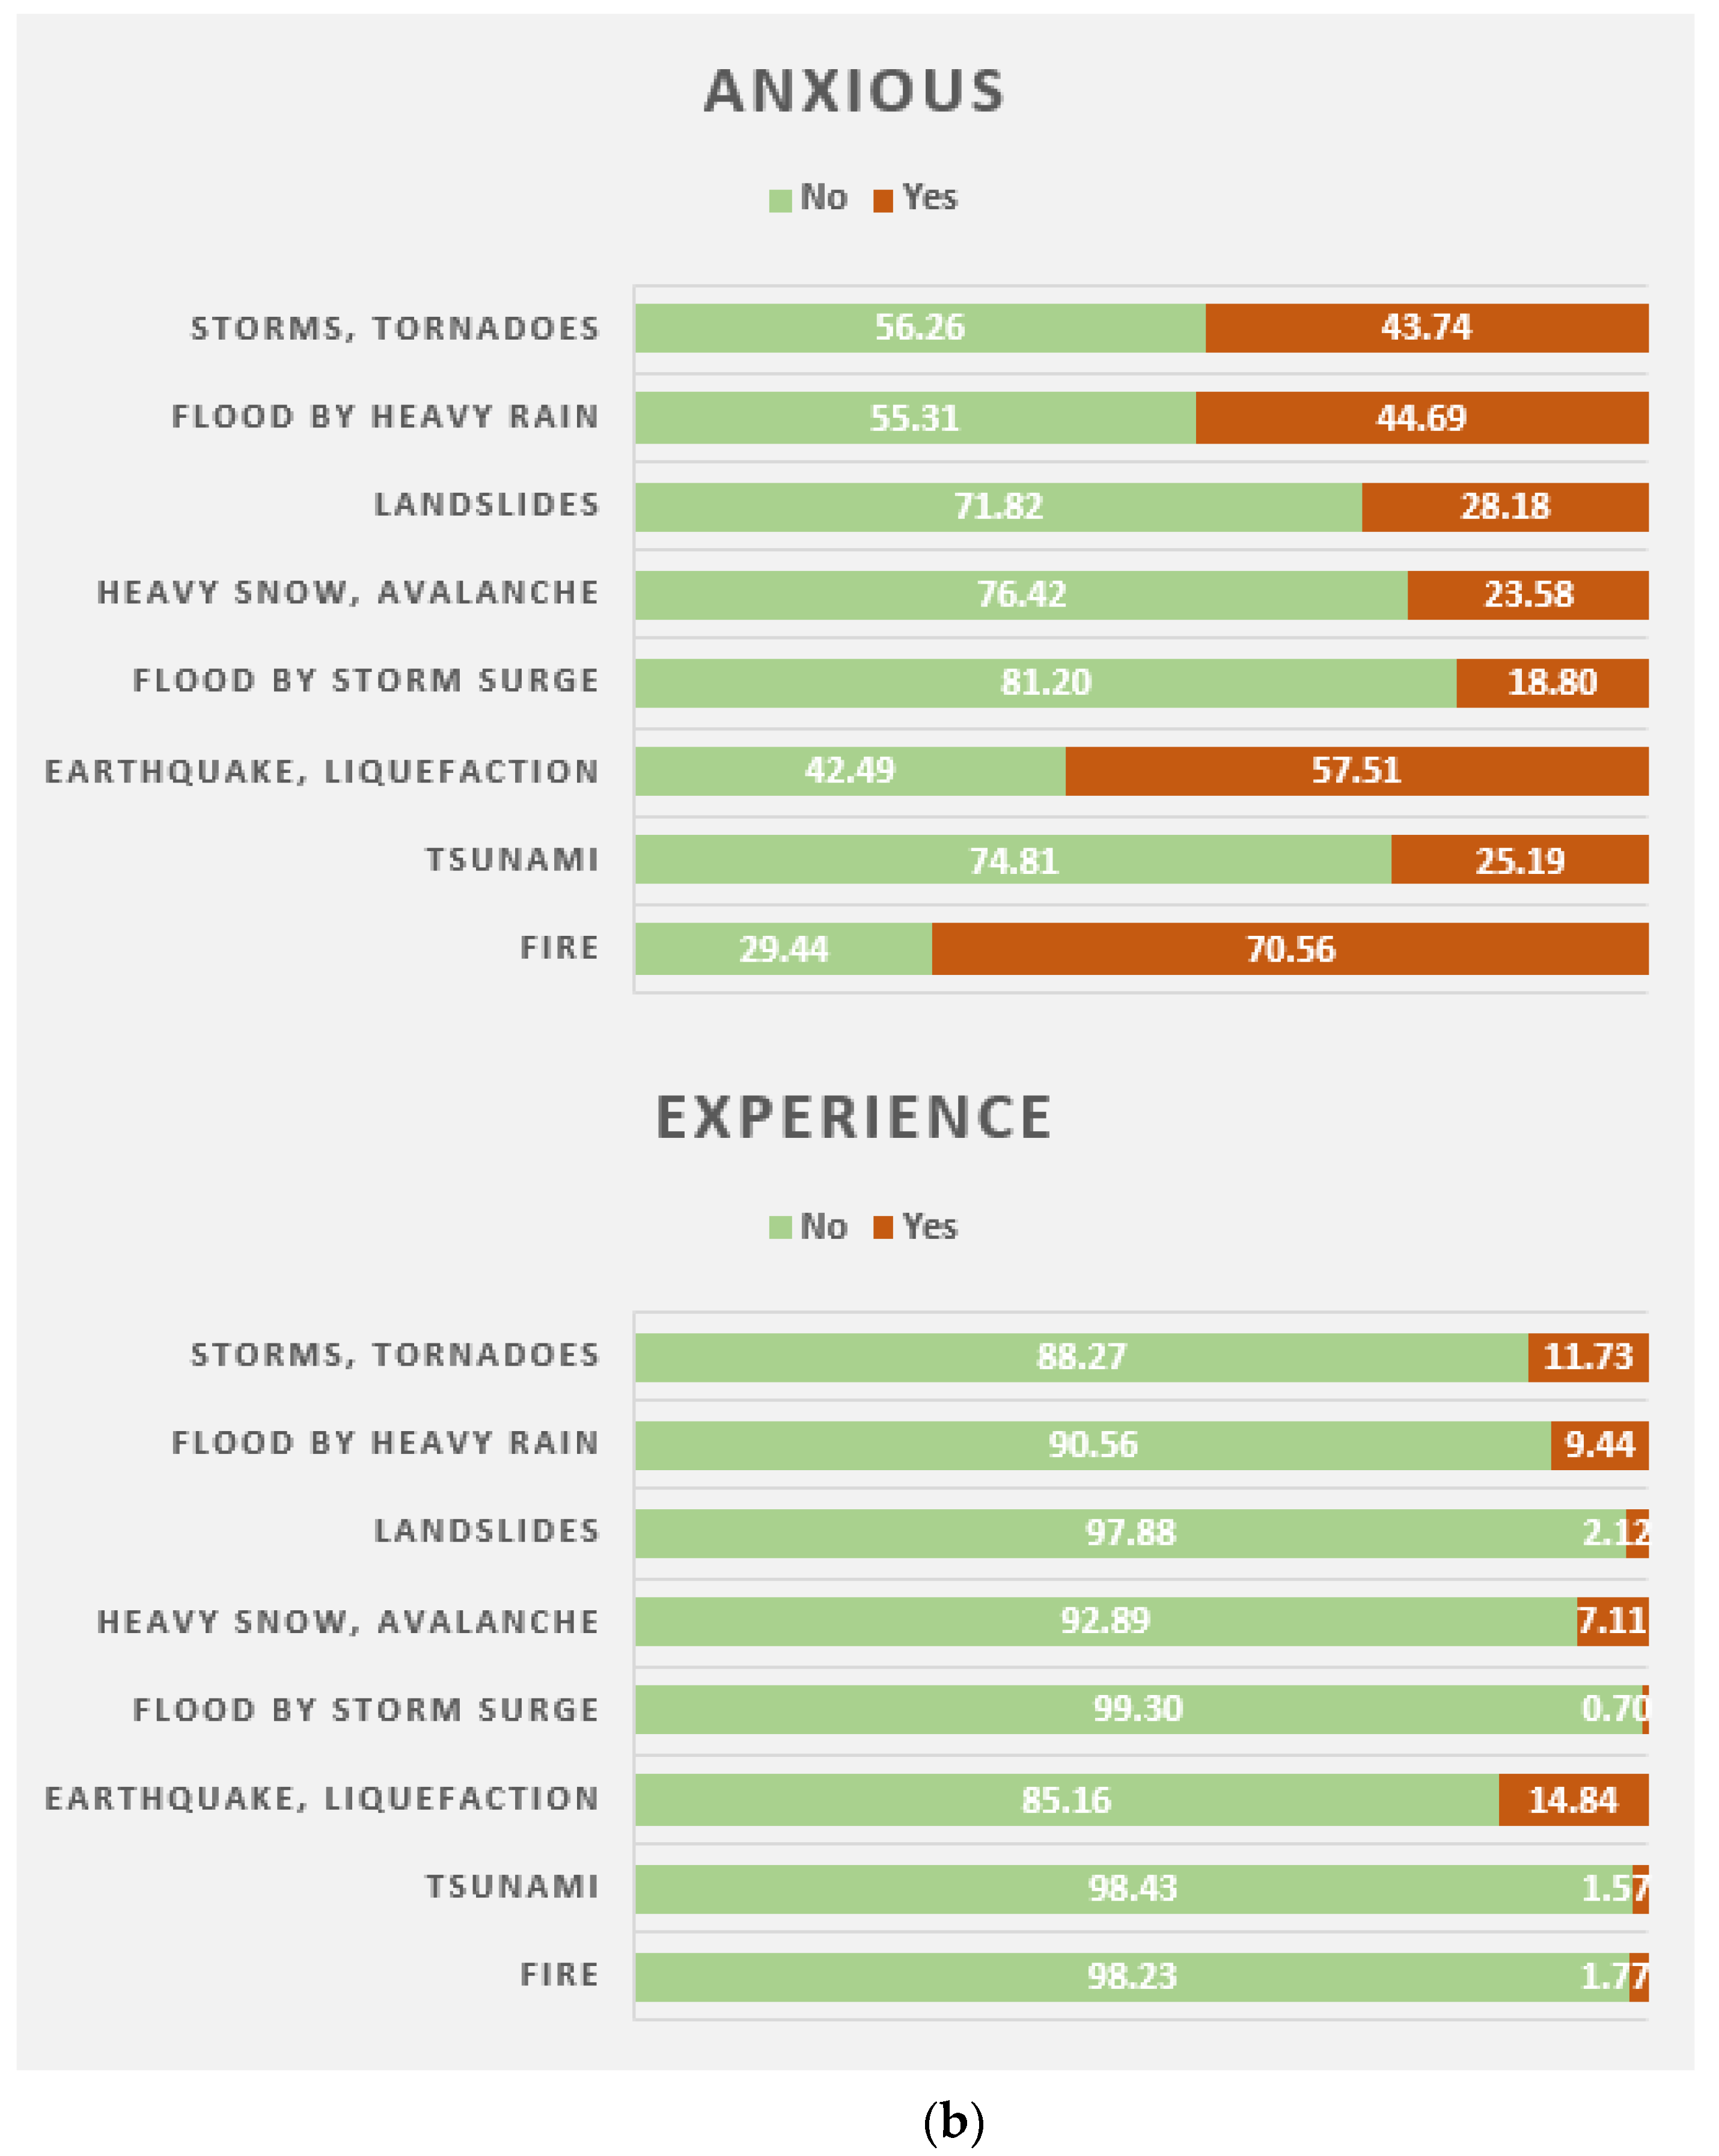
3.1. Descriptive Statistics

Figure 5 compares users’ proximity to ecosystems to nonusers (the average distance from respondents’ homes to their respective ecosystems is shown in Supplementary Data S5). The difference between users and nonusers in rice paddies, fields, orchards, forests, coral reefs, tidal flats, beaches, and mangroves is statistically significant because the 95% confidence intervals do not overlap. In other words, there is a clear distance decay relationship. In contrast, no statistically significant differences were found in pastures and seaweed beds. Here, the nonusers only enjoy the nonuse value of the ecosystem, whereas the users enjoy both use and nonuse value of the ecosystem.
Similarly, Figure 5 shows the distance from the respondent’s residence to the potential substitutes. We chose the nearest urban parks as substitutes for terrestrial ecosystems because they provide multiple ecosystem services, including ecosystem cultural services as places for recreation and disaster prevention functions. Thus, they can be complementary to the ecosystem under study as inherent goods. At the same time, we chose the nearest coastlines as substitutes for marine ecosystems because it contains fishing grounds and seascapes in addition to marine ecosystems and provides multiple ecosystem services and, therefore, can complement the ecosystem under analysis as unique goods.
Interestingly, users of rice paddies, fields, orchards, and forests live farther away from urban parks and alternative ecosystems than nonusers. This may imply that rice paddies, fields, orchards, and forests are unique goods. In contrast, no statistically significant differences were discovered in pastures. In marine ecosystems, tidal flats, and beaches, users live closer to the coastline than nonusers. This result suggests that tidal flats and beaches are not perceived as unique goods as widespread ecosystems along the coastline since the ecosystem along the coastline provides similar ecosystem services. Surprisingly, no statistically significant differences were found among coral reefs, seaweed beds, and mangroves. In other words, one possible explanation for the spatial sorting of households’ choice of residential location is that they choose according to their preferences for particular goods [33,34]. However, it could also explain how the spatial relationship between habitat and ecosystem influences use preferences.
Figure 6 (top) presents the changes in distance to ecosystems due to disaster anxiousness. Unknown disaster risks are not reflected in disaster anxiousness. Assuming that people act rationally, the last choice of the current place of residence has led to the present disaster anxiousness because disaster concern does not drive their choice of current residence. Thus, when the distance to an ecosystem is negatively related to disaster anxiety, people recognize that living near that ecosystem is associated with disaster risk. However, people recognize that living near an ecosystem reduces disaster risk for ecosystems with a positive relationship. According to the results, the closer one lives to marine ecosystems of tidal flats, coral reefs, beaches, and mangroves, the more he or she is likely to be concerned about tsunami and storm surge flooding. Although marine ecosystems can mitigate damage from tsunamis and storm surges, they are insufficient to alleviate disaster anxiousness caused by proximity to the ocean. However, the proximity to agroforestry and forest terrestrial ecosystems and anxiousness has positive relationships regarding tsunami and storm surge flooding. This condition may result from the fact that these ecosystems are often distributed inland and partial recognition of their disaster prevention and mitigation functions. Furthermore, the closer one lives to a forest, the more anxious one is about being affected by a landslide. Although forests can mitigate damage from landslides, the main areas where landslides occur are on steep slopes where forests are abundant; thus, people seem to be anxious. Moreover, the damage from heavy snow avalanches seems to cause less anxiety near marine ecosystems, where many disasters have been feared. These ecosystems are rarely found in areas with heavy snowfall. Coral reefs and mangroves are distributed in warmer climates, and tidal flats are almost nonexistent on the Sea of Japan side, where more snowfall is expected. Additionally, most of Japan’s heavy snowfall areas are in mountainous regions, far from the sea. It is consistent with the fact that the closer one lives to coral reefs and mangroves, which are more frequently hit by typhoons in the southwestern part of Japan, the more concerned one is about wind protection.
Next, the differences in distance to ecosystems due to disaster experiences are shown in Figure 6 (bottom). The current residence was not necessarily chosen because of the disaster experience. If the respondents’ current residence was chosen due to their disaster experience, they must have chosen a location with low disaster risk. Various factors influence residence selection; respondents may choose a high-risk residence even if they know the risk. That is, the relationship between disaster experience and distance from current residence could be classified as:
  • The selection of a low-risk residence due to the presence of disaster concerns.
  • The selection of a high-risk residence despite the presence of concerns.
  • The set of results of continuing to live in high-risk residences after experiencing the disaster because they did not have the opportunity to choose their residences.
Accordingly, ecosystems with a negative relationship between disaster experience and distance indicate that people who have experienced the disaster live nearby. Meanwhile, a positive relationship indicates that those affected by the disaster live farther away.
We investigate the connection between disaster concern and disaster experience. Regarding the relationship between distance from each ecosystem, (a) the situation in which both disaster concerns and disaster experiences are positively related to distance can be considered a case of a location that is peaceful to disaster. (b) The situation in which disaster concerns (disaster experiences) are positively (negatively) related to distance can be considered a case of a place being considered peaceful concerning the disaster; it is a place that accepts people who have experienced a disaster. (c) The situation in which disaster concerns (disaster experiences) are negatively (positively) related to distance can be considered the presence of disaster concern, and no severe damage has occurred. (d) The situation in which both disaster concerns and disaster experiences are negatively related to distance can be considered a case in which people continue to live in areas where a disaster has occurred. Surprisingly, in coral reefs, beaches, and mangroves where nearby residents expressed concern about tsunami damage, the farther away residents lived from these ecosystems, the more tsunami damage they experienced (c). This could be due to one of three factors. The first reason is that these ecosystems’ disaster mitigation effects kept them from being affected by the disaster (see Section 1). Another reason is that tsunami survivors have moved away from these ecosystems. In this case, the idea of living in a low-risk area in the first place may manifest itself, regardless of its disaster prevention function. The third reason is that, despite a long history of disaster concern, no disaster (i.e., tsunami in this case) has occurred in recent decades in areas where these ecosystems are distributed. The third factor is thought to be the primary reflection in the case of tsunamis. There have been six tsunamis that had caused human suffering in Japan since 1950, when the 69-year-old respondent to this survey was born: the 1960 Chilean earthquake-tsunami (M8.5), which caused damage from an event on the other side of the world, 1952 (M8.2), 1993 (M7.8), and 2003 (M7.8) (M8.0). The Great East Japan Earthquake of 2011 (M9.0) occurred in the northeastern part of Japan [35] (see reference for tsunami and storm surge information), and it has never occurred in the southern and southwestern areas where coral reefs and mangroves are found. Moreover, a few beaches on the Pacific side of the Tohoku region were severely damaged by the 2011 Great East Japan Earthquake, which was prominent in scale and felt by many respondents.
For forests where nearby residents expressed concern about landslide damage, the farther away they lived from this ecosystem, the more landslide damage they experienced (c). As with the tsunami, three reasons are possible; however, the third reason is ruled out because forests are more widely distributed with fewer regional differences. On the other hand, the remaining two are worth considering. Tree roots anchor the soil in forests, and trees and surface vegetation protect the topsoil from rainfall, reducing slope failure and sediment runoff. Many soil voids are formed by underground plant roots and organic matter in forest soils, and deciduous leaves, branches, and forest floor vegetation protect the soil surface. However, the devastation caused by excessive tree cutting, overgrazing, and abandoned management of planted forests reduces these functions. In particular, artificial forests are becoming increasingly poorly managed in Japan, and their future impact is concerning. The functions of coral reefs, sandy beaches, and mangroves in disaster prevention and mitigation against heavy rainfall, floods, and landslides are limited. Therefore, other factors may increase the likelihood of disasters. For example, the southwestern islands of Japan, which are home to coral reefs and mangroves, receive high rainfall and are vulnerable to typhoons. However, there are many areas where mountain forests are not well managed.
As previously stated, policy interventions for disaster prevention and mitigation by ecosystems or a combination of artificial structures and ecosystems are required to improve the current situation in which people are forced to live in places with a high risk of disaster. In cases where the choice of current residence caused the disaster experience prior to recognizing the risk, the disaster experience could be avoided by recognizing the risk in advance. Therefore, efforts to educate people about risk awareness are crucial [36]. Furthermore, residential preferences must be transferred to change the situation in which people choose to live in high-risk areas despite being aware of the risks by manipulating other factors (e.g., economic incentives) [37].

3.2. Regression Results and Discussion

Model 1 is a simplistic model that ignores respondent usage and disasters. Besides income, age, number of household members, number of children, education level, and gender, which are socioeconomic factors defined by economic theory, the variables used in this model are residence in the city as a spatial factor, distance from the target ecosystem, and distance from alternative ecosystems. Model 2 expands on Model 1 by investigating how use status affects WTP. We incorporate the use status variable into the model as a dummy variable. Model 3 takes a significant step forward in ecological disaster prevention and mitigation by introducing respondents’ experiences with and anxiousness about eight types of disasters. Finally, Model 4 seeks to improve the models by incorporating the use status, disaster experiences, and anxiousness identified in Models 2 and 3. Compared by using AIC, Model 4 was the best fit for all ecosystems (see Supplementary Data S6). This finding emphasizes the importance of including use and disaster attributes in analyzing ecosystem preferences. Therefore, the discussion in this paper is based on the Model 4 results (Table 1).
Respondents living in urban areas had lower WTP for rice paddies and artificial forests farther away from urban residents. This implies that the WTP was influenced by unfamiliarity. Caution is advised because a rising urban population increases the likelihood that these ecosystems will be neglected.
The spatial parameter of distance from respondents’ residences to ecosystems confirmed that WTP decreased with increasing distance to fields, orchards, pastures, and seaweed beds. The closer these ecosystems are from respondents’ residences, the more likely they will benefit from their ecosystem services, implying that people will also benefit from them. Vegetables, fruits, livestock, and algae, such as wakame and kelp, are distributed in large quantities within a small area in Japan. These crops are also expected to be shared by neighbors. This distance decay effect implies that supply services are brought heterogeneously. Meanwhile, rice paddies, artificial forests, natural forests, coastal disaster prevention forests, coral reefs, mangroves, tidal flats, and beaches did not show statistically significant distance decay effects. Thus, these ecosystems benefit people in terms of spatial homogeneity. Heterogeneity in these ecosystems’ provisioning services is not expected, implying that the overall benefits of ecosystem services, including regulating services, are provided uniformly. No other ecosystem variables were found to influence WTP in any ecosystem. Respondents who lived within the same distance of one ecosystem and were otherwise similar did not significantly differ in their WTP with distance to substitutes. This finding implies that these ecosystems were considered unique goods, distinct from artificial ecosystems or mere coastlines. Therefore, when considering the relationship between spatial distance decay and WTP in natural ecosystems, substitutes may not be accounted for.
When disaster-resistant ecosystems exist, people benefit from one of the ecosystems’ regulating services: disaster prevention functions. When people recognize this function, disaster experiences and anxiousness can increase their willingness to protect ecosystems with a disaster deterrent function, thereby increasing WTP. To deepen the discussion of disasters, we will look at how disaster experiences and anxiety shape the impact of WTP on ecosystem protection. Figure 7 depicts these effects.
For disaster experience/anxiousness to lead to a willingness to protect, people must recognize that the ecosystem can prevent the disaster. Furthermore, respondents must hope that the ecosystem will serve as a refuge or that others will not go through the same ordeal. Disasters have a significant impact on people’s lives. In particular, both disaster experiences and concerns are expected to result in a significant loss of well-being. In other words, disasters can reduce WTP by damaging people’s livelihoods. As a result, socioeconomic factors, such as income and well-being, may be explanatory. Socioeconomic factors are controlled by including them as explanatory variables in the analysis. Meanwhile, happiness is discussed by conducting an additional analysis with subjective well-being as the explained variable to examine the cognition and desire analysis (Supplementary Data S7). Anxiousness about suffering from a heavy snow avalanche and earthquake liquefaction had positive relationships with subjective well-being. In other words, concerns about heavy snow avalanches and earthquake liquefaction may significantly reduce (at least subjective) well-being. Therefore, when considering the impact of anxiety about heavy snow avalanches and earthquake liquefaction on WTP, the impact of reduced well-being must be considered. Thus, we re-ran the primary analysis with the addition of subjective well-being. However, adding subjective well-being as an explanatory variable did not affect the results. In other words, subjective well-being cannot explain the negative WTP results for heavy snow avalanches and earthquake liquefaction anxiousness (the analysis results with subjective well-being as an explanatory variable are shown in Supplementary Data S8).
Respondents who had experienced a tsunami were more willing to protect natural and coastal disaster prevention forests. Furthermore, respondents concerned about being affected by the tsunami were more willing to protect these forests. These findings suggest that the desire to be sheltered and prevent others from going through the same painful experience as oneself is accompanied by a perception of ecosystems’ disaster prevention function. On the other hand, WTP for mangroves was higher only among respondents who had experienced a tsunami disaster. This finding suggests that, although the experience of the tsunami disaster recognized ecosystems’ disaster prevention function, the anxiousness about the disaster may not have.
Similarly, only respondents who had experienced landslides, heavy snow, or avalanches had higher WTP in farmland and forest systems. This finding suggests that disaster anxiousness does not lead to recognition of these ecosystems’ roles in preventing landslides and avalanches, which is an important issue. However, in some cases, WTP was high only for respondents with disaster anxiousness for tsunamis and fires. Respondents with tsunami anxiousness had a higher WTP for pastures and seaweed beds, whereas those with fire anxiousness had a higher WTP for agricultural and forested systems. These ecosystems are widely recognized as having disaster prevention and mitigation functions for their respective disasters; however, the findings suggest that they may be overlooked after the disaster has occurred.
Furthermore, although marine ecosystems are not expected to have functions to prevent heavy rainfall and floods, landslides, heavy snow and avalanches, earthquake liquefaction, and fires, respondents who had experienced or were concerned about these disasters had a high WTP. This result may reflect the fact that these disasters heightened interest in disaster prevention and mitigation, regardless of each ecosystem’s disaster prevention function. However, some cases (e.g., forest systems against wind storms and tornadoes; farmlands, forest systems, tidal flats, and beaches against heavy rain flooding; all ecosystems against storm surge flooding; farmlands and forest systems against earthquake liquefaction; and rice paddies, fields, artificial forests, coral reefs, and tidal flats against tsunami) did not show large WTP of respondents with disaster experience or anxiousness despite their solid functions for disaster prevention and mitigation of that kind. This result implies that social recognition of the role of ecosystems in mitigating these disasters has made no progress. Fundamental advancements in information dissemination methods are required. Surprisingly, rice paddies, fields, natural forests, and seaweed beds against storm surges, and artificial and natural forests against heavy snow avalanches, had low WTP among disaster-anxious respondents. Another factor could be considered for heavy snow avalanches, as the WTP of less relevant marine ecosystems is also low.
The use status of all ecosystems was found to influence WTP. We will use this opportunity to examine the differences in perception between users and nonusers. Local governments and policymakers need to close the communication gap with citizens and disseminate a culture of disaster risk awareness [38]. This observation will allow for a more in-depth examination of the relationship between humans and the ecosystem. In other words, because the hypothesis arose that users and nonusers are affected differently by other variables, additional analysis was carried out to distinguish between users and nonusers. Table 2 describes Model 5, which includes variables that intersect use status with spatial variables, disaster experience, and disaster anxiousness (see Supplementary Data S9 for all explanatory of Model 5). Living in a large city was irrelevant for users (WTP was higher for users in large cities for mangroves and tidal flats). However, it was lower for nonusers living in large cities for ecosystems other than fields, orchards, and seaweed beds. Apart from tidal flats, ecosystems were more distantly located to urban dwellers, implying that unfamiliarity affected WTP. A concern arises that as the urban population ratio increases, people will become more unfamiliar with ecosystems, increasing the likelihood that these ecosystems will be neglected. The greater the users’ WTP, the closer they are to the field and the coastal disaster protection forest. This indicates that the closer they are, the more likely they will reap the benefits. Moreover, the closer the nonusers are to the orchard, pasture, and seaweed beds, the higher their WTP, indicating that the closer they are, the more likely they will receive nonuse benefits. However, the lack of statistically significant spatial heterogeneity in ecosystems other than those listed suggests that the proximity of the ecosystem to the place of residence is not necessary for both users and nonusers and that they thus receive homogeneous benefits. However, for beach nonusers, the shorter the distance, the lower the WTP. This finding implies that the closer they are, the more inconvenience they experience. In other words, nonuser beaches may have the aspects of nuisance facilities.
Generally, users understand ecosystem function better than nonusers because they are more interested in user behavior and thus have more opportunities to observe ecosystems through use. Therefore, regardless of their disaster-related experiences or anxieties, they are more likely to recognize the coordination service of ecosystems’ disaster prevention and mitigation functions and reap the corresponding welfare benefits. In other words, when nonusers’ understanding of ecosystems is sufficiently deepened by disaster experience or anxiousness, the change manifested is more significant for nonusers than for users ((i.) in Figure 8). Meanwhile, when the understanding is not sufficiently deepened (when only users with a high level of interest understood), the change revealed is more significant for users than nonusers ((ii.) in Figure 8). Furthermore, no discernible change is observed when understanding is not deepened at all (even when interested users do not understand) ((iii.) in Figure 8). When residents’ understanding of ecosystems has been sufficiently deepened by disaster experience and anxiousness ((i.) in Figure 8), it is easier to obtain consensus when implementing policies that address their needs in disaster-affected areas. Making policy achievements in disaster prevention and mitigation by ecosystems, even on a small scale, will improve people’s understanding of disaster prevention and may lead to larger-scale implementations in this situation [39]. In contrast, if people’s understanding of ecosystems has not been sufficiently enhanced because of their disaster experiences and anxiousness (ii), awareness-raising activities for people with relatively low interest in ecosystems, such as nonusers, are likely to be practical while mobilizing users because they already have a better understanding of ecosystems [40]. In that case, the disaster experience or anxiety has not deepened the understanding of ecosystems at all (iii). Moreover, a significant problem exists in disseminating information on ecosystems and their disaster prevention and mitigation functions by the government and others. Therefore, information providers must fundamentally alter their methods of information dissemination.
Figure 9 depicts the current state of each of these ecosystem understandings (see Supplementary Data S9 for all Model 5 results). Many ecosystems are found in state (iii), but only a few are found in state (i). Some ecosystem functions are becoming more recognized among those concerned about tsunamis, heavy rain floods, and fires, and those who have experienced landslides, heavy snow avalanches, earthquake liquefaction, and tsunamis. Meanwhile, mangroves and seaweed beds showed low WTP among nonusers who expressed disaster anxiety, as did artificial and natural forests against heavy snow avalanches ((iv.) in Figure 9). Avalanches occur on the slopes of forested mountains; thus, nonusers may misidentify forests as the cause of avalanche disasters. If so, raising awareness is critical, as misinformation may lead to further environmental degradation. Regarding rice paddies, fields, and natural forests from storm surges, the results show that the WTP of users who expressed concern about the damage was low ((v.) in Figure 9). This finding could imply that people who interact with ecosystems have given up on maintaining ecosystems in areas where damage is a concern. If this is true, it would be a problematic situation that may accelerate the risk of damage in places where the risk of damage already exists. Furthermore, the low WTP observed for nonusers of coastal forests, coral reefs, mangroves, seaweed beds, tidal flats, and beaches, which are less relevant to heavy avalanche disasters, may reflect the inability of those anxious about heavy avalanche disasters to afford the maintenance of ecosystems in which they are not intimately involved.

4. Conclusions

Dasgupta (2021) published an independent review of the economics of biodiversity, described that nature as ‘‘our most precious asset’’, and stated that humanity has collectively mismanaged its ‘‘global portfolio’’ [41]. Ecosystem-based disaster risk reduction (Eco-DRR) employs ecosystems and ecosystem services as buffers against hazardous natural phenomena by preserving ecosystems and ecosystem services while providing food and water [42]. As Dasgupta (2021) identified, through functions such as water supply, these measures aid human and community responses to natural disasters [41]. This type of Eco-DRR is one practical approach to disaster mitigation and climate change adaptation. This study compiles empirical evidence on ecosystem services’ use and nonuse values that could result in significant benefits from meeting these commitments.
Generally, empirical studies estimating the public’s WTP for ecosystem conservation despite anthropogenic loss risks are lacking. This condition implies that these use and nonuse benefits have yet to play a significant role in socioeconomic assessments. As a result, we conducted the following:
  • Re-examine the importance of incorporating spatial variables, considered in previous studies, into a function representing the benefits people receive from various ecosystems.
  • Investigate the appropriateness of integrating ecosystem use and nonuse values and disaster prevention and mitigation functions into a function representing the benefits people receive from ecosystems.
  • Construct a concept representing ecosystems’ perceived disaster prevention and mitigation functions based on the results.
Results show that distance decay varies by ecosystem type. Additionally, the findings that WTP for rice paddies and forests, which are rarely distributed in a megalopolis, is low within a megalopolis provide evidence that urbanization weakens the connection between people and ecosystems. Moreover, we discovered that the use status of all ecosystems and some disaster concerns significantly affect WTP. The findings that those who experienced tsunamis had higher WTP for natural forests and coastal disaster prevention forests suggest that people’s desire for disaster prevention and mitigation is linked to their perception of ecosystems’ disaster prevention function. These findings highlight the importance of incorporating use and disaster factors into conventional and spatial functions.
The effects of use status and disaster concerns on ecosystem preferences were used to investigate the extent to which ecosystems’ disaster prevention and mitigation functions are recognized. The findings suggest that some ecosystem functions are becoming more recognized only with concern about tsunamis, heavy rainfall and floods, and fires, and with experience of landslides, heavy snow avalanches, earthquake liquefaction, and tsunami disasters. There is a lack of understanding about the remaining ecosystems’ disaster prevention and mitigation functions. Thus, we found some evidence that the value of ecosystems’ disaster prevention and mitigation functions may be determined by how people perceive them rather than by their actual functions. The results suggest the importance of recognizing that the ecosystem disaster prevention and mitigation functions are underestimated. Furthermore, public support for mitigating the effects on ecosystems depends on public understanding of ecosystems, which is a critical communication issue. Awareness-raising activities considering the use status can effectively raise awareness of ecosystems’ disaster prevention function. Finally, although this study is one of the first studies to investigate the relationship between preferences for ecosystems and space, use, and disaster experiences covering the largest number of ecosystems (12 ecosystems), the perceived value of ecosystems could change significantly through external shocks such as large-scale natural disasters and pandemics that affect individuals’ internal factors. In order to capture the actual value of the ecosystems more accurately, reflecting the changes in internal factors, it would be essential to investigate how external shocks affect individuals’ internal factors, which requires panel data. This limitation of the study could be addressed in future studies.

Supplementary Materials

The following supporting information can be downloaded at: https://www.mdpi.com/article/10.3390/su15043154/s1, Data S1: Ecosystem services. Data S2–S9.

Author Contributions

Conceptualization, K.K. and A.R.K.; methodology, K.K.; software, K.K.; validation, K.K., A.R.K. and S.M.; formal analysis, K.K.; investigation, S.M.; resources, S.M.; data curation, K.K.; writing—original draft preparation, K.K.; writing—review and editing, A.R.K.; visualization, K.K.; supervision, S.M.; project administration, A.R.K.; funding acquisition, S.M. All authors have read and agreed to the published version of the manuscript.

Funding

This research was supported by JSPS KAKENHI Grant Number JP20H00648, Ministry of the Environment, Government of Japan (1-2001).

Institutional Review Board Statement

Not applicable.

Informed Consent Statement

Informed consent was obtained from all subjects involved in the study.

Data Availability Statement

Not applicable.

Acknowledgments

Any opinions, findings, and conclusions expressed in this material are those of the authors and do not necessarily reflect the views of the agencies.

Conflicts of Interest

The authors declare no conflict of interest.

References

  1. Managi, S.; Kumar, P. Inclusive Wealth Report 2018, 1st ed.; Routledge: Oxfordshire, UK, 2018. [Google Scholar]
  2. Markhvida, M.; Walsh, B.; Hallegatte, S.; Baker, J. Quantification of disaster impacts through household well-being losses. Nat. Sustain. 2020, 3, 538–547. [Google Scholar] [CrossRef]
  3. Orimoloye, I.; Zhou, L.; Kalumba, A.M. Drought Disaster Risk Adaptation through Ecosystem Services-Based Solutions: Way Forward for South Africa. Sustainability 2021, 13, 4132. [Google Scholar] [CrossRef]
  4. Morris, R.L.; Konlechner, T.M.; Ghisalberti, M.; Swearer, S.E. From grey to green: Efficacy of eco-engineering solutions for nature-based coastal defence. Glob. Chang. Biol. 2018, 24, 1827–1842. [Google Scholar] [CrossRef]
  5. Williams, D.S.; Costa, M.M.; Sutherland, C.; Celliers, L.; Scheffran, J. Vulnerability of informal settlements in the context of rapid urbanization and climate change. Environ. Urban. 2018, 31, 157–176. [Google Scholar] [CrossRef]
  6. Ozturk, U.; Bozzolan, E.; Holcombe, E.A.; Shukla, R.; Pianosi, F.; Wagener, T. How climate change and unplanned urban sprawl bring more landslides. Nature 2022, 608, 262–265. [Google Scholar] [CrossRef]
  7. Daniel, T.C.; Muhar, A.; Arnberger, A.; Aznar, O.; Boyd, J.W.; Chan, K.M.A.; Costanza, R.; Elmqvist, T.; Flint, C.G.; Gobster, P.H.; et al. Contributions of cultural services to the ecosystem services agenda. Proc. Natl. Acad. Sci. USA 2012, 109, 8812–8819. [Google Scholar] [CrossRef]
  8. Díaz, S.; Demissew, S.; Carabias, J.; Joly, C.; Lonsdale, M.; Ash, N.; Larigauderie, A.; Adhikari, J.R.; Arico, S.; Báldi, A.; et al. The IPBES Conceptual Framework—Connecting Nature and People. Curr. Opin. Environ. Sustain. 2015, 14, 1–16. [Google Scholar] [CrossRef]
  9. Guerry, A.D.; Polasky, S.; Lubchenco, J.; Chaplin-Kramer, R.; Daily, G.C.; Griffin, R.; Ruckelshaus, M.H.; Bateman, I.J.; Duraiappah, A.; Elmqvist, T.; et al. Natural capital and ecosystem services informing decisions: From promise to practice. Proc. Natl. Acad. Sci. USA 2015, 112, 7348–7355. [Google Scholar] [CrossRef]
  10. Sutherland, R.J.; Walsh, R.G. Effect of Distance on the Preservation Value of Water Quality. Land Econ. 1985, 61, 281–291. [Google Scholar] [CrossRef]
  11. Bateman, I.J. Bringing the real world into economic analyses of land use value: Incorporating spatial complexity. Land Use Policy 2009, 26, S30–S42. [Google Scholar] [CrossRef]
  12. Johnston, R.J.; Ramachandran, M.; Schultz, E.T.; Segerson, K.; Besedin, E.Y. Characterizing Spatial Pattern in Ecosystem Service Values When Distance Decay Doesn’t Apply: Choice Experiments and Local Indicators of Spatial. In Proceedings of the Agricultural and Applied Economics Association (AAEA) > Agricultural and Applied Economics Association (AAEA) Conferences 2011 Annual Meeting, Pittsburgh, PA, USA, 24–26 July 2011. [Google Scholar]
  13. Bockstael, N.E. Modeling Economics and Ecology: The Importance of a Spatial Perspective. Am. J. Agric. Econ. 1996, 78, 1168–1180. [Google Scholar] [CrossRef]
  14. Pate, J.; Loomis, J. The Effect of Distance on Willingness to Pay Values: A Case Study of Wetlands and Salmon in California. Ecol. Econ. 1997, 20, 199–207. [Google Scholar] [CrossRef]
  15. Bateman, I.J.; Ferrini, S.; Hime, S. Aquamoney: UK Case Study Report; CSERGE: Norwich, UK, 2008. [Google Scholar]
  16. Brouwer, R.; Martin-Ortega, J.; Berbel, J. Spatial Preference Heterogeneity: A Choice Experiment. Land Econ. 2010, 86, 552–568. [Google Scholar] [CrossRef]
  17. Bateman, I.J.; Day, B.H.; Georgiou, S.; Lake, I. The Aggregation of Environmental Benefit Values: Welfare Measures, Distance Decay and Total WTP. Ecol. Econ. 2006, 60, 450–460. [Google Scholar] [CrossRef]
  18. Schaafsma, M.; Brouwer, R.; Gilbert, A.; van den Bergh, J.; Wagtendonk, A. Estimation of Distance-Decay Functions to Account for Substitution and Spatial Heterogeneity in Stated Preference Research. Land Econ. 2013, 89, 514–537. [Google Scholar] [CrossRef]
  19. Reynaud, A.; Lanzanova, D. A Global Meta-Analysis of the Value of Ecosystem Services Provided by Lakes. Ecol. Econ. 2017, 137, 184–194. [Google Scholar] [CrossRef]
  20. Yoshimura, C.; Omura, T.; Furumai, H.; Tockner, K. Present state of rivers and streams in Japan. River Res. Appl. 2005, 21, 93–112. [Google Scholar] [CrossRef]
  21. Cabinet Office Japan. 2010 White Paper Disaster Management in Japan. Available online: https://www.bousai.go.jp/kaigirep/hakusho/h22/bousai2010/html/honbun/index.htm (accessed on 30 October 2022).
  22. Nakamura, K.; Tockner, K.; Amano, K. River and Wetland Restoration: Lessons from Japan. Bioscience 2006, 56, 419–429. [Google Scholar] [CrossRef]
  23. Katayama, N.; Baba, Y.G.; Kusumoto, Y.; Tanaka, K. A review of post-war changes in rice farming and biodiversity in Japan. Agric. Syst. 2015, 132, 73–84. [Google Scholar] [CrossRef]
  24. United Nations University. World Risk Report 2016. Available online: http://collections.unu.edu/view/UNU:5763#viewAttachments (accessed on 30 October 2022).
  25. Al Sawaf, M.B.; Kawanisi, K.; Xiao, C. Characterizing annual flood patterns variation using information and complexity indices. Sci. Total Environ. 2022, 806, 151382. [Google Scholar] [CrossRef]
  26. Ministry of Land Infrastructure Transport and Tourism. White Paper on Land, Infrastructure, Transport and Tourism in Japan; MLIT: Tokyo, Japan, 2012.
  27. Onday, O. Japan’s Society 5.0: Going Beyond Industry 4.0. Bus. Econ. J. 2019, 10, 1000389. [Google Scholar]
  28. Hanemann, W.M. The Economic Theory of WTP Valuing Environmental Preferences: Theory and Practice of the Contingent Valuation Method in the US, EU, and Developing Countries; Oxford University Press on Demand: Oxford, UK, 2001. [Google Scholar]
  29. Koundouri, P.; Kountouris, I.; Remoundou, K. Valuing a wind farm construction: A contingent valuation study in Greece. Energy Policy 2009, 37, 1939–1944. [Google Scholar] [CrossRef]
  30. Johnston, R.J.; Besedin, E.Y.; Wardwell, R.F. Modeling Relationships between Use and Nonuse Values for Surface Water Quality: A Meta-Analysis. Water Resour. Res. 2003, 39, 12. [Google Scholar] [CrossRef]
  31. Whitehead, J.C.; Carolina, N.; Blomquist, G.C. Measuring Contingent Values for Wetlands’ Effects of Information About Related Environmental Goods Information about Related Environmental Goods on Total of This Hypotheses about Willingness Indirectly through Use of Wetlands as an Activity Input with Eq. Water Resour. Res. 1991, 27, 2523–2531. [Google Scholar] [CrossRef]
  32. Jørgensen, S.L.; Olsen, S.B.; Ladenburg, J.; Martinsen, L.; Svenningsen, S.R.; Hasler, B. Spatially Induced Disparities in Users’ and Non-Users’ WTP for Water Quality Improvements-Testing the Effect of Multiple Substitutes and Distance Decay. Ecol. Econ. 2013, 92, 58–66. [Google Scholar] [CrossRef]
  33. Klaiber, H.A.; Phaneuf, D.J. Do Sorting and Heterogeneity Matter for Open Space Policy Analysis? An Empirical Comparison of Hedonic and Sorting Models. Am. J. Agric. Econ. 2009, 91, 1312–1318. [Google Scholar] [CrossRef]
  34. Baerenklau, K.A. A Latent Class Approach to Modeling Endogenous Spatial Sorting in Zonal Recreation Demand Models. Land Econ. 2010, 86, 800–816. [Google Scholar] [CrossRef]
  35. Information about Tsunami and Storm Surge. Available online: https://www.mlit.go.jp/river/kaigan/ (accessed on 6 February 2023).
  36. Majd, P.M.; Torani, S.; Maroufi, S.S.; Dowlati, M.; Sheikhi, R.A. The importance of education on disasters and emergencies: A review article. J. Educ. Health Promot. 2019, 8, 85. [Google Scholar] [CrossRef]
  37. Kousky, C. The role of natural disaster insurance in recovery and risk reduction. Annu. Rev. Resour. Econ. 2019, 11, 399–418. [Google Scholar] [CrossRef]
  38. Antronico, L.; Coscarelli, R.; De Pascale, F.; Condino, F. Social Perception of Geo-Hydrological Risk in the Context of Urban Disaster Risk Reduction: A Comparison between Experts and Population in an Area of Southern Italy. Sustainability 2019, 11, 2061. [Google Scholar] [CrossRef]
  39. Urdan, T.; Kaplan, A. The origins, evolution, and future directions of achievement goal theory. Contemp. Educ. Psychol. 2020, 61, 101862. [Google Scholar] [CrossRef]
  40. Ainscough, J.; Lentsch, A.D.V.; Metzger, M.; Rounsevell, M.; Schröter, M.; Delbaere, B.; de Groot, R.; Staes, J. Navigating pluralism: Understanding perceptions of the ecosystem services concept. Ecosyst. Serv. 2019, 36, 100892. [Google Scholar] [CrossRef]
  41. Dasgupta, S. The Economics of Biodiversity: The Dasgupta Review; Hm Treasury: London, UK, 2021.
  42. Quevedo, J.M.D.; Uchiyama, Y.; Kohsaka, R. Perceptions of local communities on mangrove forests, their services and management: Implications for Eco-DRR and blue carbon management for Eastern Samar, Philippines. J. For. Res. 2019, 25, 1–11. [Google Scholar] [CrossRef]
Figure 1. Distribution of respondents.
Sustainability 15 03154 g001
Figure 2. (a) Personal attributes of the respondent. (b) Personal attributes of the respondent.
Sustainability 15 03154 g002aSustainability 15 03154 g002b
Figure 3. Distribution of ecosystems.
Sustainability 15 03154 g003aSustainability 15 03154 g003bSustainability 15 03154 g003cSustainability 15 03154 g003dSustainability 15 03154 g003e
Figure 4. Areas categorized as megalopolis in this study.
Sustainability 15 03154 g004
Figure 5. Proximity (in km) of the user’s residence to the ecosystem compared to nonusers. Blue indicates that the user lives nearby, and orange indicates that the user lives far away. The darker the color, the clearer the difference. *** p < 0.01, ** p < 0.05.
Sustainability 15 03154 g005
Figure 6. Proximity (in km) of the people with disaster anxiousness/experience compared to those without. Green indicates that people recognize that living near the ecosystem reduces disaster risk, and orange indicates that people recognize that living near the ecosystem is associated with disaster risk. The darker the color, the more likely it is. *** p < 0.01, ** p < 0.05, * p < 0.10.
Sustainability 15 03154 g006
Figure 7. Compositional processes of the impact of disaster experience and anxiousness on WTP.
Sustainability 15 03154 g007
Figure 8. Expansion of the social recognition of the disaster prevention and mitigation functions of ecosystems.
Sustainability 15 03154 g008
Figure 9. Stages of social recognition of the disaster prevention and mitigation functions of ecosystems. The closer the color is to brown, the more serious the current situation.
Sustainability 15 03154 g009
Table 1. Regression models estimated with ordinal logit model (Model 4).
WTP 0/1T/2T/5TPaddy FieldCrop FieldOrchardPasture LandArtificial ForestNatural ForestCDP ForestCoral ReefMangrove ForestSeaweed BedTidal FlatBeach
Socio-Economic Factor
Household Income0.143 ***0.158 ***0.137 ***0.133 ***0.149 ***0.186 ***0.154 ***0.156 ***0.156 ***0.161 ***0.175 ***0.150 ***
(0.034)(0.034)(0.034)(0.034)(0.034)(0.034)(0.034)(0.034)(0.034)(0.034)(0.034)(0.034)
Sex (male = 1, female = 0)−0.365 ***−0.400 ***−0.397 ***−0.418 ***−0.403 ***−0.367 ***−0.420 ***−0.454 ***−0.454 ***−0.438 ***−0.419 ***−0.328 ***
(0.059)(0.059)(0.059)(0.060)(0.060)(0.060)(0.060)(0.059)(0.060)(0.060)(0.060)(0.060)
Age−0.037−0.034−0.050−0.040.0520.0340.0400.0490.059 *0.0450.0520.055 *
(0.027)(0.027)(0.027)(0.028)(0.027)(0.027)(0.027)(0.027)(0.027)(0.028)(0.028)(0.028)
Family size0.0540.0490.0320.0430.000−0.012−0.0120.0090.015−0.008−0.0180.003
(0.029)(0.029)(0.029)(0.029)(0.029)(0.029)(0.029)(0.029)(0.029)(0.029)(0.029)(0.029)
Number of Children0.0070.0180.0430.0140.0170.0100.0150.0130.0200.0300.0570.040
(0.044)(0.044)(0.044)(0.044)(0.044)(0.044)(0.044)(0.044)(0.044)(0.044)(0.044)(0.044)
Graduate University0.258 ***0.224 ***0.210 ***0.161 **0.261 ***0.285 ***0.248 ***0.233 ***0.227 ***0.238 ***0.205 ***0.220 ***
(0.060)(0.060)(0.060)(0.060)(0.060)(0.060)(0.060)(0.060)(0.060)(0.060)(0.061)(0.060)
Spatial Factor
Live in Megalopolis−0.170 *−0.058−0.016−0.030−0.177 *−0.102−0.091−0.097−0.112−0.113−0.126−0.128
(0.068)(0.071)(0.072)(0.072)(0.077)(0.077)(0.077)(0.068)(0.066)(0.069)(0.067)(0.066)
Distance to Target ecosystem0.050−0.084 *−0.080 *−0.087 **0.004−0.030−0.0400.0110.042−0.084 *0.0540.003
(0.030)(0.033)(0.033)(0.033)(0.036)(0.036)(0.036)(0.033)(0.032)(0.038)(0.036)(0.039)
Distance to Substitute−0.033−0.037−0.048−0.043−0.0100.009−0.0130.000−0.0070.047−0.0190.019
(0.030)(0.030)(0.030)(0.030)(0.030)(0.030)(0.030)(0.030)(0.032)(0.040)(0.033)(0.040)
Usage Factor
User0.496 ***0.583 ***0.539 ***0.539 ***0.639 ***0.745 ***0.694 ***0.627 ***0.665 ***0.527 ***0.595 ***0.700 ***
(0.067)(0.071)(0.062)(0.058)(0.062)(0.063)(0.062)(0.070)(0.083)(0.075)(0.065)(0.062)
Disaster Factor
Experience of Storms, Tornadoes0.0830.069−0.004−0.0310.0460.1360.1000.0730.079−0.078−0.108−0.085
(0.091)(0.091)(0.092)(0.092)(0.092)(0.092)(0.093)(0.092)(0.093)(0.093)(0.093)(0.093)
Experience of Flood by Heavy Rain0.0890.1170.044−0.019−0.0850.0360.047−0.072−0.1350.0630.0680.093
(0.099)(0.099)(0.100)(0.101)(0.102)(0.101)(0.101)(0.102)(0.102)(0.101)(0.101)(0.101)
Experience of Landslides0.453 *0.431 *0.593 **0.556 **0.3460.3450.3590.596 **0.577 **0.548 **0.568 **0.578 **
(0.196)(0.198)(0.198)(0.198)(0.199)(0.200)(0.202)(0.203)(0.200)(0.204)(0.205)(0.206)
Experience of Heavy Snow, Avalanches0.466 ***0.438 ***0.372 **0.359 **0.396 **0.491 ***0.465 ***0.401 ***0.432 ***0.362 **0.367 **0.370 **
(0.121)(0.120)(0.121)(0.121)(0.122)(0.120)(0.120)(0.119)(0.120)(0.121)(0.123)(0.122)
Experience of Flood by Storm Surge0.011−0.0010.0410.169−0.209−0.293−0.305−0.340−0.2910.067−0.042−0.370
(0.343)(0.350)(0.346)(0.349)(0.345)(0.343)(0.340)(0.341)(0.338)(0.346)(0.345)(0.352)
Experience of Earthquake, Liquefaction0.1050.1150.1280.1540.1150.1220.1160.1570.1580.169 *0.184 *0.209 *
(0.083)(0.083)(0.083)(0.083)(0.084)(0.084)(0.084)(0.083)(0.084)(0.084)(0.085)(0.085)
Experience of Tsunami0.1910.3260.3780.2280.4100.523 *0.666 **0.3800.540 *0.3770.3080.281
(0.222)(0.222)(0.223)(0.225)(0.221)(0.223)(0.223)(0.220)(0.224)(0.225)(0.226)(0.229)
Experience of Fire0.3450.4180.3530.3260.2980.1210.1680.3710.2710.2480.2620.177
(0.220)(0.224)(0.225)(0.226)(0.223)(0.223)(0.226)(0.223)(0.228)(0.224)(0.229)(0.226)
Anxious of Storms, Tornadoes0.0200.0120.0350.039−0.061−0.091−0.017−0.0010.0130.0030.0110.009
(0.066)(0.066)(0.066)(0.066)(0.066)(0.066)(0.066)(0.066)(0.066)(0.066)(0.067)(0.066)
Anxious of Flood by Heavy Rain0.0400.0380.0740.0620.1190.1310.142 *0.0950.139 *0.168 *0.1170.133
(0.068)(0.069)(0.069)(0.069)(0.069)(0.069)(0.069)(0.069)(0.069)(0.069)(0.069)(0.069)
Anxious of Landslides−0.027−0.005−0.068−0.077−0.010−0.054−0.052−0.031−0.038−0.051−0.071−0.073
(0.073)(0.073)(0.073)(0.074)(0.073)(0.073)(0.073)(0.074)(0.074)(0.074)(0.074)(0.074)
Anxious of Heavy Snow, Avalanches−0.116−0.119−0.069−0.132−0.263 ***−0.305 ***−0.293 ***−0.345 ***−0.352 ***−0.323 ***−0.291 ***−0.239 **
(0.078)(0.078)(0.078)(0.079)(0.079)(0.079)(0.079)(0.083)(0.083)(0.081)(0.084)(0.080)
Anxious of Flood by Storm Surge−0.248 *−0.223 *−0.152−0.196−0.126−0.253 *−0.157−0.156−0.136−0.225 *−0.165−0.084
(0.101)(0.101)(0.101)(0.102)(0.101)(0.101)(0.101)(0.102)(0.102)(0.102)(0.102)(0.102)
Anxious of Earthquake, Liquefaction−0.047−0.0120.0190.009−0.0070.0310.0400.0380.06−0.0370.0180.000
(0.066)(0.066)(0.066)(0.067)(0.066)(0.066)(0.066)(0.066)(0.066)(0.067)(0.067)(0.067)
Anxious of Tsunami0.1610.181 *0.1500.222 *0.1540.209 *0.259 **0.1350.1270.195 *0.1480.178
(0.088)(0.088)(0.089)(0.089)(0.089)(0.089)(0.088)(0.091)(0.091)(0.091)(0.091)(0.091)
Anxious of Fire0.262 ***0.221 **0.167 *0.203 **0.217 **0.272 ***0.211 **0.252 ***0.240 ***0.264 ***0.243 ***0.167 *
(0.070)(0.070)(0.070)(0.071)(0.070)(0.070)(0.070)(0.070)(0.070)(0.070)(0.070)(0.070)
cut1 (WTP = 0 JPY)−0.176 *−0.079−0.119−0.193 *−0.237 **−0.361 ***−0.255 **−0.552 ***−0.450 ***−0.491 ***−0.458 ***−0.168 *
(0.089)(0.092)(0.085)(0.080)(0.084)(0.084)(0.084)(0.077)(0.076)(0.077)(0.077)(0.084)
cut2 (WTP = 1000 JPY)1.807 ***1.917 ***1.891 ***1.865 ***1.893 ***1.917 ***1.942 ***1.587 ***1.643 ***1.657 ***1.722 ***1.993 ***
(0.093)(0.097)(0.090)(0.085)(0.089)(0.090)(0.090)(0.081)(0.081)(0.081)(0.082)(0.089)
cut3 (WTP = 2000 JPY)2.667 ***2.781 ***2.791 ***2.751 ***2.860 ***2.849 ***2.871 ***2.504 ***2.593 ***2.618 ***2.707 ***2.956 ***
(0.099)(0.103)(0.097)(0.093)(0.097)(0.096)(0.097)(0.088)(0.089)(0.090)(0.091)(0.098)
cut4 (WTP = 5000 JPY)3.484 ***3.615 ***3.692 ***3.587 ***3.705 ***3.734 ***3.742 ***3.411 ***3.441 ***3.494 ***3.586 ***3.867 ***
(0.111)(0.114)(0.112)(0.108)(0.111)(0.109)(0.110)(0.104)(0.105)(0.107)(0.109)(0.114)
AIC11,246.9611,181.6910,958.9910,736.2910,902.9711,102.4311,014.9410,987.6810,819.8310,712.7810,647.1510,799.28
N442844274416441644334438443044184414440544064413
*** p < 0.01, ** p < 0.05, * p < 0.10. Standard errors in parentheses.
Table 2. Regression models estimated with ordinal logit model (Model 5). Difference in regression coefficients by use status.
WTP 0/1T/2T/5TPaddy
Field
Crop
Field
OrchardPasture
Land
Artificial
Forest
Natural
Forest
CDP
Forest
Coral
Reef
Mangrove
Forest
Seaweed
Bed
Tidal
Flat
Beach
User
Live in Megalopolis Dummy−0.123−0.0110.0770.1560.0050.1170.1100.1510.352 *−0.0080.289 *0.090
(0.082)(0.081)(0.088)(0.100)(0.092)(0.092)(0.092)(0.127)(0.164)(0.147)(0.119)(0.079)
Distance to Target ecosystem0.030−0.077 *−0.055−0.077−0.040−0.081−0.105 *−0.099−0.1180.0640.047−0.070
(0.042)(0.038)(0.041)(0.046)(0.044)(0.044)(0.044)(0.081)(0.095)(0.087)(0.072)(0.049)
Distance to Substitute−0.03−0.033−0.078 *−0.111 **−0.030−0.009−0.045−0.0680.022−0.143−0.1020.003
(0.033)(0.033)(0.037)(0.042)(0.035)(0.035)(0.035)(0.065)(0.086)(0.091)(0.068)(0.051)
Nonuser
Live in Megalopolis Dummy−0.304 **−0.258−0.206−0.214 *−0.523 ***−0.512 ***−0.469 ***−0.180 *−0.191 **−0.144−0.306 ***−0.551 ***
(0.116)(0.135)(0.114)(0.097)(0.125)(0.124)(0.125)(0.078)(0.071)(0.077)(0.079)(0.107)
Distance to Target ecosystem0.049−0.128−0.144 *−0.100 *0.0700.0440.0590.0270.056−0.120 **0.0530.131 *
(0.047)(0.068)(0.058)(0.049)(0.059)(0.059)(0.059)(0.036)(0.034)(0.043)(0.042)(0.065)
Distance to Substitute−0.012−0.0330.0250.0480.0590.0760.0930.019−0.0070.088 *−0.001−0.008
(0.075)(0.083)(0.053)(0.046)(0.058)(0.059)(0.059)(0.034)(0.034)(0.044)(0.038)(0.065)
*** p < 0.01, ** p < 0.05, * p < 0.10. Standard errors in parentheses.
Disclaimer/Publisher’s Note: The statements, opinions and data contained in all publications are solely those of the individual author(s) and contributor(s) and not of MDPI and/or the editor(s). MDPI and/or the editor(s) disclaim responsibility for any injury to people or property resulting from any ideas, methods, instructions or products referred to in the content.

