Article

Dry and Wet Deposition Fluxes and Source of Atmospheric Mercury in the Forest in Southeast China

1
School of Atmospheric Sciences, Sun Yat-sen University, Zhuhai 519082, China
2
Institute for Environment and Climate Research, Jinan University, Guangzhou 511443, China
3
Foshan Ecological and Environmental Monitoring Station of Guangdong Province, Foshan 528000, China
*
Author to whom correspondence should be addressed.
These authors contributed equally to this work.
Sustainability 2023, 15(4), 3213; https://doi.org/10.3390/su15043213
Submission received: 3 December 2022 / Revised: 21 January 2023 / Accepted: 7 February 2023 / Published: 9 February 2023
(This article belongs to the Special Issue Advances in Land-Atmosphere Interactions)

Abstract

:
Studying atmospheric mercury (Hg) deposition in a forest system is a key step to understanding Hg biogeochemical cycles. However, observations based on Hg deposition fluxes in worldwide stations under forest ecosystems tend to differ considerably. In this work, a sampling station was set up in Dinghu Mountain to study the atmospheric Hg’s dry and wet deposition in typical forest ecosystems in Southeast China. One hundred and two atmospheric dry and wet deposition samples were collected with an automatic sampler from March 2009 to February 2010, and concentrations of Hg, magnesium (Mg), calcium (Ca), cadmium (Cd), copper (Cu), zinc (Zn), lead (Pb), and chromium (Cr) were detected. The results showed that the annual rainfall weighted average Hg concentration was 56.8 ng L−1, and 79.8 ng L−1 in the dry deposition. The mean total deposition flux was 158.8 μg m−2, and the wet deposition was predominant. The highest and lowest concentrations were detected in the high-temperature rainy season. Generally, the wet deposition flux was notably positively correlated with the rainfall. The source of atmospheric Hg deposition in Dinghu Mountain was analyzed using principal component analysis (PCA). The main source of Hg in precipitation was soil dust, followed by coal and fuel (automobile exhaust). The primary source of Hg in dry deposition was fuel (automobile exhaust), followed by soil dust, which indicates that Dinghu Mountain has been polluted by the anthropogenic sources of Hg.

1. Introduction

Hg is the only highly toxic metal element with a liquid form at normal temperature and pressure. Atmospheric Hg mainly exists in three different forms: gaseous elemental mercury (GEM), reactive gaseous mercury (RGM), and particulate-bound mercury (PBM). A total of 95% of Hg exists as GEM for a long period of 0.5–2 years in the atmosphere [1,2] and is globally transmitted with atmospheric circulation. GEM is easily soluble in water and falls into surfaces through atmospheric precipitation, while dry and wet deposition are observed for RGM [3]. Hg deposition values in the forest are 3–5 times higher than in low vegetation sites [4]. Atmospheric deposition is an important method for migrating Hg to environmental media (e.g., forest vegetation).
The forest system is an essential sink and source for atmospheric Hg [5]. As one of the most active regions in the biogeochemical cycle, the forest ecosystem accounts for 31% of the global continental area [6]. Some studies indicate that anthropogenic Hg emissions have aggravated the deposition of Hg in the forest and enhanced the degradation rate of litterfall and re-release of Hg, especially under the global warming trend [7,8,9]. Recently, tropical forests have been found to be a converter of Hg sink to Hg source in the global atmospheric Hg cycle [10]. Therefore, the environmental behavior of Hg in forest ecosystems needs more detailed research in the global Hg cycle.
Previous studies indicated that the vegetation type, altitude topography, and meteorological conditions are the major influencing factors for the atmospheric deposition of Hg by establishing stations in the United States and Canada [11,12]. A series of long-term studies on inputs, outputs, and sources of Hg from a typical subtropical forest ecosystem in Southwest China showed that atmospheric dry and wet deposition was an essential method for the transmission of Hg from atmospheric to terrestrial and aquatic systems [13,14,15]. However, the observation results of the Hg dry and wet deposition flux in different forest system are quite different in magnitude (summarized in Table S1).
Dinghu Mountain is a forest located in southeastern China and it is the only subtropical forest ecosystem on the Tropic of Cancer. The reserve encompasses three typical forests, including pinus massoniana coniferous forests, pinus massoniana coniferous broadleaf mixed forests, and monsoon evergreen broadleaf forests. The zonal soils in the region are erythronic, with yellow soils and mountain potted meadow soils vertically distributed in mountains. The tallest summit is 1000.30 m. It is a national nature reserve and the nearest original forest area to the cities. In addition, industrial and agricultural production (e.g., ceramic manufacturing, cement production, and electronics, etc.) and human life activities in the surroundings of Dinghu Mountain can heavily affect the local Hg deposition. The objectives of this study are: (1) to clarify the seasonal trends of the concentration and the dry and wet Hg deposition fluxes in Dinghu Mountain; (2) to explore the source of dry and wet Hg deposition using the PCA to investigate the relationship between total Hg and Mg, Ca, Cd, Cu, Zn, Pb, Cr; and (3) to assess the impact of the precipitation on the atmospheric Hg deposition. The results can enrich the basic data of atmospheric Hg background level in southeastern China and the Hg biogeochemical cycle.

2. Materials and Methods

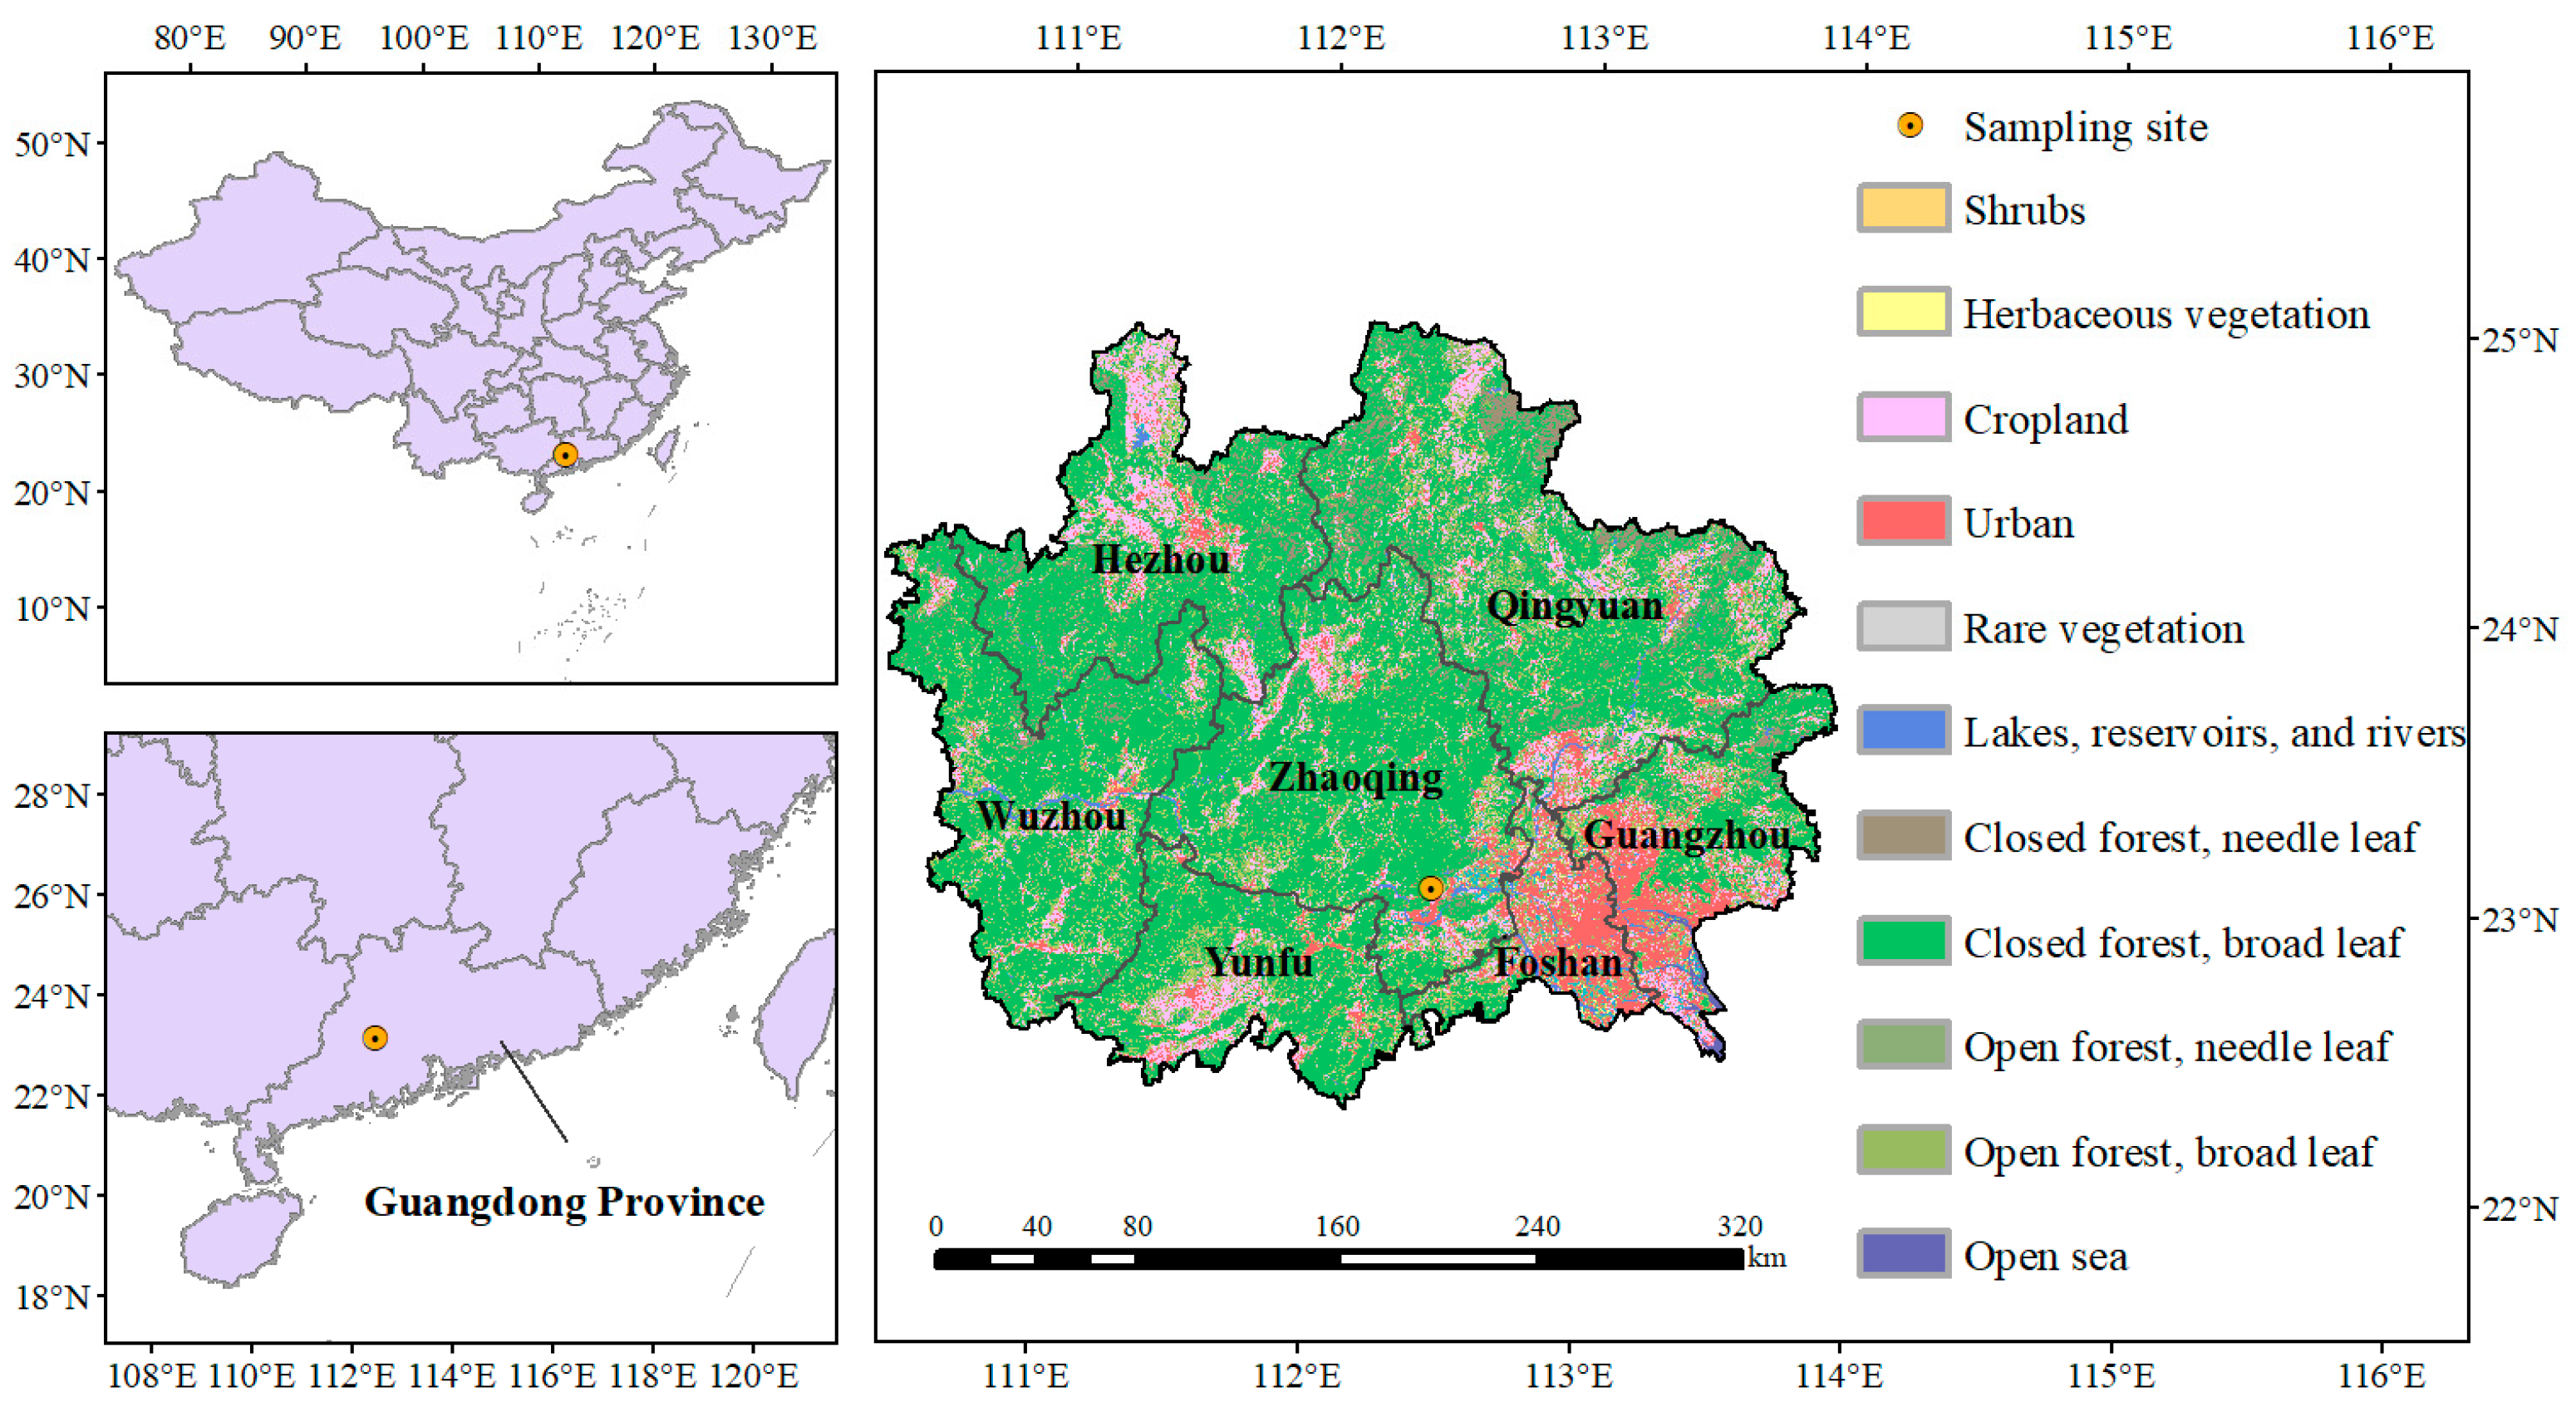
2.1. Sampling Site and Sample Collection

Dinghu Mountain is located in Zhaoqing, South China (Figure 1). Dinghu Mountain is under the influence of the South Asian tropical monsoon, which is warm and humid during the whole year, rainier in summer and less so in winter. Average annual rainfall and evaporation are 1929 mm and 1115 mm, respectively. The pH of atmospheric precipitation ranged from 4.35 to 5.65, and acid rain frequency was above 62.7%. The sampling point (112°32′55″ E, 23°10′01″ N) is in the east of Dinghu Mountain, with an altitude of about 100 m (Figure 1 and Figure S1). Sampling instruments (deposition cylinder, with a diameter of 22 cm, which conforms to HJ/T 165-2004) are located on the roof of a building in the station (Figure S2), about 8 m from the ground. The sampler consists of dry and wet deposition cylinders and sensors, with an active cover plate on the upper face of the dry and wet deposition cylinders. The plates are covered on wet deposition cylinders in the absence of rainfall, whereas dry deposition cylinders are in the open state. The cover swings to open the wet deposition cylinders and close the dry ones with instrument sensors during rainfall. In addition, both dissolved and suspended particulate matter were included in deposition samples collected during non-rainfall periods. Then, 1000 mL ultrapure water was added before the dry deposition sampling, and defined as liquid collection volume (L). A total of 102 samples (including 78 wet deposition samples and 24 dry deposition samples) were collected from the stations between March 2009 and February 2010. The dry deposition samples were gathered on the 15th and the last day of each month, while the wet ones were collected on rainfall days until the next morning.

2.2. Laboratory and Statistical Analysis

Prior to analysis, all samples were added to a hydrochloric acid solution concentration of 0.5% (v/v), and were then analyzed within 24 h of sampling. Sample solutions for Hg were measured using an atomic fluorescence spectrometer (AFS-820, Jitian, Beijing, China). Cd, Cu, Zn, Pb, and Cr were determined with a graphite furnace using (Z-2000, Hitachi, Tokyo, Japan) atomic absorption spectrophotometer, and Mg and Ca were determined using the flame method. PCA was used to analyze atmospheric Hg deposition sources, and SPSS was used to calculate the percentage of explained variance for each factor.

2.3. Quality Assurance/Quality Control

The arithmetic mean value of the measured Hg with ultrapure water (Milli-QA10, resistivity 18.2 M Ω · cm) prepared in a continuous determination laboratory 20 times was used as the detection limit (DL) of Hg (0.112 ng L−1), and half of the DL (0.056 ng L−1) was assigned when the value was lower than the DL (n.d.). Parallel samples and spiked recovery were used for quality control. One sample for every ten samples was selected for parallel and spiked recovery experiments, with relative standard deviations and recoveries between 3–5% and 94.6–105.3%, respectively.

2.4. Calculation for Deposition Flux

The wet deposition flux was calculated as follows:
  F w i = C p i × p i
where Fwi represented the wet deposition flux (μg m−2), and Cpi was defined as the concentration of Hg in precipitation collected (ng L−1). Precipitation (pi, mm) was provided by the Dinghu Mountain Forest Ecosystem Research Station.
The dry deposition flux was approximated as in Equation [16]:
  F d = i = 1 n C i × L A
where Fd was the dry deposition flux (μg m−2), and n represented the number of samplings in unit time period. Ci was the concentration of Hg (ng L−1). L was the liquid collection volume (L), and A was regarded as the sampler surface (m2).

3. Results and Discussion

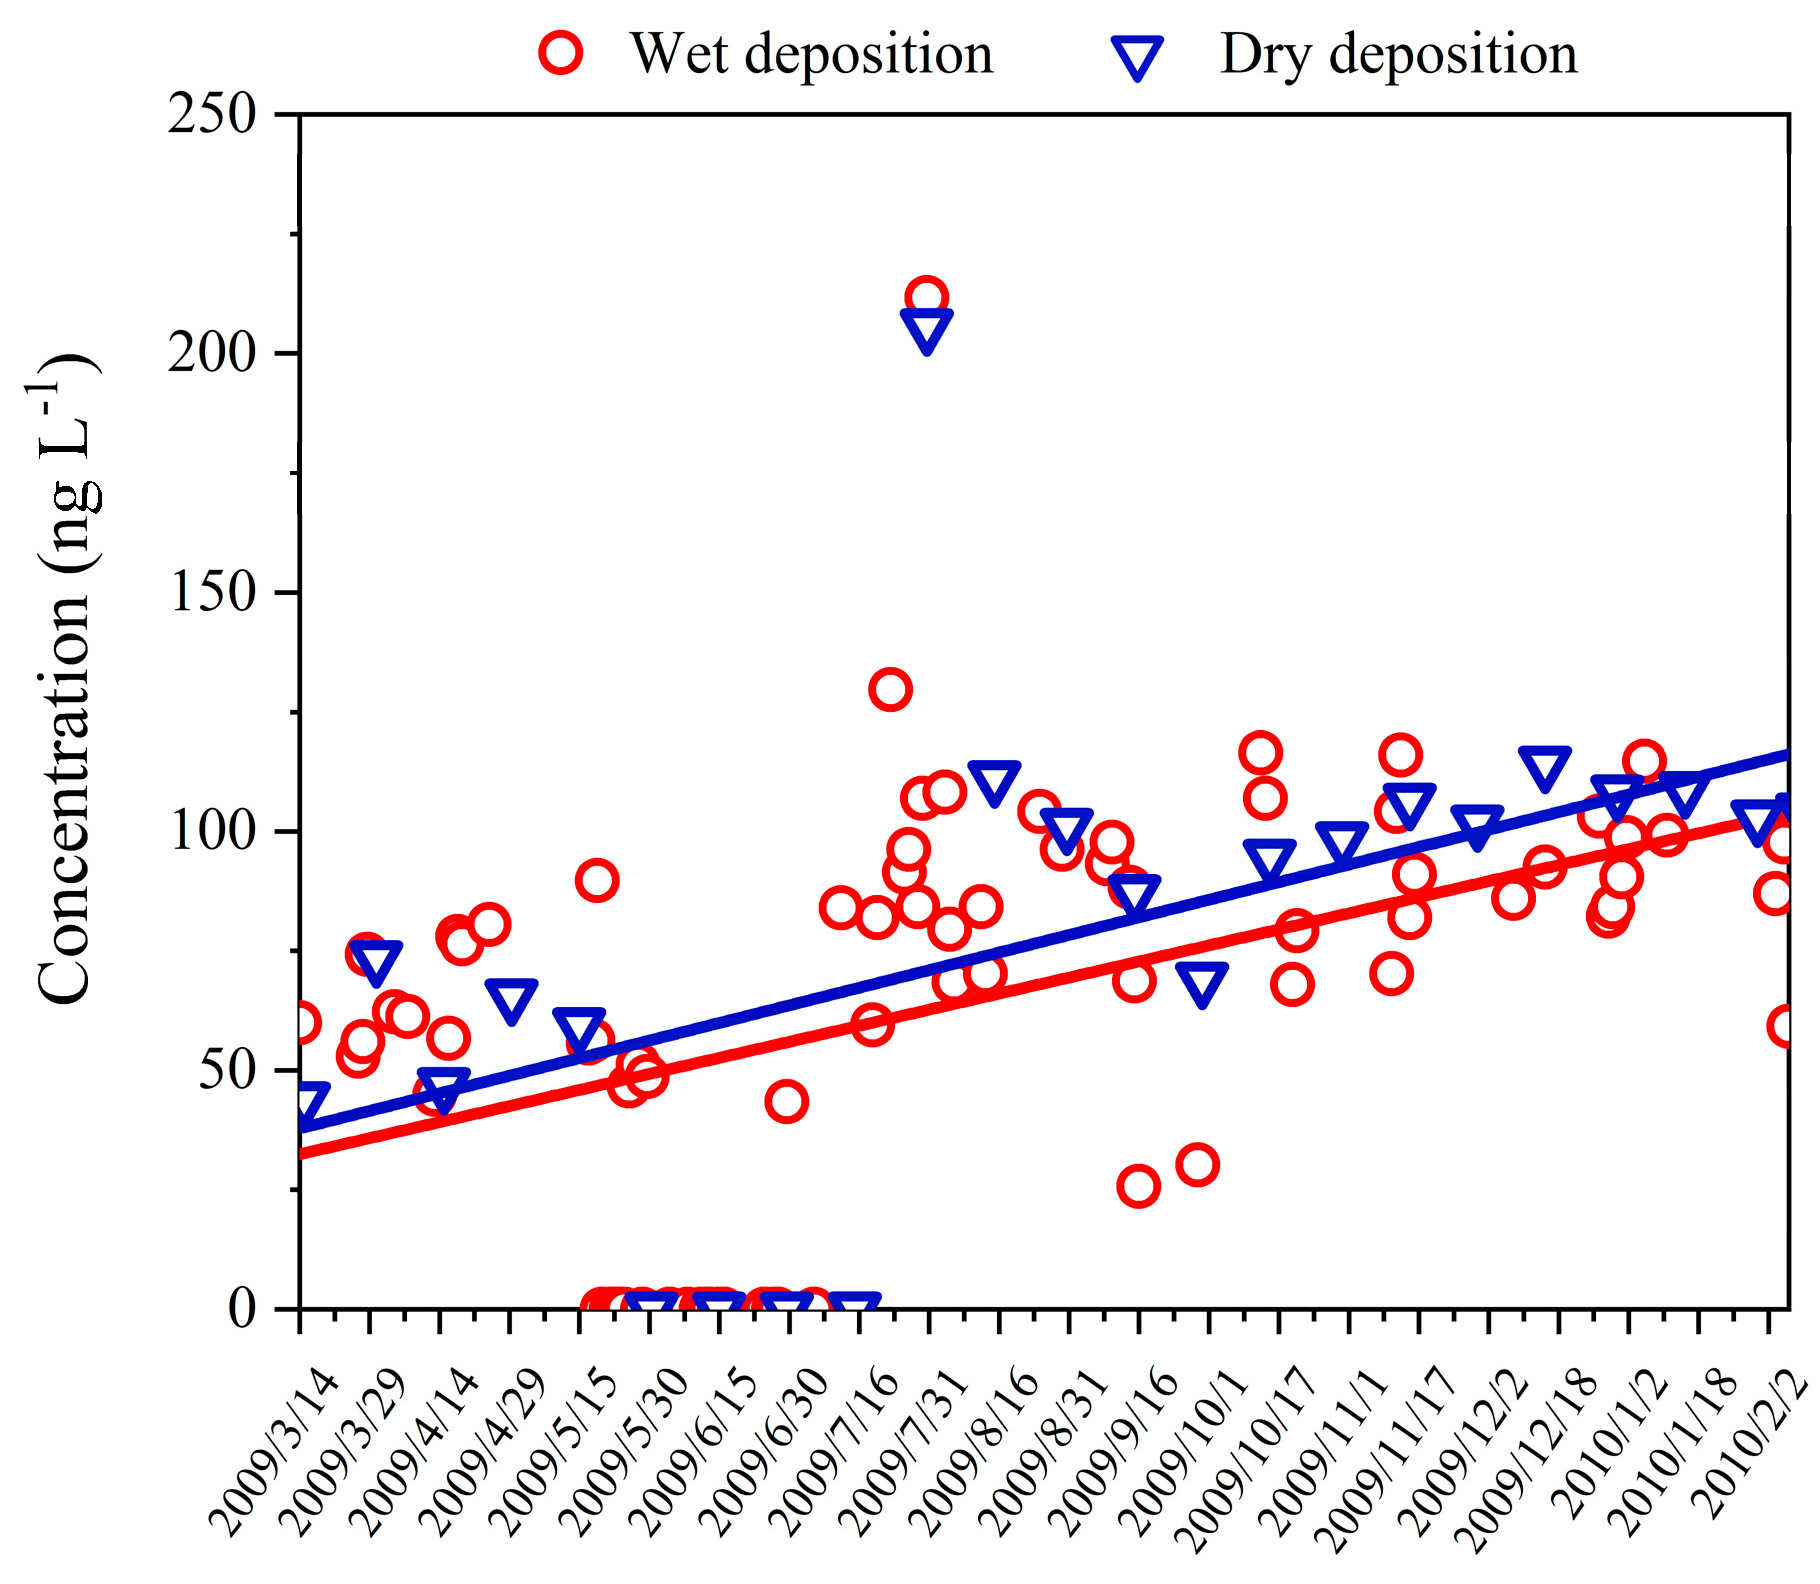
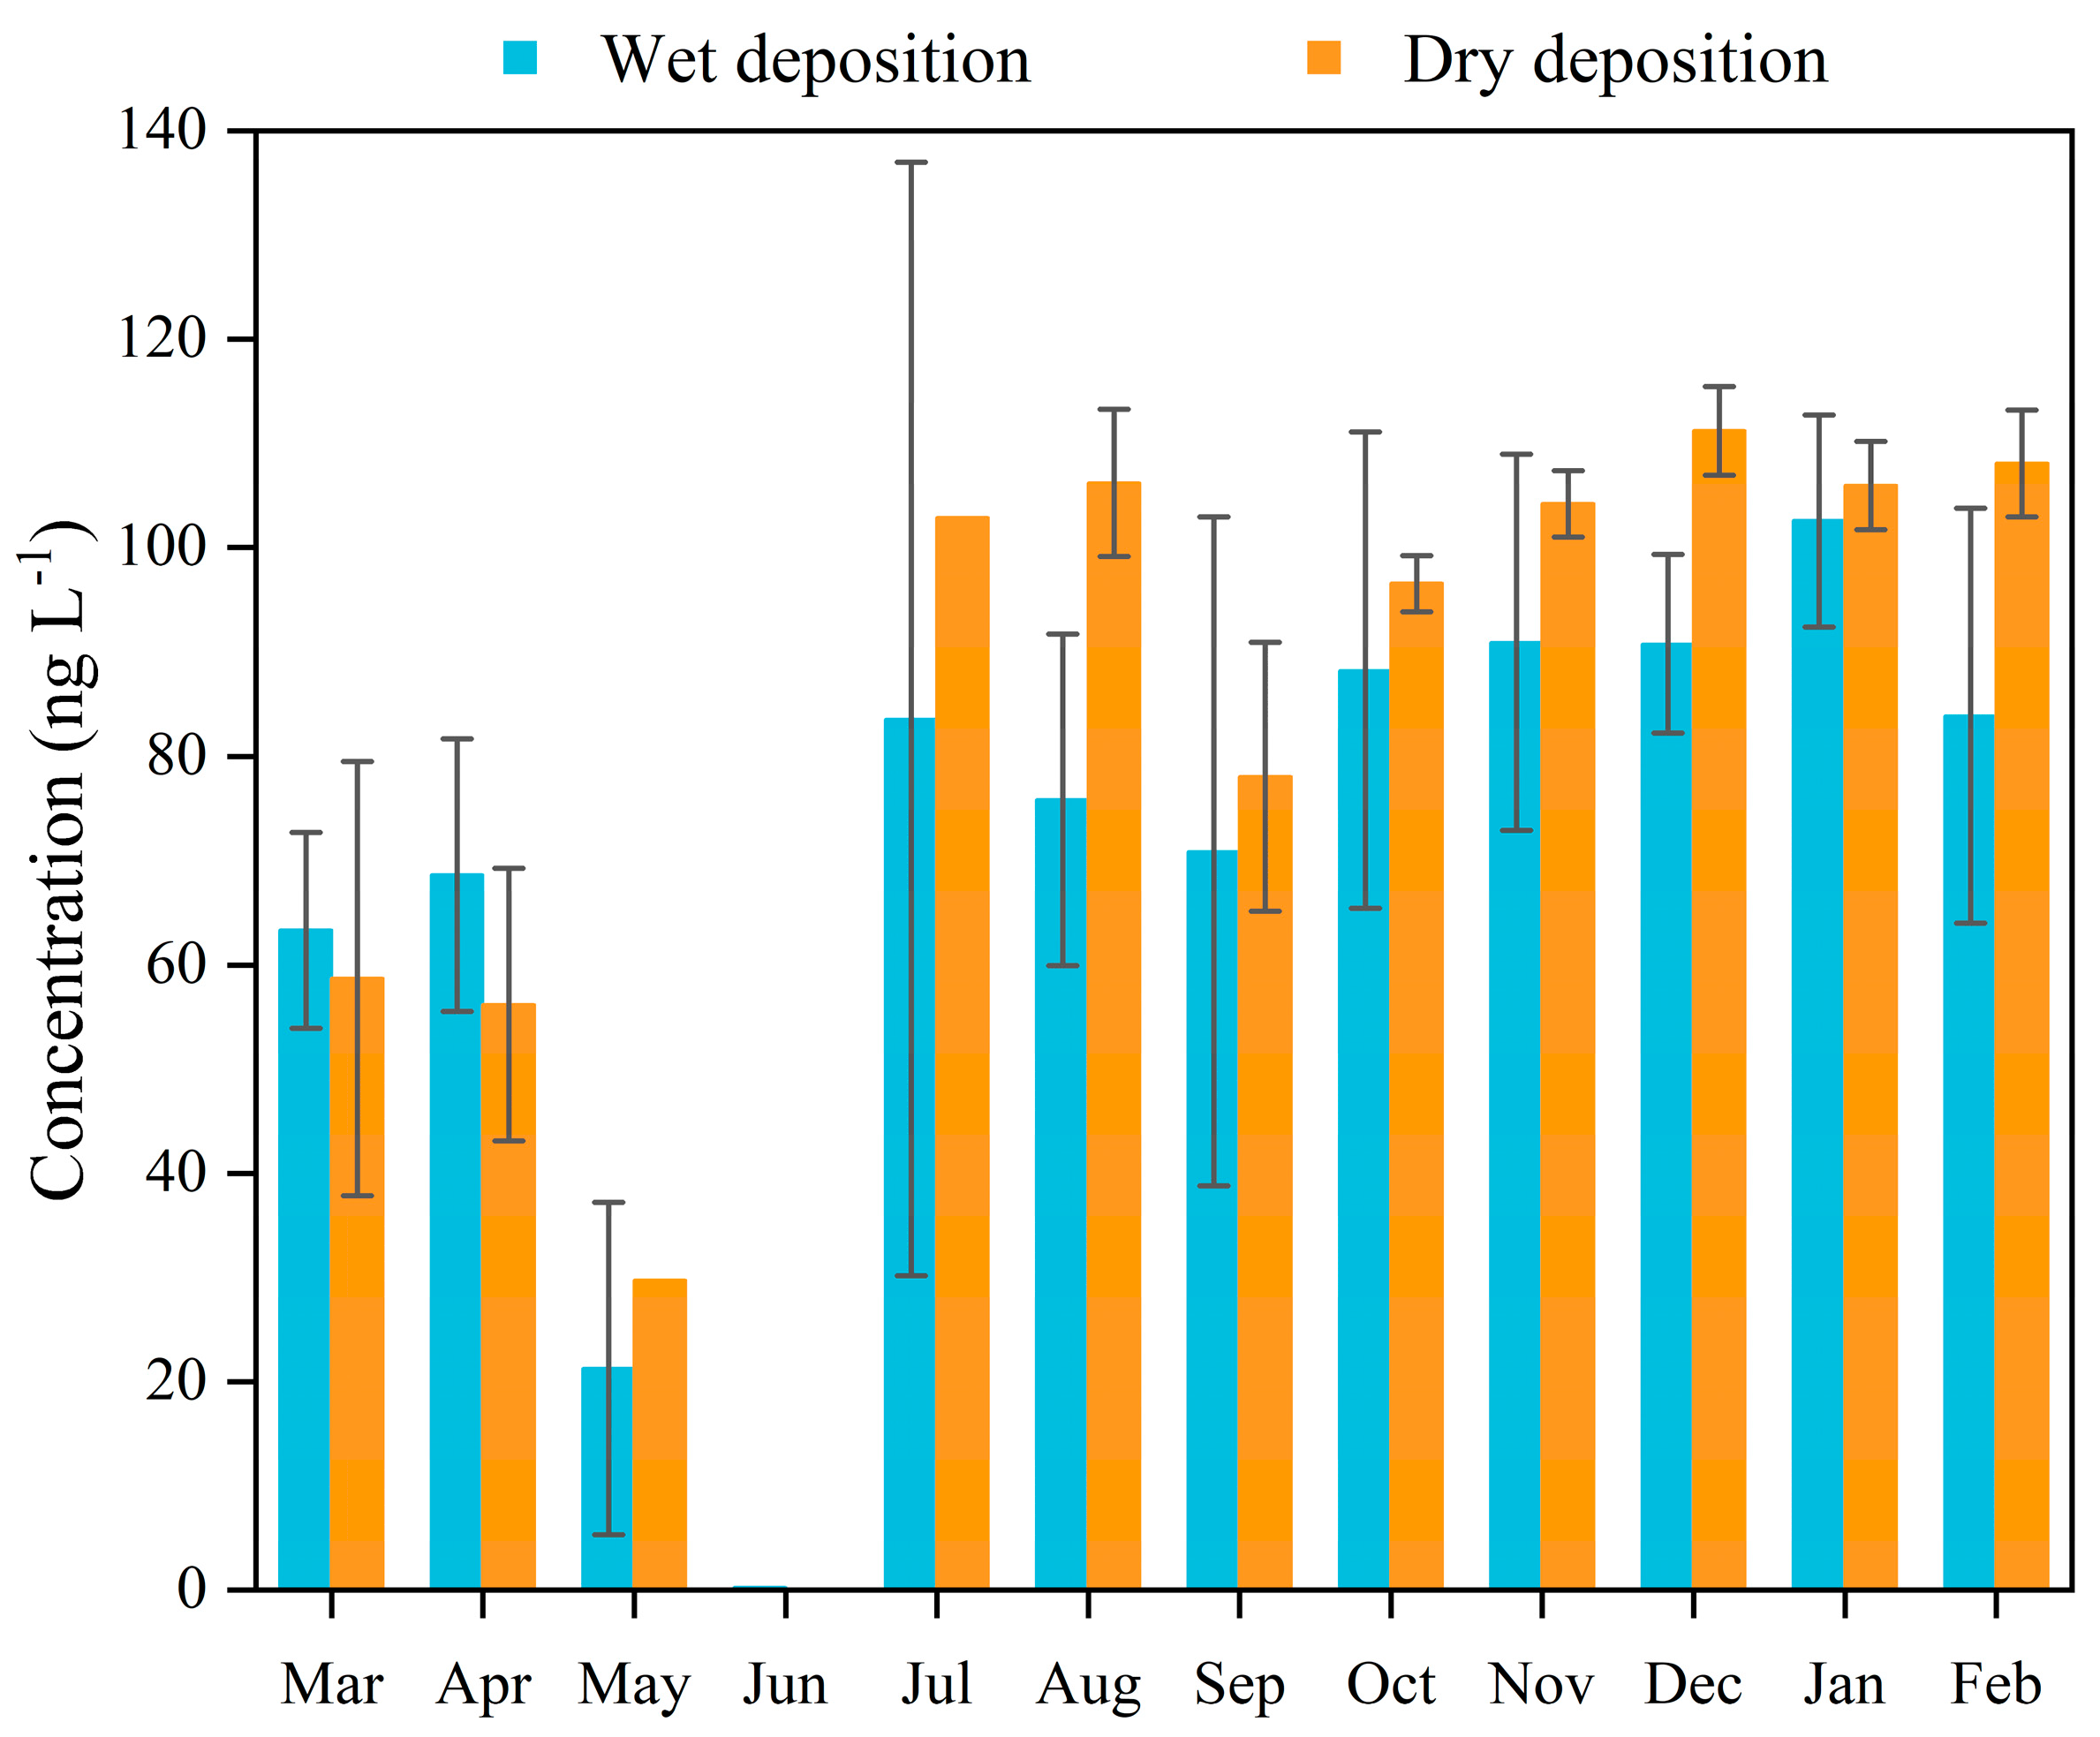
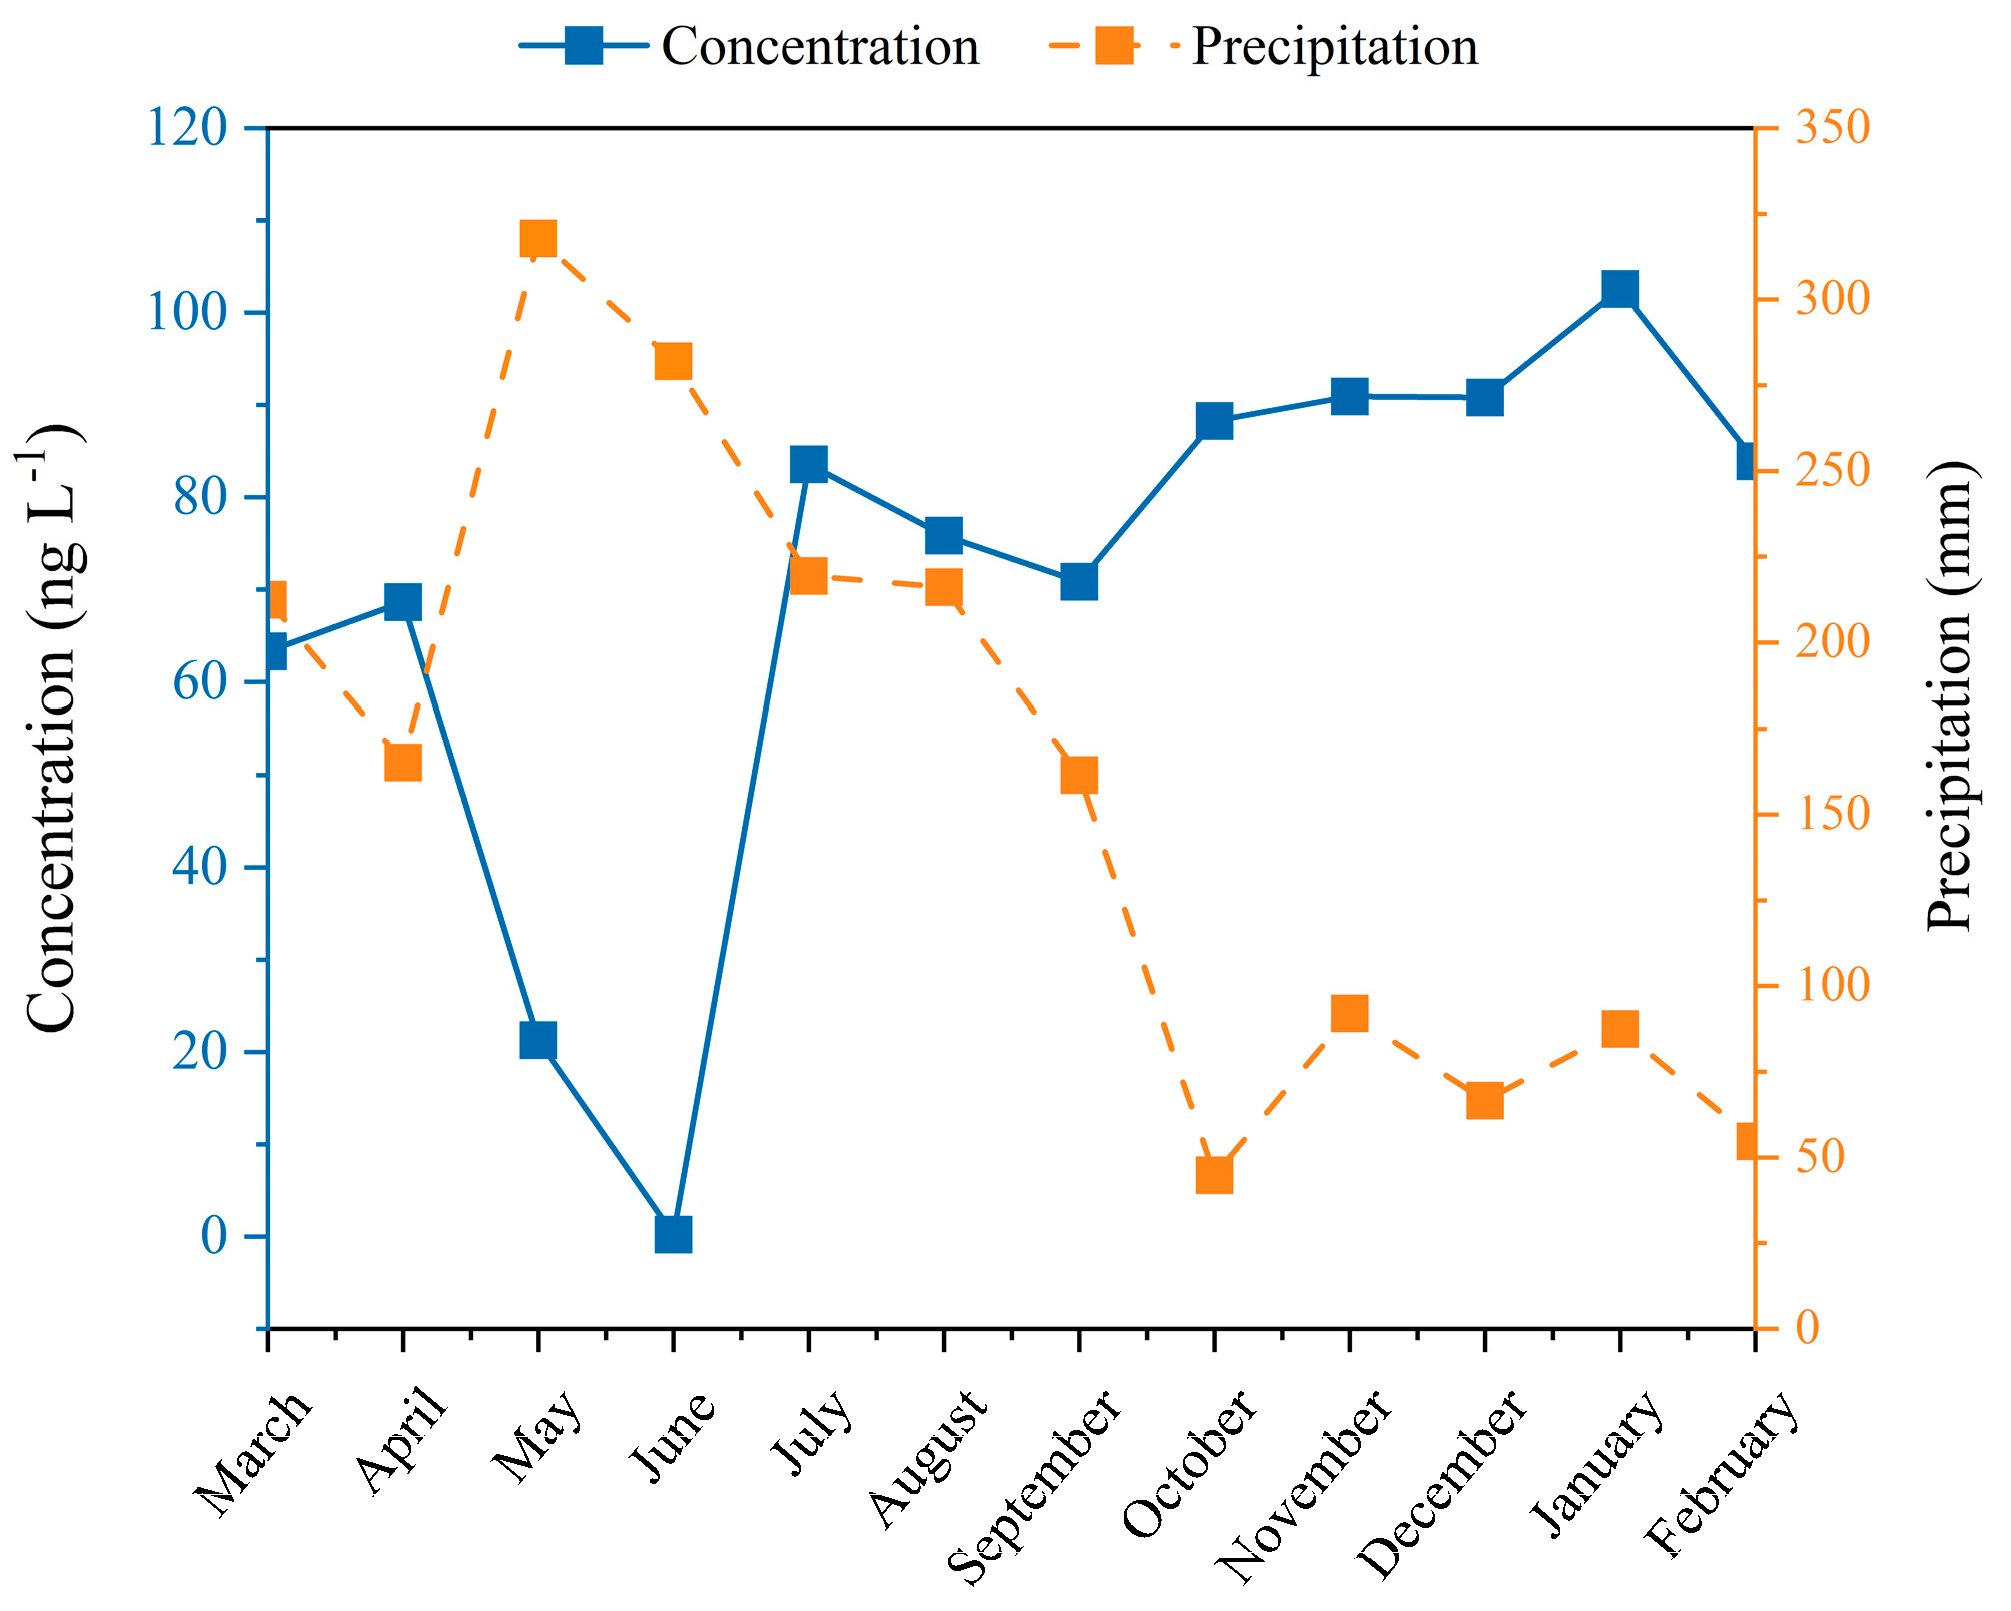
3.1. The Concentration and Seasonal Trends of Hg

The Hg detection rate of the wet deposition samples and the dry ones was 79.5% and 91.7%, respectively. The Hg concentrations ranged from n.d. to 211.7 ng L−1 (weighted average of annual: 56.8 ng L−1), and from n.d. to 205.7 ng L−1 (weighted average of annual: 79.8 ng L−1) for the precipitation and the dry deposition, respectively (Figure 2). As Table 1 shows, the concentrations of precipitation in metropolises such as Beijing and Shanghai were one order of magnitude higher than those in rural environments and forests [17,18], while the average level in Dinghu Mountain was a little higher than that in Southwest China [19,20], the United States (USA) [21,22], Republic of Korea [23], and Mexico [24]. The results indicated that the deposition of Hg was related to the anthropogenic emission sources. Notably, the highest deposition Hg event was observed on July 31th, and some electronic waste disposal industries settled in northeast Guangzhou, Qingyuan, which may be contributing to the upper northeast atmosphere delivering the non-local atmospheric Hg (Figure S3). In addition, the Hg concentration in the dry deposition was observed to have the higher values, which suggested that Hg pollution caused by dry deposition is also an essential process during precipitation. The same trends between the wet deposition and the dry indicated that they may have had similar sources.
The months from March to May were considered to be spring, June to August summer, September to November autumn, and December to the next year’s February winter. The Hg concentrations suggested significant seasonal variations in Figure 3, which presented winter > fall > spring > summer for the wet deposition (Table S2). This is inconsistent with the results observed in Shanghai [17] and in Wujiang (China) [18]. The Hg concentrations in fall and summer in Shanghai were larger than those in winter and spring, which may be related to the lower temperature, weak air convection, and strong scouring precipitation in spring in the Yangtze River Delta of China [17]. The value of Wujiang in winter and spring was higher due to less precipitation and coal burning during the heating season [18]. In this study, the average Hg concentration of precipitation in the summer presented a low level, with little difference between spring and summer. The lowest level was observed in June. The results may be attributed to the abundant and high-frequency precipitation brought from sea air due to the prevalence of the southeast wind during the early summer. At the same time, the reduction in input and precipitation scouring contributed to the lowest concentrations in June. However, the higher values were found in July and August, which may be explained by the rising temperature and the strength of the solar radiation enhancing the release of forest vegetation Hg in soil. In addition, higher atmospheric concentrations of oxidants made it easier for the GEM to be oxidized to RGM and PBM [25]. The highest and lowest values of Hg were detected in summer atmospheric wet deposition. The high concentrations are associated with the action of RGM and PBM, and low concentrations are related to the maximum washout caused by frequent precipitation. Differing from precipitation, the values in the summer were higher than in the spring for the dry deposition. In addition, the Hg concentration in dry deposition was observed to be higher than the wet deposition during almost the entire year, which is consistent with the results of [26]. Generally, the Hg deposition of atmospheric precipitation has significant regional characteristics in Dinghu Mountain. Meteorological factors (rainfall and temperature), the transportation of external pollution, and the release of environmental media (vegetation and soil in the forest) are all integrated contributing factors.

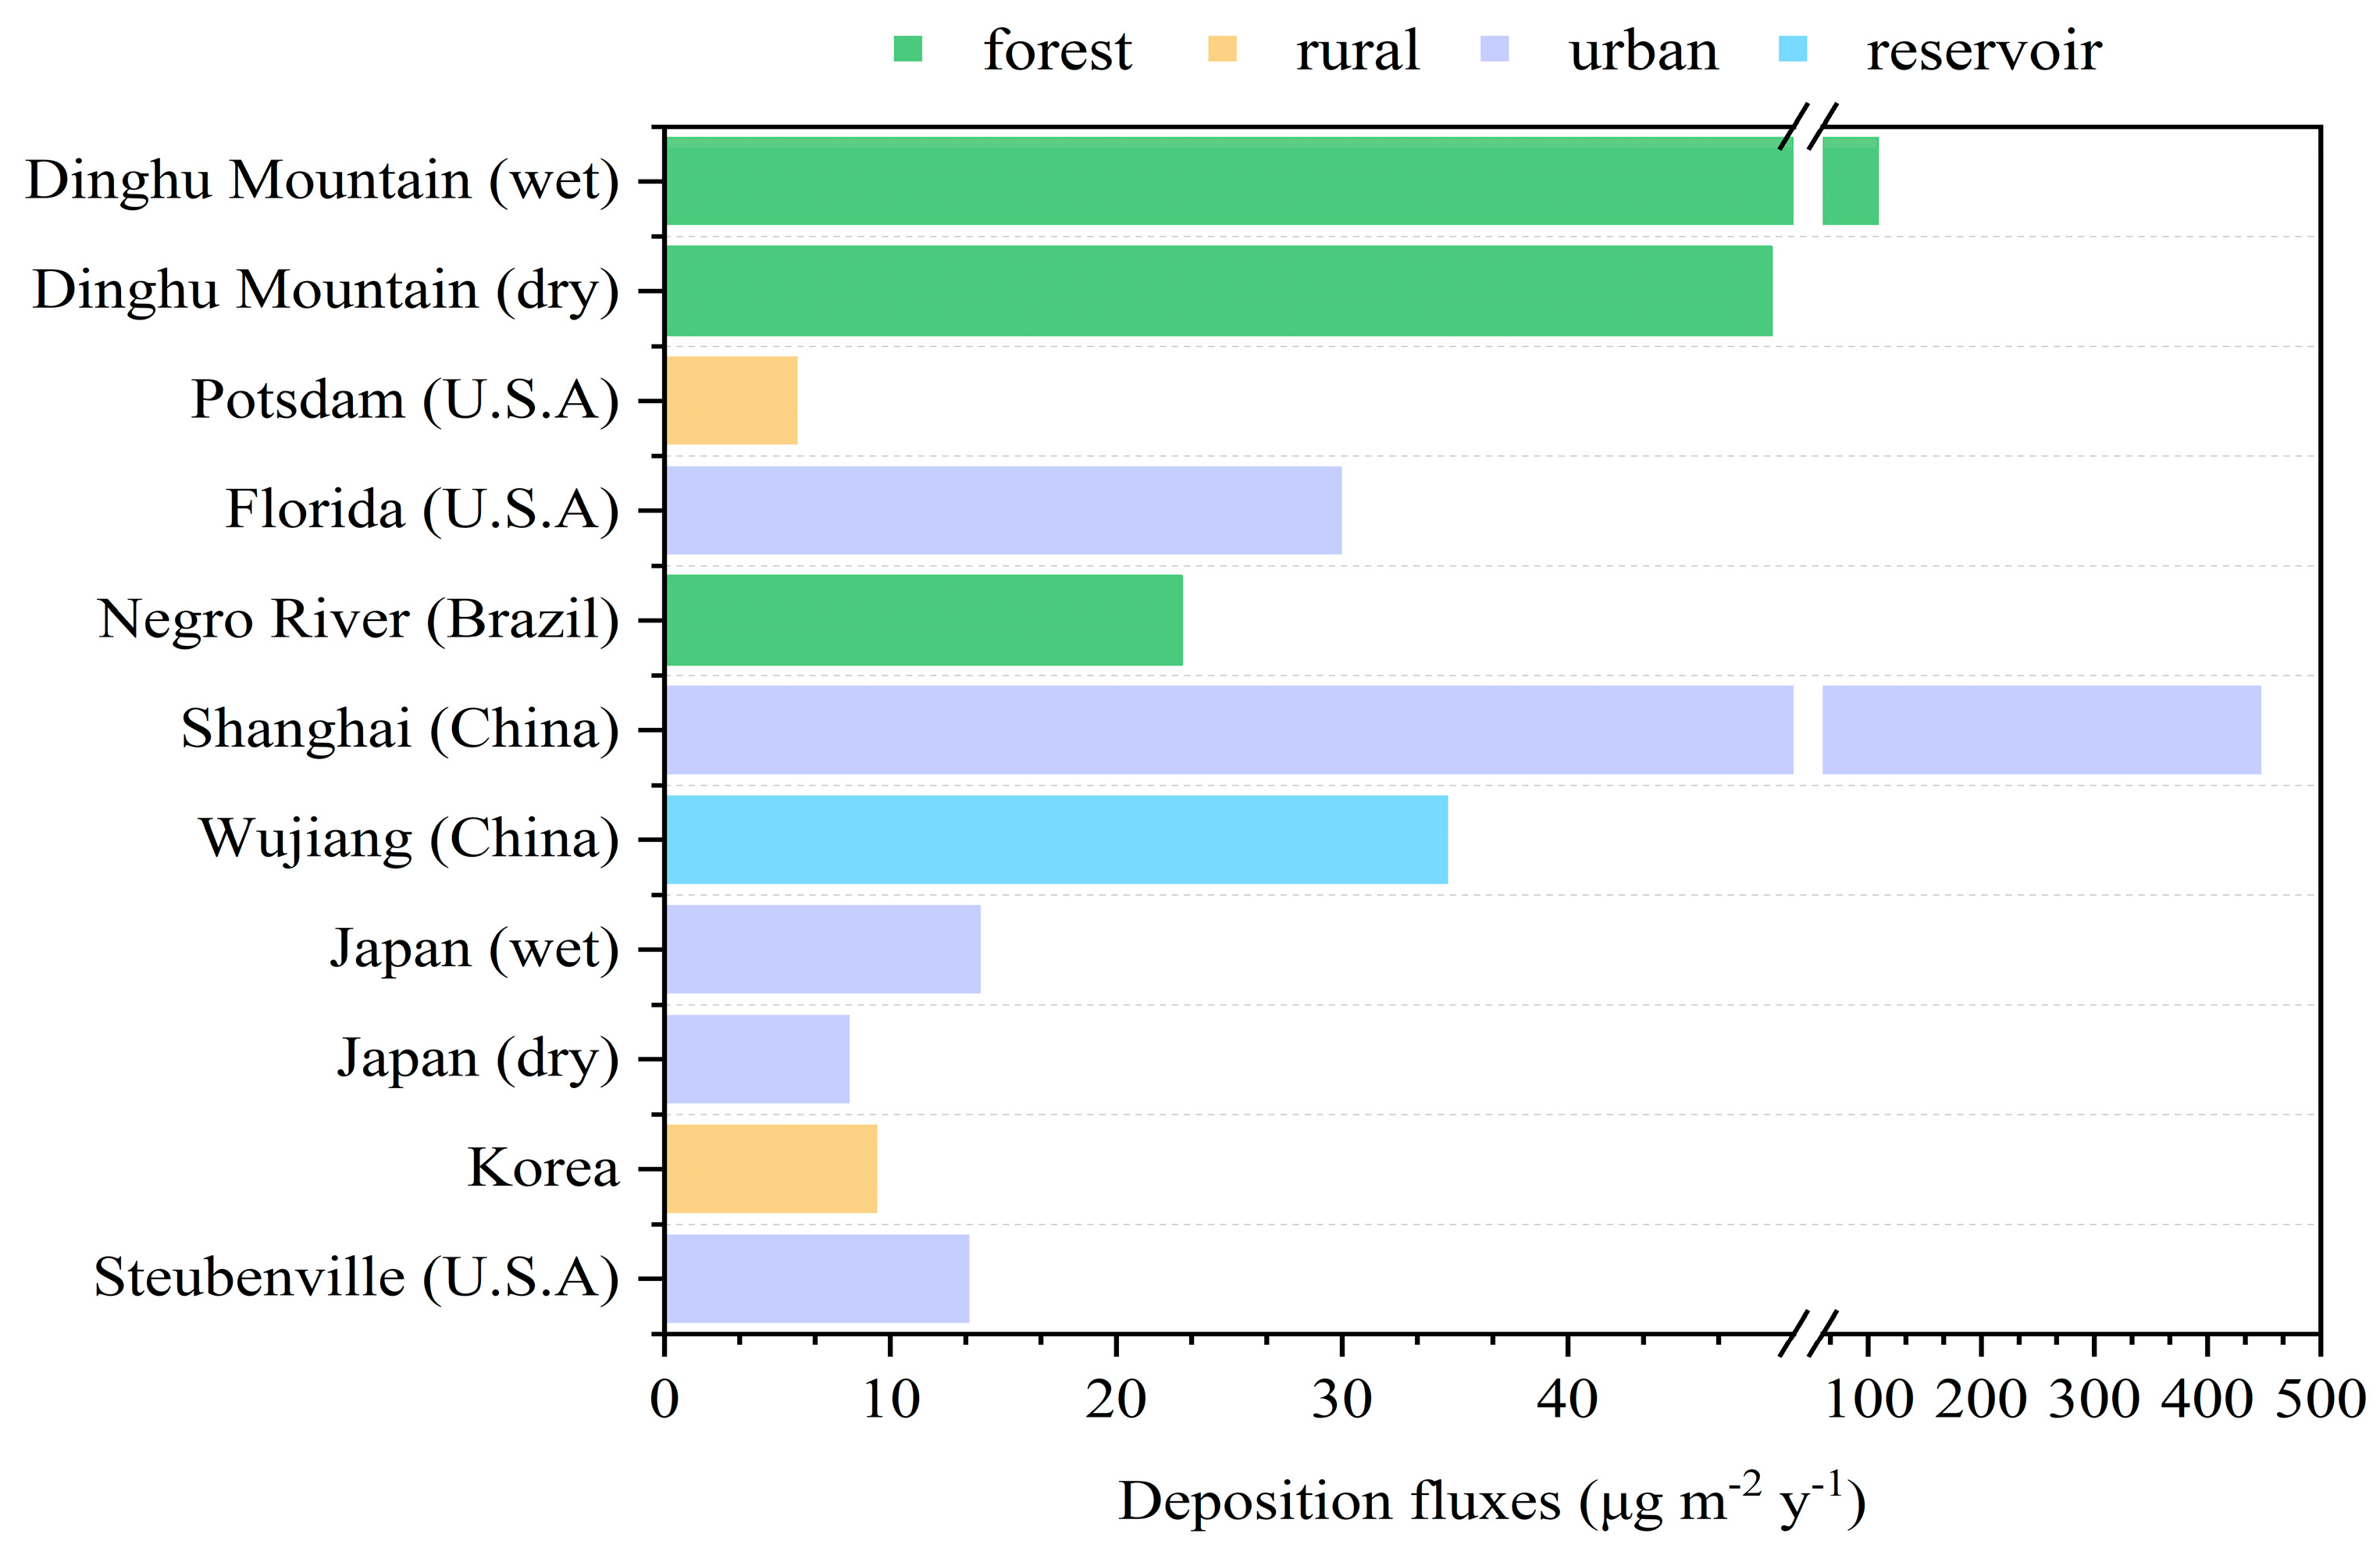
3.2. The Deposition Fluxes and Variations Trends of Hg in Atmospheric

The observed fluxes are essential for digital model simulations and understanding the response of pollutants to canopy and soil. The annual total deposition flux, the wet deposition flux, and the dry deposition flux were 158.8 μg m−2, 109.8 μg m−2, and 49.0 μg m−2, respectively (Table 2).
The wet deposition flux in Dinghu Mountain was of a high level compared to the rest of the world. The values were only four times lower than those in Shanghai and higher than those in Wujiang (China), while being one or two magnitudes higher than those in Japan and the western hemisphere regions of urban or rural environments (Figure 4; Table S1). The high deposition of Hg in Shanghai was mainly influenced by anthropogenic emission sources such as fossil fuel combustion and industrial dust. Higher values of Hg fluxes were also observed in the Wujiang research site near the Guizhou Province Hg mining area. Hg deposition was more serious in developed industrialized and urbanized areas. The pollution level of the underlying surface of the city was higher than that of suburban and remote areas, which was related to the impact of atmospheric Hg mainly from anthropogenic emission sources. With respect to the dry deposition, the fluxes are also slightly higher than those of Japan. Enrico et al. have suggested that modern Hg deposition in vegetated ecosystems is dominated by GEM dry deposition [27]. Many studies have focused more on the dry deposition of Hg. The lowest value of dry deposition flux was estimated at 6.84 μg m−2 in February, while that for the wet deposition flux was in June. Furthermore, the highest level of wet deposition flux was calculated at 18.34 μg m−2 in July. A ratio greater than one between the dry deposition and the wet deposition was observed in October and February, which suggested that the wet deposition was dominated by the atmospheric deposition of Hg in Dinghu Mountain (69%). The higher dry deposition fluxes than the values of these two months may be attributed to the heavy concentration of Hg and stronger wind speed [28]. While similar results were observed by the authors of [29,30], the authors of [31] found different results. The reason for this result was the different distribution of wet and dry Hg deposition due to regional properties. In addition, the high dry deposition flux in cold conditions may be due to low GEM emissions [32,33].
Dinghu Mountain has a rainy season from April to September, and the wet deposition flux accounted for 59% of the whole year over the rainy season; from July to September, it accounted for 42%. The results may illustrate that the wet deposition flux was closely related to the local seasonal climate. Flushing fallout was increased by rainfall, which caused the larger wet deposition flux. However, continuous precipitation can also lead to the minimum wet deposition flux in a single precipitation day. For example, the lowest flux occurred in June with higher rainfall frequency. On the other hand, the seasonal trends of the dry deposition flux differed from the wet. The highest was evaluated in February, and most months had no significant difference except for the clearly low values in May and June. The reason may be that the long-range source emissions pollution of Hg was more stable, which induced less fluctuation of atmospheric Hg concentrations. The results were similar to those reported in [37].

3.3. The Impact of Precipitation on Atmospheric Hg Deposition

The precipitation, precipitation season, rainfall frequency, wind, wind direction, and the emission of pollutant sources are all factors that affect the atmospheric Hg deposition; however, precipitation is one of the most essential [38]. The method of the National Meteorological Service of China was used to categorize 24 h of rainfall into four categories, including small rain (0–9.9 mm), moderate rain (10–24.9 mm), heavy rain (25–49.9 mm), and above-heavy rain (above 50 mm). The average Hg deposition concentration and the wet deposition flux for different rainfall types are shown in Table 3. Heavy and above-heavy rain events at Dinghu Mountain had lower average Hg wet deposition concentrations compared to those in small and medium rain. As shown in Figure 5 and Figure S4, rainfall is negatively correlated with the monthly mean concentration of Hg in atmospheric precipitation (R = −0.815). The results may be explained by the scavenging of RGM and PBM in cloud (i.e., rainout) and below cloud (i.e., washout) [39], and the Hg concentration declined with increased precipitation times.
The monthly wet deposition flux was positively related to precipitation (R = 0.213); however, R = 0.572 when excluding the lowest wet deposition flux in June, and R = 0.962 when excluding May and June (Figure 6 and Figure S5). The rise of Cpi and pi can enhance the Fwi. However, it is relatively easier to influence Fwi with Cpi because the range of Cpi was 0.20–102.6 ng L−1 and that of pi was 45–318 mm. For example, the surges in precipitation led to the rapid decrease in the monthly mean concentration, which caused the decrease in the wet deposition during May and June. In addition, the average wet deposition flux of the above-heavy rain in Dinghu Mountain was 14.8, 3.6, and 2.6 times higher than that of light, moderate, and heavy rain, respectively.
The rainfall was the non-direct interfering factor of the dry deposition flux, whereas the correlation coefficient between the monthly dry deposition flux and the precipitation was calculated as R = −0.772. The results were associated with a severe washout of atmospheric Hg with increasing precipitation reducing the Hg remaining in the atmosphere, while the dry deposition flux was dominated by atmospheric Hg concentrations.

3.4. The Source of Atmospheric Hg Deposition

According to the values of the Pearson correlation coefficients (Table 4), a significant correlation existed between Hg, Cu, Zn, and Cr, which indicated that they were derived from similar sources. For further evaluation of the extent of Hg contamination in Dinghu Mountain and source identification, the principal component analysis (PCA) was used, and the maximum variance method was used for factor rotation. Two principal components (PC1 and PC2) with eigenvalues greater than one were extracted, which accounted for 55.25%. PC1 and PC2 accounted for 34.96% and 20.29%, respectively. At the same time, the average concentrations of Mg, Ca, Cd, Cu, Zn, Pb, and Cr in the wet and dry deposition are shown in Table S3.
The factor loadings on PC1 and PC2 are shown in Table 4. Cu, Zn, Pb, and Cr were predominant in PC1, which was conducted as the origin of coal and oil combustion (automobile exhaust), from which the Hg load was 0.278. The large loading elements in PC2 are Mg and Ca, which can be defined as the principal components of the soil dust, and the loading of Hg was 0.488. Therefore, the main sources of Hg wet deposition in Dinghu Mountain were coal and oil combustion (automobile exhaust) and soil dust, which was similar to the results found in a study conducted for Beijing [17].
Table 5 shows the correlation and rotational component matrix of major ions in dry deposition, which indicates that Hg and Zn, Cr, Cd, and Mg are related. Three principal component factors (PC1, PC2, and PC3) were calculated, accounting for 29.00%, 25.04%, and 15.40%, respectively. The loading of Hg was 0.793 in PC3 and was followed by that of Cr and Mg, which proved that they might have a source in common with Hg. The element Cr was generally derived from oil burning, while Mg tended to be derived from soil dust. The results allowed the inference that the source of Hg in the dry deposition was mainly oil burning (automobile exhaust), followed by soil dust, which was the opposite of the results obtained for the wet deposition. Generally, the dry and wet depositions of Hg in Dinghu Mountain were related to petroleum combustion and soil dust, which may be caused by pollutant emissions from local and surrounding cities, ceramics and high-tech industries, as well as small factories, such as indigenous leather, aluminum ingot processing, domestic gas bottle refurbishment, and local natural conditions [40].

4. Conclusions

In this study, we used the observation data of Hg deposition fluxes in Dinghu Mountain to evaluate the level and seasonal variation of Hg dry and wet deposition flux in the forests of southeastern China. The sources of Hg wet and dry deposition and the effect of precipitation on atmospheric Hg deposition were also analyzed. It was found that the wet deposition flux of Hg was lower than that of the domestic metropolises and higher than that of foreign urban and rural environments. The level of dry deposition flux was slightly higher than that of coastal countries. The atmospheric Hg deposition was mainly composed of wet deposition (69%). Nevertheless, the dry deposition of Hg should be emphasized. The high values of the deposition flux in Dinghu Mountain also illustrated the impact of long-range Hg transportation on Hg deposition. Precipitation was still the most important factor affecting the wet deposition flux. The wet deposition flux has increased with the rise of the precipitation, whereas the surges of the rainfall washout could bring lower levels to the wet deposition flux. However, precipitation had a negative correlation with the Hg dry deposition. Anthropogenic activities (e.g., soil dust, coal, and fuel combustion) are the main sources of Hg deposition in Dinghu Mountain, which may also indicate that it can be controlled.

Supplementary Materials

The following supporting information can be downloaded at: https://www.mdpi.com/article/10.3390/su15043213/s1, Figure S1. Sampling device; Figure S2. Sampling site location at Dinghu Mountain; Figure S3. Monthly wind frequency (from a. to l. is the wind frequency from January to December, respectively); Table S1. Comparison of Hg deposition fluxes with other regions; Table S2. Monthly average Hg concentration; Figure S4. Correlations between the concentrations and precipitations; Figure S5. Correlations between the wet deposition fluxes and precipitations; Table S3. The average concentrations of Mg, Ca, Cd, Cu, Zn, Pb, and Cr in the wet and dry deposition.

Author Contributions

Conceptualization, H.D. and S.D.; methodology, H.D. and S.D.; software, H.D.; validation, H.D.; formal analysis, H.D. and X.K.; investigation, S.D.; resources, S.D. and M.H.; data curation, S.D. and M.H.; writing—original draft preparation, H.D. and X.K.; writing—review and editing, H.D. and X.K.; visualization, H.D. and X.K.; supervision, H.D. and M.C.; project administration, M.C. and X.W.; funding acquisition, M.C. ang X.W. All authors have read and agreed to the published version of the manuscript.

Funding

This research was funded by Foundational and Applied Basic Research in Guangzhou in 2023 grant number SL2022A04J00319; National Natural Science Foundation of China grant number 42275107; Special Fund Project for Science and Technology Innovation Strategy of Guangdong Province grant number 2019B121205004.

Acknowledgments

We thank the joint to the Dinghu Mountain Forest Ecosystem Research Station, Sun Yat-sen University Atmosphere and Environmental Science Resource Platform and the Analytical Testing Center of, and the contribution of all the staffs who participated in the sampling and chemical analysis.

Conflicts of Interest

The authors declare no conflict of interest.

References

  1. Schroeder, W.H.; Munthe, J. Atmospheric mercury—An overview. Atmos. Environ. 1998, 32, 809–822. [Google Scholar] [CrossRef]
  2. Obrist, D.; Kirk, J.L.; Zhang, L.; Lei, Z.; Sunderland, E.M.; Martin, J.; Selin, N.E. A review of global environmental mercury processes in response to human and natural perturbations: Changes of emissions, climate, and land use. AMBIO 2018, 47, 116–140. [Google Scholar] [CrossRef] [PubMed]
  3. Eric, K.M.; Alan, V.; Gerald, J.K.; Ann, C.; Laurier, P.; Neil, C.K.; Raynald, B. Estimation and Mapping of Wet and Dry Mercury Deposition Across Northeastern North America. Ecotoxicology 2005, 14, 53–70. [Google Scholar]
  4. Yu, X.; Driscoll, C.T.; Huang, J.; Holsen, T.M.; Blackwell, B.D. Modeling and mapping of atmospheric mercury deposition in Adirondack Park, New York. PLoS ONE 2013, 8, e59322. [Google Scholar] [CrossRef] [PubMed]
  5. Ma, M.; Du, H.; Wang, D.; Sun, T.; Sun, S.; Yang, G. The fate of mercury and its relationship with carbon, nitrogen and bacterial communities during litter decomposing in two subtropical forests. Appl. Geochem. 2017, 86, 26–35. [Google Scholar] [CrossRef]
  6. Corbitt, E.S.; Jacob, D.J.; Holmes, C.D.; Streets, D.G.; Sunderland, E.M. Global source–receptor relationships for mercury deposition under present-day and 2050 emissions scenarios. Environ. Sci. Technol. 2011, 45, 10477–10484. [Google Scholar] [CrossRef]
  7. Jiang, X.; Wang, F. Mercury emissions in China: A general review. Waste Dispo. Sustain. Energy 2019, 1, 127–132. [Google Scholar] [CrossRef]
  8. Wang, X.; Yuan, W.; Feng, X. Global Review of Mercury Biogeochemical Processes in Forest Ecosystems. Chem. Ind. Eng. Prog. 2017, 29, 970–980. (In Chinese) [Google Scholar]
  9. Keenan, R.J.; Reams, G.A.; Achard, F.; de Freitas, J.V.; Grainger, A.; Lindquist, E. Dynamics of global forest area: Results from the FAO Global Forest Resources Assessment. For. Ecol. Manag. 2015, 352, 9–20. [Google Scholar] [CrossRef]
  10. Wenfu, Z.; Xiaohai, W.; Huaze, Z.; Danni, A.; Rufeng, Z.; Qizhao, S.; Shengqiang, L.; Wei, Y. Spatial distribution of Mercury in Bubeng Typical Tropical Forest of Yunnan Province, China. Earth Environ. 2022, 50, 352–359. (In Chinese) [Google Scholar]
  11. Blackwell, B.D.; Driscoll, C.T.; Maxwell, J.A.; Holsen, T.M. Changing climate alters inputs and pathways of mercury deposition to forested ecosystems. Biogeochemistry 2014, 119, 215–228. [Google Scholar] [CrossRef]
  12. Blackwell, B.; Driscoll, C. Deposition of Mercury in Forests along a Montane Elevation Gradient. Environ. Sci. Technol. 2015, 49, 5363–5370. [Google Scholar] [CrossRef] [PubMed]
  13. Ma, M.; Wang, D.; Du, H.; Sun, T.; Zhao, Z.; Wei, S. Atmospheric mercury deposition and its contribution of the regional atmospheric transport to mercury pollution at a national forest nature reserve, southwest China. Environ. Sci. Pollut. Res. 2015, 22, 20007–20018. [Google Scholar] [CrossRef]
  14. Ma, M.; Wang, D.; Du, H.; Sun, T.; Zhao, Z.; Wang, Y.; Wei, S. Mercury dynamics and mass balance in a subtropical forest, southwestern China. Atmos. Chem. Phys. 2016, 16, 4529–4537. [Google Scholar] [CrossRef]
  15. Ma, M.; Lai, D.; Sun, T.; Yang, G.; Wang, D. Mercury dynamics and mass balance in a subtropical forest in southwest China. China Environ. Sci. 2017, 37, 4744–4750. (In Chinese) [Google Scholar]
  16. Ye, L.; Huang, M.; Zhong, B.; Wang, X.; Tu, Q.; Sun, H.; Wang, C.; Wu, L.; Chang, M. Wet and dry deposition fluxes of heavy metals in Pearl River Delta Region (China): Characteristics, ecological risk assessment, and source apportionment. J. Environ. Sci. 2018, 70, 106–123. [Google Scholar] [CrossRef]
  17. Liu, J.; Wang, W.; Peng, A. The Source of Mercury in Rainfall in Beijing. Environ. Sci. 2000, 2, 77–80. (In Chinese) [Google Scholar]
  18. Zhang, G.; Zheng, X.; Zhou, L.; Huang, W.; Qian, P.; Wang, Y. Assessment of atmospheric wet deposition mercury and ecological risks in Shanghai. Environ. Chem. 2010, 29, 147–148. (In Chinese) [Google Scholar]
  19. Guo, Y.; Feng, X.; He, T.; Zhang, J.; Liang, P.; Meng, B.; Yao, H. Temporal and spatial distribution of different mercury species in precipitation of Wujiang River Basin. J. Environ. Sci. 2008, 7, 1441–1446. (In Chinese) [Google Scholar]
  20. Ma, M. Mercury Inputs, Outputs, and Sources under the Forest Canopy in Typical Subtropical Forest Ecosystem of Southwest China; Southwest University: Chongqing, China, 2013. (In Chinese) [Google Scholar]
  21. Keeler, G.J.; Landis, M.S.; Norris, G.A.; Christianson, E.M.; Dvonch, J.T. Sources of Mercury Wet Deposition in Eastern Ohio, USA. Environ. Sci. Technol. 2006, 40, 5874–5881. [Google Scholar] [CrossRef]
  22. Shanley, J.B.; Engle, M.A.; Scholl, M.; Krabbenhoft, D.P.; Brunette, R.; Olson, M.; Conroy, M.E. High Mercury Wet Deposition at a “Clean Air” Site in Puerto Rico. Environ. Sci. Technol. 2015, 49, 12474–12482. [Google Scholar] [CrossRef]
  23. Eom, S.; Lee, H.; Kim, J.; Park, K.; Kim, Y.; Sheu, G.R.; Gay, D.A.; Schmeltz, D.; Han, S. Potential sources, scavenging processes, and source regions of mercury in the wet deposition of South Korea. Sci. Total Environ. 2021, 762, 143934. [Google Scholar] [CrossRef]
  24. Hansen, A.M.; Gay, D.A. Observations of mercury wet deposition in Mexico. Environ. Sci. Pollut. Res. 2013, 20, 8316–8325. [Google Scholar] [CrossRef]
  25. Eyrikh, S.; Shol, L.; Shinkaruk, E. Assessment of Mercury Concentrations and Fluxes Deposited from the Atmosphere on the Territory of the Yamal-Nenets Autonomous Area. Atmosphere 2021, 13, 37. [Google Scholar] [CrossRef]
  26. Chen, Q. Dry and Wet Deposition Fluxes and Source of Atmospheric Mercury in Xiamen; Xiamen University: Xiamen, China, 2016. (In Chinese) [Google Scholar]
  27. Enrico, M.; Roux, G.L.; Marusczak, N.; Heimbürger, L.E.; Claustres, A.; Fu, X.; Sun, R.; Sonke, J.E. Atmospheric Mercury Transfer to Peat Bogs Dominated by Gaseous Elemental Mercury Dry Deposition. Environ. Sci. Technol. 2016, 50, 2405–2412. [Google Scholar] [CrossRef] [PubMed]
  28. Nguyen, L.S.; Zhang, L.; Lin, D.W.; Lin, N.H.; Sheu, G.R. Eight-year dry deposition of atmospheric mercury to a tropical high mountain background site downwind of the East Asian continent. Environ. Pollut. 2019, 255, 113128. [Google Scholar] [CrossRef] [PubMed]
  29. Sakata, M.; Marumoto, K. Wet and dry deposition fluxes of mercury in Japan. Atmos. Environ. 2005, 39, 3139–3146. [Google Scholar] [CrossRef]
  30. Lynam, M.M.; Dvonch, J.T.; Hall, N.L.; Morishita, M.; Barres, J.A. Spatial patterns in wet and dry deposition of atmospheric mercury and trace elements in central Illinois, USA. Environ. Sci. Pollut. Res. 2014, 21, 4032–4043. [Google Scholar] [CrossRef]
  31. Guo, Y.; Feng, X.; Li, Z.; He, T.; Yan, H.; Meng, B.; Zhang, J.; Qiu, G. Distribution and wet deposition fluxes of total and methyl mercury in Wujiang River Basin, Guizhou, China. Atmos. Environ. 2008, 42, 7096–7103. [Google Scholar] [CrossRef]
  32. Zhang, L.; Wu, Z.; Cheng, I.; Wright, L.P.; Olson, M.L.; Gay, D.A.; Risch, M.R.; Brooks, S.; Castro, M.S.; Conley, G.D. The Estimated Six-Year Mercury Dry Deposition Across North America. Environ. Sci. Technol. 2016, 50, 12864–12873. [Google Scholar] [CrossRef]
  33. Ahn, M.C.; Yi, S.M.; Holsen, T.M.; Han, Y.J. Mercury wet deposition in rural Korea: Concentrations and fluxes. J. Environ. Monit. 2011, 13, 2748–2754. [Google Scholar] [CrossRef]
  34. Silva-Filho, E.V.; Machado, W.; Oliveira, R.R.; Sella, S.M.; Lacerda, L.D. Mercury deposition through litterfall in an Atlantic Forest at Ilha Grande, Southeast Brazil. Chemosphere 2006, 65, 2477–2484. [Google Scholar] [CrossRef]
  35. Dvonch, J.T.; Keeler, G.J.; Marsik, F.J. The Influence of Meteorological Conditions on the Wet Deposition of Mercury in Southern Florida. J. Appl. Meteorol. Climatol. 2005, 44, 1421–1435. [Google Scholar] [CrossRef]
  36. Lai, S.-O.; Holsen, T.M.; Hopke, P.K.; Liu, P. Wet deposition of mercury at a New York state rural site: Concentrations, fluxes, and source areas. Atmos. Environ. 2007, 41, 4337–4348. [Google Scholar] [CrossRef]
  37. Selin, N.E.; Jacob, D.J. Seasonal and spatial patterns of mercury wet deposition in the United States: Constraints on the contribution from North American anthropogenic sources. Atmos. Environ. 2008, 42, 5193–5204. [Google Scholar] [CrossRef]
  38. Zhang, L.; Blanchard, P.; Gay, D.A.; Prestbo, E.M.; Risch, M.R.; Johnson, D.; Narayan, J.; Zsolway, R.; Holsen, T.M.; Miller, E.K. Estimation of speciated and total mercury dry deposition at monitoring locations in eastern and central North America. Atmos. Chem. Phys. 2012, 12, 4327–4340. [Google Scholar] [CrossRef]
  39. Fu, X.; Yang, X.; Lang, X.; Zhou, J.; Zhang, H.; Yu, B.; Yan, H.; Lin, C.J.; Feng, X. Atmospheric wet and litterfall mercury deposition at urban and rural sites in China. Atmos. Chem. Phys. 2016, 16, 11547–11562. [Google Scholar] [CrossRef] [Green Version]
  40. Feng, X.; Shi, J.; Li, P.; Yin, Y.; Jiang, G. Progress of Mercury Pollution Research and Implementation of Minamata Convention in China. Bull. Chin. Acad. Sci. 2020, 35, 1344–1350. (In Chinese) [Google Scholar]
Figure 1. The location of the sampling site.
Sustainability 15 03213 g001
Figure 2. Hg concentrations in precipitation.
Sustainability 15 03213 g002
Figure 3. Monthly average Hg concentrations in precipitation and the dry deposition (the dry deposition fluxes were measured twice per month and were all undetectable for one day in May and July; thus, there was no standard error bar).
Sustainability 15 03213 g003
Figure 4. Annual Hg dry or wet deposition fluxes of different underlying surfaces in this study and from the literature [17,21,29,31,33,34,35,36].
Sustainability 15 03213 g004
Figure 5. Monthly mercury concentrations in rainfall and precipitations.
Sustainability 15 03213 g005
Figure 6. Monthly mercury wet deposition fluxes and precipitations.
Sustainability 15 03213 g006
Table 1. Comparison of Hg concentration with other regions.
RegionSurfaceTypeYearConcentration (ng L−1)Reference
Beijingurbanwet1995–1996224.0[17]
Shanghaiurbanwet2008220.0 (rural) 300.0 (urban)[18]
Jinyun Mountainforestwet201323.40 (Outside)
32.13 (Inside)
[20]
Steubenville (USA)river valleywet200314.0[21]
Puerto Rico (USA)forestwet20058.9[22]
Gwangju (Republic of Korea)suburbanwet2016–20194.1[23]
Puerto Ángel (Mexico)coastwet2003–20057.9[24]
Dinghu Mountainforestwet2009–201056.8This study
Dinghu Mountainforestdry2009–201079.8This study
Table 2. The average atmospheric deposition fluxes in Dinghu Mountain (μg m−2).
MonthDryWetTotalDry/Wet
March2.9713.4616.430.22
April2.4411.3413.780.22
May1.356.768.110.20
June0.020.060.060.25
July5.4118.3423.750.30
August4.7316.4021.130.29
September3.7811.4415.220.33
October4.383.968.341.11
November5.568.3713.930.66
December6.006.0512.050.99
January5.508.9814.480.61
February6.844.5911.431.49
Whole year49.00109.80158.800.45
Table 3. The concentrations and fluxes of Hg wet deposition in different types of precipitation.
Small RainModerate RainHeavy RainAbove-Heavy Rain
Concentrations (μg·L−1)0.0640.0730.0400.058
Wet deposition fluxes (μg·m−2)0.2851.1601.6064.226
Table 4. Correlation and rotational component matrix of major ions in the wet deposition.
HgMgCaCdCuZnPbCrComponent
12
Hg1.0000.1850.1770.0640.3100.3070.2220.3080.2780.488
Mg0.1851.0000.2530.2580.4280.6280.3040.4500.5100.579
Ca0.1770.2531.000−0.0050.0540.128−0.034−0.015−0.2600.846
Cd0.0640.258−0.0051.0000.2370.2420.2780.0760.437−0.021
Cu0.3100.4280.0540.2371.0000.4980.5560.5470.7640.231
Zn0.3070.6280.1280.2420.4981.0000.3770.5720.6540.477
Pb0.2220.304−0.0340.2780.5560.3771.0000.5230.7870.000
Cr0.3080.450−0.0150.0760.5470.5720.5231.0000.7550.230
Table 5. Correlation and rotational component matrix of major ions in the dry deposition.
HgMgCaCdCuZnPbCrComponent
123
Hg1.0000.041−0.0400.078−0.0340.127−0.0380.126−0.123−0.1040.793
Mg0.0411.0000.3100.1700.1020.2160.2530.4820.2990.5310.422
Ca−0.0400.3101.000−0.403−0.0100.678−0.0840.252−0.1720.921−0.111
Cd0.0780.170−0.4031.0000.470−0.0020.6020.1060.767−0.2350.244
Cu−0.0340.102−0.0100.4701.000−0.0130.7200.0640.8420.056−0.156
Zn0.1270.2160.678−0.002−0.0131.000−0.0470.172−0.0580.7780.063
Pb−0.0380.253−0.0840.6020.720−0.0471.0000.2200.9160.0420.025
Cr0.1260.4820.2520.1060.0640.1720.2201.0000.2170.4450.568
Disclaimer/Publisher’s Note: The statements, opinions and data contained in all publications are solely those of the individual author(s) and contributor(s) and not of MDPI and/or the editor(s). MDPI and/or the editor(s) disclaim responsibility for any injury to people or property resulting from any ideas, methods, instructions or products referred to in the content.

