Article

Response of Soil Erosion to Climate and Subsequent Vegetation Changes in a High-Mountain Basin

1
State Key Laboratory of Tibetan Plateau Earth System, Environment and Resources (TPESER), Institute of Tibetan Plateau Research, Chinese Academy of Sciences (CAS), Beijing 100101, China
2
University of Chinese Academy of Sciences, Beijing 100049, China
3
Institute of Soil and Water Conservation, Northwest A&F University, Xianyang 712100, China
4
Department of Geosciences, University of Oslo, 0450 Oslo, Norway
*
Author to whom correspondence should be addressed.
Sustainability 2023, 15(4), 3220; https://doi.org/10.3390/su15043220
Submission received: 12 January 2023 / Revised: 5 February 2023 / Accepted: 7 February 2023 / Published: 9 February 2023
(This article belongs to the Section Soil Conservation and Sustainability)

Abstract

:
Soil erosion is one of the global threats to the environment. Further, climate and vegetation changes have pronounced effects on soil erosion in high-mountain areas. In this study, the revised universal soil loss equation (RUSLE) was improved by developing a method for calculating snowmelt runoff erosivity based on a simulated snowmelt runoff and the observed sediment load, using which the soil erosion rate in the upper Heihe River Basin (UHRB) was calculated. The proposed approach provides an effective method for estimating the soil erosion rate and identifying the causes for its change in high-mountain areas. The normalized difference vegetation index (NDVI) was significantly and positively correlated with both precipitation and temperature in the region and exhibited a significant increasing trend. The increase in NDVI led to a decrease in the soil erosion rate (for the annual, rainfall, and snowmelt periods), although erosive rainfall and snowmelt runoff showed increasing trends, indicating the dominating impact of vegetation cover on soil erosion. The average soil erosion rate of UHRB was 806.2 t km−2 a−1 from 1982 to 2015. On average, soil erosion during rainfall and snowmelt periods contributed to 90.67% and 9.33% of annual soil erosion, respectively. However, the resultant soil erosion rate caused by 1 mm of snowmelt runoff was about 1.9 times that caused by 1 mm erosive rainfall. Soil erosion during the snowmelt period was particularly sensitive to temperature and showed consistent responses to climate and vegetation changes in UHRB and its two tributaries. An increasing NDVI promoted by climate change and anthropogenic factors played a major role in alleviating soil erosion, and the warming exerted intense impacts on soil erosion during the snowmelt period. These findings would be helpful for proposing effective measures for soil conservation in high-mountain areas under climate and vegetation changes.

1. Introduction

Soil erosion has been and continues to be a global environmental issue, threatening soil productivity, water quality, and the ecological environment [1,2,3]. The assessment of soil erosion risk is thus indispensable for specifying effective measures and policies for water and soil resource conservation. In high-mountain areas, the effects of climate change and the subsequent vegetation changes are prominent [4,5,6]. For instance, increases in precipitation and the corresponding rainfall-runoff erosivity from 1961 to 2012 further increased soil erosion and sediment load in the Source Region of the Three Rivers (the Yangtze, Yellow, and Lancang Rivers) [7]. Thus, it is of great importance to focus on soil erosion risk, particularly in light of current climate change.
The spatiotemporal distribution characteristics of soil erosion may be attributable to climate, vegetation, soil properties, topography, and conservation practices [8,9]. As soil properties and topography are more stable than other factors, climate and vegetation are the major factors controlling the spatiotemporal variations in soil erosion [9,10]. Rainfall-runoff erosivity can reflect the possibility of precipitation eroding soil [11], and vegetation is of importance in the effects on soil erosion [12,13]. However, there is a competitive effect between precipitation and vegetation [14]. As the climate becomes wetter, the vegetation becomes denser. The latter may offset the increase in the soil erosion rate caused by increased runoff, potentially [15,16]. There is also a competition between erosion and vegetation. Although increased vegetation cover may lead to an increase in resistance to soil erosion, higher amounts of vegetation with enhanced runoff can result in higher shear stress, which can override the protective effects of vegetation and contribute to an increase in the potential soil erosion rate [16]. Moreover, soil erosion exhibits a different seasonal variation in high-mountain areas as a result of snowmelt in early spring [2,17]. Therefore, it is essential to ascertain the features and main contributing factors of soil erosion in both the snowmelt and rainy seasons in high-mountain areas [18].
Models are critical tools in studies at the watershed, regional, national, or even continental scales because the direct detection of soil erosion at large scales is challenging to implement. Among numerous models, the revised universal soil loss equation (RUSLE) is widely used, owing to its low data requirements and simple structure [19]. In RUSLE, soil loss can be calculated by the multiplication of rainfall runoff erosivity, soil erodibility, vegetation and cover management, slope length and slope steepness, and the supporting conservation practices. However, the calculation of erosive force of snowmelt runoff using RUSLE and its earlier version USLE is insufficient [20]. Therefore, to facilitate its applicability in high-mountain areas, snowmelt runoff erosivity needs to be additionally incorporated.
Many variables in soil erosion models exhibit spatiotemporal variability. Therefore, a reasonable approach for reflecting the heterogeneity needs to be developed. Remote sensing is an efficient tool for the rapid acquisition of massive and dynamic environmental information. Remote sensing technology provides the advantage of rapidly and accurately estimating the distribution of soil erosion over large areas at a reasonable cost [21]. For instance, AVHRR (Advanced Very High Resolution Radiometer) imagery of NOAA (National Oceanic and Atmospheric Administration) has been used to estimate the spatiotemporal characteristics of the cover management factor in RUSLE over Europe [22], and Landsat imageries have already been used to assess the impact of vegetation on soil erosion [23].
The Tibetan Plateau is particularly sensitive to climate change and has experienced an amplified warming rate in the past fifty years [24,25]. Meanwhile, precipitation and vegetation in the Tibetan Plateau have also undergone complicated changes [24], which include accelerated soil erosion [25]. The Heihe River, originating from the Qilian Mountains in the Tibetan Plateau, is the second largest inland river basin in China, and climate change has been reported to affect its ecosystem [26], which would have had further effects on soil erosion.
The Upper Heihe River Basin (UHRB) located in the northeastern Tibetan Plateau was selected as the study area. The aims were to assess the soil erosion risk and clarify the impacts of climate and subsequent vegetation changes in UHRB from 1982 to 2015. The specific objectives were to: (1) improve RUSLE to account for the snowmelt by developing a method for calculating the snowmelt runoff erosivity based on the simulated snowmelt runoff and the observed sediment load data; (2) calculate the soil erosion rate (for the annual period, rainfall period, and snowmelt period) and clarify the spatial characteristics; and (3) analyze the variation tendency of the soil erosion rate and ascertain the effects of climate and subsequent vegetation changes on soil erosion.

2. Study Area and Materials
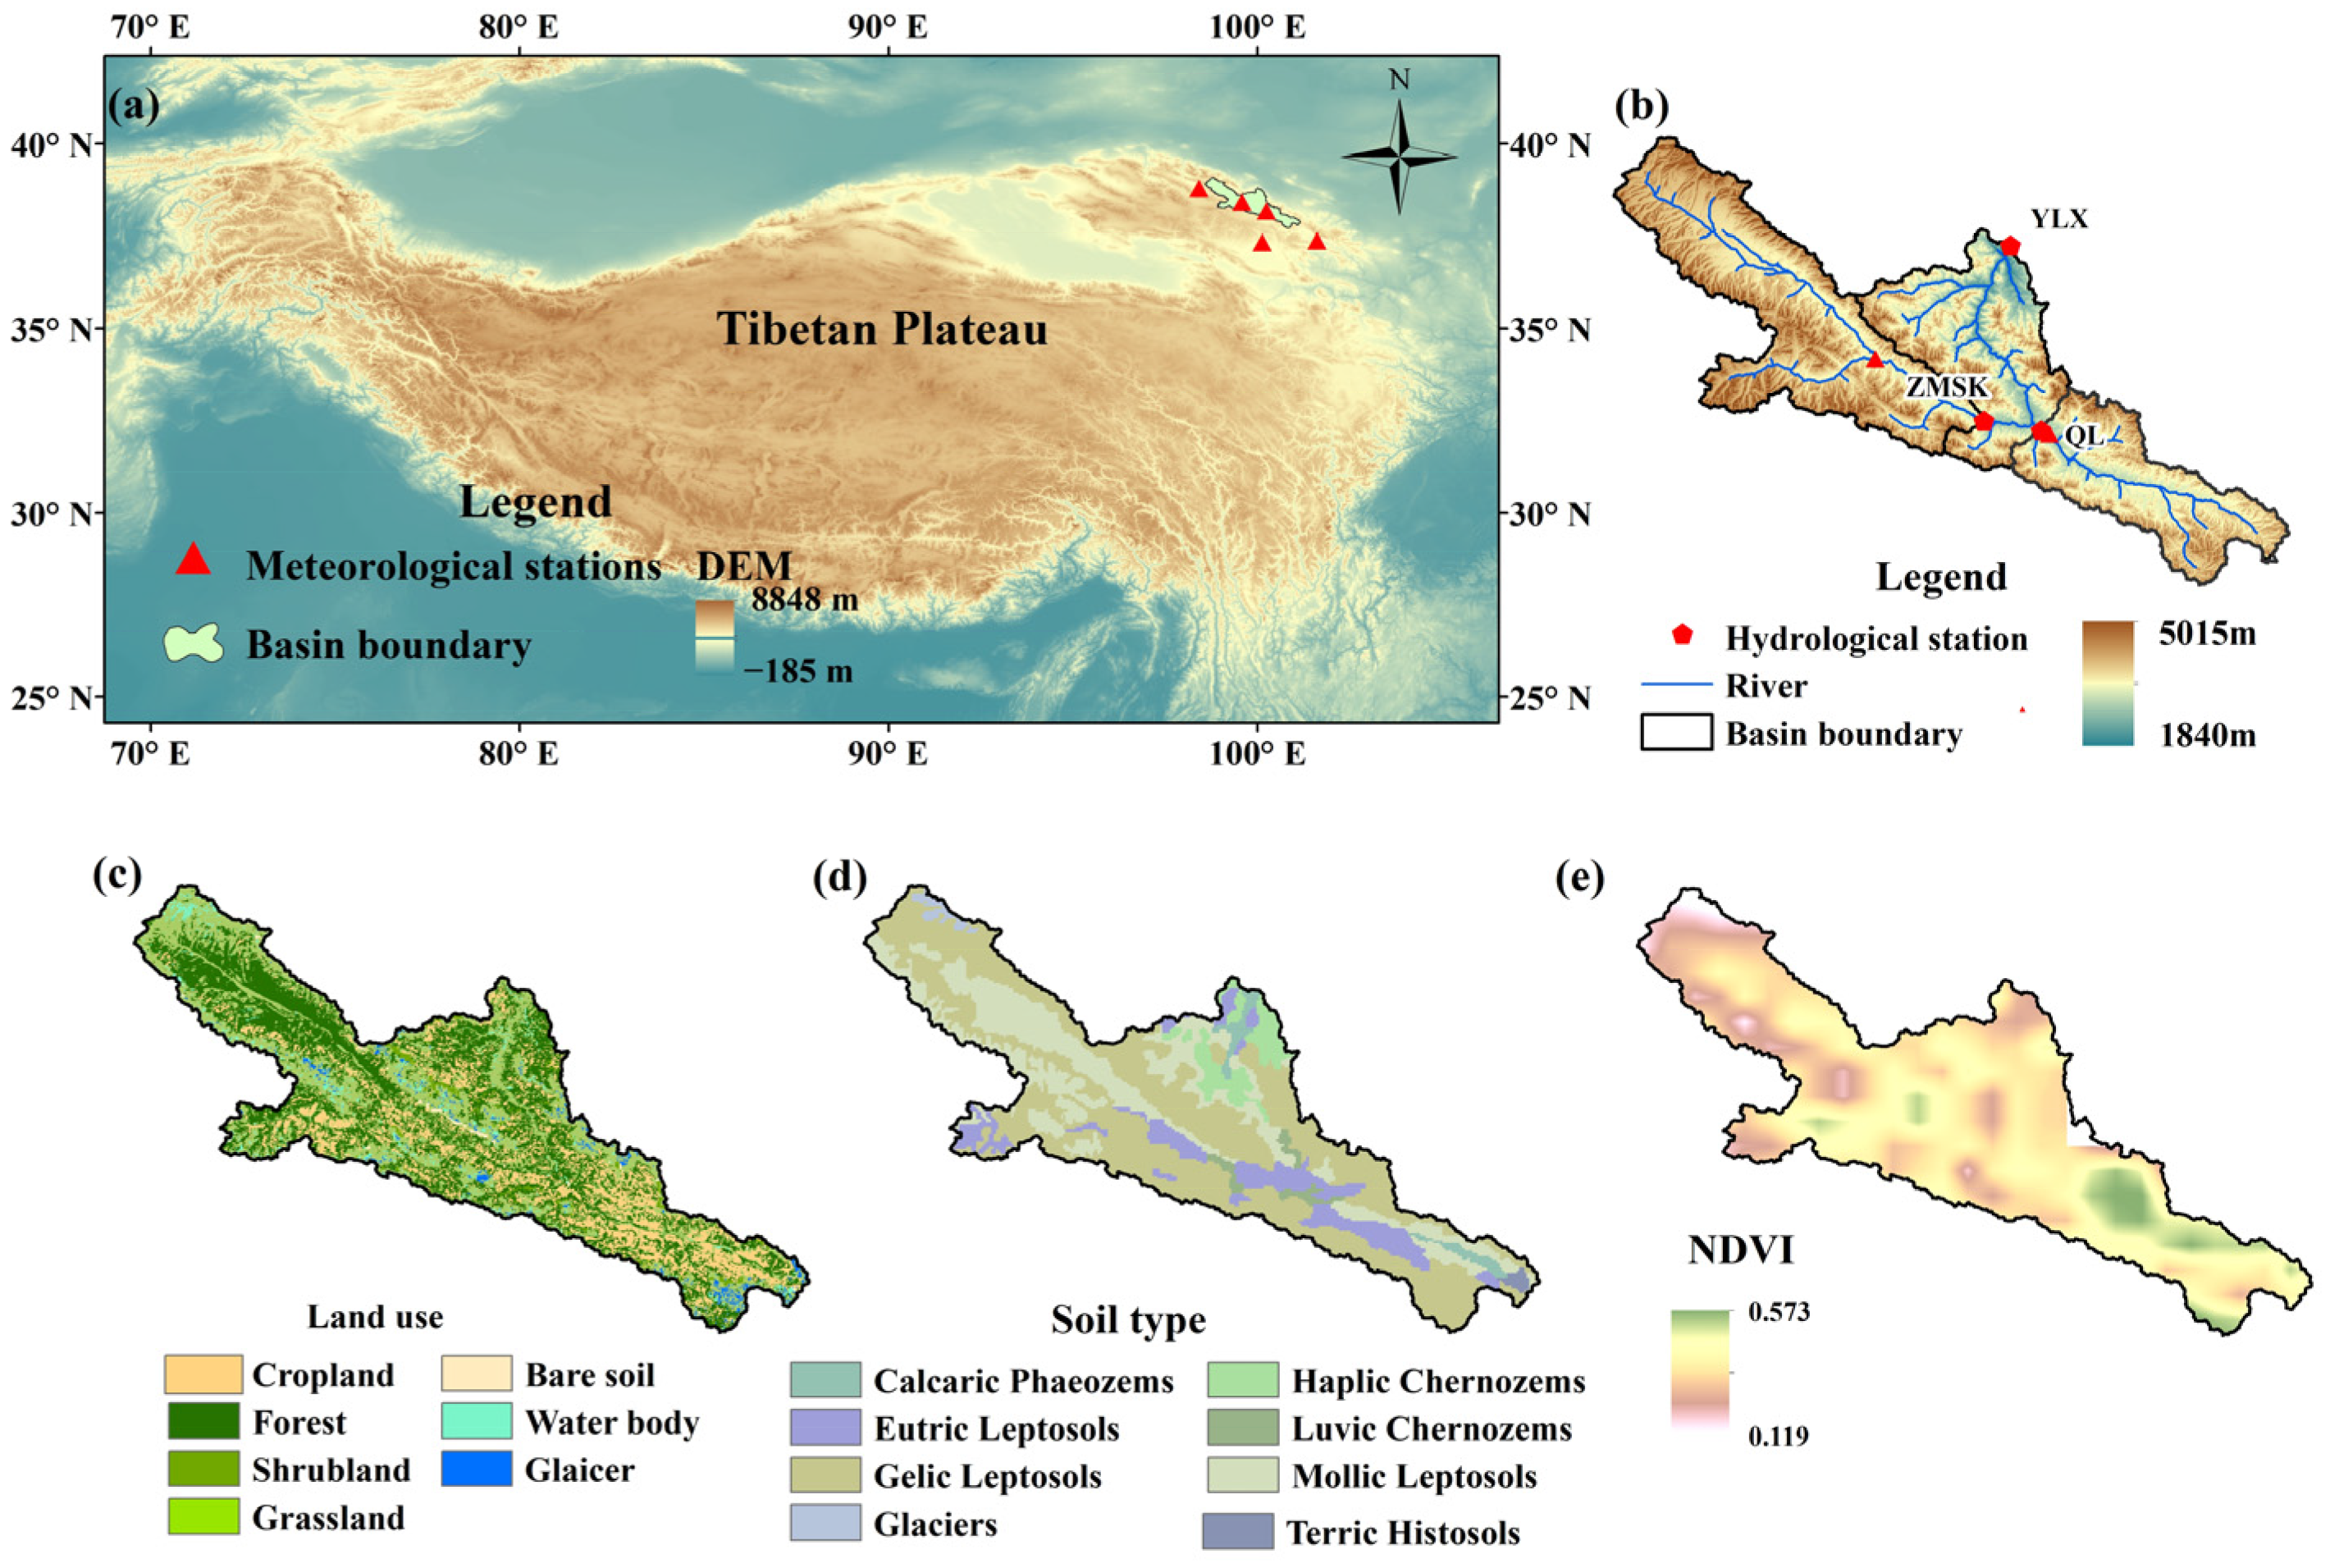
2.1. Study Area

UHRB is located between 98°33′ E–101°11′ E and 37°41′ N–39°5′ N in the Qilian Mountains of the northeast Tibetan Plateau (Figure 1a). UHRB covers an area of approximately 9837 km2 with an elevation ranging from 1840 m above sea level (asl) to 5015 m asl. The UHRB belongs to a semi-arid climate, with an annual precipitation of about 410 mm and an annual average temperature of −2.3 °C. It is a typical high-mountain river basin fed by rainfall runoff and snowmelt and glacier melt runoff. The study area provides water resources to the middle reaches in the Hexi Corridor, which is a water-consuming and runoff utilization area [27,28]. Therefore, runoff and sediment load changes in the upper mountain areas play a decisive part in the socio-economic development and ecological environment evolution of the middle reaches [27]. As a high-mountain area, UHRB is vulnerable and sensitive to climate change [29].
UHRB has two main tributaries, namely the Babao River in the east and Yeniugou River in the west (Figure 1b). The study area also includes three hydrological stations, i.e., Qilian (QL) in the Babao River Basin (BBRB), Zhamashike (ZMSK) in the Yeniugou River Basin (YNGRB), and Yingluoxia (YLX) in the outlet of UHRB. The details of these three stations are presented in Table 1. There are different vegetation types in UHRB (cropland, forest, shrub land, grassland, bare soil, and glacier), and grassland is the dominant land-use type in UHRB, accounting for about 62.4% of UHRB (Figure 1c). The main soil type of UHRB is Gelic leptosol, which covers approximately 45.0% of the basin area (Figure 1d). NDVI is relatively higher in the eastern part than in the western part of UHRB (Figure 1e).
According to observations at QL, ZMSK, and YLX, the sediment load in UHRB from November to March was close to zero, implying very low soil erosion during this period. Therefore, we focused on soil erosion from April to October. In high-mountain areas receiving months of snowfall, soil erosion induced by snowmelt should be considered in addition to rainfall erosion [30]. According to the runoff simulation, snowmelt runoff was the main source of the total runoff apart from base flow and rainfall runoff. In October, precipitation mostly accumulated in the basin in the form of snowfall rather than meltwater, and this month was not regarded a part of the snowmelt erosion period. Consequently, a year was divided into three periods, i.e., the frozen period (November to March) with almost no soil erosion, the rainfall period (June to October), and the snowmelt period (April and May).

2.2. Methods

The investigation was conducted according to the flow chart shown in Figure 2.

2.2.1. Snowmelt Runoff Simulation

The hydrological model J2000 was applied for the simulation of the runoff and its components (i.e., base flow, glacier melt runoff, snowmelt runoff, and rainfall runoff) in UHRB. J2000 is a process-based and distributed model for hydrological simulations in which spatial heterogeneity is described by Hydrological Response Units (HRUs) [31]. J2000 fully considers key hydrological processes in high-mountain areas, such as glacier melt and snowmelt, and has been successfully applied to the hydrological simulation of alpine basins [32,33].
The spatial information mainly includes elevation, aspect, soil, land use, and geology. The climate data required for J2000 include that on precipitation, air temperature (mean, maximum, and minimum), relative humidity, sun hour, and wind speed in daily intervals. Regionalization methods are implemented in the model to transform the climate data obtained from meteorological stations into spatially distributed datasets by analyzing the vertical and horizontal variability of each climate variable [31].
Hydrological processes calculated in the model include evapotranspiration, interception, glacier and snow melt, soil water, groundwater, and flow routing. In this study, we focused on the snow module, which simulates the process of snow accumulation and melting. Precipitation is identified as snowfall and rainfall based on air temperature. If the air temperature is below the lower threshold, precipitation is identified as snowfall; if the air temperature is above the upper threshold, precipitation is identified as rainfall. Between the two temperature thresholds, mixed precipitation can occur.
The snow process was calculated on the basis of two different types of water balance proposed by Knauf et al. [34]. The first one is based on the density of dry snow and its snow water equivalent (SWE). The second one is based on liquid water stored in the snowpack and the dry SWE. Potential snowmelt is calculated using a method that considers the energy associated with soil fluxes, air temperature, and rainfall [35]. Potential snowmelt is stored in the snowpack up to a certain density, following which the melting snow in the snowpack is passed to the soil.
Daily MODIS/Terra Snow Cover (MOD10A1) data were used for calibrating the snowmelt related parameters. As long-term observations of daily runoff were acquired only from QL, the daily runoff of BBRB was used for calibrating and validating the runoff simulation. The time from 2000 to 2015 was set as the calibration period, and that from 1982 to 1999 was set as the validation period. Subsequently, the parameters were applied to YNGRB and UHRB, for which only the daily runoff data from 2012 to 2015 were available. R square and Nash-Sutcliffe efficiency (NSE) were used for evaluating model performance.

2.2.2. RUSLE Model

The framework of RUSLE is described by the following equation:
A = R × K × L S × C × P
where A is the calculated annual soil erosion rate (t ha−1 a−1); R, K, LS, C, and P represent the rainfall runoff erosivity factor (MJ mm ha−1 h−1 a−1), soil erodibility factor (t ha h ha−1 MJ−1 mm−1), slope length and steepness factor, cover-management factor, and support-practice factor, respectively. The calculation method of RUSLE factors is described as follows.

Rainfall Runoff Erosivity Factor

Soil erosion is affected by rainfall and snowmelt runoff, which can be reflected by the revised runoff erosivity R factor [2]. For high-mountain areas where snowmelt is an important source of runoff [36], considering soil erosion induced by snowmelt runoff, rainfall runoff erosivity can be calculated by separating it into two parts:
R = R r + R s
where Rr and Rs are the rainfall erosivity and snowmelt runoff erosivity, respectively.
Rr was calculated on the basis of an equation recommended by the National Water Conservancy Survey in China [37] as Equation (3):
R r i = α j = 1 M P j β
where Rri is the total rainfall erosivity in the ith half month, Pj is erosive rainfall (i.e., daily rainfall greater than 10 mm), and M is the number of days when effective rainfall occurs. α and β are calculated using the following formulas:
β = 0.8363 + 18.144 P d 10 + 24.455 P y 10
α = 21.586 β 7.1891
where Pd10 is the erosive rainfall and Py10 is the annual mean value of erosive rainfall.
Snowmelt runoff erosivity can be expressed using the following equation:
R s = A s K s L S C s P
where As, Ks, and Cs have the same meaning as they do in Equation (1), except that they represent variables during the snowmelt period.
Soil erosion driven by snowmelt runoff can also be described by Equation (4) based on the sediment delivery ratio:
A s = Y s D s
where Ys and Ds are the sediment load and the sediment delivery ratio (SDR) during the snowmelt period, respectively.
In the same manner, Equations (5) and (6) can be adopted to describe rainfall erosivity and the soil erosion rate during the rainfall period:
R r = A r K r L S C r P
A r = Y r D r
where, Ar, Kr, and Cr have the same meaning as Equation (1), except that they represent variables during the rainfall period; Yr and Dr are sediment load and SDR, respectively, during the rainfall period.
With the assumption of equal soil erodibility, the cover management factor, and SDR during the snowmelt and rainfall periods, snowmelt runoff erosivity can be expressed as follows:
R s = Y s Y r R r
Accordingly, Rs was calculated on the basis of the riverine sediment load data of QL and ZMSK during the rainfall and snowmelt periods and rainfall erosivity with Equations (3)–(5). During the snowmelt period, snowmelt runoff was the dominant component of the total runoff in addition to base flow (Figure 3b), and erosive rainfall was scarce. Therefore, it was more appropriate to estimate snowmelt erosion based on the simulated snowmelt runoff in UHRB. Considering the limited availability of riverine sediment load data, snowmelt runoff erosivity should be established for extended application.

Soil Erodibility Factor

The soil erodibility factor (K) depicts the sensitivity of soil to erosion [38], which can be calculated using the EPIC model developed by Sharpley [39] based on soil texture and soil organic carbon data:
K = 0.1317 f c s a n d f c l s i f o r g c f h i s a n d
f c s a n d = 0.2 + 0.3 e x p   e x p   0.0256 m s 1 m s i l t 100
f c l s i = m s i l t m c l + m s i l t 0.3
f c s a n d = 1 0.25 o r g C o r g C + e x p   e x p   3.72 2.95 o r g C  
f h i s a n d = 1 0.7 1 m s 100 1 m s 100 + e x p   e x p   5.51 + 22.9 1 m s 100  
where msilt is silt fractions; mc is clay fractions; ms is sand fractions; and orgC is topsoil organic carbon content (%).

Slope Length and Steepness Factor

The LS factor mainly represents the topography influence on soil erosion [40]. The L factor of LS was estimated as follows [41]:
L i = ( λ o u t m + 1 λ i n m + 1 ) λ o u t λ i n 22.13 m
where Li is the slope length factor of i grid, λin and λout are the slope length of the inlet and outlet, respectively (m), and m is the coefficient of the slope length. The coefficient can be estimated based on Equation (17):
m = 0.2                     θ < 0.5 ° 0.3       0.5 ° θ < 1.5 ° 0.4           1.5 ° θ < 3 ° 0.5                       θ 3 °
where θ is the slope angle.
The S factor was calculated based on Equation (18) [42]:
S = 10.8 s i n θ + 0.03                   θ < 5 °   16.8 s i n θ 0.5           5 ° θ < 10 ° 21.91 s i n θ 0.96             θ 10 °

Cover Management Factor

The cover management factor (C) indicates the effect of surface cover, prior land use, canopy cover, and soil moisture on soil erosion. It is difficult to calculate these variables on a large scale [43]. Therefore, satellite images were used to estimate the C factor based on remote sensing information to describe the spatial difference of the vegetation. The GIMMS NDVI data were used to estimate the C factor by Equation (19) [44].
C = e x p   2 N D V I 1 N D V I
NDVI can reflect the protection by green vegetation of soil erosion but ignore the protection effect of surface litter. This may result in an overestimation of the C value during the snowmelt period [45]. Therefore, the mean C value of the rainfall period was used for the snowmelt period.

Support Practice Factor

The support practice factor reflects the effect of soil preservation policy on soil erosion [46]. The P factor value is usually determined based on land use and previous study (i.e., 0 for build-up, water body, and snow/ice; 1 for bare land, grassland, shrub, and forest; 0.4 for cropland) [47].

2.2.3. Detrended Analysis

Detrended analysis is often used in processing a data series to eliminate its changing trend but retain its fluctuation. Hydrological simulation based on detrended inputs such as temperature or precipitation data series was applied to analyze the effects of climate change [48,49].

3. Results

3.1. Variation of Precipitation, Air Temperature, and NDVI

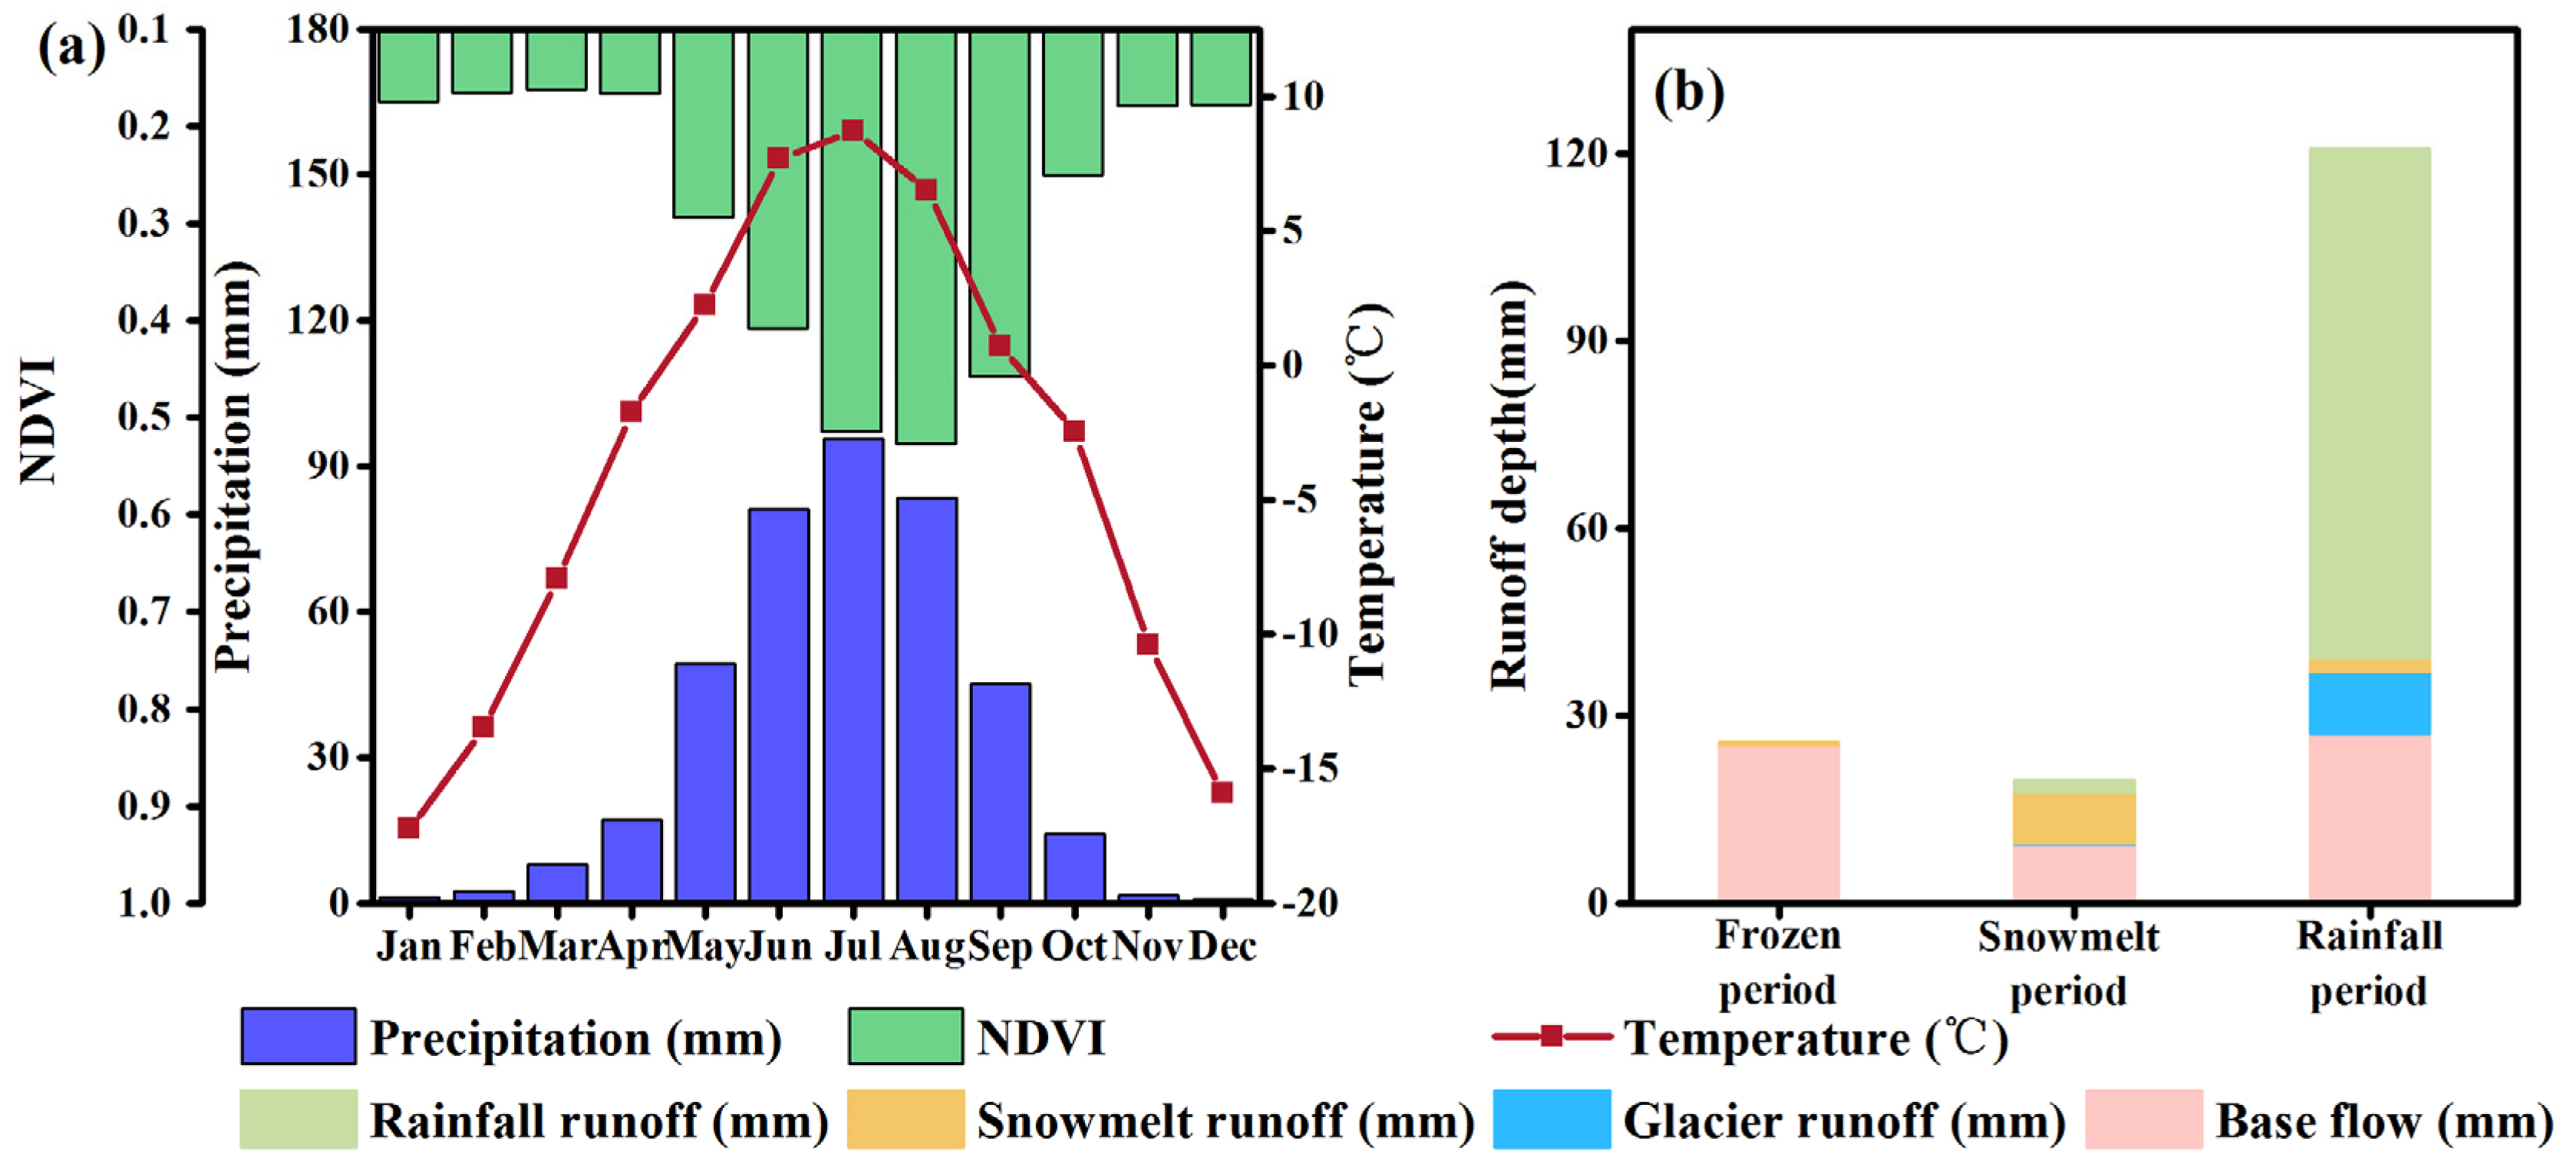
3.1.1. Seasonal Variation of Precipitation, Air Temperature, and NDVI

The precipitation, air temperature, and NDVI of UHRB exhibited distinctive features in different seasons (Figure 3). During the frozen period (November to March), precipitation, temperature, and NDVI were low. They started rising from April, and snowmelt runoff became the most important runoff component in addition to base flow during the snowmelt period. Temperature and precipitation peaked in July with average monthly values of 8.7 °C and 100.4 mm, respectively. Abundant precipitation and high temperatures in July promoted vegetation growth, with NDVI reaching a peak value of 0.527 in August. From June to September, runoff increased because of the more concentrated and heavy rainfall, which was the external agent of soil erosion. Until October, the mean air temperature began to fall below 0ºC and the precipitation mainly accumulated in the form of snowfall instead of melting. During the frozen, snowmelt, and rainfall periods, precipitation accounted for 3.5%, 16.7%, and 79.8% of the annual amount, while runoff accounted for 15.4%, 11.8%, and 72.8% of the annual value, respectively.

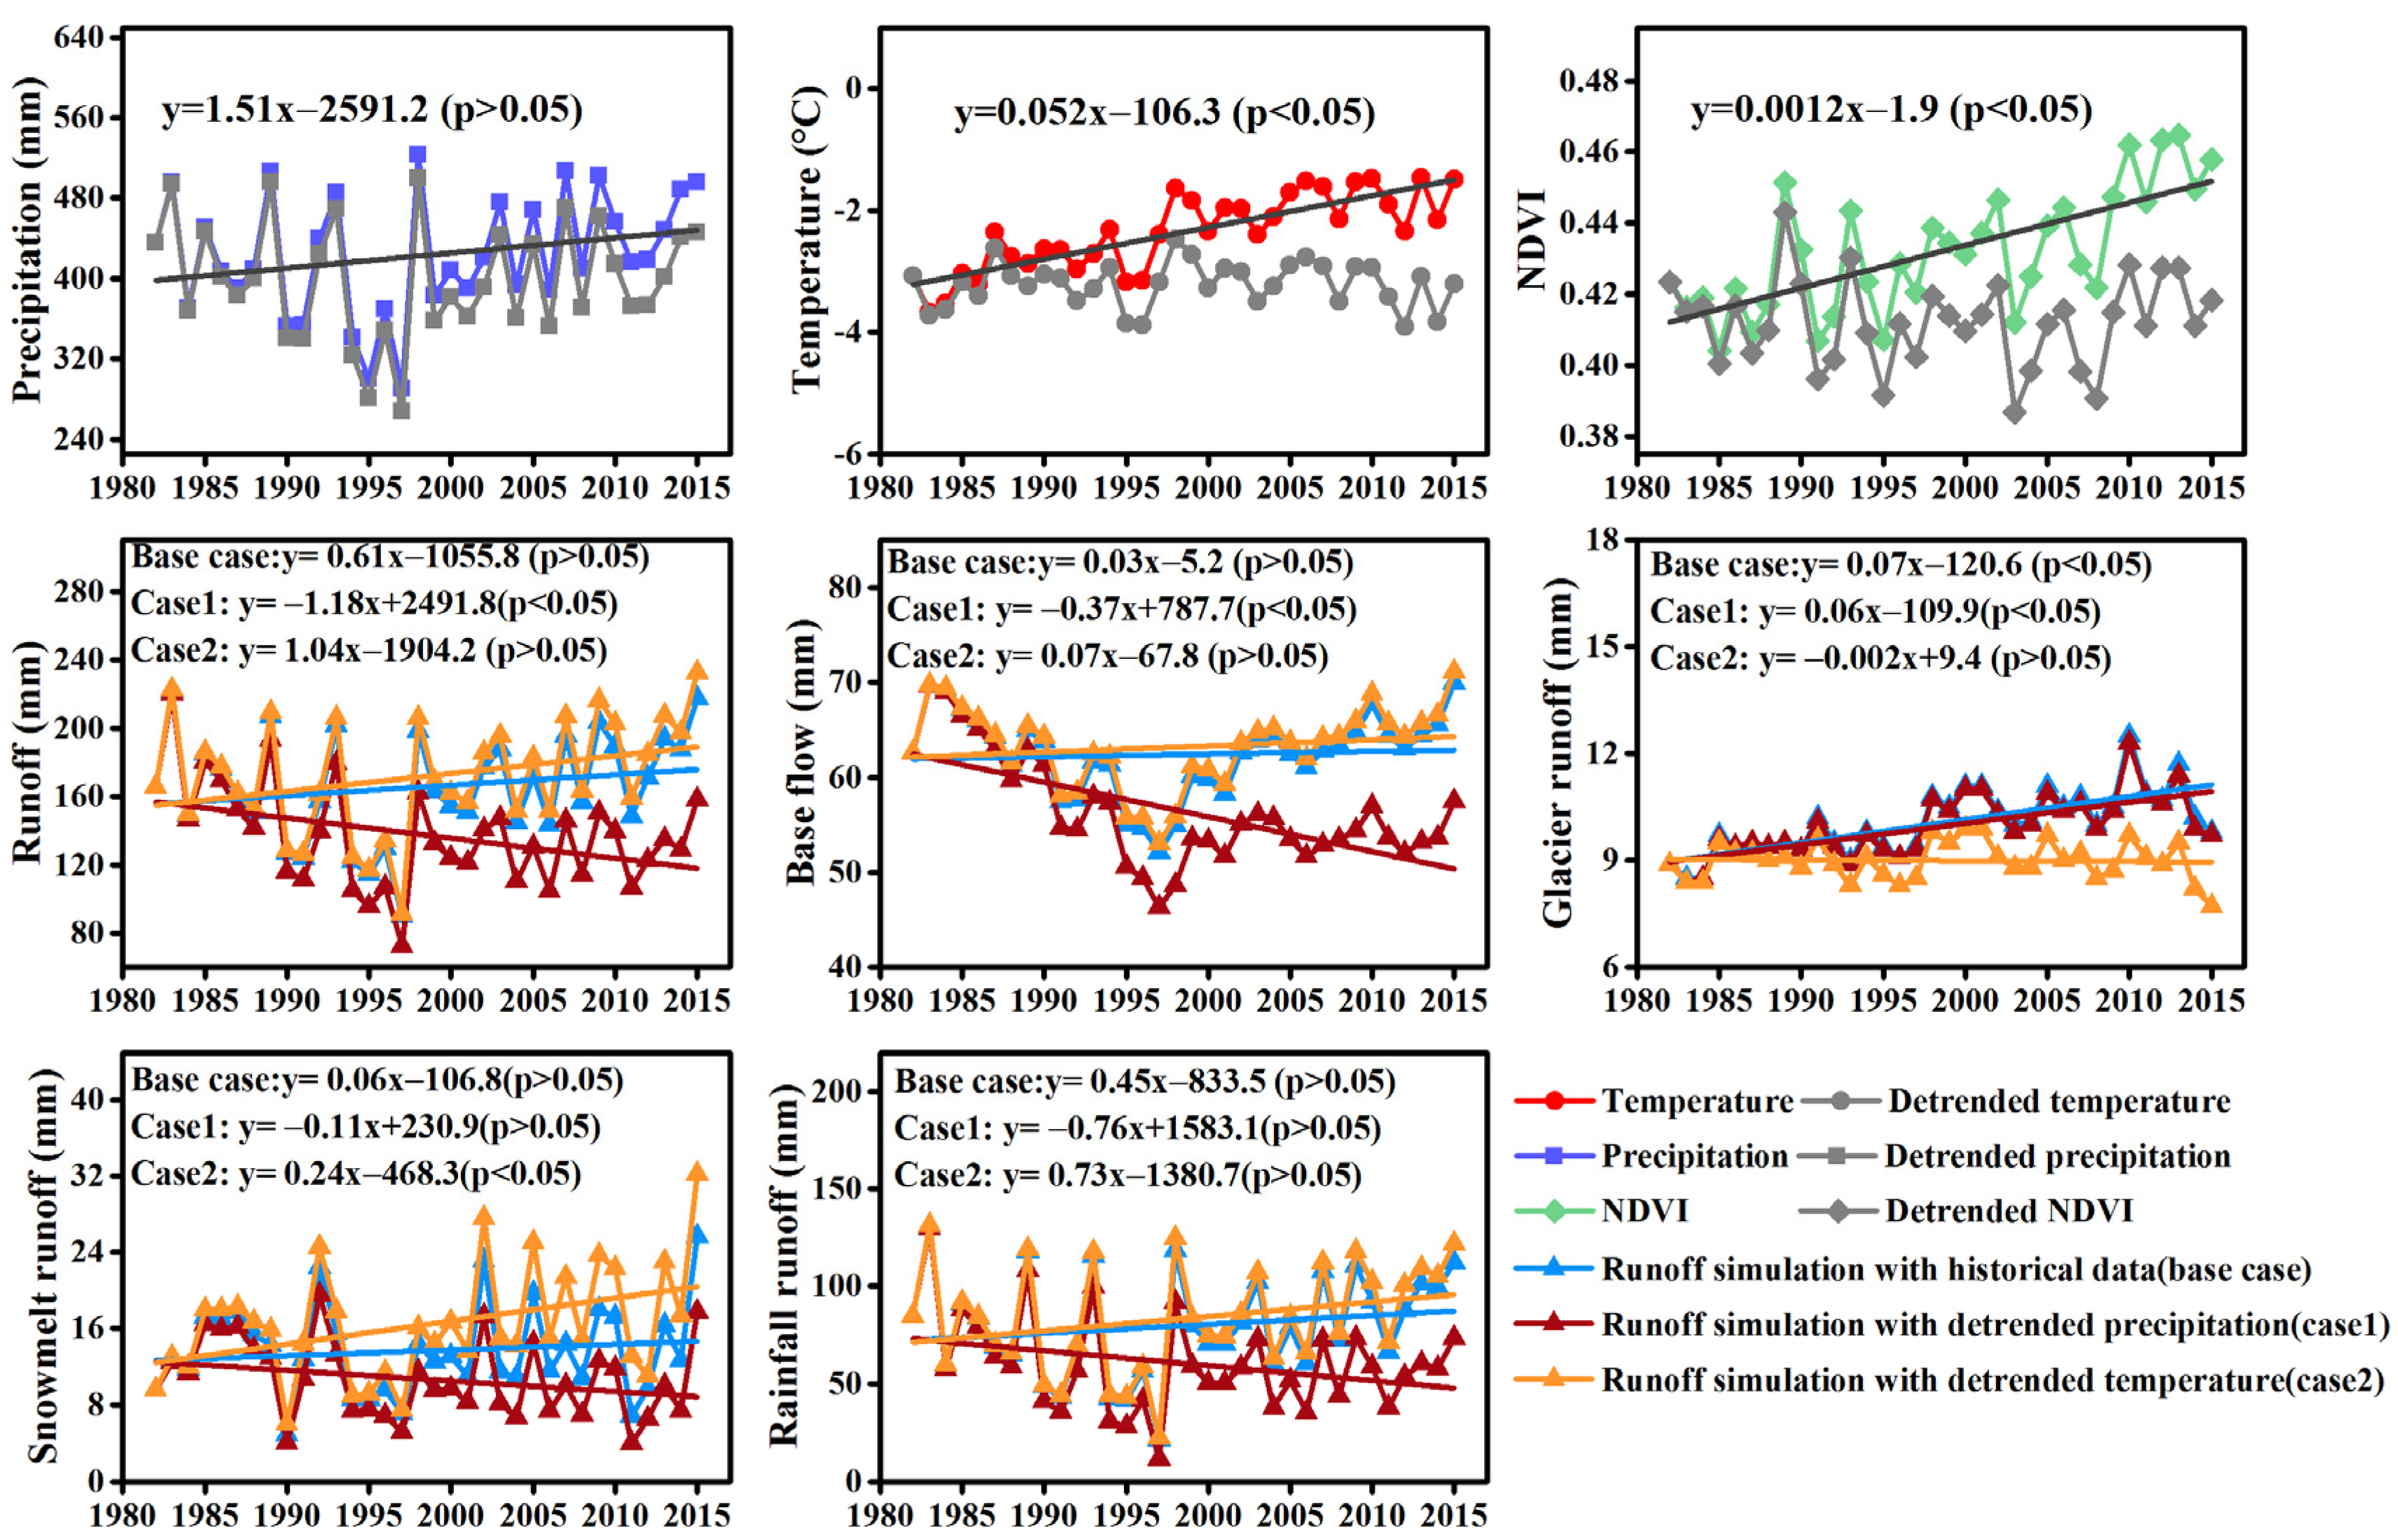
3.1.2. Changing Trends of Precipitation, Air Temperature, and NDVI during 1982–2015

The annual variation in precipitation, mean air temperature, and NDVI during the rainfall period for the historical period (1982–2015) and the detrended variables in UHRB are shown in Figure 4. The figure reveals a large inter-annual variability in precipitation. Generally, precipitation increased by approximately 15.1 mm 10 a−1 from 2015 to 1982. The annual mean air temperature showed an increasing trend with a change rate of approximately 0.52 °C 10 yr−1 from 1982 to 2015 (p < 0.05).
During the rainfall period, the change rate of NDVI was 0.012 10a−1 from 1982 to 2015 (p < 0.05). The correlation analysis indicated that NDVI had a positive relation to precipitation and temperature (p < 0.05), illustrating that climate change significantly affected vegetation. Based on the normalized data, the multivariate linear regression equation of NDVI, precipitation, and temperature was established as follows.
NDVI = 0.39 P + 0.48 T + 0.08   R 2 = 0.394
where P and T are precipitation and temperature, respectively, during the rainfall period. A previous study on the Heihe River Basin showed that climate change and anthropogenic activities jointly promoted the increase in NDVI [50].

3.2. Hydrological Modeling and Variation of Runoff

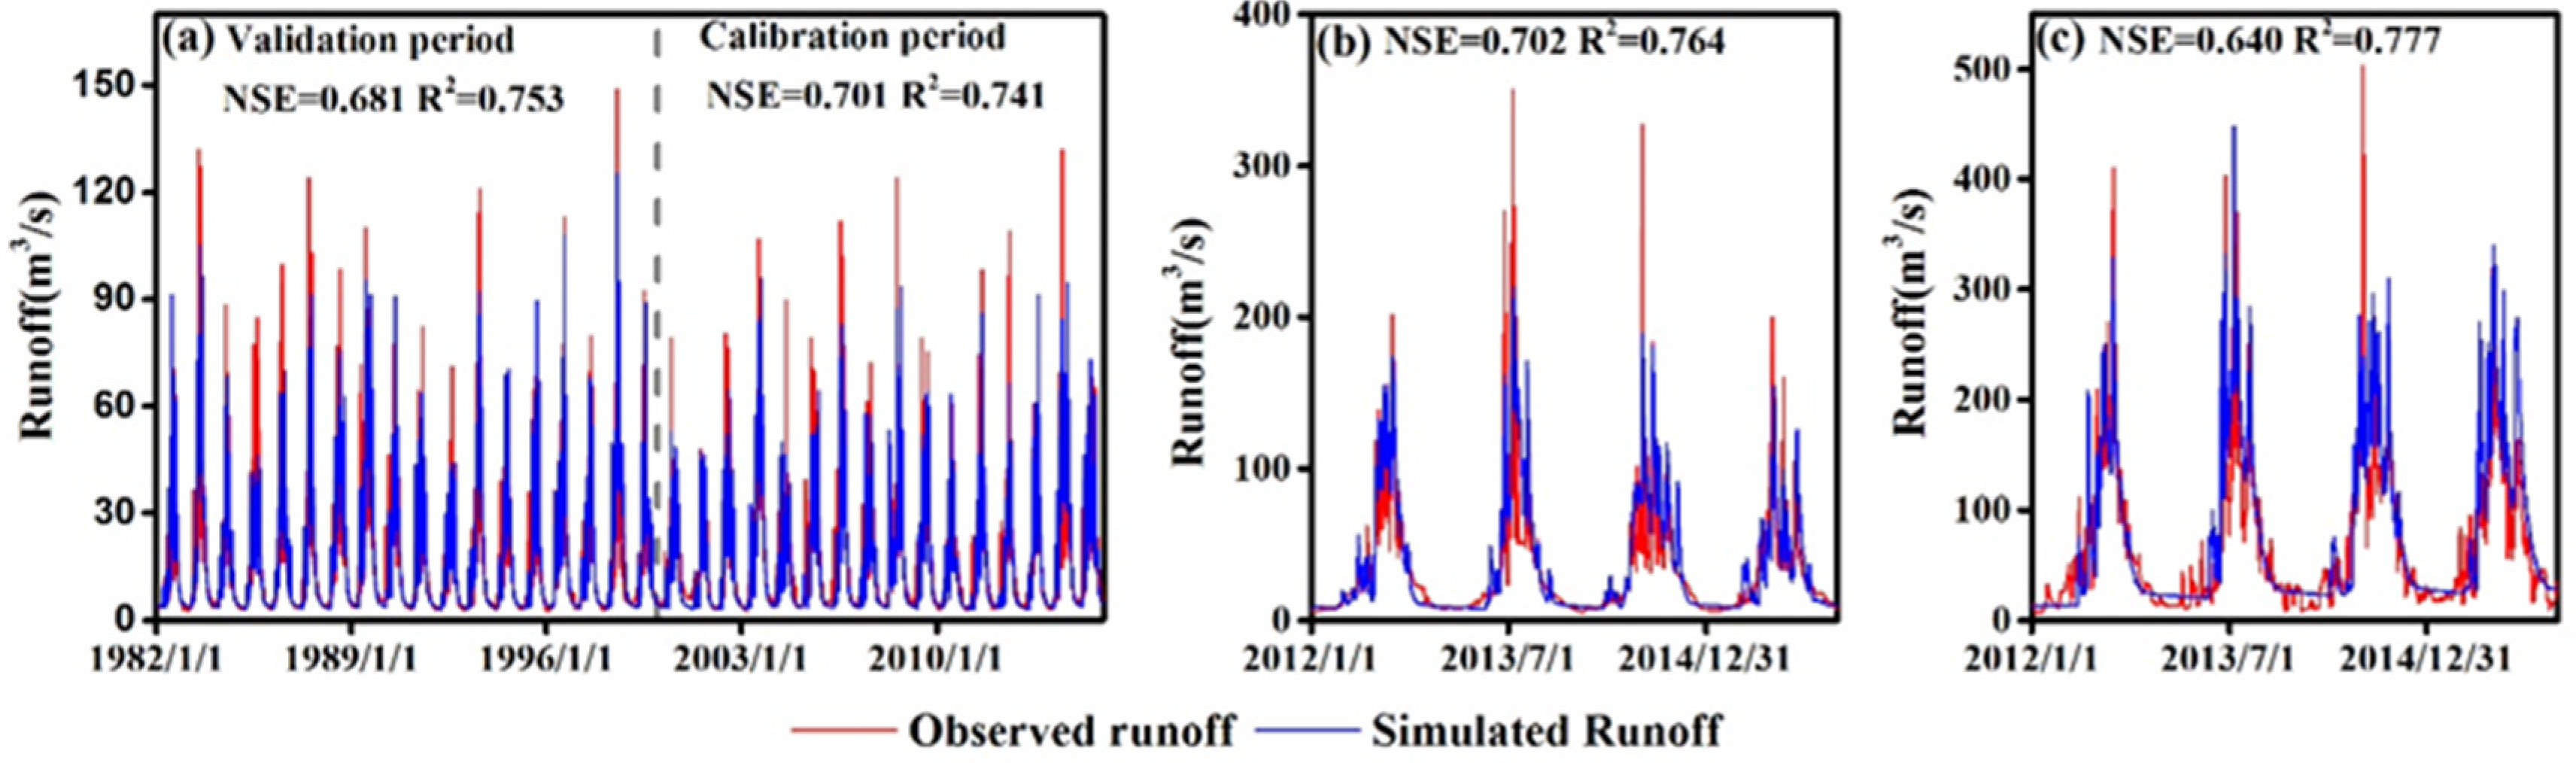
3.2.1. Model Calibration and Validation

During the calibration period (2000–2015), J2000 was optimized to obtain a reliable simulated runoff and snow cover area (SCA) through comparison with the observed runoff and MODIS SCA. The simulated runoff was compared with the observed daily runoff at QL in BBRB during the calibration and validation periods (Figure 5a). The simulation captured the variation in runoff during the snowmelt and rainfall periods. Model performance was found to be acceptable for the runoff simulation in BBRB, with R2 being 0.741 and 0.753 and NSE reaching 0.701 and 0.681 for the calibration and validation periods, respectively. Subsequently, the parameters were applied to YNGRB (Figure 5b) and UHRB (Figure 5c). The performance was also found to be acceptable for simulating runoff in YNGRB and UHRB, with R2 reaching 0.764 and 0.777 and NSE being 0.702 and 0.640, respectively. The results indicated that the J2000 model had satisfactory performance in the runoff simulation and implied a reliable precipitation input.
The simulated SCA was compared with MODIS snow data for verifying the performance of the snowmelt simulation. To reduce the impact of clouds on the model assessment, only MODIS snow images with valid data greater than 50% were selected for comparison. The model performance was found to be reliable for the snow cover simulation, with R2 of 0.609, 0.635, and 0.654 for BBRB, YNGRB, and UHRB, respectively (Figure 6). The performance of the model was acceptable for the SCA simulation, indicating the reliability of the simulated snowmelt runoff for snowmelt erosion.

3.2.2. Variation of Total Runoff and Runoff Components

According to previous research, subsurface and groundwater runoff accounted for a large proportion of the total runoff [51], indicating that base flow is an important component of UHRB. In this study, base flow contributed approximately 39.5% to the total runoff from 1982 to 2015, which is comparable with the base flow ratio (37–44%) reported in previous studies [52,53]. Base flow was the dominant component of runoff during the frozen period. With temperature and precipitation increasing from April to May, runoff began to increase, and snowmelt runoff was the major runoff component in addition to base flow, which is in accord with the research of Li et al. [54]. Temperature was the highest during the rainfall period (June to October), and the amount of precipitation was large. With the supply of precipitation and the glacier and snowmelt runoff, the river runoff was high and the rainfall runoff was the most important runoff component during this period.
As shown in Figure 4, the base flow and rainfall runoff showed increasing trends (p > 0.05), which may be attributed to the increase in precipitation from 1982 to 2015. Glacier runoff represented a significant increasing trend (p < 0.05), which may have resulted from the significant increase in air temperature (p < 0.05). Snowmelt runoff showed an increasing trend (p > 0.05), which may be a composite result of the increase in precipitation and temperature (decreasing snowfall/rainfall ratio). The changing trends of the runoff components led to an increasing trend in the total runoff (p > 0.05).

3.3. Variation of RUSLE Factors and Soil Erosion Rate

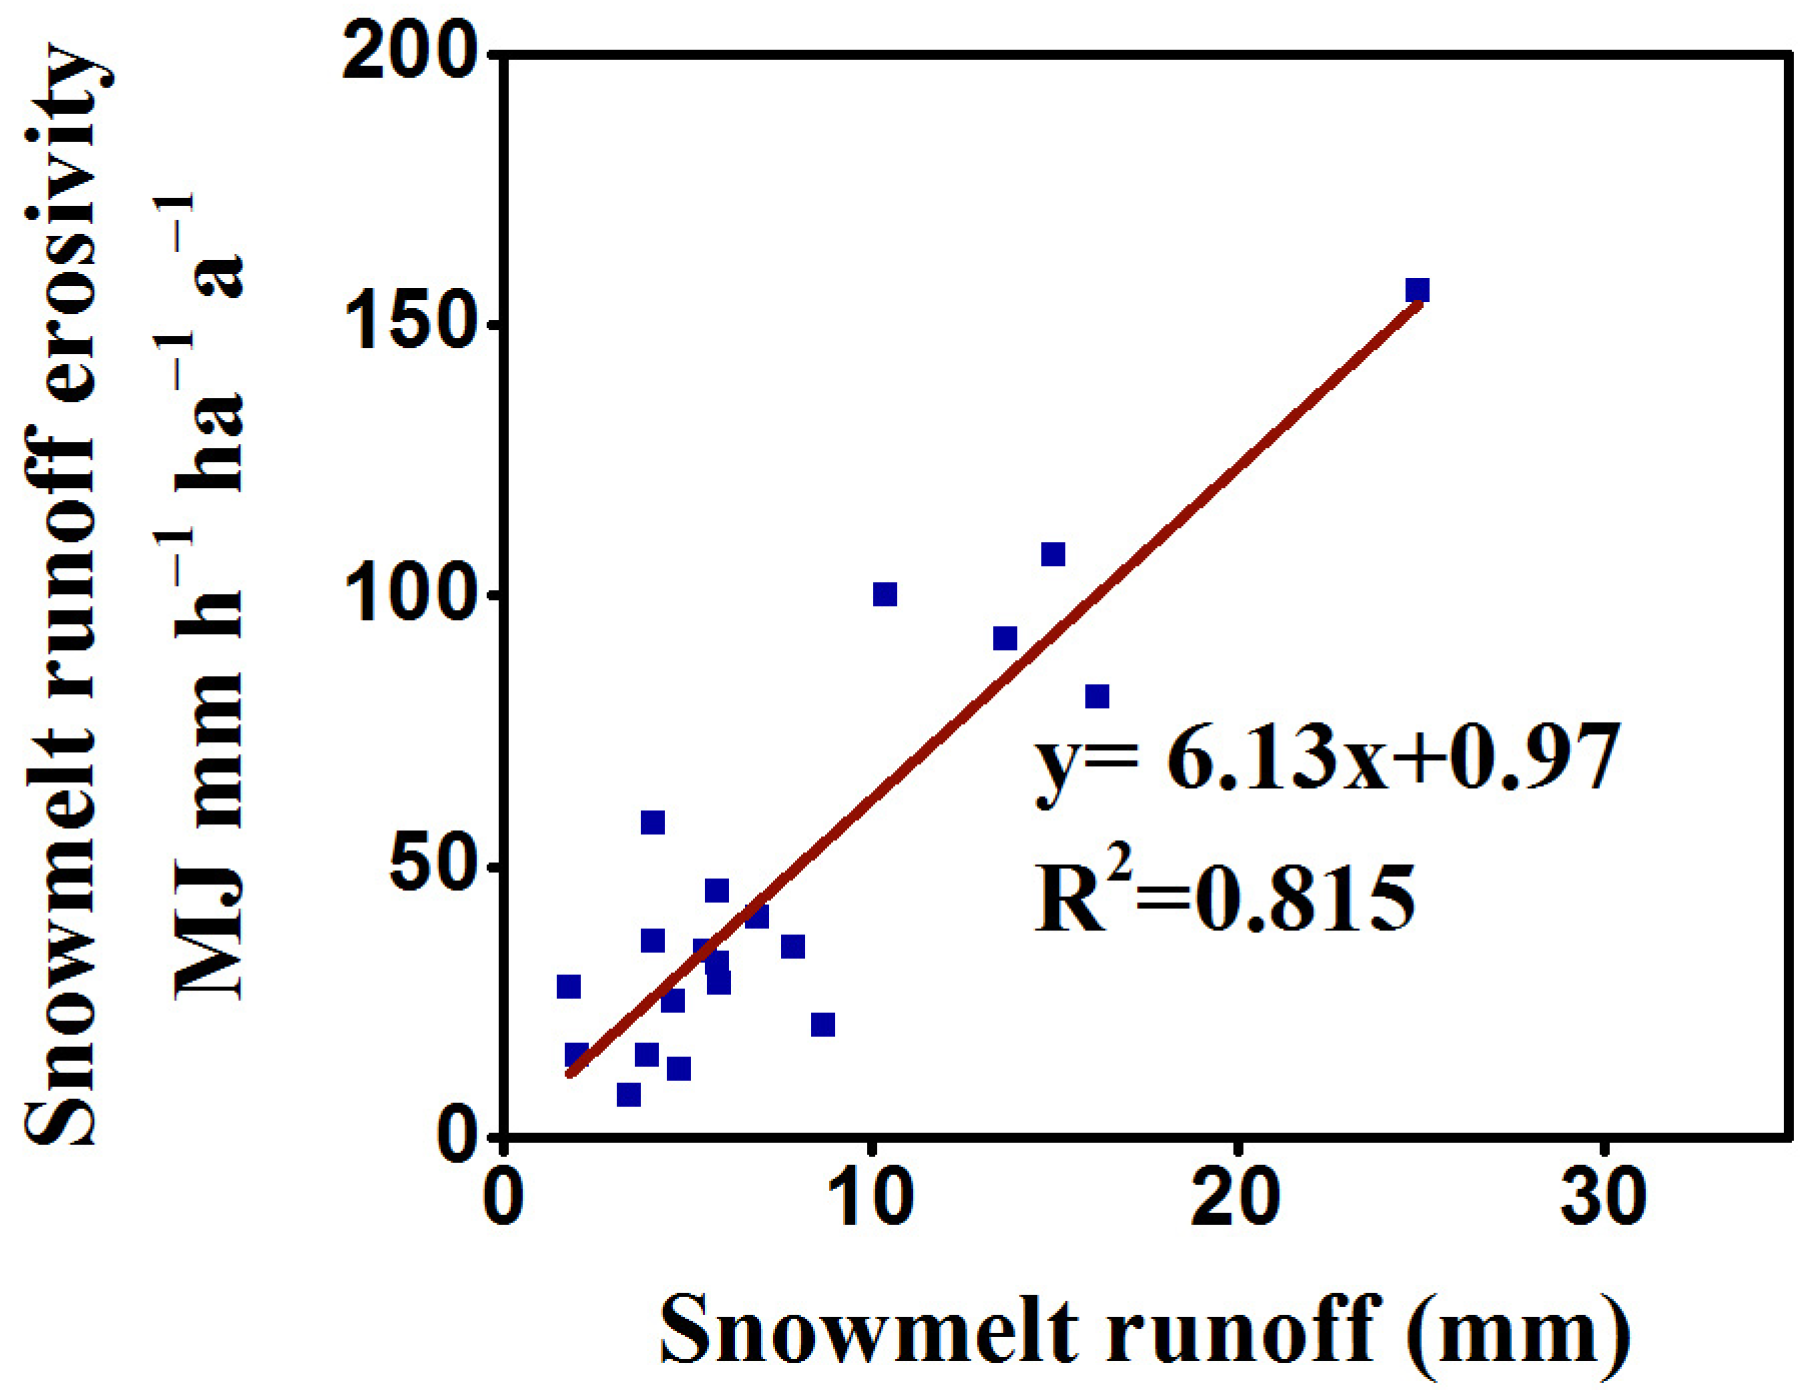
3.3.1. Snowmelt Runoff Erosivity during Snowmelt Period

The relationship between the simulated snowmelt runoff and snowmelt runoff erosivity is shown in Figure 7. Equation (21) can be used for the calculation of snowmelt runoff erosivity.
R s = 6.13 R s n o w + 0.97     R 2 = 0.815
where Rsnow is snowmelt runoff during the snowmelt period.

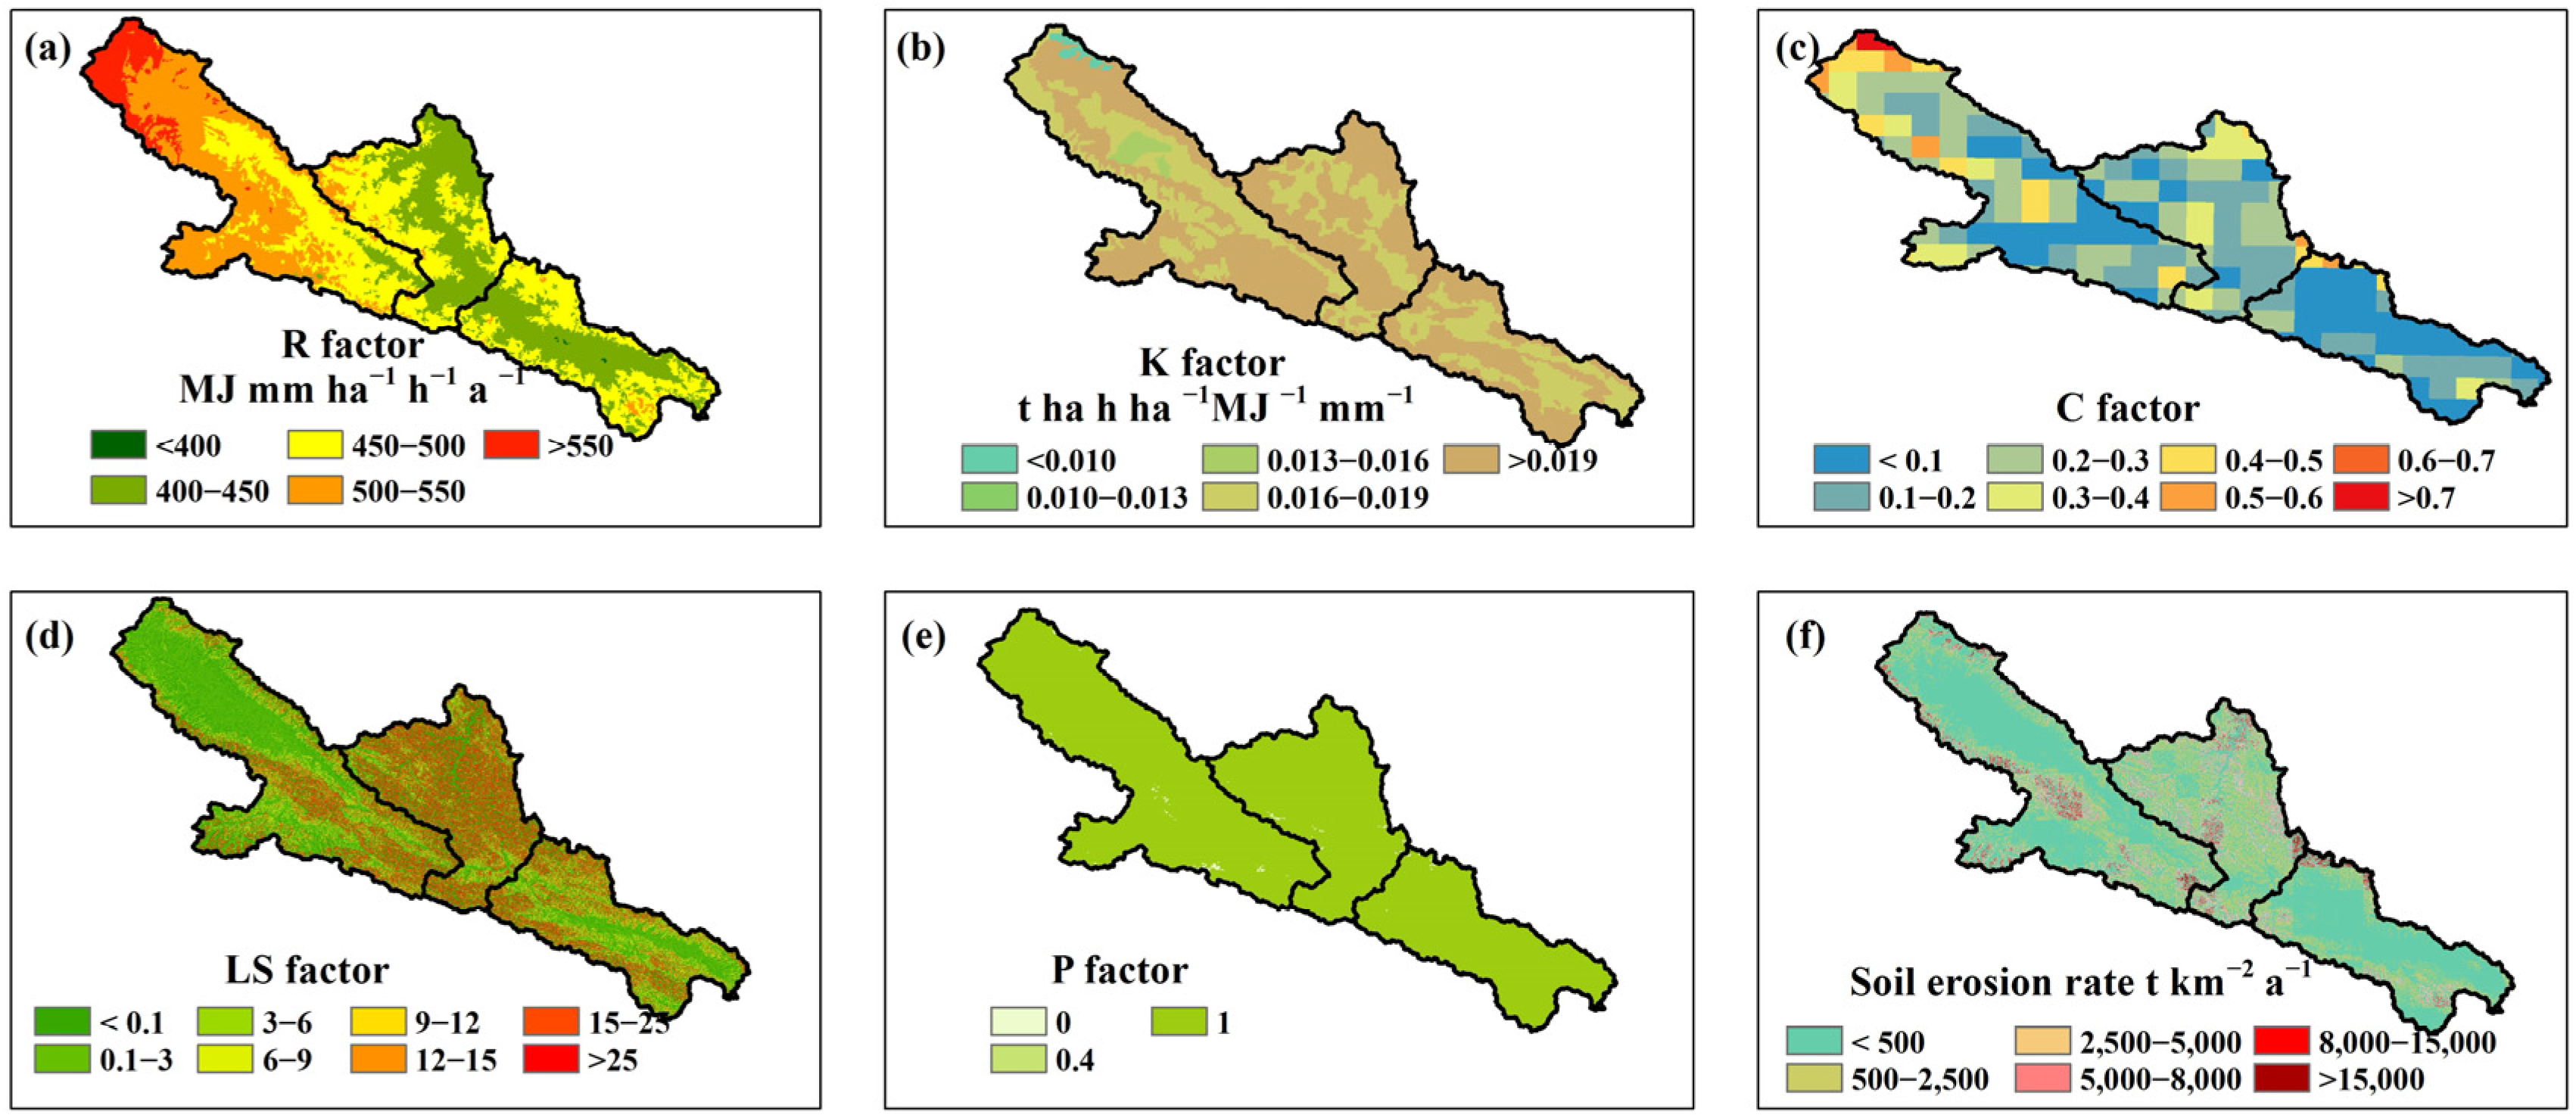
3.3.2. Spatial Distribution of RUSLE Factors and Soil Erosion Rate

The annual average values of the R factor were 453.7, 493.1, and 471.7 MJ mm ha−1 h−1 a−1 for BBRB, YNGRB, and UHRB from 1982 to 2015, respectively. According to Figure 8a, more erosive precipitation occurred in YNGRB in the west, with the highest elevation. The average K values for BBRB, YNGRB, and UHRB were very close at 0.0197, 0.0193, and 0.0196 t ha h ha−1 MJ−1 mm−1, respectively (Figure 8b), which are comparable to those of a previous study [6]. This indicates that the main soil types and their related properties are very similar between UHRB and its two tributaries. The basin average values of the C factor were 0.17, 0.31, and 0.26 for BBRB, YNGRB, and UHRB, respectively. The vegetation cover of BBRB was the highest, which explains the lowest C value in BBRB (Figure 8c). The mean values of the LS factor were 6.61, 4.89, and 6.72 for BBRB, YNGRB, and UHRB, respectively, illustrating that the topography of YNGRB is relatively flat (Figure 8d). In UHRB, the P factor was high because effective conservation practices are lacking (Figure 8e).
The annual mean soil erosion rate was 806.2 t km−2 a−1 from 1982 to 2015, indicating light erosion, and the corresponding annual soil loss in UHRB was ~7.93 million tons. The soil erosion rate during the snowmelt and rainfall periods occupied 9.33% and 90.67% of the annual soil erosion rate, respectively. The annual average soil erosion rates were 519.2, 790.3, and 806.2 t km−2 a−1 for BBRB, YNGRB, and UHRB, respectively. Although the topography of BBRB was steeper than that of YNGRB, the soil erosion rate was lower in BBRB than that in YNGRB because the former has better vegetation and receives less erosive precipitation. Based on the soil erosion rate (Table 2), severe, very severe, and extreme erosion contributed to ~37.7% of soil loss, whereas the corresponding area only accounted for 4.01% of UHRB. Light and moderate erosion were the major contributors to the remaining soil loss. Although the area of slight erosion occupied 70.1% of UHRB, the corresponding soil loss accounted for only 4.8% of the total soil loss.
Based on the spatial overlapping analysis of the soil erosion rate and DEM data, light and moderate soil erosion was mainly distributed below 4000 m, where soil conservation is more feasible with a higher population density. In contrast, very severe and extreme soil erosion was mainly observed above 4000 m. Areas below 4000 m and above 4000 m contributed approximately 50.5% (4.01 million tons) and 49.5% (3.92 million tons) to the annual soil loss, respectively.
By overlapping the soil erosion rate and slope map, the soil loss for different slope categories can be obtained (Figure S1). It can be seen that, although the area of the slope greater than 25 degrees was small, it still contributed to higher soil loss. Specifically, this slope range covered about 14.94% of the basin area, but it contributed 28.05% to the total soil loss. Similarly, the soil erosion rate for different vegetation types can be obtained. The soil erosion rate in the cropland, forest, grassland, shrub land, and bare soil were 873.4, 757.2, 809.6, 793.3, and 1918.2 t km−2 a−1, respectively (Figure S2). The precipitation in the cropland, forest, grassland, shrub land, and bare soil were 425.9, 448.4, 402.3, 436.4, and 357.3 mm, respectively. It can be seen that, with the protection of the soil by the vegetation and the relatively higher precipitation in the forest, the soil erosion rate was relatively lower.

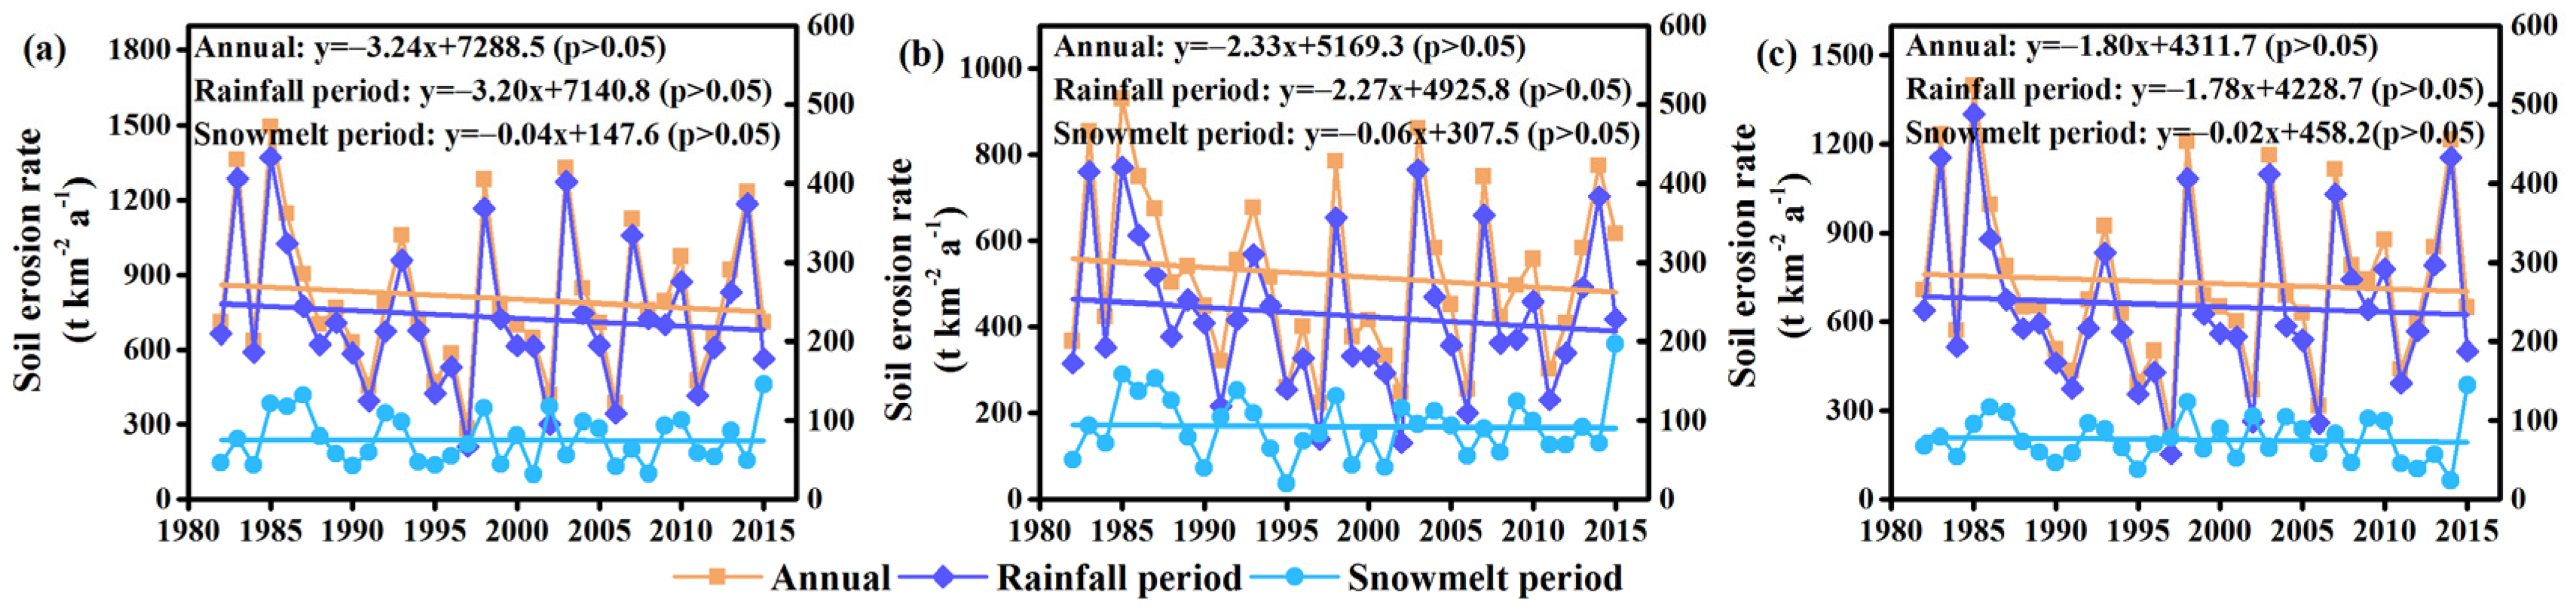
3.3.3. Changing Trends of RUSLE Factors and Soil Erosion Rate from 1982 to 2015

During the period of 1982–2015, rainfall erosivity showed increasing trends in UHRB, BBRB, and YNGRB (Figure 9), along with increasing trends in erosive precipitation. In conjunction with increasing snowmelt runoff, snowmelt runoff erosivity in BBRB, YNGRB, and UHRB also presented increasing trends (Figure 9). However, the cover management factor showed significant decreasing trends in UHRB, BBRB, and YNGRB (Figure 9), accompanied by increasing NDVI.
Figure 10a–c show the change trends of the soil erosion rate during the rainfall and snowmelt periods and the annual soil erosion rates in UHRB from 1982 to 2015. The soil erosion rate showed decreasing trends during both the snowmelt and rainfall periods, leading to a decreasing trend in the annual soil erosion rate.

3.3.4. Influence of Climate and Subsequent Vegetation Change on Soil Erosion Rate

A detrended analysis of precipitation, air temperature, and NDVI was carried out for assessing the effects of climate and subsequent vegetation change (Table 3). As NDVI was positively and significantly correlated to precipitation, NDVI changed according to Equation (14) when the detrended analysis of the precipitation and temperature was conducted. The annual soil erosion rate calculated on the basis of the detrended precipitation and corresponding NDVI was found to decrease by 11.2%, 12.9%, and 10.7% for UHRB, BBRB, and YNGRB, respectively. The annual soil erosion rate calculated according to the detrended air temperature and corresponding NDVI increased by 7.20%, 9.06%, and 7.39% for UHRB, BBRB, and YNGRB, respectively. The annual soil erosion rate calculated on the basis of the detrended NDVI increased by 11.7%, 13.1%, and 10.8% for UHRB, BBRB, and YNGRB, respectively. The detrended analysis indicated that the response of the soil erosion rate to climate and subsequent vegetation change was consistent in UHRB and its two tributaries (BBRB and YNGRB).
Changes in soil erosion rate are primarily attributable to variations in climate and vegetation [55,56], and this study confirmed the important influence of the factors mentioned above on changes in soil erosion rate. The detrended analysis of precipitation, air temperature, and NDVI showed that increasing precipitation, air temperature, and vegetation promoted by climate change and anthropogenic factors are important factors affecting soil erosion in UHRB. As surface vegetation and litter can protect the soil and increase soil resistance to weathering and transportation, the significantly increasing NDVI resulted in a significantly decreased C factor (p < 0.05), and vegetation exhibited its dominating effect on alleviating soil erosion from 1982 to 2015.
In addition, precipitation, air temperature, and vegetation in the study area exhibited different characteristics during different seasons. Accompanied by freeze–thaw cycles, climate and vegetation change induced soil erosion change during the snowmelt and rainfall periods, respectively. The detrended analysis of temperature indicated that, without increases in air temperature and subsequent NDVI, the increase in soil erosion rates for UHRB, BBRB, and YNGRB would be much smaller during the rainfall period (4.80%, 4.20%, and 4.90%) than during the snowmelt period (30.7%, 31.5%, and 30.3%). Therefore, increased attention should be given to soil erosion during the snowmelt period under warming conditions.

4. Discussions

4.1. Uncertainties in Soil Erosion Assessment in High-Mountain Areas

Soil erosion is difficult to measure and RUSLE is widely used for the calculation of soil erosion despite the difficulties involved [6,56]. The evaluation can be coupled with the investigation of the soil erosion level based on the radionuclides 210Pbex and137Cs [57]. However, there are differences that should be observed when estimating the related factors. For instance, the equation recommended by the National Water Conservancy Survey in China was adopted to calculate the rainfall-runoff erosivity factor [6,57]. Improvements in the rainfall-runoff erosivity calculation, especially during the snowmelt period, based on the precipitation amount, were conducted to improve its applicability in high-mountain areas [7,56]. For the cover management calculation, the value can be determined by the vegetation type [6] or calculated based on NDVI [56,57]. The soil erodibility factor is usually estimated based on the soil properties [6,56,57]. In this study, a snowmelt runoff erosivity calculation based on a simulated snowmelt runoff during the snowmelt period was developed to improve the rainfall-runoff erosivity calculation.
Vegetation plays a role in modifying water redistribution and soil erodibility [15]. Previous studies have found that vegetation density can affect soil moisture evolution by changing the infiltrate rate [15,58]. Maximum erodibility corresponds to bare soil, and soil erodibility decreases linearly as biomass density increases [58,59]. Therefore, vegetation dynamics and biomass density can affect hydrological processes and soil erosion [15,60,61]. Further investigation into vegetation densities’ impact on runoff evolution and soil erosion rate is needed. The vegetation types obtained from the European Space Agency were used to acquire the related parameters (such as the effective vegetation height, the effective root depth, and albedo) for the evaporation calculation, based on the Penman-Monteith equation in a J2000 hydrological model, and vegetation types were considered stable for the runoff simulation during the study period. Although the effects of vegetation with spatial variation (e.g., on different aspects and at different elevation) on soil erosion were investigated based on the spatial variation of NDVI, the impact of the dynamic vegetation on the runoff was not taken into consideration in this study. Consequently, this may lead to uncertainties in the runoff simulation and in the calculation of the soil erosion rate. This would be a direction for model improvement by considering the spatiotemporal dynamics of vegetation to improve the runoff simulation and soil erosion calculation.
In high-mountain areas, the seasonal variation and diurnal cycle of air temperature cause repeated freezing and thawing of the topsoil [62]. These freeze–thaw cycles significantly decrease the stability of soil aggregates, thus increasing soil erodibility [63]. Therefore, even a small runoff can cause serious erosion after a freeze–thaw cycle because soil aggregates would be disintegrated. In this study, the freezing and thawing effect on soil properties was not considered, and this may result in the potential underestimation of soil erodibility during the snowmelt period. Nevertheless, snowmelt runoff erosivity calculated according to the observed sediment load may reflect this effect, thus ensuring the relative accuracy of the snowmelt erosion estimation.
Moreover, in glacier basins, glacial erosion generally involves four dynamic processes, namely pull-out, abrasion, dissolution, and the scouring of sub-glacial water [64]. Therefore, soil erosion induced by glacial processes acts as a source of suspended sediments, which are transported by glacier streams. However, existing methods create difficulty in calculating glacier erosion rates, and quantitative data on long-term glacier erosion are lacking [65,66]. Considering the small glacier area in UHRB, the impact of glacier erosion was ignored in this study. Consequently, soil erosion in UHRB and its two tributaries were slightly underestimated. In the future, for basins with large glacier areas, the model will be able to be improved by estimating glacier erosion using observation data on runoff and sediment load at the terminal of glaciers.
As RUSLE is centered on soil erosion and does not consider sediment transport and deposition, SDR is generally incorporated to calculate soil erosion and suspended sediments simultaneously [19,67]. Many studies show that SDR is mostly related to river gradient, basin area, surface roughness, and the shape and slope of the basin [68,69], occasionally including climatic conditions, vegetation, and sediment particle size [70,71]. As observation data on soil erosion rates are lacking, and considering the main influencing factors of SDR, it could be reasonably assumed that SDR in the snowmelt period is equal to that in the rainfall period to some extent. Although the topography and soil texture in the study area remained unchanged, due to the influence of vegetation and the climate, there may be a certain difference in SDR between the rainfall period and the snowmelt period, which would introduce uncertainties in the calculation of soil erosion induced by snowmelt runoff. Therefore, while we attempted to conduct an accurate soil erosion estimation during the snowmelt period, it would be useful to obtain a more accurate SDR at the watershed scale through observation or experimental data.

4.2. Implications of Soil Erosion Control

The controlling factors on soil erosion are worth investigating as they significantly affect land deterioration [72]. This study could provide some essential information for soil and water conservation in high-mountain areas.
Wu et al. [2] found that snowmelt runoff induces more intense soil erosion than rainfall does in a freeze–thawed river basin, and that the soil erosion rate associated with the snowmelt runoff was even higher than that of the rainfall in areas with abundant snowmelt runoffs [73]. Comparing snowmelt runoff and erosive rainfall and the corresponding soil erosion rates during the snowmelt and rainfall periods, the soil erosion rate corresponding to 1 mm of snowmelt runoff was approximately 1.9 times that of erosive rainfall. Snowmelt runoff is influenced by temperature and precipitation, and its impact on soil erosion is more complicated under climate change. Therefore, the contributing factors of snowmelt runoff deserve further attention. Small-scale engineering measures, such as the construction of man-made drainage pipes, may be considered to control soil erosion induced by snowmelt runoff.
Although areas above 4000 m asl contributed to 49.5% of the annual soil loss, conservation measures are not ideal, and natural recovery would be a more suitable alternative considering the low population density and high cost involved. For soil erosion below 4000 m asl., soil and water conservation shelterbelts and small-scale engineering measures may be effective for ecological restoration and protection. Moreover, conservation measures, such as rotating grazing, enclosing grassland, and returning grazing land to grassland/forest, may also be effective for reducing the soil erosion risk.
Vegetation can alleviate soil erosion by reducing raindrop kinetic energy through the canopy and litter [9]. In addition, root fixation can also effectively prevent soil erosion [12]. Temperature and precipitation are important factors affecting vegetation in the Tibetan Plateau [74], and changes in NDVI further affect soil erosion. Although an upward trend of rainfall runoff erosivity was observed, the soil erosion rate represented a decreasing trend, which may be attributable to the increase in NDVI induced by precipitation and temperature changes. Considering the spatiotemporal complexity of factors controlling soil erosion, the clarification of the dominant factors and the quantification of their contribution rates are fundamental to acquiring accurate information on soil and water conservation.

5. Conclusions

This study applied an improved RUSLE to estimate the soil erosion rate in UHRB, analyzed the change trends of the soil erosion rate, and ascertained the effects of precipitation, temperature, and vegetation on soil erosion. The main findings are as follows: (1) The proposed approach, which combines J2000 and RUSLE, proved to be an efficient approach for simulating the total runoff and runoff components, estimating the snow cover area and soil erosion rates and evaluating the effects of the changing climate and vegetation on soil erosion. (2) The average soil erosion rate of UHRB was found to correspond to the light grade with an annual value of 806.2 t km−2 a−1. Light and moderate soil erosion was mainly distributed below 4000 m, while very severe and extreme soil erosion was mainly distributed above 4000 m. Overall, areas below 4000 m, where soil conservation measures are more feasible, and above 4000 m experienced soil losses of ~4.01 and 3.92 million tons, respectively. (3) NDVI showed a significant increasing trend, which was attributable to the increase in both annual precipitation and mean air temperature from 1982 to 2015. As vegetation has a protective effect on soil, the increase in NDVI resulted in decreasing trends in the soil erosion rate (for the annual period, rainfall period, and snowmelt period), although erosive rainfall and snowmelt runoff showed upward trends. Specifically, the soil loss for the annual period, rainfall period, and snowmelt period, showed occurred at a decreasing rate, at −0.319 × 10⁵ t a−1, −0.315 × 10⁵ t a−1, and −0.004 × 10⁵ t a−1, respectively. (4) The contribution of the soil erosion rate during the rainfall and snowmelt periods was 90.67% and 9.33%, respectively. However, the soil erosion rate, attributable to 1 mm of snowmelt runoff, was approximately 1.9 times that of the equivalent erosive rainfall. Moreover, soil erosion during the snowmelt period was particularly sensitive to temperature change. (5) The detrended analysis indicated that the annual soil erosion rate would decrease by 11.2% and increase by 7.20% and 11.7% if there were no changes in precipitation, temperature, and NDVI, indicating the significant impact of vegetation on soil erosion rate.
The study improved RUSLE to make it more applicable to high-mountain areas by incorporating an equivalent rainfall-runoff erosivity equation during the snowmelt period. Then, the temporal variations (for the annual period, rainfall period, and snowmelt period) and the spatial characteristics of soil erosion were obtained. Considering the impact of climate and subsequent vegetation changes on soil erosion, sensitive analyses were conducted to analyze the effect of changes in precipitation, temperature, and NDVI on the soil erosion rate variation. However, the impact of vegetation dynamics and density was not taken into consideration, which may lead to uncertainties in the soil erosion rate calculation. Although the applicability of RUSLE to high-mountain areas was improved by incorporating the calculation of the soil erosion rate during the snowmelt period, the establishment of relationships between the snowmelt runoff and snowmelt runoff erosivity demands an observed sediment load and simulated snowmelt runoff data, limiting the application of this method to basins with limited available data. On the other hand, the impact of a changing climate on soil erosion in alpine basins is complicated as it involves many processes, such as glacier erosion, snowmelt erosion, rainfall erosion, and soil freezing and thawing cycles. Therefore, more advanced process-based flow and sediment transport models combined with vegetation dynamics and density will be helpful for investigating the response of soil erosion to climate and vegetation changes in the future. Meanwhile, radionuclide can be adopted to evaluate the soil erosion process.
It is noteworthy that soil erosion processes are very complicated because of interactions between precipitation, temperature, and vegetation in high-mountain areas, and increased attention should be given to soil erosion under global change. This study reveals that, in addition to the general influence of climate change on vegetation and the consequent influence of vegetation on soil erosion, the effect of temperature change on soil erosion during the snowmelt period should be considered. These findings will be helpful in better understanding the response of soil erosion to climate and vegetation change and in providing scientific evidence for water and soil management in high-mountain areas.

Supplementary Materials

The following supporting information can be downloaded at: https://www.mdpi.com/article/10.3390/su15043220/s1, Figure S1: Area and soil loss for different slope categories. Figure S2. Soil erosion rate and precipitation for different vegetation types.

Author Contributions

Conceptualization, L.W.; Methodology, L.W.; Software, L.W., G.W. and Y.C.; Investigation, L.W.; Resources, F.Z.; Data curation, L.W.; Writing—original draft, L.W.; Writing—review & editing, F.Z., G.W., C.Z., X.S., H.T., G.Z., C.X. and X.L.; Supervision, F.Z. All authors have read and agreed to the published version of the manuscript.

Funding

This research was financially supported by the National Natural Science Foundation of China (Grant No. 42125104 and No. 41877081).

Institutional Review Board Statement

Not Applicable.

Informed Consent Statement

Not Applicable.

Data Availability Statement

The authors do not have permission to share data.

Acknowledgments

The authors would like to thank the Hydrology and Water Resources Bureau of Gansu Province for sharing the observed runoff and sediment load data. We also thank all the reviewers who participated in the review.

Conflicts of Interest

The authors declare no conflict of interest.

References

  1. Zhang, X.; Wu, S.; Cao, W.; Guan, J.; Wang, Z. Dependence of the sediment delivery ratio on scale and its fractal characteristics. Int. J. Sediment Res. 2015, 30, 338–343. [Google Scholar] [CrossRef]
  2. Wu, Y.; Ouyang, W.; Hao, Z.; Lin, C.; Liu, H.; Wang, Y. Assessment of soil erosion characteristics in response to temperature and precipitation in a freeze-thaw watershed. Geoderma 2018, 328, 56–65. [Google Scholar] [CrossRef]
  3. Yue, L.; Juying, J.; Bingzhe, T.; Binting, C.; Hang, L. Response of runoff and soil erosion to erosive rainstorm events and vegetation restoration on abandoned slope farmland in the Loess Plateau region, China. J. Hydrol. 2020, 584, 124694. [Google Scholar] [CrossRef]
  4. Ouyang, W.; Hao, F.; Skidmore, A.K.; Toxopeus, A. Soil erosion and sediment yield and their relationships with vegetation cover in upper stream of the Yellow River. Sci. Total Environ. 2010, 409, 396–403. [Google Scholar] [CrossRef] [PubMed]
  5. Wildhaber, Y.S.; Bänninger, D.; Burri, K.; Alewell, C. Evaluation and application of a portable rainfall simulator on subalpine grassland. Catena 2012, 91, 56–62. [Google Scholar] [CrossRef]
  6. Teng, H.; Liang, Z.; Chen, S.; Liu, Y.; Rossel, R.A.V.; Chappell, A.; Yu, W.; Shi, Z. Current and future assessments of soil erosion by water on the Tibetan Plateau based on RUSLE and CMIP5 climate models. Sci. Total Environ. 2018, 635, 673–686. [Google Scholar] [CrossRef]
  7. Wang, Y.; Cheng, C.; Xie, Y.; Liu, B.; Yin, S.; Liu, Y.; Hao, Y. Increasing trends in rainfall-runoff erosivity in the Source Region of the Three Rivers, 1961–2012. Sci. Total Environ. 2017, 592, 639–648. [Google Scholar] [CrossRef]
  8. Jiang, C.; Zhang, H.; Zhang, Z.; Wang, D. Model-based assessment soil loss by wind and water erosion in China’s Loess Plateau: Dynamic change, conservation effectiveness, and strategies for sustainable restoration. Glob. Planet. Change 2019, 172, 396–413. [Google Scholar] [CrossRef]
  9. Jin, F.; Yang, W.; Fu, J.; Li, Z. Effects of vegetation and climate on the changes of soil erosion in the Loess Plateau of China. Sci. Total Environ. 2021, 773, 145514. [Google Scholar] [CrossRef]
  10. Ochoa, P.; Fries, A.; Mejía, D.; Burneo, J.; Ruíz-Sinoga, J.; Cerdà, A. Effects of climate, land cover and topography on soil erosion risk in a semiarid basin of the Andes. Catena 2016, 140, 31–42. [Google Scholar] [CrossRef]
  11. Panagos, P.; Ballabio, C.; Borrelli, P.; Meusburger, K.; Klik, A.; Rousseva, S.; Tadić, M.P.; Michaelides, S.; Hrabalíková, M.; Olsen, P.; et al. Rainfall erosivity in Europe. Sci. Total Environ. 2015, 511, 801–814. [Google Scholar] [CrossRef] [PubMed]
  12. Zhang, B.; He, C.; Burnham, M.; Zhang, L. Evaluating the coupling effects of climate aridity and vegetation restoration on soil erosion over the Loess Plateau in China. Sci. Total Environ. 2016, 539, 436–449. [Google Scholar] [CrossRef] [PubMed]
  13. Zhang, F.; Shi, X.; Zeng, C.; Wang, L.; Xiao, X.; Wang, G.; Chen, Y.; Zhang, H.; Lu, X.; Immerzeel, W. Recent stepwise sediment flux increase with climate change in the Tuotuo River in the central Tibetan Plateau. Sci. Bull. 2020, 65, 410–418. [Google Scholar] [CrossRef] [PubMed]
  14. Langbein, W.B.; Schumm, S.A. Yield of sediment in relation to mean annual precipitation. Trans. Am. Geophys. Union 1958, 39, 1076–1084. [Google Scholar] [CrossRef]
  15. Saco, P.M.; Heras, M.M.-D.L. Ecogeomorphic coevolution of semiarid hillslopes: Emergence of banded and striped vegetation patterns through interaction of biotic and abiotic processes. Water Resour. Res. 2013, 49, 115–126. [Google Scholar] [CrossRef]
  16. Srivastava, A.; Yetemen, O.; Saco, P.M.; Rodriguez, J.F.; Kumari, N.; Chun, K.P. Influence of orographic precipitation on coevolving landforms and vegetation in semi-arid ecosystems. Earth Surf. Process. Landforms 2022, 47, 2846–2862. [Google Scholar] [CrossRef]
  17. Edwards, L.; Richter, G.; Bernsdorf, B.; Schmidt, R.-G.; Burney, J. Measurement of rill erosion by snowmelt on potato fields under rotation in Prince Edward Island (Canada). Can. J. Soil Sci. 1998, 78, 449–458. [Google Scholar] [CrossRef]
  18. Ollesch, G.; Sukhanovski, Y.; Kistner, I.; Rode, M.; Meissner, R. Characterization and modelling of the spatial heterogeneity of snowmelt erosion. Earth Surf. Process. Landf. J. Br. Geomorphol. Res. Group 2005, 30, 197–211. [Google Scholar] [CrossRef]
  19. Thomas, J.; Joseph, S.; Thrivikramji, K. Estimation of soil erosion in a rain shadow river basin in the southern Western Ghats, India using RUSLE and transport limited sediment delivery function. Int. Soil Water Conserv. Res. 2018, 6, 111–122. [Google Scholar] [CrossRef]
  20. Wischmeier, W.H.; Smith, D.D. Predicting Rainfall Erosion Losses: A Guide to Conservation Planning; Agricultural Handbook no. 537; USDA, Science and Education Administration: Hyattsville, MD, USA, 1978; pp. 285–291.
  21. Gitas, I.Z.; Douros, K.; Minakou, C.; Silleos, G.N.; Karydas, C.G. Multi-temporal soil erosion risk assessment in N. Chalkidiki using a modified USLE raster model. EARSel Eproceedings 2009, 8, 40–52. [Google Scholar]
  22. Van der Knijff, J.M.; Jones, R.J.A.; Montanarella, L. Montanarella, Soil Erosion Risk: Assessment in Europe; European Soil Bureau, European Communities, EUR 19044 EN, 2000.
  23. Lin, W.-T.; Lin, C.-Y.; Chou, W.-C. Assessment of vegetation recovery and soil erosion at landslides caused by a catastrophic earthquake: A case study in Central Taiwan. Ecol. Eng. 2006, 28, 79–89. [Google Scholar] [CrossRef]
  24. Yao, T.; Xue, Y.; Chen, D.; Chen, F.; Thompson, L.; Cui, P.; Koike, T.; Lau, W.K.-M.; Lettenmaier, D.; Mosbrugger, V.; et al. Recent Third Pole’s Rapid Warming Accompanies Cryospheric Melt and Water Cycle Intensification and Interactions between Monsoon and Environment: Multidisciplinary Approach with Observations, Modeling, and Analysis. Bull. Am. Meteorol. Soc. 2019, 100, 423–444. [Google Scholar] [CrossRef]
  25. Li, D.; Lu, X.; Overeem, I.; Walling, D.E.; Syvitski, J.; Kettner, A.J.; Bookhagen, B.; Zhou, Y.; Zhang, T.; Sturmlechner, I.; et al. Exceptional increases in fluvial sediment fluxes in a warmer and wetter High Mountain Asia. Science 2021, 374, 599–603. [Google Scholar] [CrossRef] [PubMed]
  26. Li, Z.; Li, Q.; Wang, J.; Feng, Y.; Shao, Q. Impacts of projected climate change on runoff in upper reach of Heihe River basin using climate elasticity method and GCMs. Sci. Total Environ. 2020, 716, 137072. [Google Scholar] [CrossRef] [PubMed]
  27. Cheng, G.; Li, X.; Zhao, W.; Xu, Z.; Feng, Q.; Xiao, S.; Xiao, H. Integrated study of the water–ecosystem–economy in the Heihe River Basin. Natl. Sci. Rev. 2014, 1, 413–428. [Google Scholar] [CrossRef]
  28. Fu, J.; Niu, J.; Kang, S.; Adeloye, A.J.; Du, T. Crop production in the Hexi Corridor challenged by future climate change. J. Hydrol. 2019, 579, 124197. [Google Scholar] [CrossRef]
  29. Li, X.; Zhang, L.; Zheng, Y.; Yang, D.; Wu, F.; Tian, Y.; Han, F.; Gao, B.; Li, H.; Zhang, Y.; et al. Novel hybrid coupling of ecohydrology and socioeconomy at river basin scale: A watershed system model for the Heihe River basin. Environ. Model. Softw. 2021, 141, 105058. [Google Scholar] [CrossRef]
  30. Jiao, J.; Xie, Y.; Lin, Y.; Zhao, D. Study on rainfall-runoff erosivity index in Northeastern China. Sci. Soil Water Conserv. 2009, 7, 6–11. [Google Scholar]
  31. Nepal, S. Impacts of climate change on the hydrological regime of the Koshi river basin in the Himalayan region. J. Hydro-Environ. Res. 2016, 10, 76–89. [Google Scholar] [CrossRef]
  32. Eeckman, J.; Nepal, S.; Chevallier, P.; Camensuli, G.; Delclaux, F.; Boone, A.; De Rouw, A. Comparing the ISBA and J2000 approaches for surface flows modelling at the local scale in the Everest region. J. Hydrol. 2018, 569, 705–719. [Google Scholar] [CrossRef]
  33. Khatakho, R.; Talchabhadel, R.; Thapa, B.R. Evaluation of different precipitation inputs on streamflow simulation in Himalayan River basin. J. Hydrol. 2021, 599, 126390. [Google Scholar] [CrossRef]
  34. Knauf, D. Die Berechnung des Abflusses aus einer Schneedecke. Anal. Und Berechn. Oberird. Abflüsse 1980, 46, 97–133. [Google Scholar]
  35. Nepal, S.; Khatiwada, K.R.; Pradhananga, S.; Kralisch, S.; Samyn, D.; Bromand, M.T.; Jamal, N.; Dildar, M.; Durrani, F.; Rassouly, F.; et al. Future snow projections in a small basin of the Western Himalaya. Sci. Total Environ. 2021, 795, 148587. [Google Scholar] [CrossRef]
  36. Rohrer, M.; Salzmann, N.; Stoffel, M.; Kulkarni, A.V. Missing (In-Situ) snow cover data hampers climate change and runoff studies in the Greater Himalayas. Sci. Total Environ. 2013, 468–469, S60–S70. [Google Scholar] [CrossRef]
  37. Du, H.; Dou, S.; Deng, X.; Xue, X.; Wang, T. Assessment of wind and water erosion risk in the watershed of the Ningxia-Inner Mongolia Reach of the Yellow River, China. Ecol. Indic. 2016, 67, 117–131. [Google Scholar] [CrossRef]
  38. Renard, K.G.; Yoder, D.C.; Lightle, D.T.; Dabney, S.M. Universal Soil Loss Equation and Revised Universal Soil Loss Equation. In Handbook of Erosion Modelling; Blackwell Publishing Ltd.: Hoboken, NJ, USA, 2010; pp. 135–167. [Google Scholar] [CrossRef]
  39. Sharpley, A.N. EPIC-erosion/productivity impact calculator: 1, Model Documentation. USDA Technol. Bull. 1759, 1990, 235. [Google Scholar]
  40. Park, S.; Oh, C.; Jeon, S.; Jung, H.; Choi, C. Soil erosion risk in Korean watersheds, assessed using the revised universal soil loss equation. J. Hydrol. 2011, 399, 263–273. [Google Scholar] [CrossRef]
  41. Fu, S.; Liu, B.; Zhou, G.; Sun, Z.; Zhu, X. Calculation tool of topographic factors. Sci. Soil Water Conserv. 2015, 13, 105–110. [Google Scholar]
  42. McCool, D.K.; Brown, L.C.; Foster, G.R.; Mutchler, C.K.; Meyer, L.D. Revised Slope Steepness Factor for the Universal Soil Loss Equation. Trans. ASAE 1987, 30, 1387–1396. [Google Scholar] [CrossRef]
  43. Zhou, P.; Luukkanen, O.; Tokola, T.; Nieminen, J. Effect of vegetation cover on soil erosion in a mountainous watershed. Catena 2008, 75, 319–325. [Google Scholar] [CrossRef]
  44. Van Leeuwen, W.J.D.; Sammons, G. Vegetation dynamics and erosion modeling using remotely sensed data (MODIS) and GIS. In Proceedings of the Tenth Biennial USDA Forest Service Remote Sensing Applications Conference, Salt Lake City, UT, USA, 5–9 April 2004. [Google Scholar]
  45. Lei, W.; Wen, Z. Research on Soil Erosion Vegetation Factor Index Based on Community Structure. J. Soil Water Conservation 2008, 22, 68–72. [Google Scholar]
  46. Renard, K.G. Predicting soil erosion by water: A guide to conservation planning with the Revised Universal Soil Loss Equation (RUSLE). Agric. Handb. 1996, 703, 23. [Google Scholar]
  47. Naqvi, H.R.; Mallick, J.; Devi, L.M.; Siddiqui, M.A. Multi-temporal annual soil loss risk mapping employing Revised Universal Soil Loss Equation (RUSLE) model in Nun Nadi Watershed, Uttrakhand (India). Arab. J. Geosci. 2013, 6, 4045–4056. [Google Scholar] [CrossRef]
  48. Zhang, Y.; Liu, C.; Tang, Y.; Yang, Y. Trends in pan evaporation and reference and actual evapotranspiration across the Tibetan Plateau. J. Geophys. Res. Atmos. 2007, 112, D12110. [Google Scholar] [CrossRef]
  49. Cuo, L.; Zhang, Y.; Gao, Y.; Hao, Z.; Cairang, L. The impacts of climate change and land cover/use transition on the hydrology in the upper Yellow River Basin, China. J. Hydrol. 2013, 502, 37–52. [Google Scholar] [CrossRef]
  50. Zhu, L.; Meng, J.; Zhu, L. Applying Geodetector to disentangle the contributions of natural and anthropogenic factors to NDVI variations in the middle reaches of the Heihe River Basin. Ecol. Indic. 2020, 117, 106545. [Google Scholar] [CrossRef]
  51. Yang, D.; Gao, B.; Jiao, Y.; Lei, H.; Zhang, Y.; Yang, H.; Cong, Z. A distributed scheme developed for eco-hydrological modeling in the upper Heihe River. Sci. China Earth Sci. 2015, 58, 36–45. [Google Scholar] [CrossRef]
  52. Zhao, J. Terrestrial Water Cycle Scheme in Heihe River Basin and Its Responses to Human Activities; China University of Geosciences: Beijing, China, 2010. [Google Scholar]
  53. Zhang, H.; Zhang, B.; Zhao, C.Y. Annual base flow change and its causes in the upper reaches of Heihe River. Geogr. Res. 2011, 30, 1421–1430. [Google Scholar]
  54. Li, H.; Li, X.; Yang, D.; Wang, J.; Gao, B.; Pan, X.; Zhang, Y.; Hao, X. Tracing Snowmelt Paths in an Integrated Hydrological Model for Understanding Seasonal Snowmelt Contribution at Basin Scale. J. Geophys. Res. Atmos. 2019, 124, 8874–8895. [Google Scholar] [CrossRef]
  55. Mohammad, A.G.; Adam, M.A. The impact of vegetative cover type on runoff and soil erosion under different land uses. Catena 2010, 81, 97–103. [Google Scholar] [CrossRef]
  56. Wang, L.; Zhang, F.; Fu, S.; Shi, X.; Chen, Y.; Jagirani, M.D.; Zeng, C. Assessment of soil erosion risk and its response to climate change in the mid-Yarlung Tsangpo River region. Environ. Sci. Pollut. Res. 2020, 27, 607–621. [Google Scholar] [CrossRef]
  57. Chen, P.; Czymzik, M.; Yu, Z.; Aldahan, A.; Wang, J.; Yi, P.; Hou, X.; Guo, S.; Zheng, M. Tendency of soil erosion dynamics by coupling radioisotopes and RUSLE model on the Southeastern Tibetan Plateau in response to climate warming and human activity. Catena 2023, 223, 106954. [Google Scholar] [CrossRef]
  58. Saco, P.M.; Willgoose, G.R.; Hancock, G.R. Eco-geomorphology of banded vegetation patterns in arid and semi-arid regions. Hydrol. Earth Syst. Sci. 2007, 11, 1717–1730. [Google Scholar] [CrossRef]
  59. Boer, M.; Puigdefábregas, J. Effects of spatially structured vegetation patterns on hillslope erosion in a semiarid Medi-terranean environment: A simulation study. Earth Surf. Process. Landf. 2005, 30, 149–167. [Google Scholar] [CrossRef]
  60. Jackson, R.B.; Jobbágy, E.G.; Avissar, R.; Roy, S.B.; Barrett, D.J.; Cook, C.W.; Farley, K.A.; le Maitre, D.C.; McCarl, B.A.; Murray, B.C. Trading Water for Carbon with Biological Carbon Sequestration. Science 2005, 310, 1944–1947. [Google Scholar] [CrossRef]
  61. Piao, S.; Wang, X.; Ciais, P.; Zhu, B.; Wang, T.; Liu, J. Changes in satellite-derived vegetation growth trend in temperate and boreal Eurasia from 1982 to 2006. Glob. Chang. Biol. 2011, 17, 3228–3239. [Google Scholar] [CrossRef]
  62. Sjursen, H.; Michelsen, A.; Holmstrup, M. Effects of freeze–thaw cycles on microarthropods and nutrient availability in a sub-Arctic soil. Appl. Soil Ecol. 2005, 28, 79–93. [Google Scholar] [CrossRef]
  63. Bryan, R.B. Soil erodibility and processes of water erosion on hillslope. Geomorphology 2000, 32, 385–415. [Google Scholar] [CrossRef]
  64. Hallet, B. A theoretical model of glacial abrasion. J. Glaciol. 1979, 23, 39–50. [Google Scholar]
  65. Cook, S.J.; Swift, D.A.; Kirkbride, M.P.; Knight, P.G.; Waller, R.I. The empirical basis for modelling glacial erosion rates. Nat. Commun. 2020, 11, 1–7. [Google Scholar] [CrossRef] [PubMed]
  66. Yao, P.; Wang, J.; Harbor, J.M.; Wang, F.; Zou, L.; Wang, W.; Chen, X. The relative efficiency and influence of glacial and fluvial erosion on Tibetan Plateau landscapes. Geomorphology 2020, 352, 106988. [Google Scholar] [CrossRef]
  67. Rajbanshi, J.; Bhattacharya, S. Assessment of soil erosion, sediment yield and basin specific controlling factors using RUSLE-SDR and PLSR approach in Konar river basin, India. J. Hydrol. 2020, 587, 124935. [Google Scholar] [CrossRef]
  68. Lu, H.; Moran, C.; Prosser, I.P. Modelling sediment delivery ratio over the Murray Darling Basin. Environ. Model. Softw. 2006, 21, 1297–1308. [Google Scholar] [CrossRef]
  69. Diodato, N.; Grauso, S. An improved correlation model for sediment delivery ratio assessment. Environ. Earth Sci. 2009, 59, 223–231. [Google Scholar] [CrossRef]
  70. Mchugh, M.; Wood, G.; Walling, D.; Morgan, R.; Zhang, Y.; Anthony, S.; Hutchins, M. Prediction of Sediment Delivery to Watercourses from Land; National Soil Resources Institute, Cranfield University: Bedford, UK, 2002. [Google Scholar]
  71. Borselli, L.; Cassi, P.; Torri, D. Prolegomena to sediment and flow connectivity in the landscape: A GIS and field numerical assessment. Catena 2008, 75, 268–277. [Google Scholar] [CrossRef]
  72. Amundson, R.; Berhe, A.A.; Hopmans, J.W.; Olson, C.; Sztein, A.E.; Sparks, D.L. Soil science. Soil and human security in the 21st century. Science 2015, 348, 1261071. [Google Scholar] [CrossRef]
  73. Ollesch, G.; Kistner, I.; Meissner, R.; Lindenschmidt, K.-E. Modelling of snowmelt erosion and sediment yield in a small low-mountain catchment in Germany. Catena 2006, 68, 161–176. [Google Scholar] [CrossRef]
  74. Sun, W.; Wang, Y.; Fu, Y.H.; Xue, B.; Wang, G.; Yu, J.; Zuo, D.; Xu, Z. Spatial heterogeneity of changes in vegetation growth and their driving forces based on satellite observations of the Yarlung Zangbo River Basin in the Tibetan Plateau. J. Hydrol. 2019, 574, 324–332. [Google Scholar] [CrossRef]
Figure 1. (a) Location and meteorological stations, (b) topography and hydrological stations, (c) land use, (d) soil type, and (e) NDVI of UHRB.
Sustainability 15 03220 g001
Figure 2. Flow chart of the methodology of this study.
Sustainability 15 03220 g002
Figure 3. (a) Variability of monthly precipitation, mean air temperature, NDVI, and (b) base flow, glacier runoff, snowmelt runoff, rainfall runoff, and total runoff during the frozen period (November to March), snowmelt period (April and May), and rainfall period (June to October).
Sustainability 15 03220 g003
Figure 4. Trended and detrended time series of annual precipitation (mm), air temperature (°C), and NDVI. Change trend of runoff and its components from runoff simulation with historical data (base case), runoff simulation with detrended precipitation (case1), and runoff simulation with detrended temperature (case2).
Sustainability 15 03220 g004
Figure 5. Simulated runoff in (a) BBRB during the calibration period (2000–2015) and validation period (1982–1999), (b) YNGRB (2012–2015), and (c) UHRB (2012–2015) compared with observations.
Sustainability 15 03220 g005
Figure 6. Simulated snow cover area in (a) BBRB; (b) YNGRB; (c) UHRB from 2000 to 2015 compared with MODIS data.
Sustainability 15 03220 g006
Figure 7. Relationship between the snowmelt-runoff erosivity and snowmelt runoff.
Sustainability 15 03220 g007
Figure 8. Mean values of (a) rainfall-runoff erosivity; (b) soil erodibility; (c) cover management; (d) slope length and gradient; (e) soil practice; and (f) soil erosion rate of UHRB with 100 m resolution from 1982 to 2015.
Sustainability 15 03220 g008
Figure 9. Rainfall erosivity and erosive precipitation, snowmelt runoff erosivity and snowmelt runoff, cover management factor, and NDVI during the rainfall period in (a) UHRB, (b) BBRB, and (c) YNGRB from 1982 to 2015.
Sustainability 15 03220 g009
Figure 10. Change trends of the soil erosion rate (annual (left Y axis), rainfall period (left Y axis), and snowmelt period (right Y axis)) in (a) UHRB, (b) BBRB, and (c) YNGRB.
Sustainability 15 03220 g010
Table 1. Description of hydrological stations in UHRB.
StationLongitude (°)Latitude (°)RiverAvailable RunoffAvailable Sediment Load
Qilian100.2538.18BBR1982–20152000–2015
Zhamashike90.9938.23YNGR2012–20152012–2015
Yingluoxia100.1138.76UHR2012–2015-
Table 2. Soil erosion statistics in UHRB.
GradeCriterion of Erosion Rate *, #Area (km2)Soil Loss (105t a−1)Soil Loss Percent (%)Area Percent below 4000 m (%)Area Percent above 4000 m (%)
Slight<5006893.53.84.876.323.7
Light500–25001930.623.930.172.227.8
Moderate2500–5000618.121.727.450.849.2
Severe5000–8000275.117.321.836.463.6
Very severe8000–15,000116.712.115.326.173.9
Extreme>15,0003.10.50.612.987.1
* SL190–2007 (Ministry of Water Resource of China, 2007). # Unit: t km−2 a−1.
Table 3. Detrended analysis of precipitation, air temperature, and NDVI.
CaseBasinChange in Soil Erosion Rate
AnnualRainfall PeriodSnowmelt Period
Detrended analysis of precipitationUHRB−11.2%−11.9%−4.00%
BBRB−12.9%−14.3%−6.50%
YNGRB−10.7%−11.2%−5.20%
Detrended analysis of temperatureUHRB7.20%4.80%30.7%
BBRB9.10%4.20%31.5%
YNGRB7.40%4.90%30.3%
Detrended analysis of NDVIUHRB11.7%11.8%10.7%
BBRB13.1%13.4%12.0%
YNGRB10.8%11.0%10.5%
Disclaimer/Publisher’s Note: The statements, opinions and data contained in all publications are solely those of the individual author(s) and contributor(s) and not of MDPI and/or the editor(s). MDPI and/or the editor(s) disclaim responsibility for any injury to people or property resulting from any ideas, methods, instructions or products referred to in the content.

