
Evolutionary Game Analysis of Resilient Community Construction Driven by Government Regulation and Market

Abstract
:1. Introduction
2. Literature Review
3. Evolutionary Game Model of Resilient Community Construction
3.1. Basic Assumptions
- (1)
- Local governments, developers, and buyers are the main players in the game, and all three are rational. Local governments can choose between regulatory and non-regulatory strategies, developers can build resilient communities or traditional communities, and consumers can buy resilient or traditional community housing. Furthermore, we assume that the likelihood of local government regulation is , the likelihood of non-regulation is , the likelihood of developers building resilient communities is , the likelihood of developers building traditional communities is , the likelihood of consumers buying resilient community housing is , and the likelihood of consumers buying traditional community housing is .
- (2)
- To encourage the construction and development of resilient communities in China, developers who choose to build those will be rewarded by local governments , while developers who choose to build traditional communities will be punished by local governments , where is the regulatory intensity of local governments. The local government will provide intensity subsidies to developers who choose to build resilient communities. The publicity of resilient communities is reflected in enhancing the public’s awareness of disaster reduction and prevention, among which the public’s awareness of disaster prevention and reduction is . When local governments regulate, they can obtain certain policy benefits directly indirectly or indirectly from the central government, and the cost of regulation is , whereas when local governments do not regulate, they must bear the economic and reputational losses caused by disasters or sudden accidents in the construction of traditional communities by developers , and the probability of disasters and accidents is .
- (3)
- Resilient communities can effectively improve community resilience and resilience to various disasters [39]. Developers who choose to build resilient communities can gain a certain brand benefit b while incurring an additional cost . To facilitate analysis, the cost of traditional community construction has been set to 0. When developers choose to build resilient communities, they may receive awards from local governments, while traditional communities may face penalties. Housing market demand is , and prices per unit in resilient and traditional communities are and . Pricing does not take into account other factors influencing housing prices, such as location and plot ratio, in order to focus on the core research theme.
- (4)
- According to the market-driven and consumer preference theory, awareness of disaster prevention and mitigation positively influences home buyers’ preference for resilient communities, which then drives home buyers to purchase resilient communities. As a result, the basic value obtained by purchasing housing is assumed to be , and the preferred income obtained by purchasing resilient community housing is assumed to be . When the government implements a regulatory strategy, consumers can reap indirect benefits. According to the current state of resilient community development, the emphasis on promoting the rapid development of resilient communities is that developers are willing to build them, and buyers prefer to purchase resilient community housing. We will assume that and in this case.
3.2. Model Construction
4. Stability and Evolution Path Analysis
- (1)
- When is less than the price of traditional community housing, the sum of the brand benefits brought by the developer’s decision to build a resilient community and the intensity of government regulation. Table 4 shows that the three eigenvalues of the equilibrium point E2 = (1, 0, 0) are all less than zero, indicating that when the condition is met, E2 = (1, 0, 0) is the stable point of system evolution.
- (2)
- When and . That is, the sum of brand revenue and government regulatory intensity is greater than the housing price of resilient communities, whereas the housing price of traditional communities is greater than the sum of basic housing value and resilience preference income. Table 4 shows that the three eigenvalues of the equilibrium point E6 = (1, 1, 0) are negative at this time. As a result, when and are satisfied, the stable point of system evolution is E6 = (1, 1, 0).
- (3)
- When is met, the cost of traditional community housing is less than the sum of the housing’s basic value and the preferred return. Table 4 shows that the three characteristic values of the equilibrium point E8 = (1, 1, 1) are all less than zero, indicating that when is reached, E8 = (1, 1, 1) is the stable point of system evolution. This evolutionary stability point is an ideal state that governments strive for.
5. Simulation Analysis and Results
5.1. Equilibrium Point Stability Test
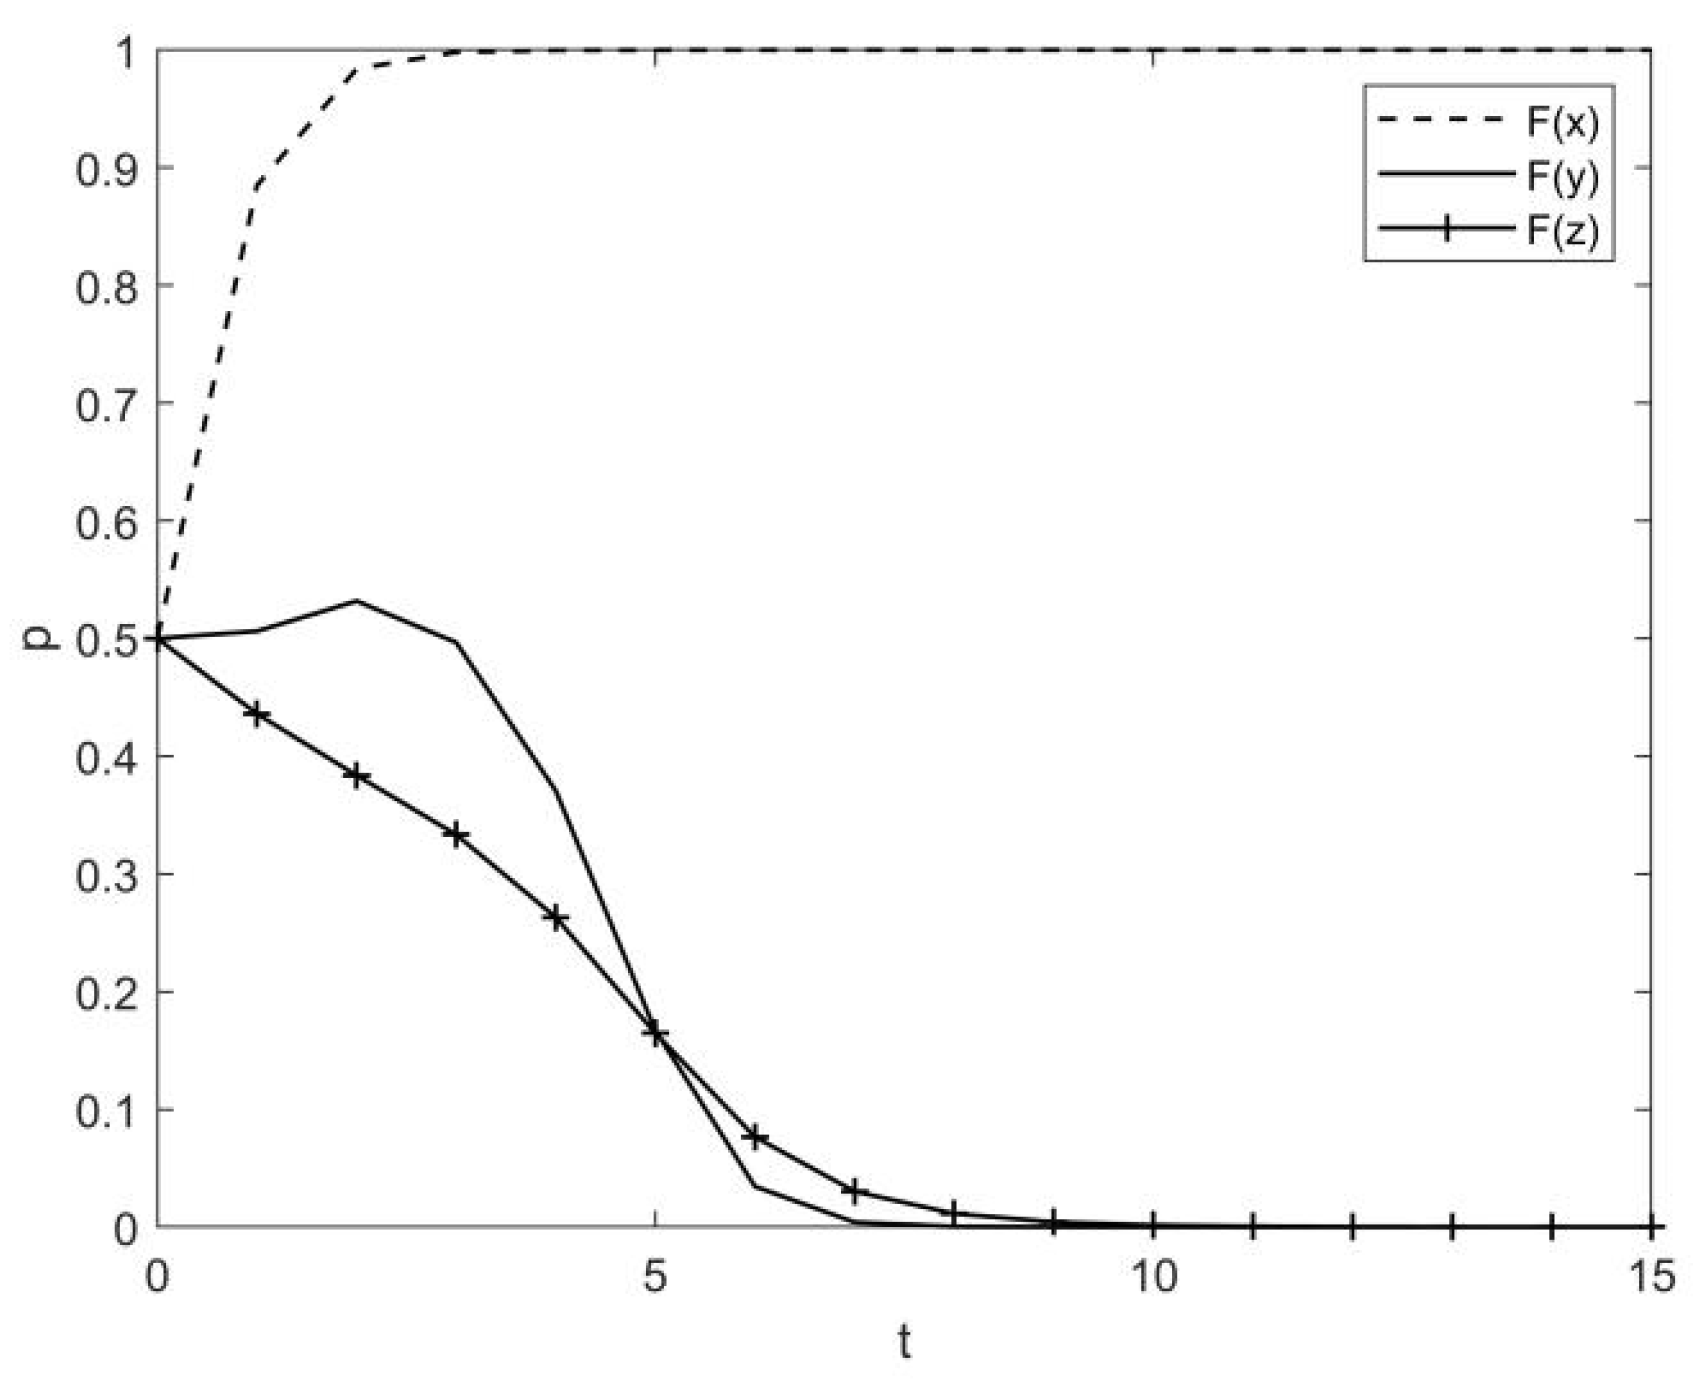
- (1)
- Stability strategy 1 (1, 0, 0). That is, local governments choose to regulate, developers choose to build traditional communities, and buyers choose to purchase traditional community housing, corresponding to the initial stage of resilient community development. At this time, local governments are the main body, and the willingness of developers to build resilient communities and buyers to buy resilient community housing is not obvious. The relevant legal system and documents are not perfect in the early stages of resilient community development, the government’s regulatory intensity is not high, and the construction of traditional communities brings greater benefits to developers. Buyers are more likely to purchase traditional community housing because they have a low awareness of risk prevention and do not recognize the benefits of resilient communities over traditional communities.
- (2)
- Stability strategy 2 (1, 1, 0). That is, local governments choose to regulate, developers choose to build resilient communities, and buyers choose to buy traditional community housing, corresponding to the transitional stage of resilient community development. At this time, the government and developers are the main body, and the willingness of buyers to buy resilient community housing is not obvious. During the transitional stage of resilient community development, relevant laws and documents are gradually improved, and local governments’ regulatory intensity is gradually increased. Moreover, because developers understand that building resilient communities can result in greater brand benefits, they tend to build resilient communities. Because the government does not recognize the importance of increasing consumer awareness of disaster prevention and mitigation for the development of resilient communities, traditional housing provides greater benefits to consumers, making them less willing to purchase resilient housing.
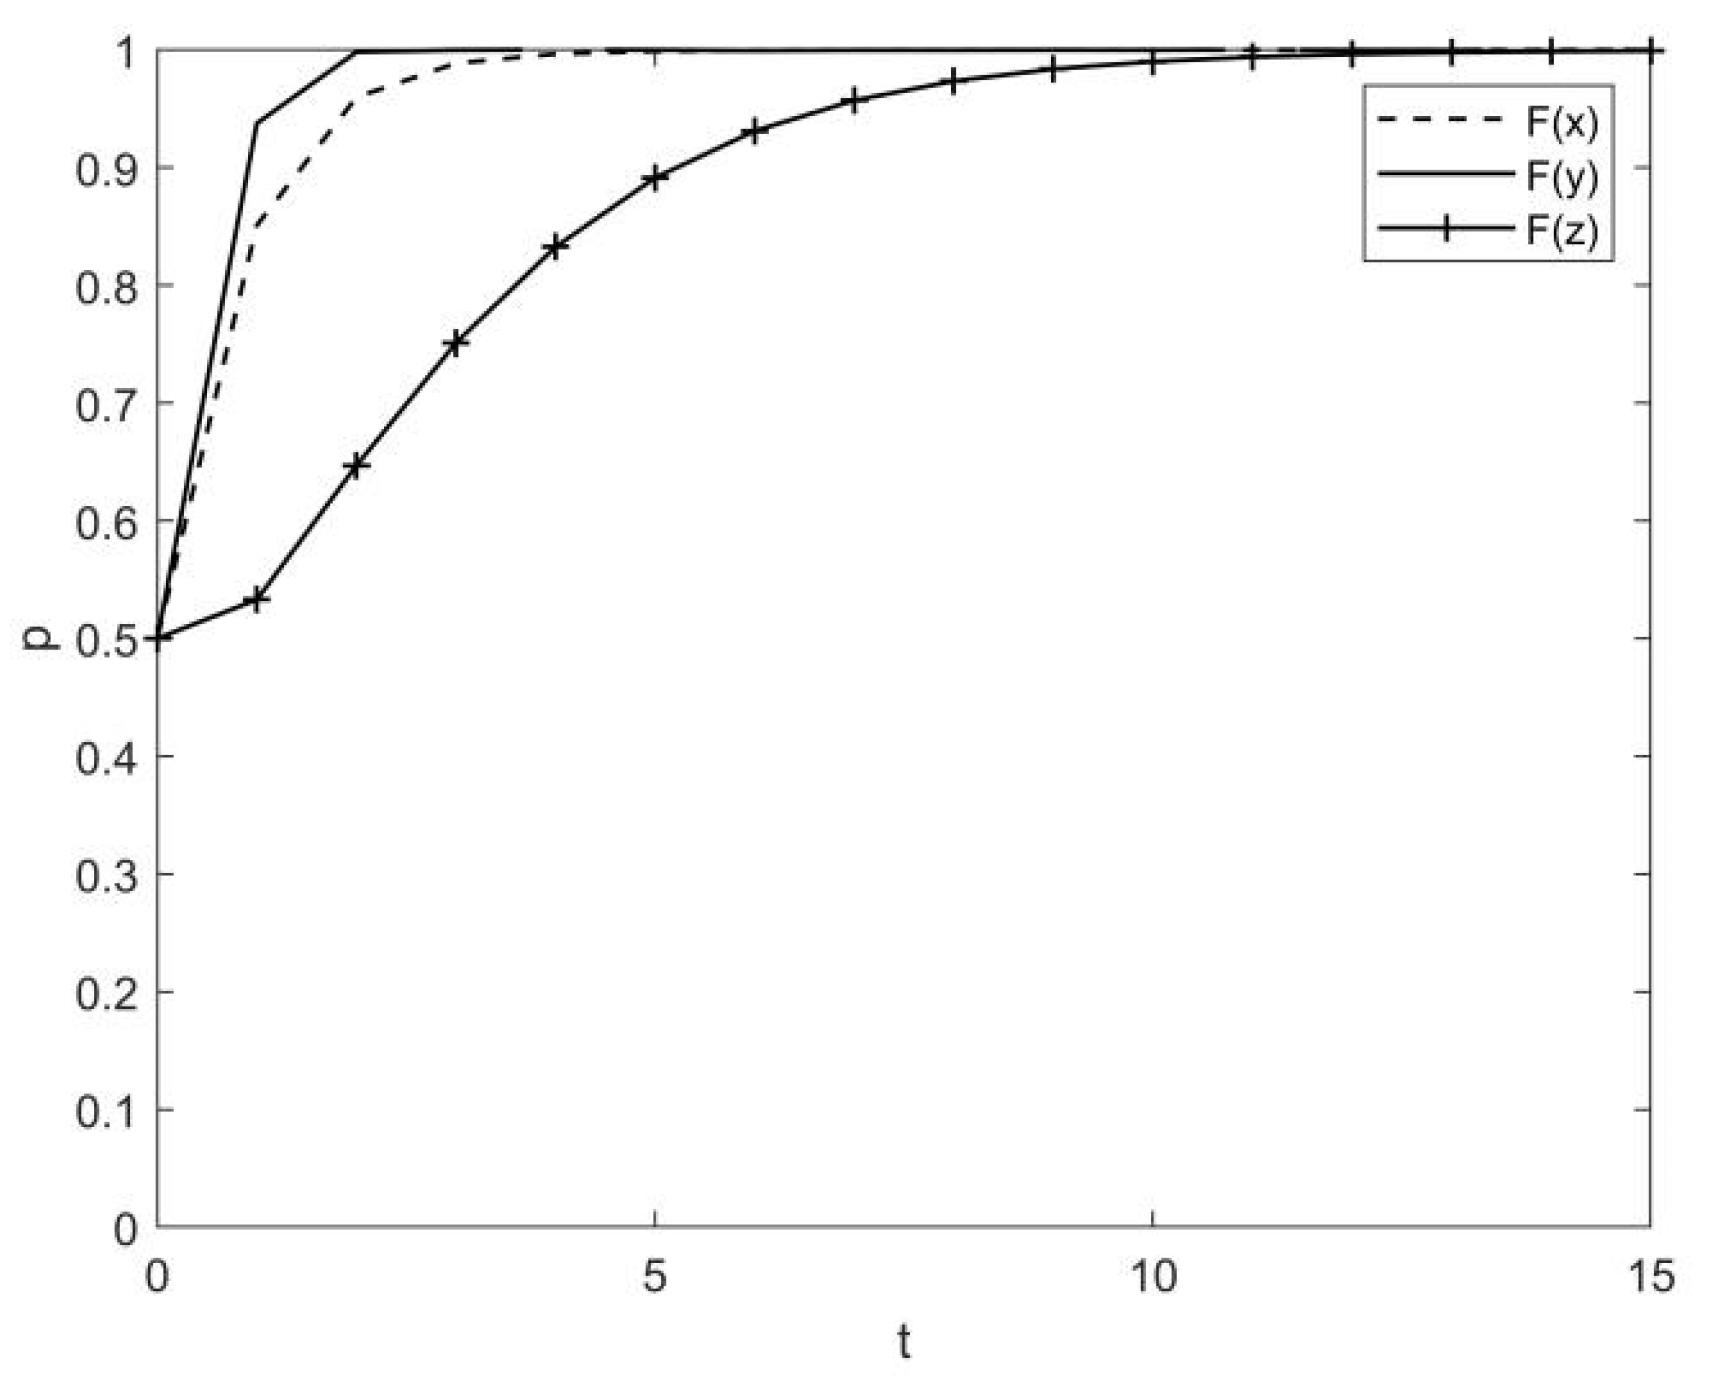
- (3)
- Stability strategy 3 (1, 1, 1). That is, local governments prefer regulatory strategies, developers select to build resilient communities, and buyers choose to purchase resilient community housing, corresponding to the mature stage of resilient community development. The main body at this point is made up of developers and home buyers. In the mature stage of resilient community development, relevant laws and documents are basically perfect, and the government’s regulatory intensity has increased. In resilient community development, local governments realize the importance of increasing consumer participation for it. Starting with increasing consumer awareness of disaster prevention and mitigation and capacity training, we will innovate original publicity and education methods using modern science and technology such as the Internet, implement a more comprehensive and systematic training and education system to increase consumer awareness of disaster prevention and mitigation, as well as to guide consumers in their participation in the development of resilient communities.
5.2. Impact of Initial Willingness to Share
5.3. Influence of Main Parameters on the Evolution Path of Local Governments
5.4. The Influence of Main Parameters on the Evolution Path of Developers
5.5. The Influence of Main Parameters on the Evolution Path of Home Buyers
6. Discussion
7. Conclusions
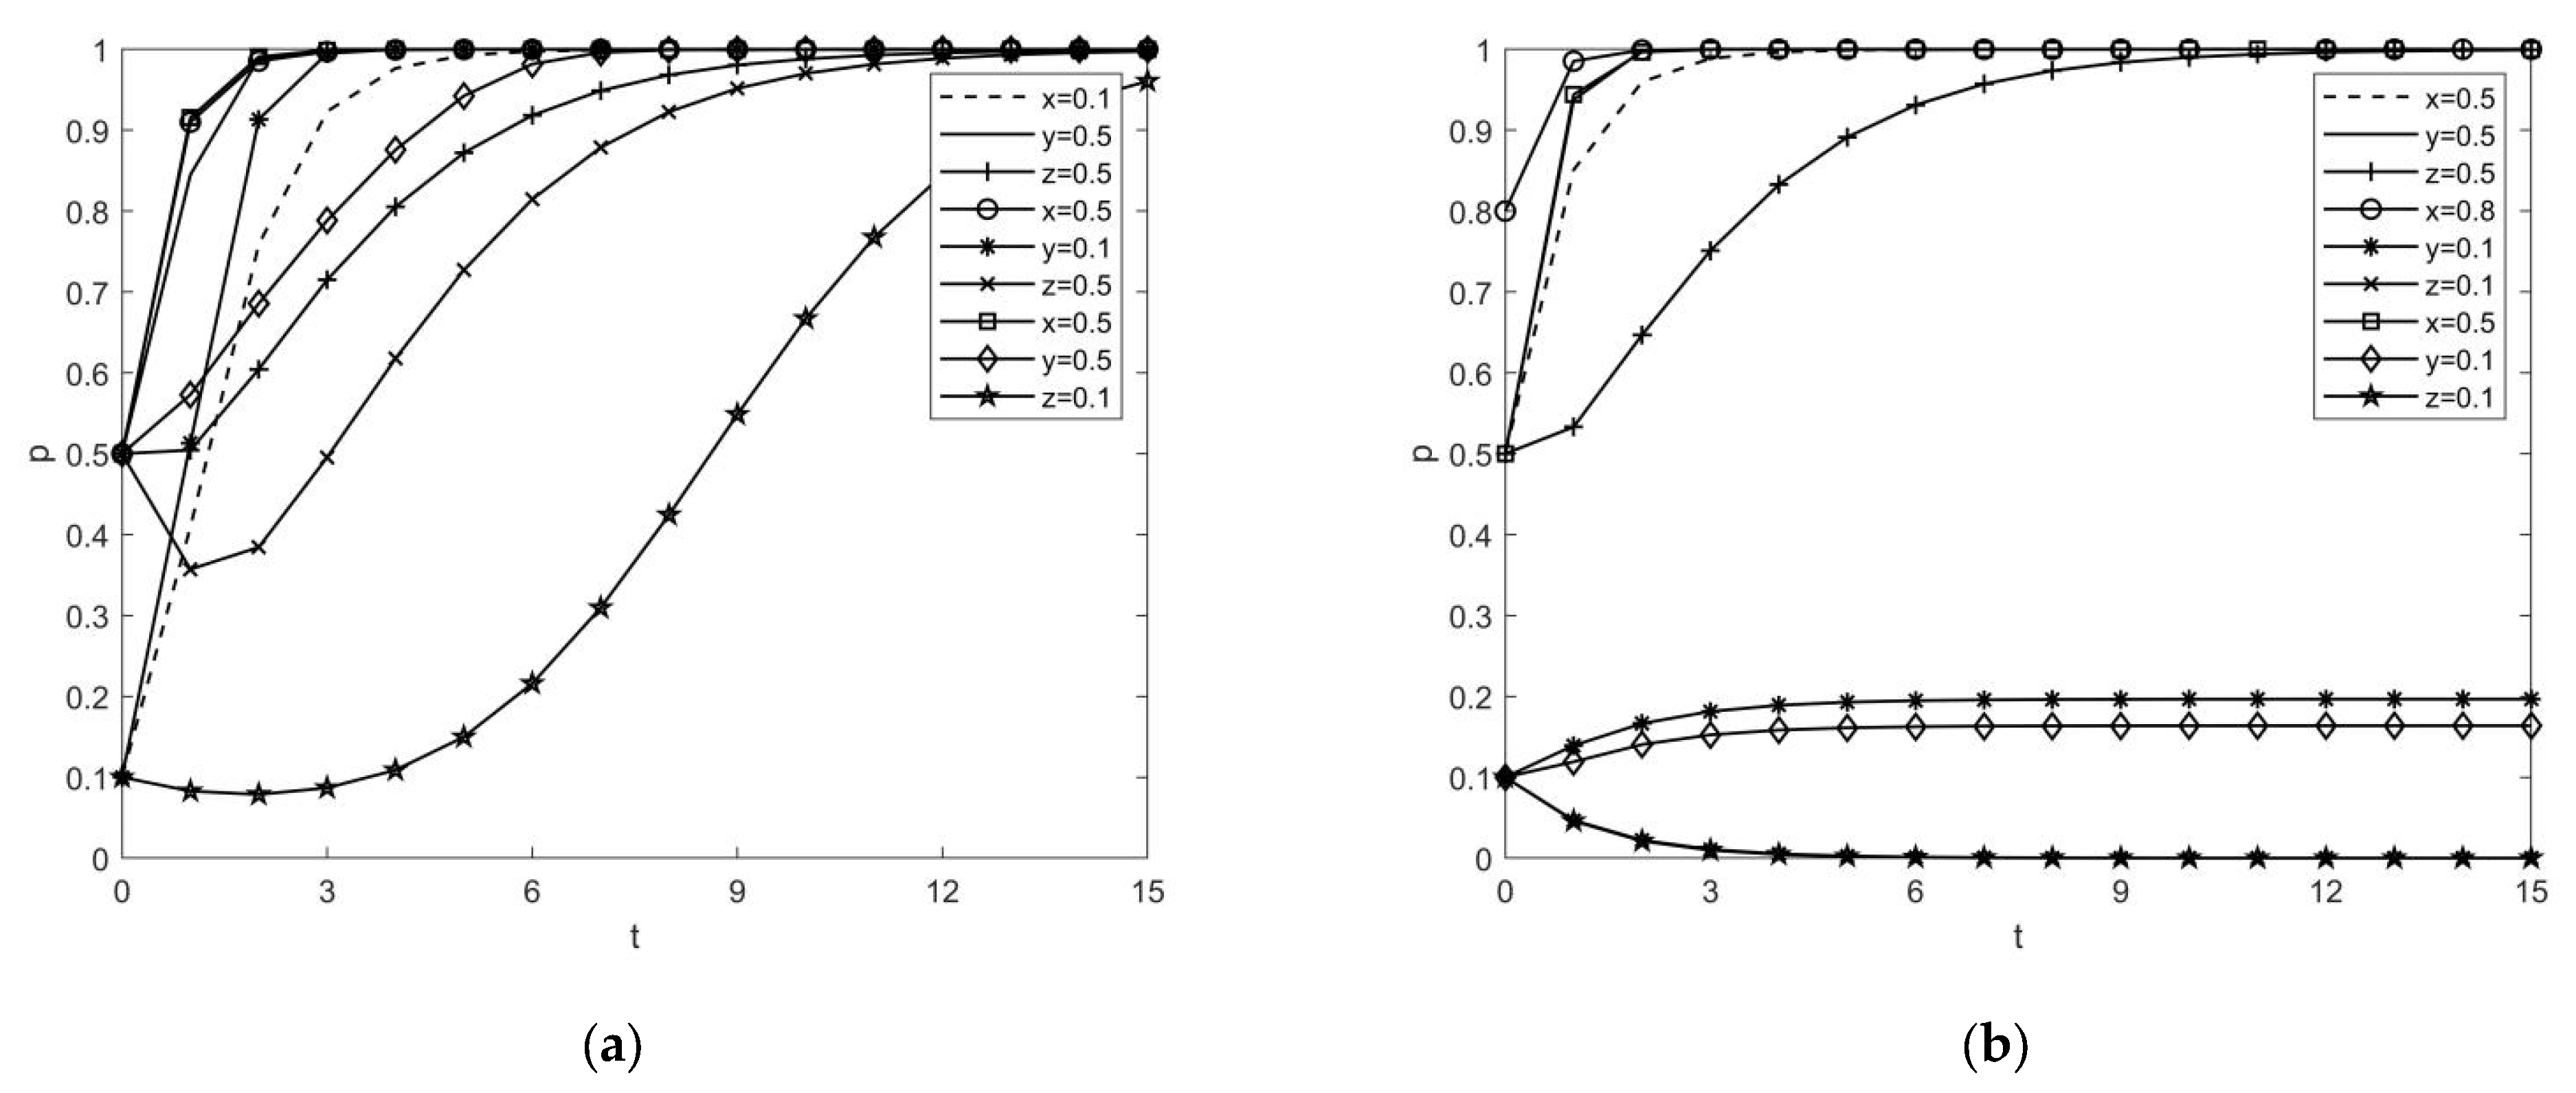
- (1)
- Different initial intentions of local governments, developers, and buyers will have different outcomes. High initial intention has no effect on the system’s final evolution result, but it does affect the speed with which game players reach the evolutionary stability strategy. When developers and buyers’ initial willingness is low, regardless of whether the government regulates or not, they will choose to build and purchase traditional housing. Creating disaster reduction demonstration communities, raising public awareness of disaster prevention and mitigation, and then guiding resilience preferences and forming market drivers is an effective way to increase developers’ and home buyers’ willingness to invest.
- (2)
- The greater the policy benefits, the easier it is for local governments to select regulatory strategies. Increased regulatory costs will influence local governments’ regulatory strategies, and when regulatory costs exceed a certain threshold, local governments are more likely to pursue unregulated strategies. Regulatory costs have a greater impact on the evolution path of local governments than policy benefits.
- (3)
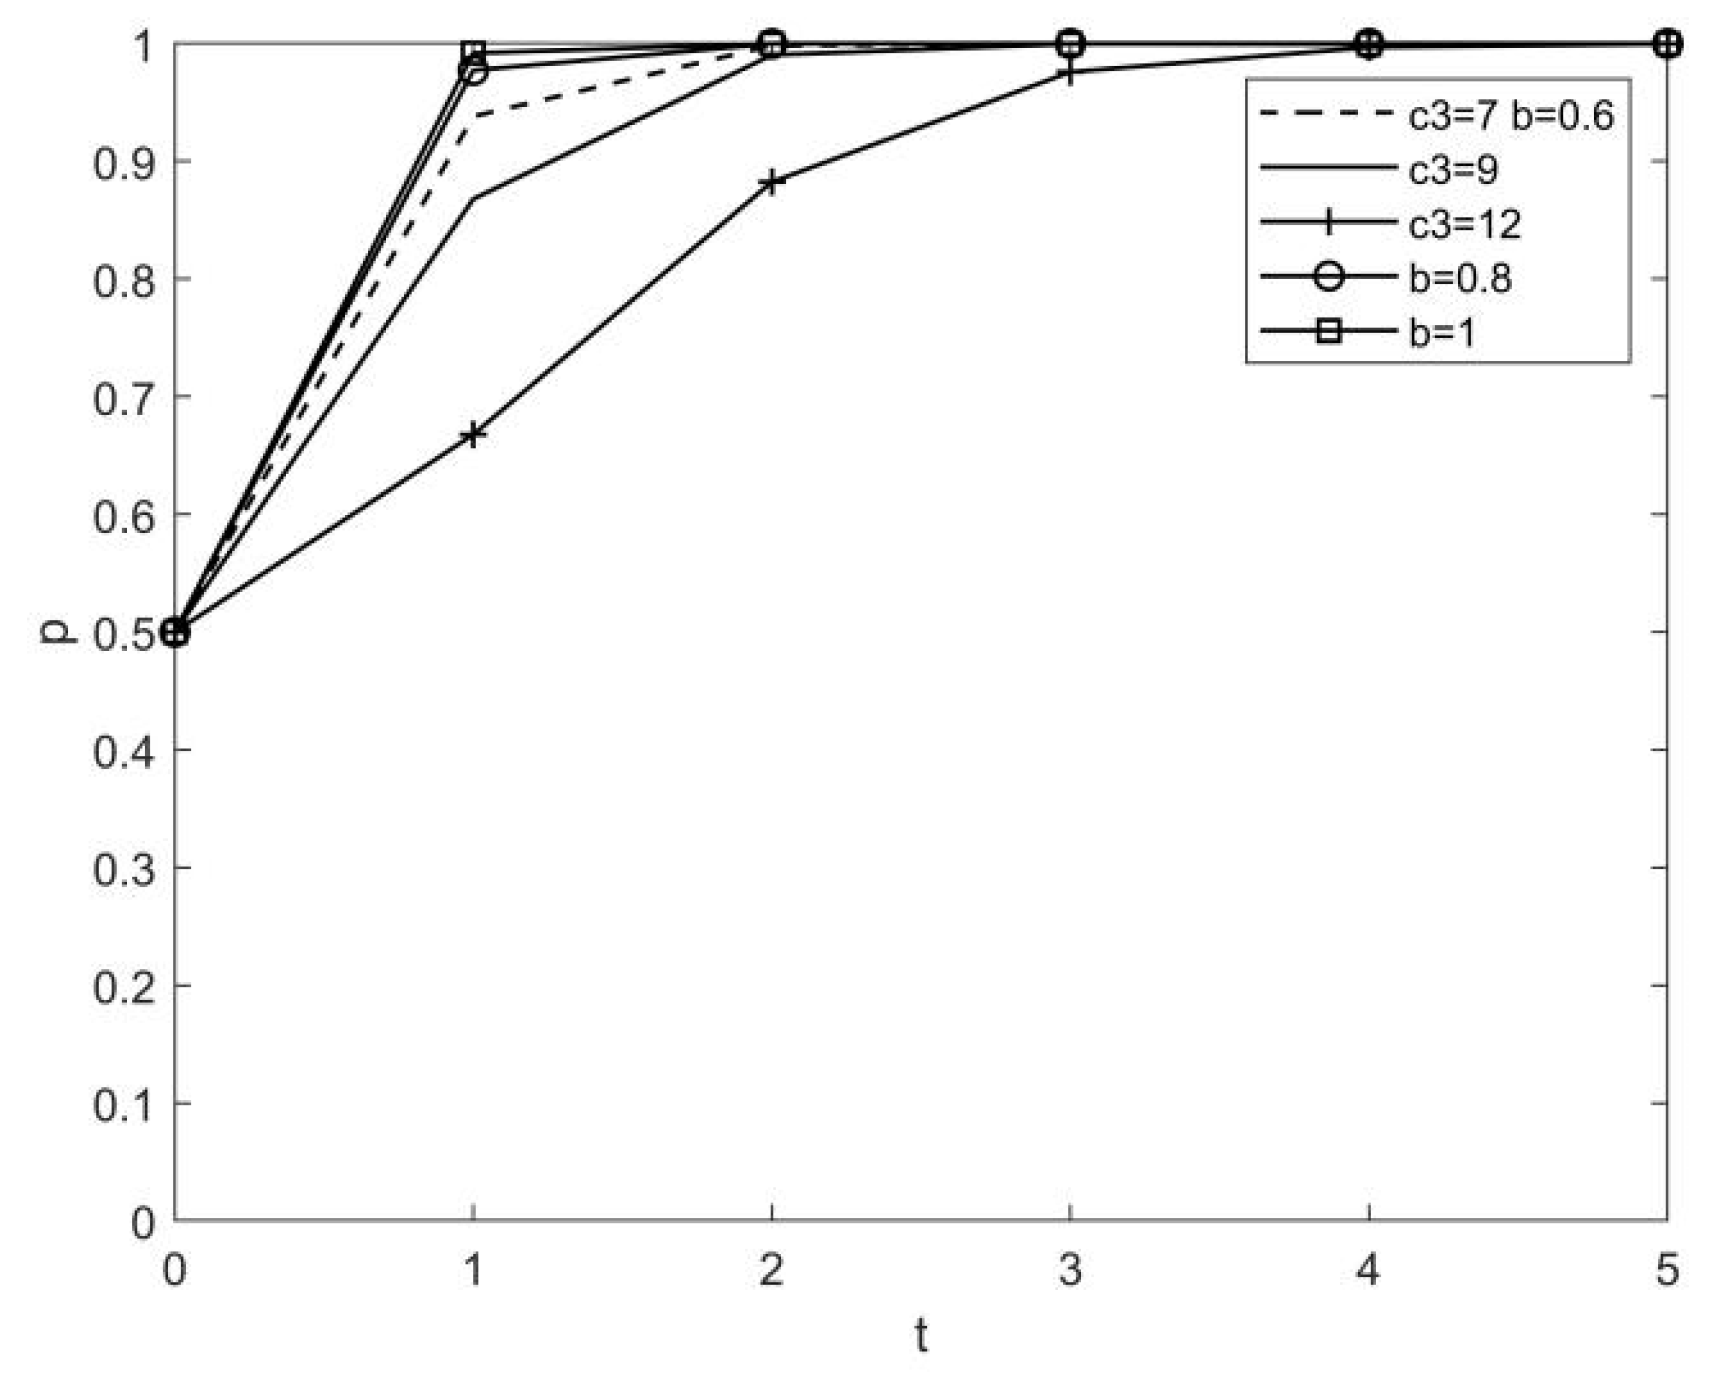
- Local governments should regulate and subsidize the development of resilient communities. The greater the intensity of regulation and the greater the subsidy coefficient, the more eager developers are to build resilient communities. Furthermore, when compared to subsidies, the impact of regulation intensity on the evolution path of developers is greater. An increase in brand revenue may encourage developers to build resilient communities, whereas an increase in construction costs may deter developers from doing so. Construction costs have a greater impact on developers than regulatory intensity and subsidy coefficient.
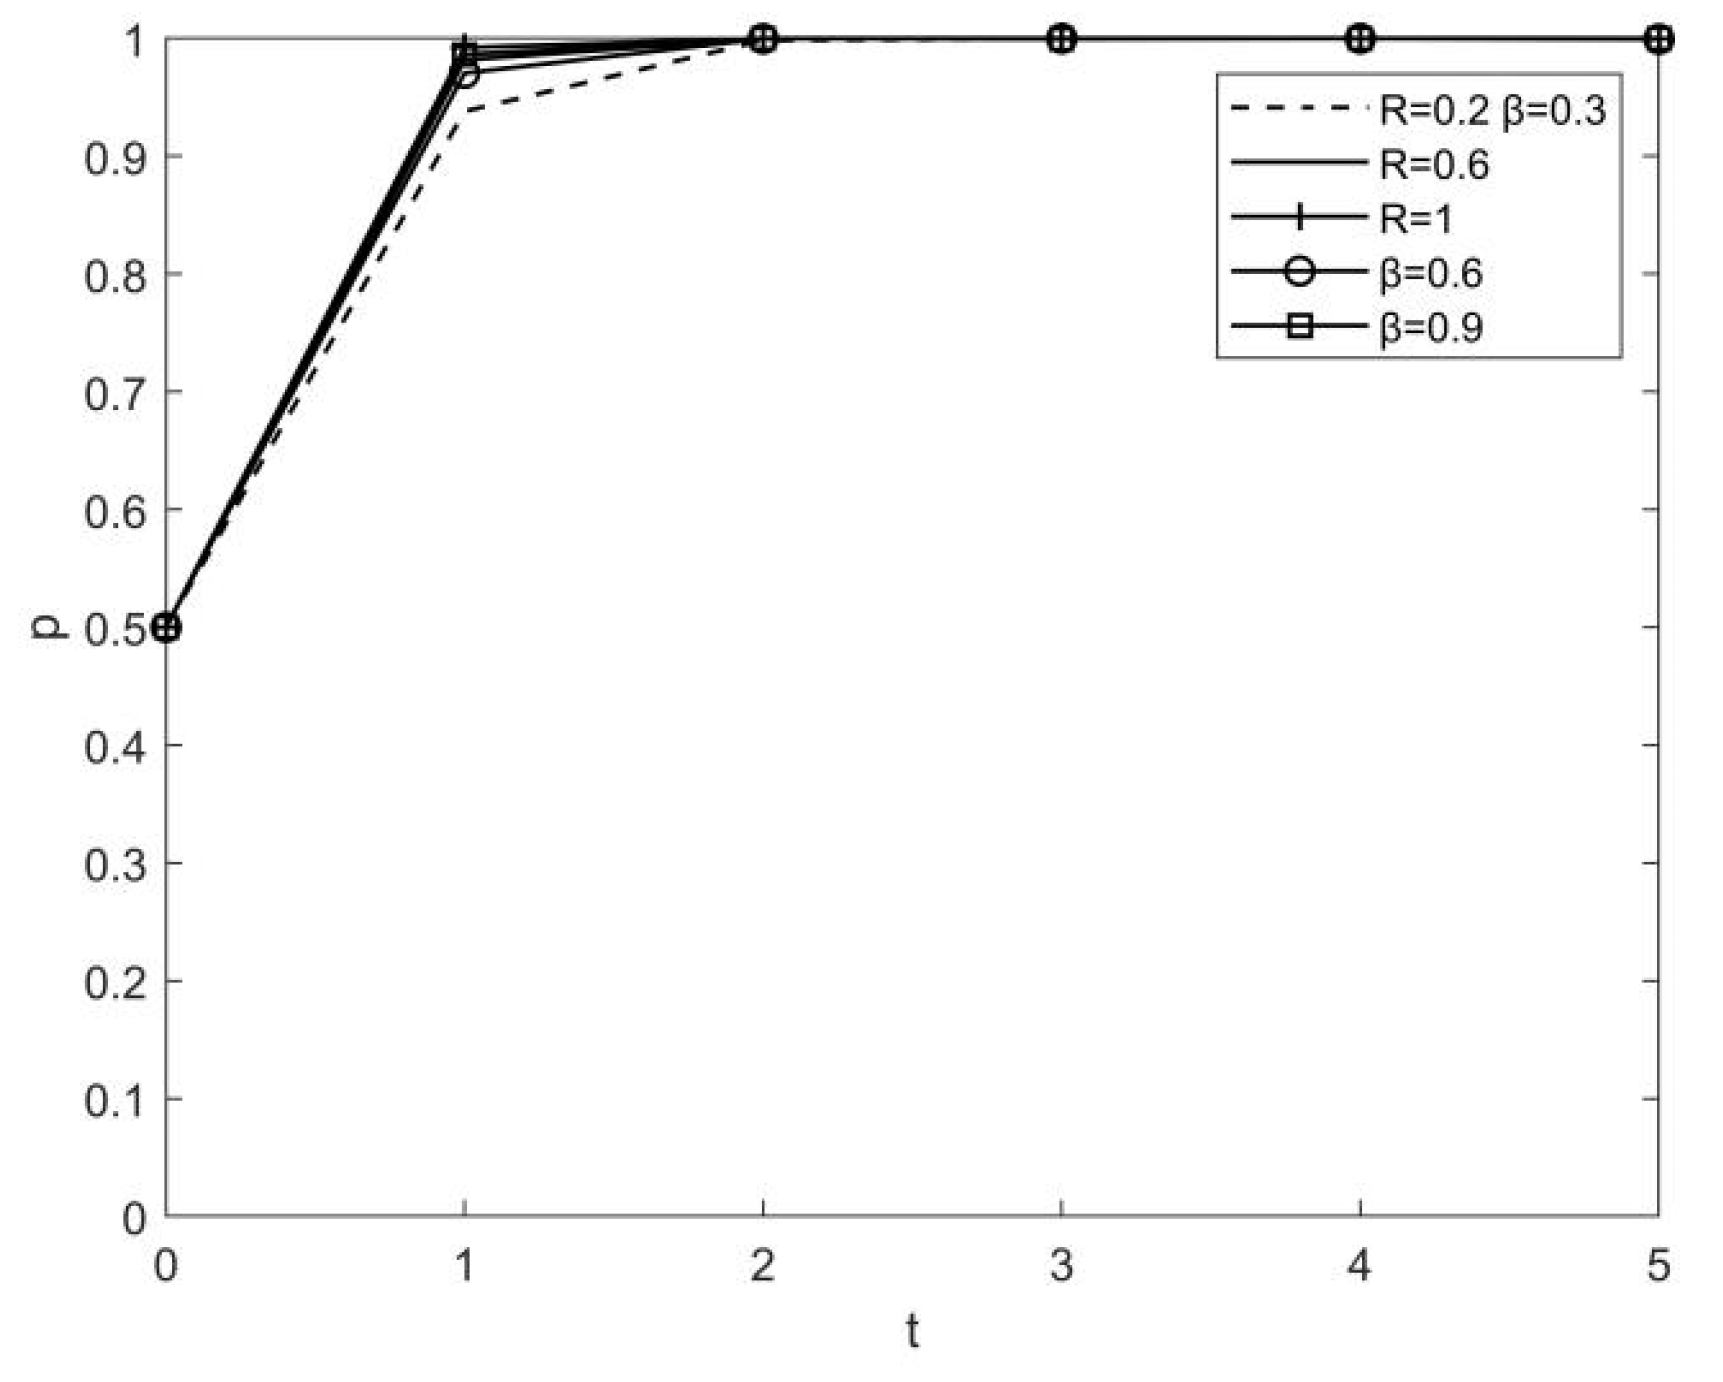
- (4)
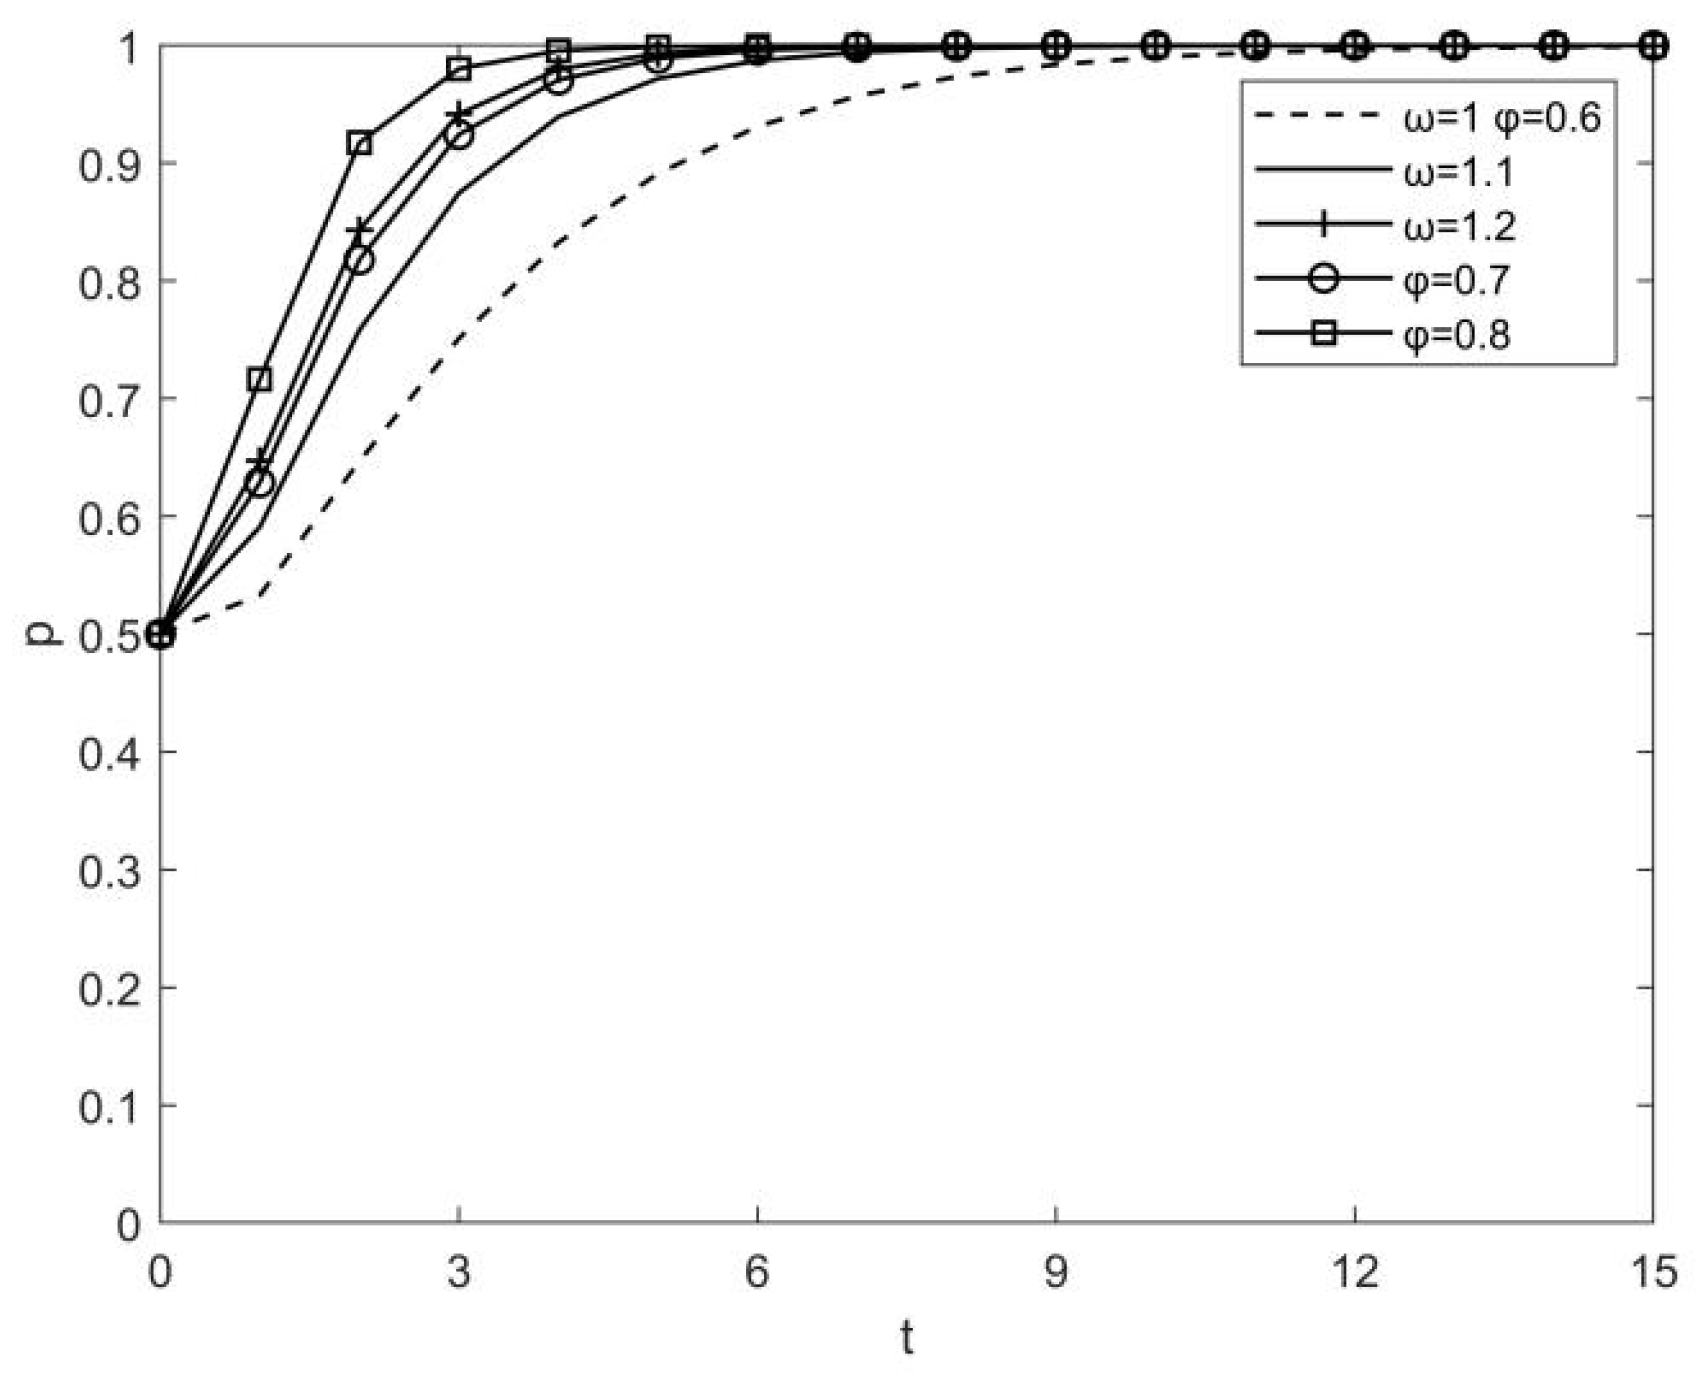
- The ultimate evolutionary stabilization strategy of home buyers remains the same as traditional community housing prices, resilience preference gains, and awareness of disaster preparedness and mitigation increase, but the time to reach the evolutionary stabilization strategy becomes shorter. The rise in housing prices in resilient communities will have an effect on the system’s evolutionary stabilization strategy. When resilient community housing prices exceed a certain threshold, buyers switch from purchasing resilient housing strategies to purchasing traditional housing strategies.
Author Contributions
Funding
Institutional Review Board Statement
Informed Consent Statement
Data Availability Statement
Conflicts of Interest
References
- Global Disaster Data Platform. 2020 Global Natural Disaster Assessment Report Released; Ministry of Emergency Management-Academy of Disaster Reduction and Emergency Management of Ministry of Education: Beijing, China; National Disaster Reduction Center of Ministry of Emergency Management: Beijing, China; Information Research Institute of Ministry of Emergency Management: Beijing, China, 2021.
- Global Disaster Data Platform. 2021 Global Natural Disaster Assessment Report Released; Ministry of Emergency Management-Academy of Disaster Reduction and Emergency Management of Ministry of Education: Beijing, China; National Disaster Reduction Center of Ministry of Emergency Management: Beijing, China; Information Research Institute of Ministry of Emergency Management: Beijing, China, 2022.
- Fang, Y.M.; Zhou, W.Y. Optimization of community mobilization mechanism from the perspective of resilient city construction. J. Party Sch. Fujian Prov. Comm. Communist Party China Fujian Adm. Coll. 2020, 142–151. (In Chinese) [Google Scholar] [CrossRef]
- Cui, P.; Li, D. A SNA-based methodology for measuring the community resilience from the perspective of social capitals: Take Nanjing, China as an example. Sustain. Cities Soc. 2020, 53, 101880. [Google Scholar] [CrossRef]
- Lu, H.; Lu, X.; Jiao, L.; Zhang, Y. Evaluating urban agglomeration resilience to disaster in the Yangtze Delta city group in China. Sustain. Cities Soc. 2022, 76, 103464. [Google Scholar] [CrossRef]
- Büyüközkan, G.; Ilıcak, Ö.; Feyzioğlu, O. A review of urban resilience literature. Sustain. Cities Soc. 2022, 77, 103579. [Google Scholar] [CrossRef]
- Zhao, R.D.; Fang, C.L.; Liu, J.; Zhang, L.F. The evaluation and obstacle analysis of urban resilience from the multidimensional perspective in Chinese cities. Sustain. Cities Soc. 2022, 86, 104160. [Google Scholar] [CrossRef]
- Rezvani, S.M.H.S.; de Almeida, N.M.; Falcão, M.J.; Duarte, M. Enhancing urban resilience evaluation systems through automated rational and consistent decision-making simulations. Sustain. Cities Soc. 2022, 78, 103612. [Google Scholar] [CrossRef]
- Suleimany, M.; Mokhtarzadeh, S.; Sharifi, A. Community resilience to pandemics: An assessment framework developed based on the review of COVID-19 literature. Int. J. Disaster Risk Reduct. 2022, 80, 103248. [Google Scholar] [CrossRef]
- Bruneau, M.; Chang, S.E.; Eguchi, R.T.; Lee, G.C.; O’Rourke, T.D.; Reinhorn, A.M.; Shinozuka, M.; Tierney, K.; Wallace, W.A.; Winterfeldt, D.V. A Framework to Quantitatively Assess and Enhance the Seismic Resilience of Communities. Earthq. Spectra 2003, 19, 733–752. [Google Scholar] [CrossRef]
- Peacock, W.G.; Brody, S.D.; Seitzwa, W.A.; Merrell, W.J.; Vedlitz, A.; Zahran, S.; Harriss, R.C.; Stickney, R.R. Advancing Resilience of Coastal Localities: Developing Implementina and Sustainina the Use of Coastal Resilience Indicators: A Final Report; Hazard Reduction and Recovery Center: College Station, TX, USA, 2010. [Google Scholar]
- Sharifi, A. A critical review of selected tools for assessing community resilience. Ecol. Indic. 2016, 69, 629–647. [Google Scholar] [CrossRef]
- Cutter, S.L.; Burton, C.G.; Enrich, C.T. Disaster resilience indicators for bench marking baseline conditions. J. Homel. Secur. Emerg. Manag. 2010, 7, 23–25. [Google Scholar]
- Chen, H.X.; Guo, F.Z. The spatiotemporal evolution pattern of urban resilience in the Yangtze River Delta Urban Agglomeration based on TOPSIS-PSO-ELM. Sustain. Cities Soc. 2022, 87, 104223. [Google Scholar]
- Norris, F.H.; Stevens, S.P.; Pfefferbaum, B.; Wyche, K.F.; Pfefferbaum, R.L. Community Resilience as a Metaphor, Theory, Set of Capacities, and Strategy for Disaster Readiness. Am. J. Commun. Psychol. 2008, 41, 127–150. [Google Scholar] [CrossRef]
- Magis, K. Community resilience: An indicator of social sustainability. Soc. Nat. Resour. 2010, 23, 401–416. [Google Scholar] [CrossRef]
- Berkes, F.; Ross, H. Community resilience: Toward an integrated approach. Soc. Nat. Resour. 2013, 26, 5–20. [Google Scholar] [CrossRef]
- Zhang, W.; Chen, Q.W.; Zhu, Y.J.; Ma, H. Model study on influencing factors of community resilience under the background of major public health events. J. Pub. Manag. 2022, 19, 96–109+172. (In Chinese) [Google Scholar]
- Nowak, M.A.; Sigmund, K. Evolutionary dynamics of biological games. Science 2004, 303, 793–799. [Google Scholar] [CrossRef]
- Wang, J.; Hu, Y.; Qu, W.; Ma, L.X. Research on Emergency Supply Chain Collaboration Based on Tripartite Evolutionary Game. Sustainability 2022, 14, 11893. [Google Scholar] [CrossRef]
- Rendon, C.; Osman, K.K.; Faust, K.M. Path towards community resilience: Examining stakeholders’ coordination at the intersection of the built, natural, and social systems. Sustain. Cities Soc. 2021, 68, 102774. [Google Scholar] [CrossRef]
- Yuan, M.; Li, Z.; Li, X.; Li, L.; Zhang, S.X.; Luo, X.W. How to promote the sustainable development of prefabricated residential buildings in China: A tripartite evolutionary game analysis. J. Clean. Prod. 2022, 349, 131423. [Google Scholar] [CrossRef]
- Li, X.; Wang, C.; Alashwal, A.; Bora, S. Game analysis on prefabricated building evolution based on dynamic revenue risks in China. J. Clean. Prod. 2020, 267, 121730. [Google Scholar] [CrossRef]
- Meng, L.; Liu, K.; He, J.; Han, C.F.; Liu, P.H. Carbon emission reduction behavior strategies in the shipping industry under government regulation: A tripartite evolutionary game analysis. J. Clean. Prod. 2022, 378, 134556. [Google Scholar] [CrossRef]
- Cao, Y.M.; Kang, Z.Q.; Bai, J.D.; Cui, Y.; Chang, I.S.; Wu, J. How to build an efficient blue carbon trading market in China?—A study based on evolutionary game theory. J. Clean. Prod. 2022, 367, 132867. [Google Scholar] [CrossRef]
- Xue, Y.N.; Luan, W.X.; Yang, Y.J.; Wang, H. Evolutionary game for the stakeholders in livestock pollution control based on circular economy. J. Clean. Prod. 2021, 282, 125403. [Google Scholar]
- Li, F.; Cao, X.; Sheng, P. Impact of pollution-related punitive measures on the adoption of cleaner production technology: Simulation based on an evolutionary game mode. J. Clean. Prod. 2022, 339, 130703. [Google Scholar] [CrossRef]
- Sun, H.; Wan, Y.; Zhang, L.; Zhou, Z. Evolutionary game of the green investment in a two-echelon supply chain under a government subsidy mechanism. J. Clean. Prod. 2019, 235, 1315–1326. [Google Scholar] [CrossRef]
- Tian, Y.; Govindan, K.; Zhu, Q. A system dynamics model based on evolutionary game theory for green supply chain management diffusion among Chinese manufacturers. J. Clean. Prod. 2014, 80, 96–105. [Google Scholar] [CrossRef]
- Kang, K.; Zhao, Y.; Zhang, J.; Qiang, C. Evolutionary game theoretic analysis on low-carbon strategy for supply chain enterprises. J. Clean. Prod. 2019, 230, 981–994. [Google Scholar] [CrossRef]
- Sun, X.; Wang, W.; Pang, J.; Liu, X.X.; Zhang, M. Study on the evolutionary game of central government and local governments under central environmental supervision system. J. Clean. Prod. 2021, 296, 126574. [Google Scholar] [CrossRef]
- Sheng, J.; Zhou, W.; Zhu, B. The coordination of stakeholder interests in environmental regulation: Lessons from China’s environmental regulation policies from the perspective of the evolutionary game theory. J. Clean. Prod. 2020, 249, 119385. [Google Scholar] [CrossRef]
- Guo, H.L. Research on Incentive Mechanism of Sponge Community Construction. Master’s Thesis, Huazhong University of Science and Technology, Wuhan, China, 2019. (In Chinese). [Google Scholar]
- Chen, Y.; Zhu, D.; Zhou, L. A game theory analysis of promoting the spongy city construction at the building and community scale. Habitat Int. 2019, 86, 91–100. [Google Scholar] [CrossRef]
- Yang, X.; Zhang, J.; Shen, G.Q.; Yan, Y.Y. Incentives for green retrofits: An evolutionary game analysis on Public-Private-Partnership reconstruction of buildings. J. Clean. Prod. 2019, 232, 1076–1092. [Google Scholar] [CrossRef]
- Feng, Q.; Chen, H.; Shi, X.; Wei, J. Stakeholder games in the evolution and development of green buildings in China: Government-led perspective. J. Clean. Prod. 2020, 275, 122895. [Google Scholar] [CrossRef]
- Lu, W.; Du, L.; Tam, V.W.Y.; Yang, Z.; Lin, C.R.; Peng, C. Evolutionary game strategy of stakeholders under the sustainable and innovative business model: A case study of green building. J. Clean. Prod. 2022, 333, 130136. [Google Scholar] [CrossRef]
- Chen, L.; Gao, X.; Hua, C.; Gong, S.T.; Yue, A.B. Evolutionary process of promoting green building technologies adoption in China: A perspective of government. J. Clean. Prod. 2021, 279, 123607. [Google Scholar] [CrossRef]
- Challet, D.; Zhang, Y.C. Emergence of cooperation and organization in an evolutionary game. Physica A 1997, 246, 407–418. [Google Scholar] [CrossRef]
- Wang, T.; Li, C.; Yuan, Y.; Liu, J.; Adeleke, I.B. An evolutionary game approach for manufacturing service allocation management in cloud manufacturing. Comput. Ind. Eng. 2019, 133, 231–240. [Google Scholar] [CrossRef]
- Zare, H.; Tavana, M.; Mardani, A.; Masoudian, S.; Saraji, M.K. A hybrid data envelopment analysis and game theory model for performance measurement in healthcare. Health Care Manag. Sci. 2019, 22, 475–488. [Google Scholar] [CrossRef]
- Roca, C.P.; Cuesta, J.A.; Sánchez, A. Evolutionary game theory: Temporal and spatial effects beyond replicator dynamics. Phys. Life Rev. 2009, 6, 208–249. [Google Scholar] [CrossRef]
- Friedman, D. Evolutionary games in economics. J. Econom. 1991, 59, 637–666. [Google Scholar] [CrossRef]
- Smith, J.; Price, G.R. The logic of animal conflict. Nature 1973, 246, 15–18. [Google Scholar] [CrossRef]
- Smith, J.M. The theory of games and the evolution of animal conflicts. J. Theor. Biol. 1974, 47, 209–221. [Google Scholar] [CrossRef] [PubMed]
- Fu, H.; Liu, Y.; Cheng, P.; Cheng, S.J. Evolutionary Game Analysis on Innovation Behavior of Digital Financial Enterprises under the Dynamic Reward and Punishment Mechanism of Government. Sustainability 2022, 14, 12561. [Google Scholar] [CrossRef]
- Day, G.S. The product life cycle: Analysis and applications issues. J. Mark. Res. 1981, 45, 60–67. [Google Scholar] [CrossRef]


| Developers Build Resilient Communities(y) | |||
|---|---|---|---|
| Local Government | Developers | Home Buyers | |
| Home buyers purchase resilient community housing(z) | |||
| Home buyers purchase traditional community housing(1-z) | |||
| Developers build traditional communities(1-y) | |||
| Local government | Developers | Home buyers | |
| Home buyers purchase resilient community housing(z) | 0 | ||
| Home buyers purchase traditional community housing(1-z) | |||
| Developers Build Resilient Communities(y) | |||
|---|---|---|---|
| Local Government | Developers | Home Buyers | |
| Home buyers purchase resilient community housing(z) | 0 | ||
| Home buyers purchase traditional community housing(1-z) | 0 | 0 | |
| Developers build traditional communities(1-y) | |||
| Local government | Developers | Home buyers | |
| Home buyers purchase resilient community housing(z) | 0 | 0 | 0 |
| Home buyers purchase traditional community housing(1-z) | |||
| Equilibrium Point | Eigenvalue λ1 | Eigenvalue λ2 | Eigenvalue λ3 |
|---|---|---|---|
| (0, 0, 0) | |||
| (1, 0, 0) | |||
| (0, 1, 0) | |||
| (0, 0, 1) | |||
| (1, 0, 1) | |||
| (1, 1, 0) | |||
| (0, 1, 1) | |||
| (1, 1, 1) |
| Equilibrium Point | Case 1 | Case 2 | Case 3 | |||||||||
|---|---|---|---|---|---|---|---|---|---|---|---|---|
| λ1 | λ2 | λ3 | Stability | λ1 | λ2 | λ3 | Stability | λ1 | λ2 | λ3 | Stability | |
| (0, 0, 0) | + | ± | − | Unstable point | + | ± | − | Unstable point | + | ± | − | Unstable point |
| (1, 0, 0) | − | − | − | ESS | − | + | − | Unstable point | − | ± | − | Unstable point |
| (0, 1, 0) | + | − | ± | Unstable point | + | ± | − | Unstable point | + | ± | + | Unstable point |
| (0, 0, 1) | + | + | + | Saddle point | + | + | + | Saddle point | + | + | + | Saddle point |
| (1, 0, 1) | − | + | + | Unstable point | − | + | + | Unstable point | − | + | + | Unstable point |
| (1, 1, 0) | − | + | ± | Unstable point | − | − | − | ESS | − | ± | + | Unstable point |
| (0, 1, 1) | + | − | ± | Unstable point | + | − | + | Unstable point | + | − | − | Unstable point |
| (1, 1, 1) | − | − | ± | Unstable point | − | − | + | Unstable point | − | − | − | ESS |
Disclaimer/Publisher’s Note: The statements, opinions and data contained in all publications are solely those of the individual author(s) and contributor(s) and not of MDPI and/or the editor(s). MDPI and/or the editor(s) disclaim responsibility for any injury to people or property resulting from any ideas, methods, instructions or products referred to in the content. |
© 2023 by the authors. Licensee MDPI, Basel, Switzerland. This article is an open access article distributed under the terms and conditions of the Creative Commons Attribution (CC BY) license (https://creativecommons.org/licenses/by/4.0/).
Share and Cite
Zhang, P.; Wang, M.; Deng, G. Evolutionary Game Analysis of Resilient Community Construction Driven by Government Regulation and Market. Sustainability 2023, 15, 3251. https://doi.org/10.3390/su15043251
Zhang P, Wang M, Deng G. Evolutionary Game Analysis of Resilient Community Construction Driven by Government Regulation and Market. Sustainability. 2023; 15(4):3251. https://doi.org/10.3390/su15043251
Chicago/Turabian StyleZhang, Panke, Mengtian Wang, and Guoqu Deng. 2023. "Evolutionary Game Analysis of Resilient Community Construction Driven by Government Regulation and Market" Sustainability 15, no. 4: 3251. https://doi.org/10.3390/su15043251