Article

Spatial and Temporal Analysis of Global Landslide Reporting Using a Decade of the Global Landslide Catalog

by
Chelsea Dandridge
1,*,
Thomas A. Stanley
2,3,
Dalia B. Kirschbaum
4 and
Venkataraman Lakshmi
1
1
Engineering Systems and Environment, University of Virginia, Charlottesville, VA 22903, USA
2
GESTAR II, University of Maryland Baltimore County, Baltimore, MD 21250, USA
3
Hydrological Sciences Laboratory, National Aeronautics and Space Administration Goddard Space Flight Center, Greenbelt, MD 20771, USA
4
Earth Science Division, National Aeronautics and Space Administration Goddard Space Flight Center, Greenbelt, MD 20771, USA
*
Author to whom correspondence should be addressed.
Sustainability 2023, 15(4), 3323; https://doi.org/10.3390/su15043323
Submission received: 9 December 2022 / Revised: 29 January 2023 / Accepted: 2 February 2023 / Published: 11 February 2023
(This article belongs to the Special Issue Geological Hazards and Risk Management)

Abstract

:
Rainfall-triggered landslides can result in devastating loss of life and property damage and are a growing concern from a local to global scale. NASA’s global landslide catalog (GLC) compiles a record of rainfall-triggered landslide events from media reports, academic articles, and existing databases at global scale. The database consists of all types of mass movement events that are triggered by rainfall and represents a minimum number of events occurring between 2007 and 2018. The GLC collection is no longer being compiled, and the dataset will not be updated past 2018. The research presented here evaluates global patterns in landslide reporting from events in the GLC. The evaluation includes an analysis of the spatial and temporal distribution of global landslide events and associated casualties and comparisons with other landslide inventories. This database has been used to estimate landslide hotspots, evaluate geographic patterns in landslides, and train and validate landslide models from local to global scales. The most notable landslide hotspots are in the Pacific Northwest of North America, High Mountain Asia, and the Philippines. Additionally, the relationship between country GDP and income status with landslide occurrence was determined to have a positive correlation between economic status and landslide reporting. The GLC also indicates a reporting bias towards English-speaking countries. The general goal of this research is to assess the decade of global landslide reports from the GLC and show how this database can be used for rainfall-triggered landslide research.

1. Introduction

Rainfall-triggered landslides are a mounting global concern due to increased frequency of extreme precipitation due to climate change [1,2,3]. Quality landslide inventories are necessary for assessing landslide risk and hazard [4,5]. NASA’s global landslide catalog (GLC) compiles a record of rainfall triggered landslides globally from news reports, academic papers, and pre-existing databases at NASA Goddard Space Flight Center. Landslides are not recorded consistently across the globe, with that being said the GLC represents a minimum number of landslide reports from 2007 to 2018. The original framework and collection methods for the GLC are detailed in Kirschbaum et al. (2010) [6]. Comprehensive analyses of the GLC database were also undertaken in Kirschbaum et al. (2012) and Kirschbaum et al. (2015) [7,8]. Single event entries in the GLC may consist of multiple landslides near one another triggered by the same rainfall event. The GLC is published along with other landslide inventories in the Cooperative Open Online Landslide Repository (COOLR), which contains landslides reported by citizen scientists and other inventories from the broader research community [9]. Even though the GLC is no longer being compiled, landslides can still be reported using the Landslide Reporter application and added to the COOLR collection. The GLC represents all landslides triggered by rainfall including mudslides, rockslides, and debris flows. Each event includes location information (nominal and geographic), time of event, triggering mechanism, type of landslide, relative size, location accuracy, impacts such as estimated economic damage, casualties, and fatalities. The location accuracy is based on a qualitative radius of confidence in kilometers. Location accuracy provided in the GLC is affected by the capability of the news reports to convey the location information and preciseness. Additionally, the GLC may not be complete for non-English-speaking countries due to the collection method and most reports originating from English-language media [8]. The year 2010 yielded the highest number of annually recorded events in the GLC, which can be attributed to unusually high precipitation and increased landslide events globally compared to other years. A detailed analysis of the anomalies in 2010 has been performed and discussed by [7].
Historically, there have been few efforts to compile landslides at global scale [10]. Detailed landslide inventories are more commonly found at regional or national scale [11,12,13,14,15] or are event-based after a significant rainfall event [16,17,18]. However, Froude and Petley (2018) present a global database of fatal landslides from 2004 to 2016, but it does not include non-fatal events [4]. There are several methods to produce landslide inventories and most are event-based or region-specific. For example, Bessette-Kirton et al. (2019) present landslides triggered by Hurricane Maria in 2017 in Puerto Rico that were mapped using post-storm satellite and aerial imagery [19]. From their mapping, an estimated 40,000 landslides occurred as a result of the hurricane event. The national landslide inventory for Cuba only represents landslides that cause major damage and does not reveal qualitative information for most of the landslides in the inventory or represent the entire country [11]. The AVI project is the most extensive database for landslides and floods in Italy with events manually gathered from historical news articles and scientific reports from 1918 to 1990 [20]. Alternatively, Amatya et al. (2019) utilized high-resolution imagery from 2012 and 2018 with object-based image analysis to map a landslide inventory along the Karnali Highway in Nepal, and then several inventories in Southeast Asia in Amatya et al. (2021) [17,21]. This method was able to identify almost 60% of the landslides identified manually. The Fatal Landslide Event Inventory of China (FLEIC) is a record of 1911 landslides from 1950 to 2016. Each entry represents a single landslide gathered from geological records, media reports, and literature [22]. The GLC can be used to supplement existing inventories that may be limited temporally or spatially.
Several landslide studies have used the GLC in their creation of landslide databases and to assess global patterns of landslides. Lin and Wang (2018) [22] used events in the GLC to analyze fatal landslides in China and create the Fatal Landslide Event Inventory of China (FLEIC). They also used the same methodology to determine the location and radius of confidence for additional landslides in China. This study noted that the short time period available in the GLC (less than ten years) limited temporal trend analysis. Chandrasekaran et al. (2013) investigated damages to infrastructure in Nilgiris, India caused by rainfall-induced landslides using the GLC [23]. They found that roughly ten percent of global landslide fatalities occurred in India. Benz and Blum (2019) proposed an algorithm to detect global landslide clusters triggered by the same rainfall event and applies it to events reported in the GLC [24]. They found that more than 40% of events can be related to another event, and 14% of events are part of a cluster with more than ten landslides triggered by the same rainfall event with results varying greatly geographically. Culler et al. (2021) evaluates post-fire landslide susceptibility in different regions across the globe using the GLC for landslide events and comparing antecedent precipitation at burned and unburned locations from MODIS [25]. They found that wildfires increase landslide susceptibility, but post-fire landslides are not uniform and vary geographically. This study noted that the GLC was chosen because it offered the largest spatial and temporal range of any landslide inventory. Whiteley et al. (2019) included the GLC in their review of geophysical monitoring of global rainfall-triggered landslides to draw the conclusion that landslide distribution is not uniform across the globe [26]. Additionally, Froude and Petley (2018) used the GLC in their analysis of global fatal landslides from 2004 to 2016 [4]. They found that most fatal landslide clusters occur around cities in countries with lower gross national income.
Furthermore, the GLC has been used in several studies to train and validate landslide models. Lin et al. (2017) used landslides from the GLC and the World Geological Hazard Inventory as training and validation data for a logistic regression model for global landslide susceptibility [27]. Farahmand and Aghakouchak (2013) used 581 events from 2003, 2007, 2008, and 2009 in the GLC as training and validation data for a support vector machines machine learning algorithm to predict global landslides [28]. This study noted that the GLC is composed of major landslides and therefore, the model is not calibrated for small landslides. The model reliably predicted historical landslides. Liao et al. (2010) proposed an early warning system for rainfall-triggered landslides over Java Island, Indonesia using events in the GLC from 2003 and 2007 and the SLIDE (slope infiltration distributed equilibrium) model with NASA’s Tropical Rainfall Measurement Mission (TRMM) precipitation estimates [29]. Kirschbaum et al. (2015a) used the GLC within the LHASA framework for Central America and Hispaniola [30]. This study related GLC events to long-term precipitation from TMPA from 2001 to 2013. The LHASA model was able to correctly identify the potential for most GLC events. This study noted that the GLC is the only event-based database for landslides across all countries within Central America and the Caribbean region. Furthermore, Kirschbaum et al. (2012) compared GLC events from Hurricane Mitch in Central America in 1998 to the susceptibility maps globally and regionally, and all the nine landslides occurred in high susceptibility zones in the regional map, and eight landslides occurred in high susceptibility zones in the global map [31].
Following the analysis of the GLC by Kirschbaum et al. (2015b), this research further examines various attributes and limitations associated with the landslide information reported by the GLC using a longer time period of recorded events [6]. Global patterns of landslides and associated fatalities are examined both geographically and temporally. Fatality and landslide hotspots are assessed at global and continental scale. The GLC has not previously been compared against other landslide inventories. Here, we evaluate twenty-seven region-specific event inventory databases and their similarities and differences against events reported in the GLC. A quantitative spoken language analysis has yet to be performed with the GLC reports. To determine if there is any bias regarding the language of reported events in the GLC, the relationship between spoken language and landslide reporting is investigated. The economic status of varying regions could affect the amount and method of landslide reporting, thus economic variables are compared against landslide activity reported in the GLC to determine the effect of economic status on landslide event reporting. The results of this study give a deeper understanding of the global patterns of landslide reporting, and are also useful for applying the GLC in rainfall-triggered landslide analysis.

2. Data

This section lists and describes the datasets used for analysis in this research and organizes the information in Table 1.

2.1. GLC

The Global Landslide Catalog is a record of landslides collected from news reports, academic articles, and pre-existing inventories. There are a total of 11,334 landslides in the GLC between 2007 and 2018, which are publicly available as geospatial point or tabular data from [6].

2.2. Land Area

The land area is a country’s total area, excluding area under inland water bodies, national claims to continental shelf, and exclusive economic zones. The land area estimates are reported in km2. A full data description and download information are available from [32].

2.3. Population Density

The population density is the midyear population divided by land area in square kilometers. A full data description and download information are available from [33].

2.4. Gross Domestic Product per Capita

Gross Domestic Product (GDP) is the sum of gross value added by all resident producers in the economy plus any product taxes and minus any subsidies not included in the value of the products. The GDP per capita is the GDP divided by the midyear population. Values are collected from the latest year available for each country. A full data description and download information are available from [34].

2.5. Landslide Susceptibility

The global landslide susceptibility map has a spatial resolution of roughly 1 km and covers most of the world’s land surface, but not Antarctica. The susceptibility model combines slope, geology, road networks, faults, and forest loss using a heuristic fuzzy methodology [5,35]. Susceptibility is classified by increasing severity as very low, low, medium, high, and very high. The receiver operating characteristic (ROC) curve and area under the curve (AUC) is used to assess the performance of the global susceptibility map. The AUC ranges from 0.61 to 0.85 when compared against local landslide inventories from varying locations across the globe, and the AUC when compared against the GLC is 0.82. Further explanation on the quality of the map can be found in Stanley and Kirschbaum (2017) [35]. In this research, the global susceptibility rating is extracted for each point representing an event in the GLC.

2.6. Landslide Inventories

Twenty-seven landslide event inventories from 2008 to 2018 were created via object-based image analysis, developed by Amatya et al. (2022); Chang et al. (2014); Chen et al. (2013); Marc et al. (2018); and Van Westen and Zhang (2018) [17,18,36,37,38]. These inventories consist of landslides mapped after considerable rainfall events in various locations. Most landslides are able to be detected using object-based image analysis, but the areas are not always accurate and manual correction is often necessary [17]. Additionally, a landslide database for the Apulian region of southern Italy was collected from 2008 to 2016 by Vennari et al. (2022) and used for comparison in this study [39]. The event inventories are provided as point or polygon shapefiles which are compared directly to the points provided in the GLC using GIS to determine how many GLC points lie within the inventories mapped extent.

3. Results

3.1. Geographic and Temporal Distribution

A global landslide susceptibility map produced by Emberson et al. (2020) and Stanley and Kirschbaum (2017) is overlaid with landslide events and hotspot estimation and shown in Figure 1A [5,35]. The susceptibility map is used to allocate a susceptibility rating for each point in the GLC by extracting the susceptibility map pixel value at each event location. The most notable landslide hotspots, which are highlighted in red, are in the Pacific Northwest, High Mountain Asia, and the Philippines. Figure 1B shows the number and percentage of events as well as the number of fatalities for each susceptibility class. Regarding all GLC events from 2007 to 2018, 77% of reports occur in medium or higher susceptibility areas, and 32% of reports occur in very high susceptibility areas. Furthermore, areas described as having very low susceptibility are reported to have the least number of events with only 6.8% of all landslides and have the least number of fatalities associated with landslides. Overall, the number of fatalities increases with susceptibility as shown by the blue line. Figure 1C shows the average number of events in black and the average number of fatalities in blue by month. On average, most events are reported in the months July, August, and September, and the least reports occur in February and November. Most fatalities are reported in June and August, and like the number of reports, the least number of fatalities are reported in February and November.
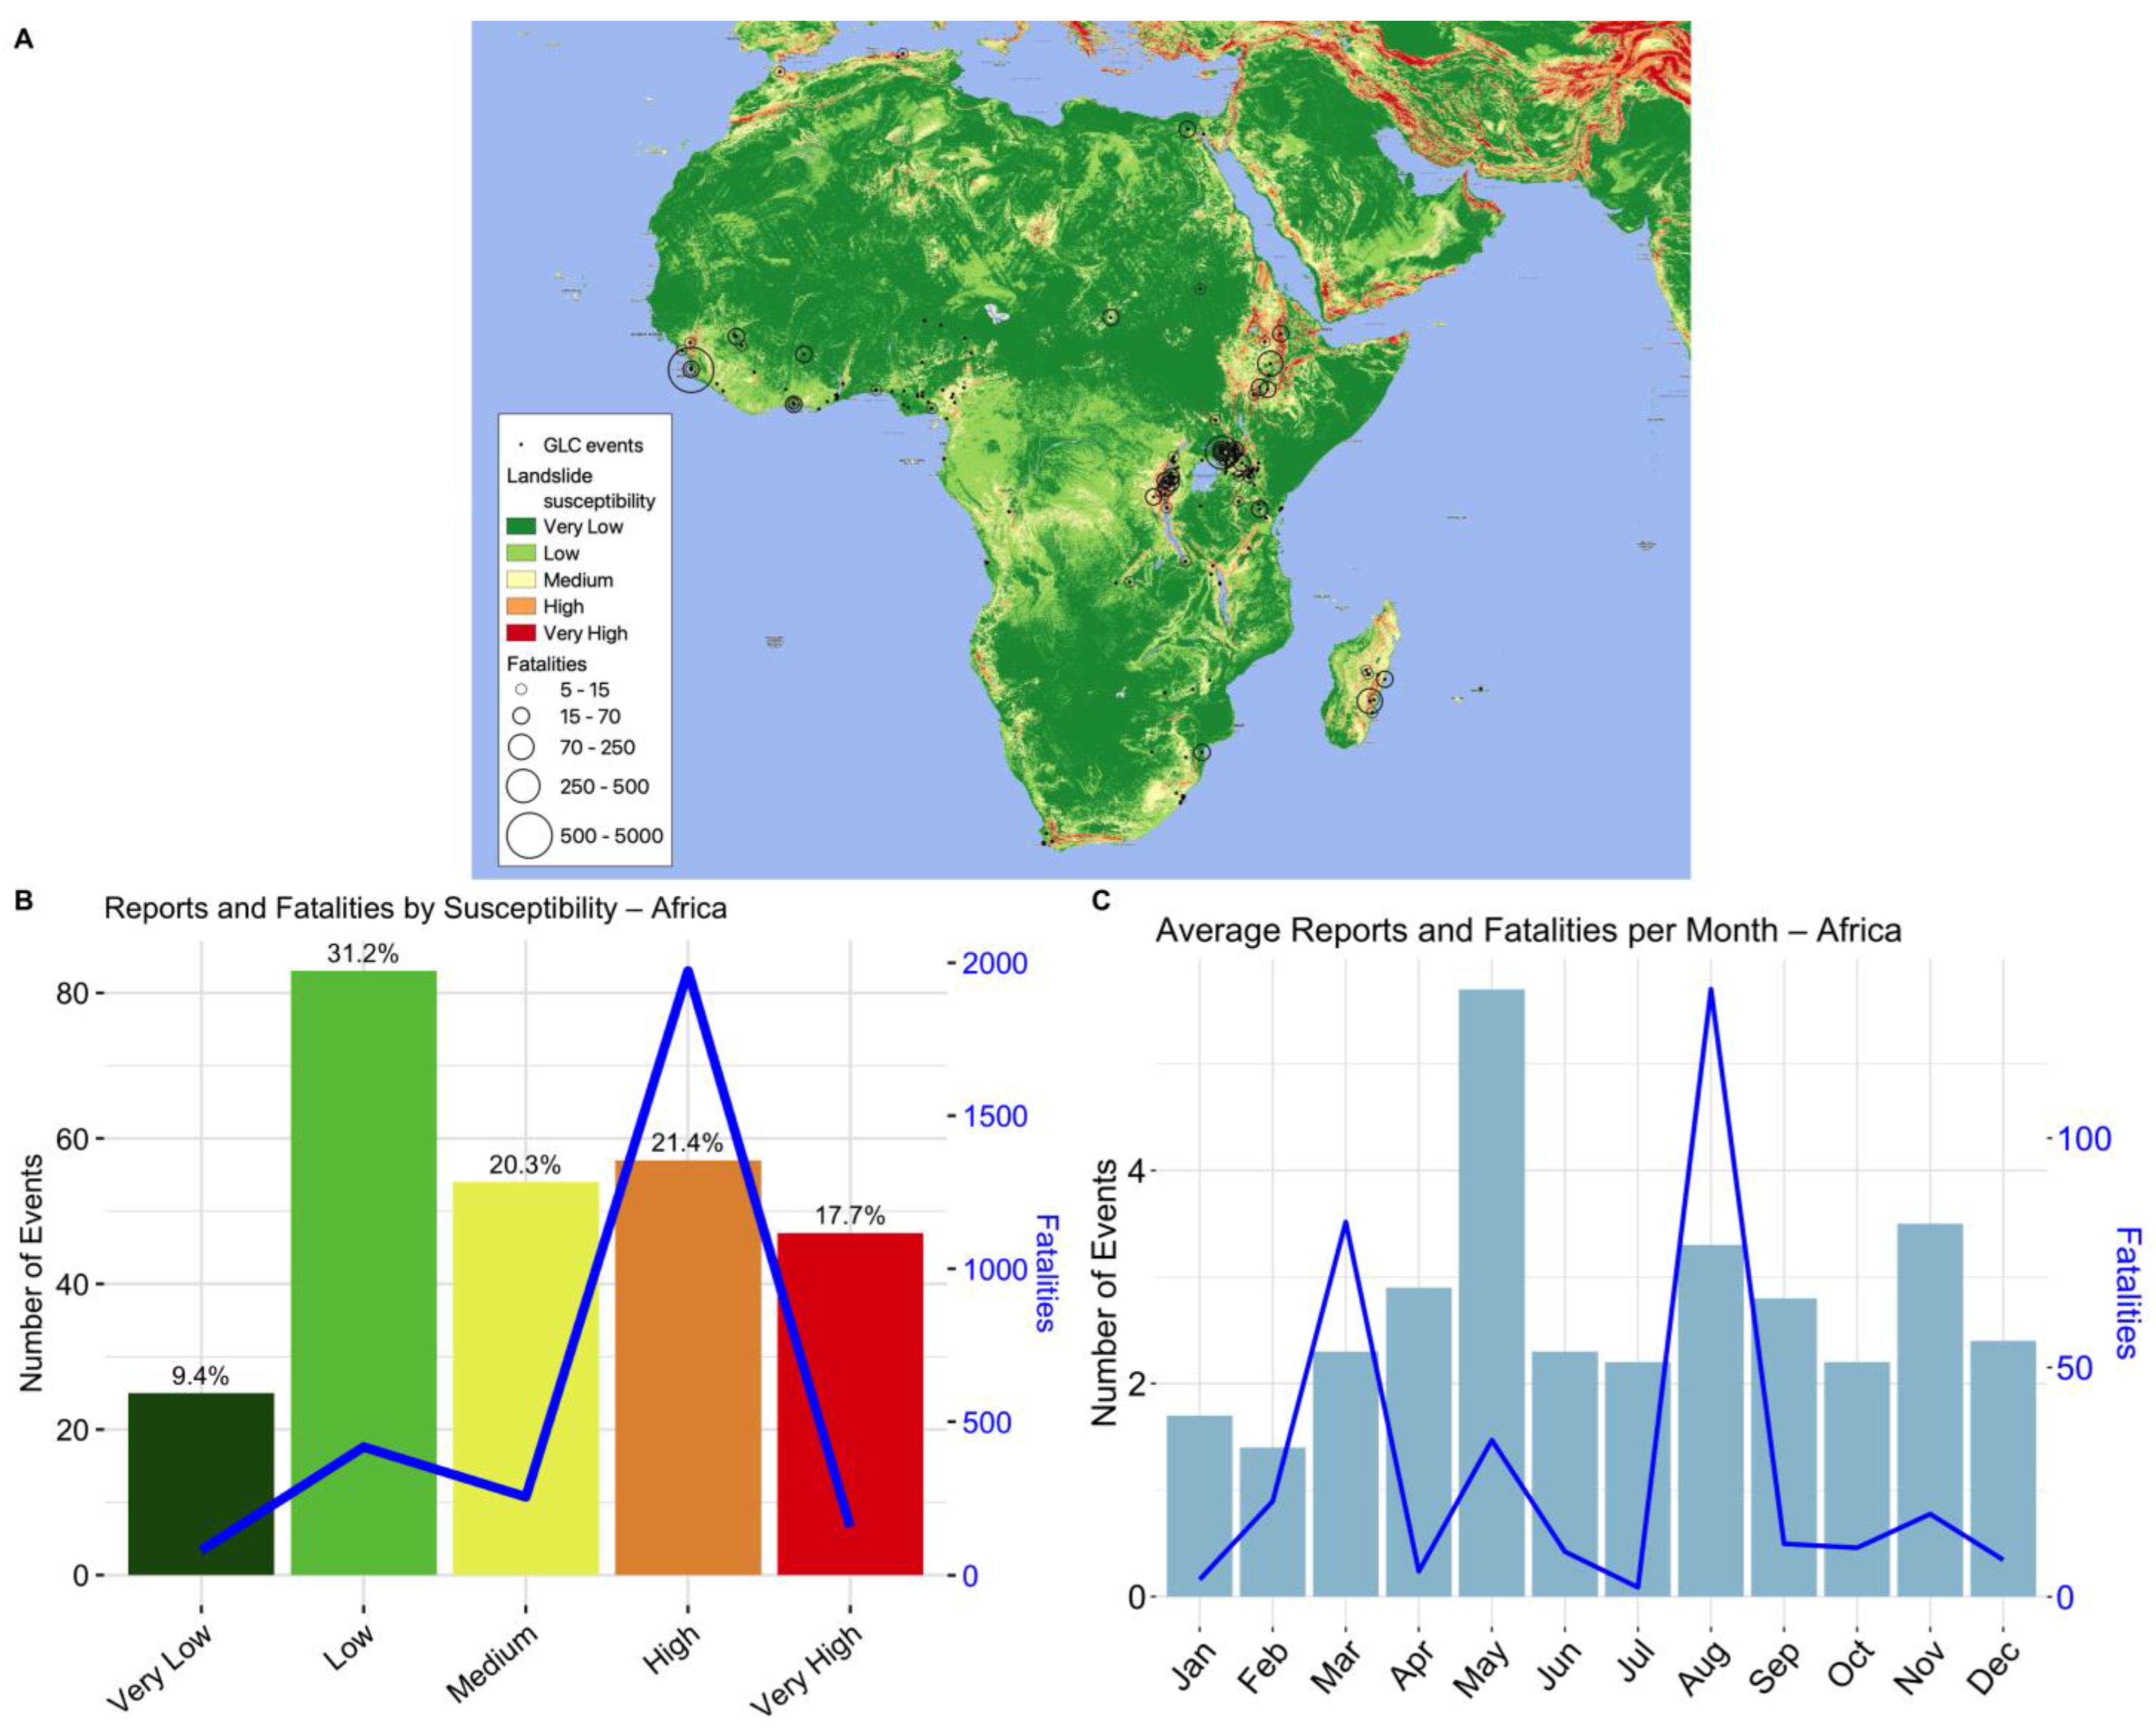
Landslide reports in the GLC are not widespread in Africa as shown in Figure 2A, which displays the landslide susceptibility map overlaid with landslide events and fatalities. Parts of Northern and Central Africa do not have many or any reported events in the GLC despite there being an indication of high landslide susceptibility. The absence of events in this area can be explained by the lack of precipitation over the Sahara Desert. The largest landslide clusters are located near the East African Rift. However, the most fatal landslide reported in Africa occurred on the west coast in Sierra Leone in August of 2017 and had 1141 associated fatalities and resulted in over 3000 displaced persons. Interestingly, the highest percentage of events, approximately 31%, are reported in low susceptibility areas as shown in Figure 2B, which also reports the number of fatalities associated with each susceptibility class, which is most likely due to poor location accuracy in the African region. In Africa, only 12 events are known within 1 km, and 69 events have a location accuracy greater than 5 km. The most fatalities, however, occur in highly susceptible areas. Figure 2C reports the monthly average number of events and average fatalities per month. While May on average has the most landslide reports, the most reported fatalities occur in August due to the substantial fatalities associated with the 2017 Sierra Leone event. In addition, March and August show significantly more reported fatalities than other months when analyzed over 2007–2018.
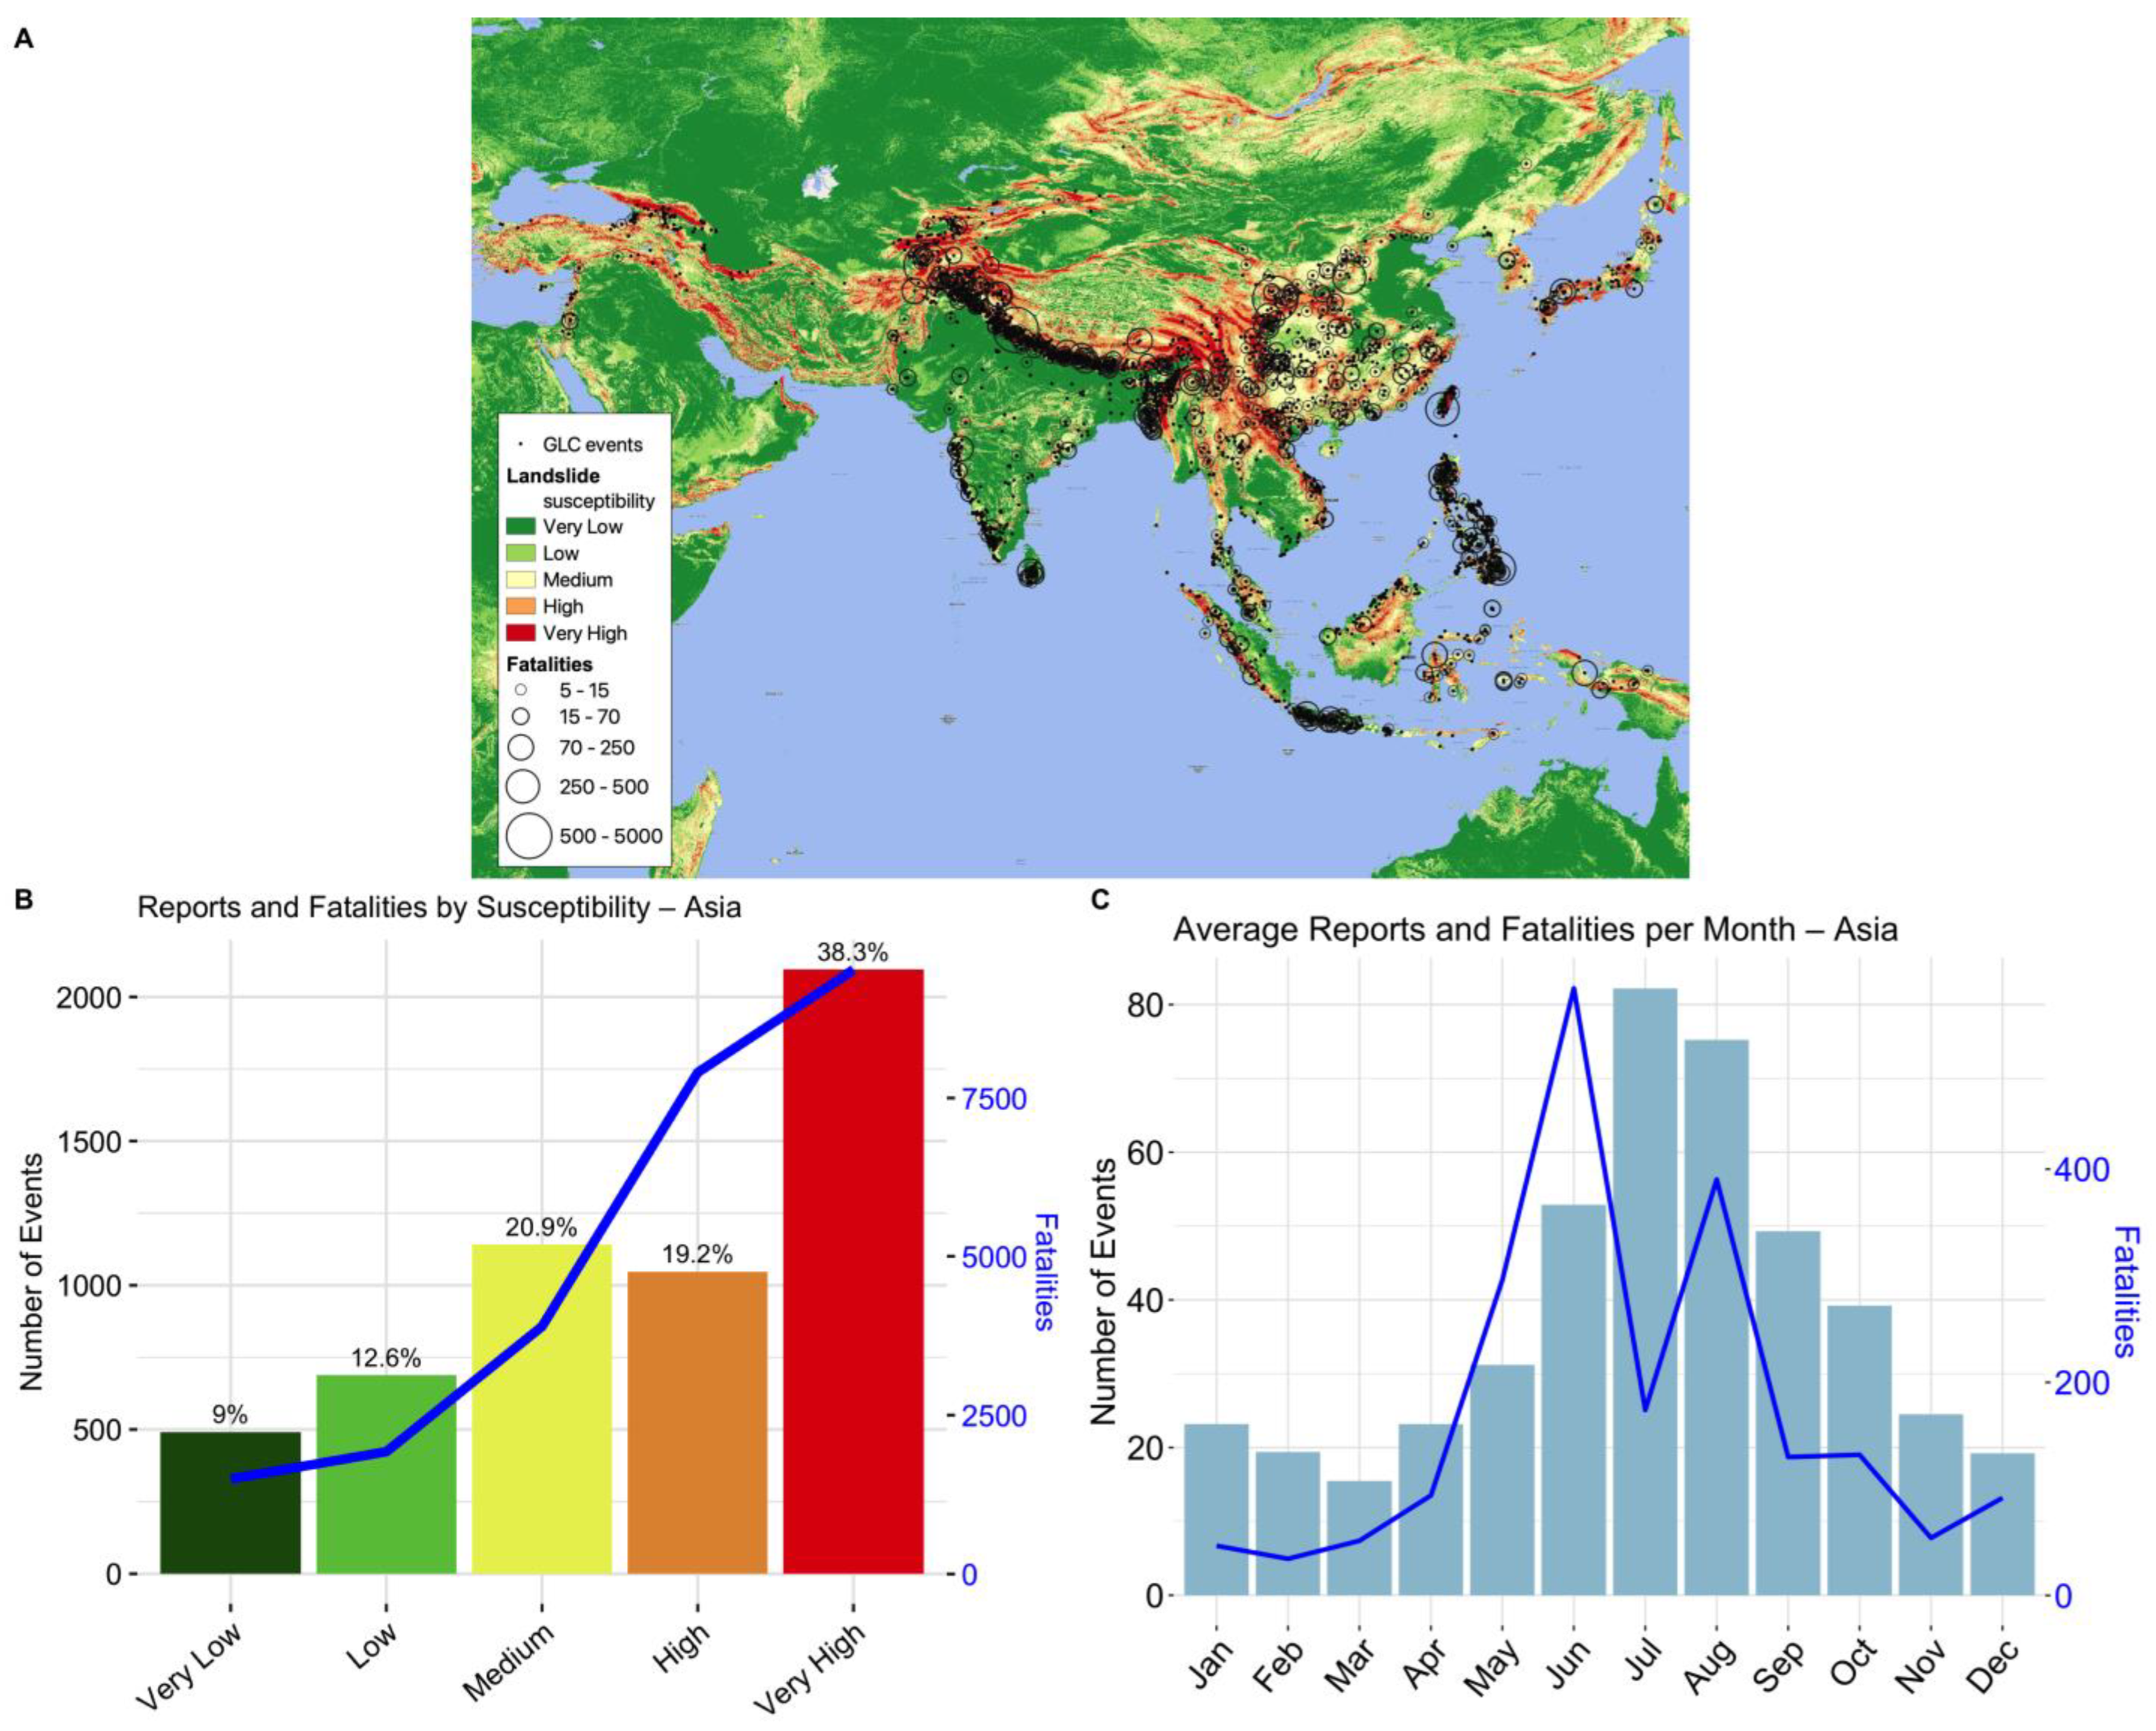
The landslide susceptibility map and reported events as well as the distribution of fatalities throughout Asia are shown in Figure 3A. Many reported events in Asia and fatalities in the GLC occur near the Himalayan Arc. Another landslide hotspot in Asia is the Philippines, reporting 769 events between 2007 and 2018. The largest fatal event in the GLC was reported to have a death toll of 5000 people and occurred after the highest 24 h rainfall in city history triggered a very large landslide near Kedarnath, India in 2013. Oddly, only 22 total events were reported in the Russian Federation from 2007 to 2018 despite the presence of large areas susceptible to landslides. This may indicate that landslide events in the Russian Federation are underrepresented. Figure 3B shows the largest portion (38%) of reports and the most fatalities occurred in very high susceptibility areas. Generally, the amount of fatalities reported increases with susceptibility. Looking at the average number of reports and fatalities by month in Figure 3C, most landslides were reported in June–October with most fatalities being reported in June and August. This trend correlates with the monsoon season experienced in Southeast Asia which lasts approximately May to October [40,41].
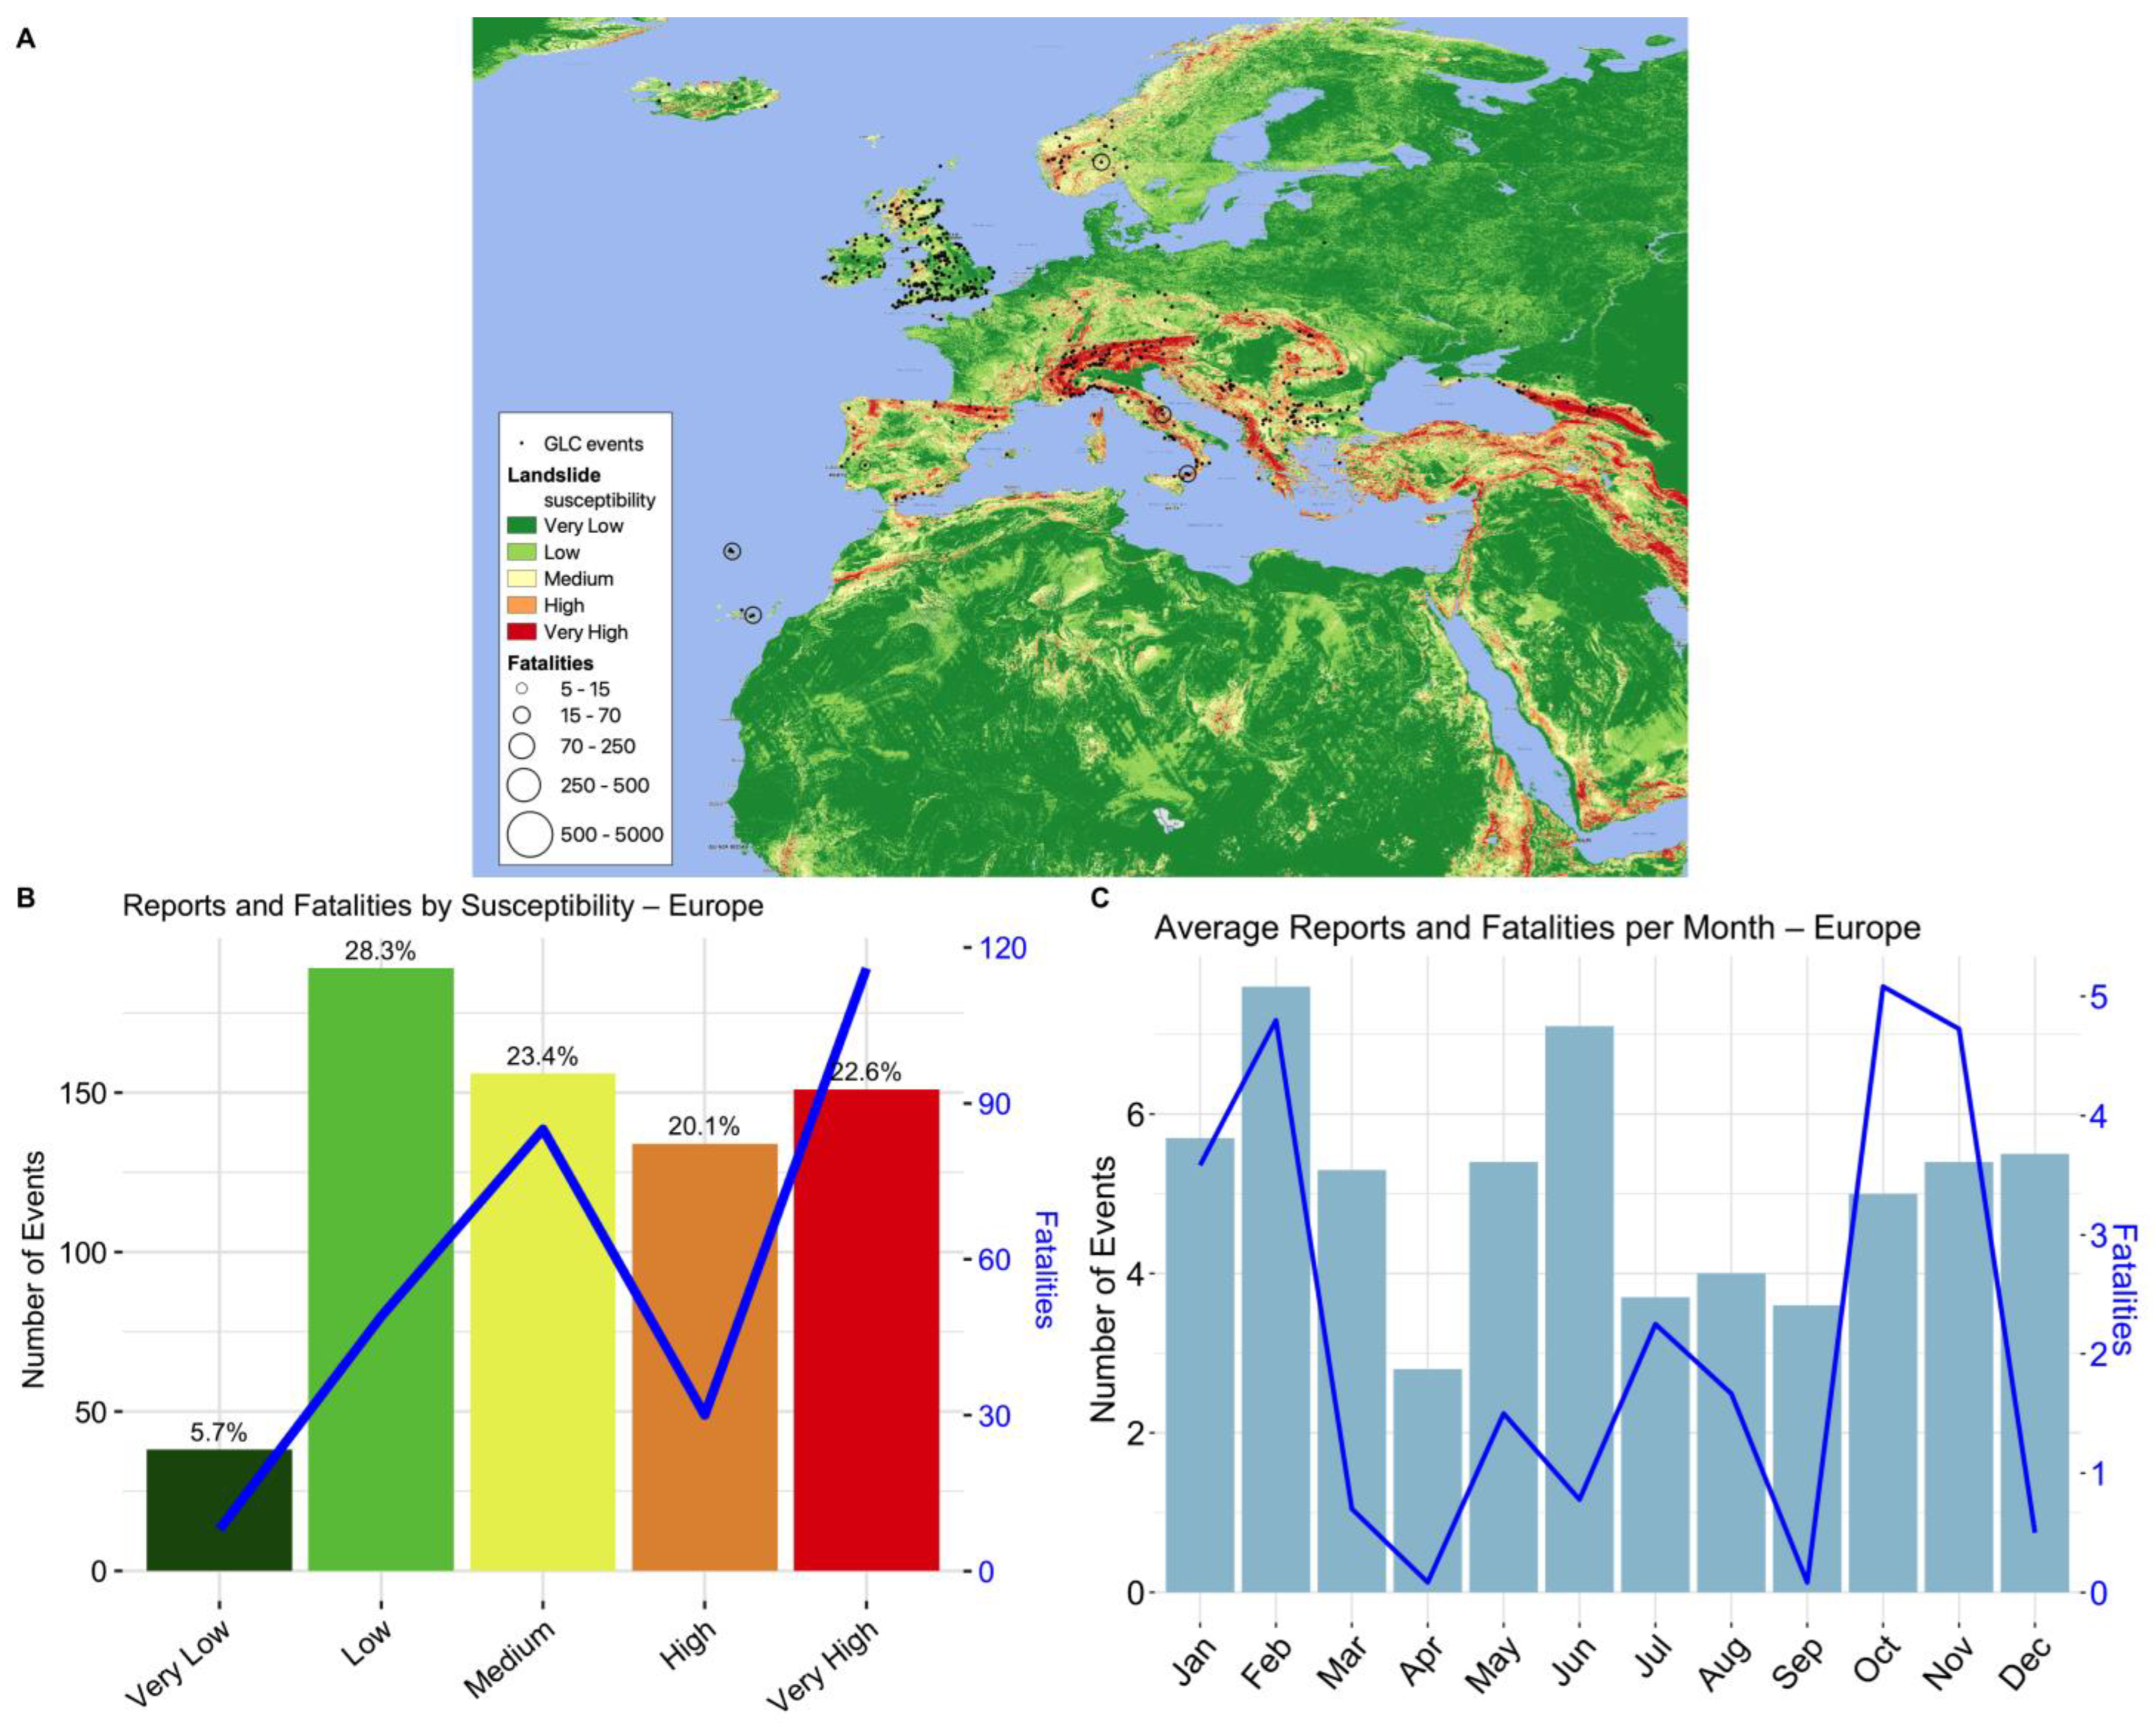
There are fewer fatal landslides reported in Europe compared to other regions in the world as observed from Figure 4A, which shows the landslide susceptibility and GLC events with associated fatalities over Europe. The highest percentages of events were reported in low (28%) and medium (23%) susceptibility areas, while 22% of events were reported in very high susceptibility areas. However, the highest number of fatalities occurred in locations with very high susceptibility, and only eight fatalities were reported in areas considered to have very low landslide susceptibility from 2007 to 2018 (Figure 4B). Figure 4C shows the average number of landslide events and associated fatalities by month for Europe. The months of February and June have the most reported landslide events in the GLC, while February and October have the most reported fatalities on average from events in the GLC (Figure 4C).
Most fatal landslides in North America are reported in Mexico, Central America, and the Caribbean islands compared to events in the United States and Canada. This can be observed in Figure 5A, which displays the landslide susceptibility map overlaid with GLC events and reported fatalities in North and Central America. While most events (31.9% of reports) occurred in medium susceptibility zones, 26.8% of reports occur in very high susceptibility zones, and the number of fatalities reported in very high susceptibility areas amounts to almost 1000 casualties, which is significantly higher than the lesser susceptibility classifications (Figure 5B). Figure 5C shows the average number of reported landslide events are highest in March and December and less reports occur from June to November. The associated fatalities by month for North America are noticeably higher from August through October, which could be due to two specific outlier events that occurred in Guatemala in 2015. The August event reported 253 fatalities, and the October event reported 280 fatalities. In the months from December through April, less than five fatalities are reported on average which is significantly less compared to other months.
Regarding Oceania, most landslide events occur on the East Coast of Australia, Papua New Guinea, and New Zealand, which can be seen in Figure 6A, which shows the landslide susceptibility map overlaid with GLC events and corresponding fatalities. There are a total of 98 fatalities from 21 reports from seven countries represented in the GLC from Oceania. Forty-eight percent of fatalities in Oceania, which totals 47 fatalities, occurred in low susceptibility areas which is significantly more than the higher susceptibility categories (Figure 6B). The two most fatal landslides were reported in Papua New Guinea in low susceptibility areas: one in Hela and one in the Eastern Highlands, which report 25 and 10 fatalities, respectively. There may be underrepresentation in the reporting of fatalities due to landslides in Australia, having only one fatality and no injuries reported out of all the events reported in the country, even though there are references of rainfall-triggered landslides that led to additional fatalities and injuries. For example, five people were injured after a landslide blocked a portion of railway tracks and caused the derailment of the train on 26 March 2010 as reported by Leiba (2013) [42]. Looking at the average events and fatalities by month in Figure 6C, there appears to be a trend of higher fatalities from October to January throughout Oceania. However, no clear pattern appears in the number of reported events by month in this region.
Landslides in South America are largely reported on the West coast and around Rio de Janeiro. This pattern is shown in Figure 7A which also shows the landslide susceptibility of South America overlaid with reported events and fatalities from the GLC. A large cluster consisting of 209 landslides and numerous fatalities are clustered near Rio de Janeiro, a large and densely populated seaside city in Brazil. Throughout South America, most landslide events and fatalities were reported in very high susceptibility locations compared to lower susceptibility classifications, which is shown in Figure 7B. Two events that reported 378 and 424 fatalities, respectively, both occurred in January 2011 in Rio de Janeiro. These represent the two highest numbers of fatalities associated with a landslide in South America in the GLC. Looking at the monthly average reported events and fatalities in South America in Figure 7C, January reports significantly more fatalities on average, which is likely due to the two events with outlier fatality counts. Alternatively, the period from May through October shows a pattern of less reported events and fatalities compared to other months (Figure 7C).

3.2. Spoken Language Analysis

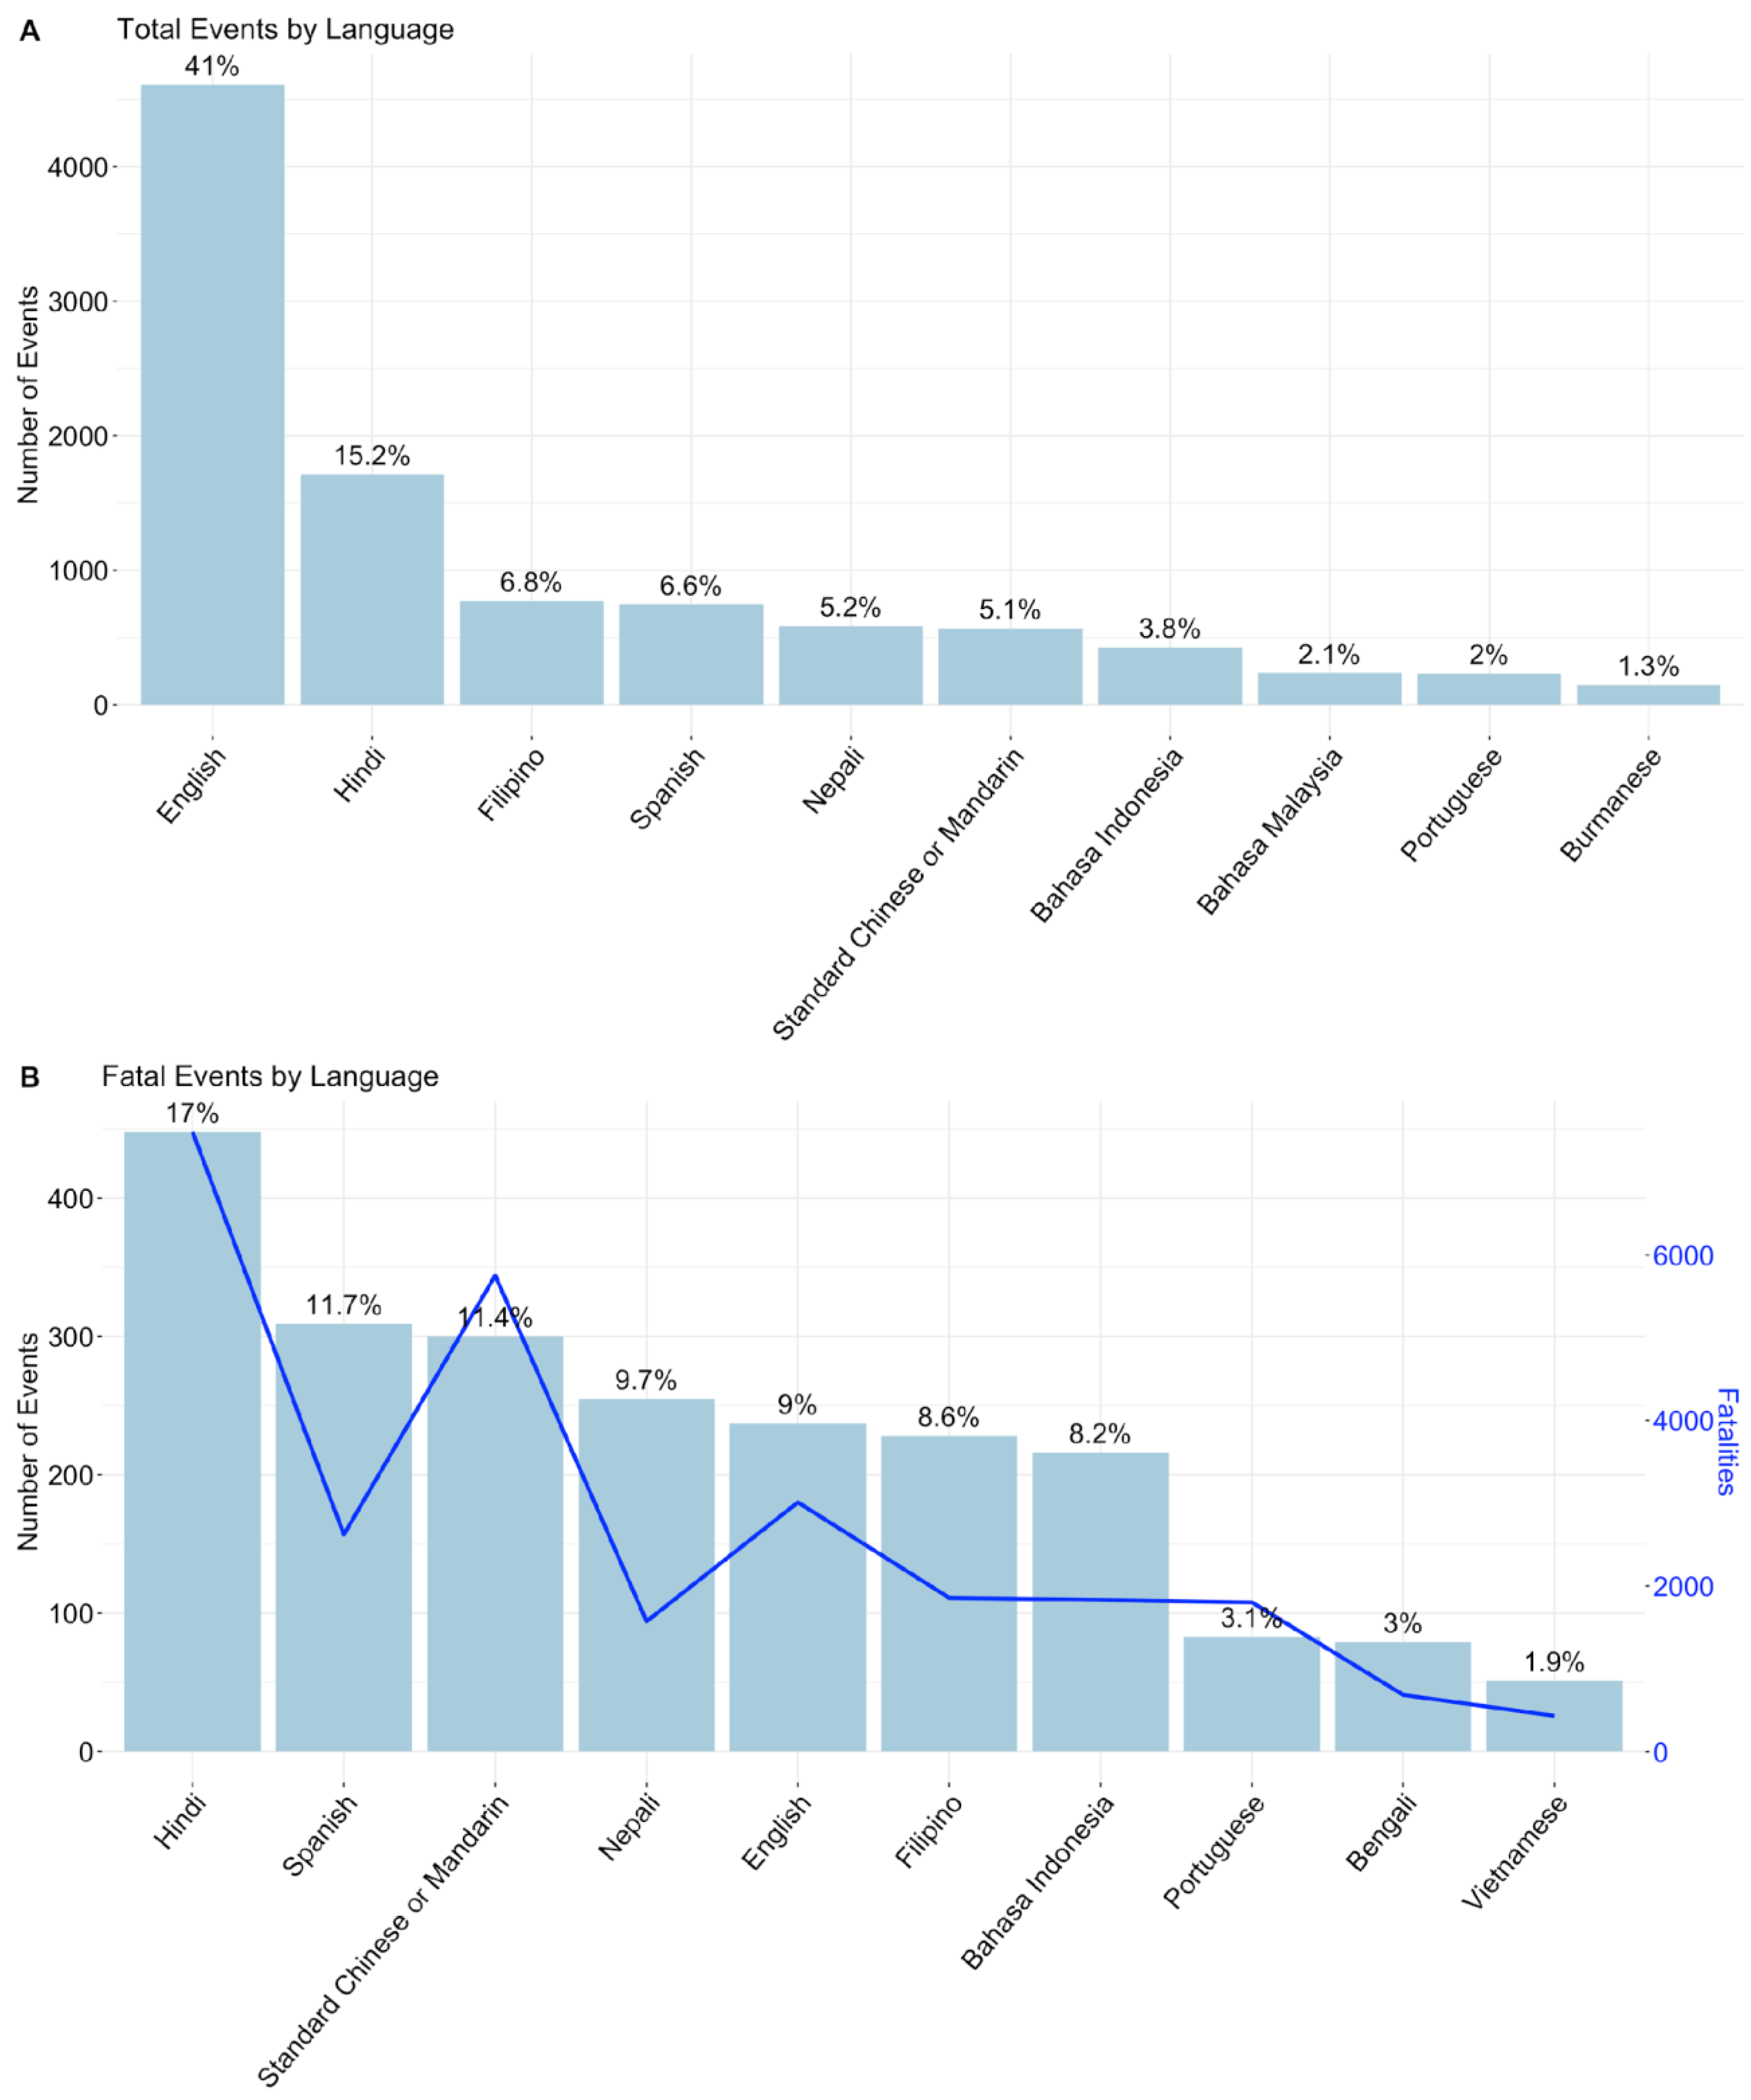
The reporting language of GLC events was assessed to determine the extent of bias regarding the language of reported events in the GLC. The relationship between spoken language and landslide reporting is investigated and reported in Figure 8. The spoken language for each event was designated by the official language of the country reported in the GLC. The total number and percentage of reports by language are shown in Figure 8A, and the number of fatal events and associated fatalities are shown in Figure 8B. While the plurality (41%) of total events reported in the GLC are from English-speaking countries, the number of fatal events and total fatalities are highest for Hindi-speaking countries. The large number of fatalities reported in Hindi is a result of the 5000 fatalities associated with a single event in India. When excluding this outlier event, Chinese followed by English and Spanish have more total fatalities reported than Hindi. Hindi, Spanish, Chinese, and Nepali-speaking countries report more fatal events than English. Furthermore, India, China, Nepal, and the Philippines make up the countries with the highest number of fatal landslide events in the GLC, reporting 321, 258, 220, and 209 fatal events, respectively. This shows a reporting bias towards English-speaking countries and bias in the collection methods of the reports. More fatal landslides are reported more often than non-fatal landslides regardless of the language spoken in that location.

3.3. Attribute Assessment

A general assessment of the GLC event attribute information is performed to observe trends in the event data. The known versus unknown values of several important attributes that are reported for each event are compared. The landslide category, location accuracy, size, and triggering mechanism attributes were mostly complete with known values for 90% or greater of reported events. However, the event time and landslide setting attributes were reported with more unknown values than known. Over 50% of events in the GLC are known within a five kilometer radius of confidence as shown in Table 2. Only 6.8% of events did not report a radius of confidence, and less than 20% of events have a radius of confidence greater than 25 km. This shows that generally, the location of the landslide reported from GLC events is relatively known within a small radius. The location accuracy is beneficial when using the GLC events for application in model training or validation. Furthermore, the distribution of the event size reported in the GLC is evaluated and the results are displayed in Table 3, which shows 72% of GLC events as medium size, and less than 9% of events are classified as large or very large. As the GLC is a collection of rainfall-triggered landslide events, we evaluated the triggering mechanism reported for each event. The distribution of triggering mechanisms are shown in Table 4, and 83% of events from 2007 to 2018 are in response to some type of precipitation. This attribute can be used to filter events for rainfall-triggered landslide studies that implement the use of the GLC. The reported events in the GLC per year are assessed and a cumulative sum per year is shown in Figure 9. The first three years on record, 2007–2009, consist of less reported events compared to later years, which could indicate that the first several years of landslide event collection are incomplete. The cumulative sum was also assessed by continent and similarly showed fewer reports for the first few years of record. No other regional patterns were discernible from the annual analysis. Furthermore, the reporting of events in the GLC by day of the week per year was evaluated in this study, and no distinct pattern was observed. The year 2010 holds the highest number of landslide events, and as mentioned, this anomaly year has been investigated and justified by extreme and prolonged precipitation in several landslide prone regions by Kirschbaum et al. (2012) [8]. This year also experienced greater numbers of fatal landslides and fatalities associated with landslides.

3.4. Inventory Comparison

There are landslide inventories available at global scale as well as focused on individual countries or states. These inventories vary in terms of source, mapping method, and attribute information. To compare the GLC against other landslide inventories, we look at several region-specific inventory databases and their similarities and differences against the GLC methodology. The location, number of points in the inventory, rainfall event date, number of points represented in the GLC, and source of each inventory are shown in Table 5. Only 9 out of the 27 event inventories are represented in the GLC by at least one point. A total of 25 points in the GLC coincide with the extent of the event inventories, which collectively report 17,893 landslides. One small, twelve medium, eight large, and four very large landslides represent the sizes reported by the GLC points and are shown in the reported size column in Table 5. Additionally, the location accuracy reported by the GLC was evaluated using the event inventories and are reported in the location accuracy column of Table 5. Of the 25 points, 22 contained event inventory landslides reported within the location accuracy radius, 3 were near the landslide inventory area but exceeded the reported location accuracy radius, and 1 GLC point that was 5 km from the event inventory reported the location as unknown. These event inventories consist of between 131 and 21,379 points or polygons, and the GLC consists of at most 16 points for the corresponding event in Teresópolis, Brazil, which provides 7268 landslide polygons. Additionally, we compared the GLC events to a local landslide inventory from Vennari et al. (2022) for the Apulian region of southern Italy collected from 2008 to 2016 [39]. We found that no landslides are reported in the GLC in the extent of the Apulian region, while the local inventory reports 107 landslide points. While the GLC does not provide as many points as the event inventories evaluated here, one point in the GLC could be representative of all the landslide activity in that region for the specific event. However, the number of landslides represented in event inventories is up to several orders of magnitude greater than the number of reported landslides in the GLC for the same date and location as the landslide event mapped. This comparison shows that the GLC is less representative of small regions and event-specific landslides.

3.5. Economic Status Assessment

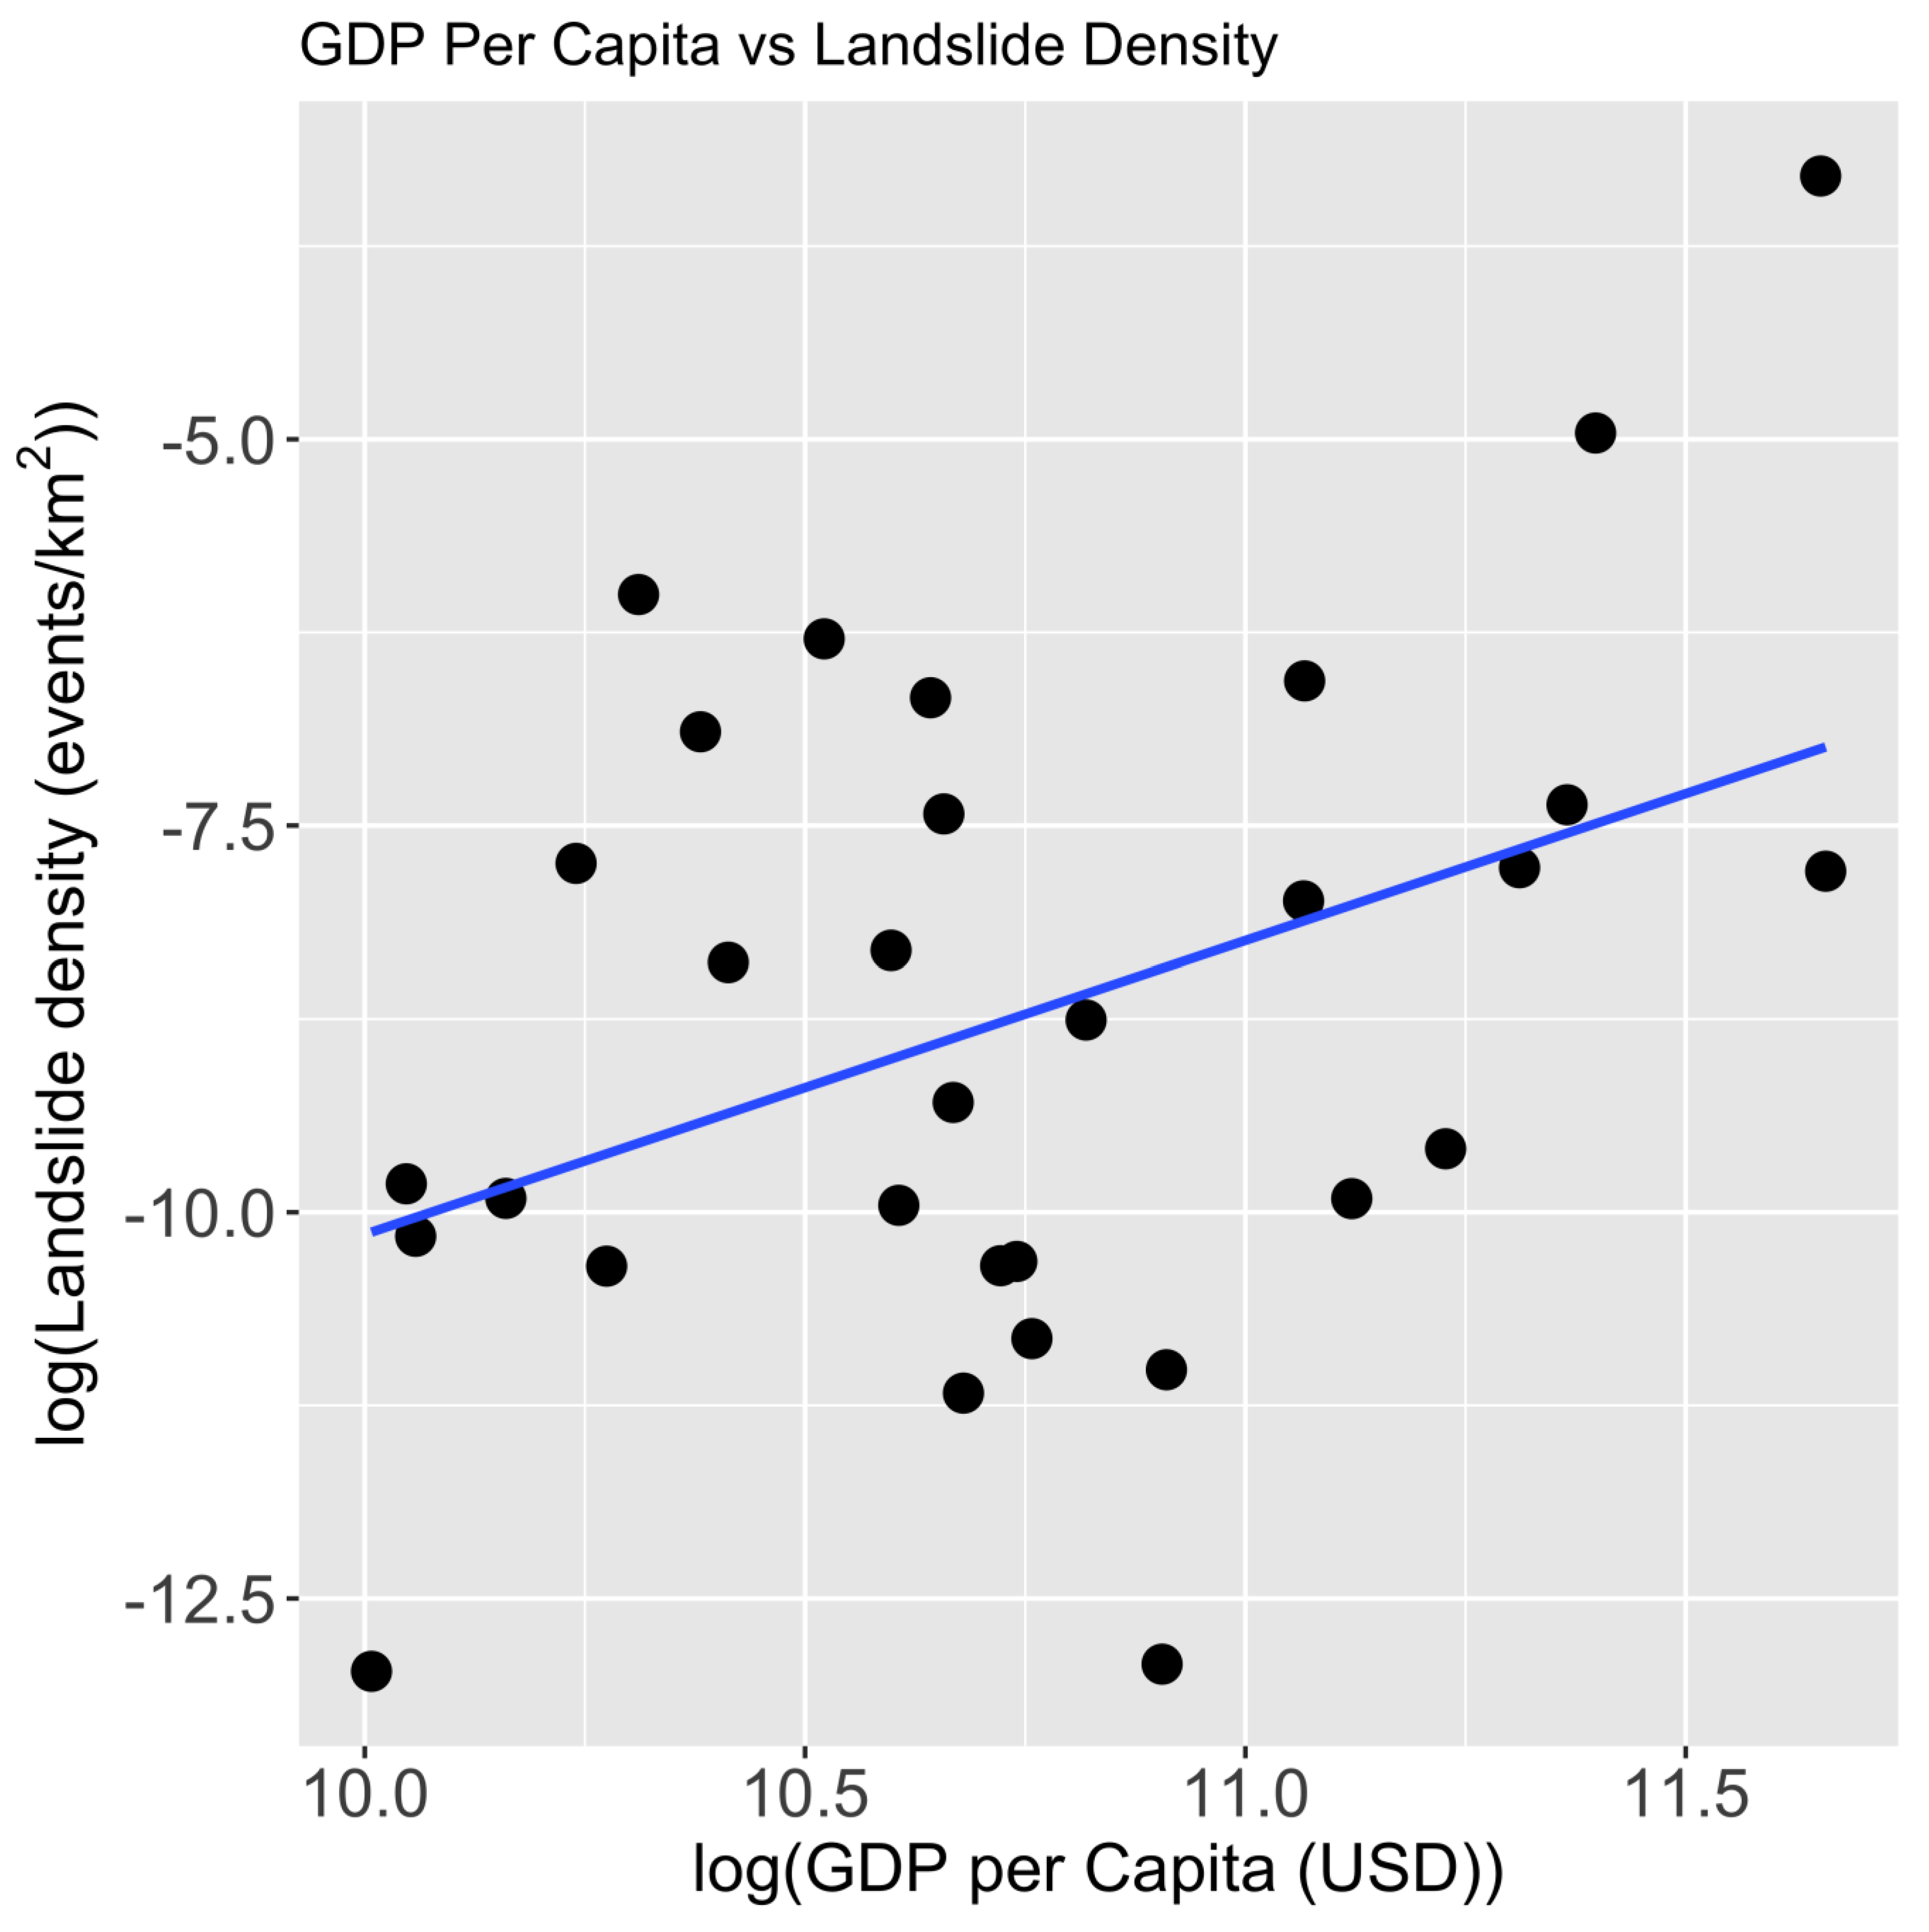
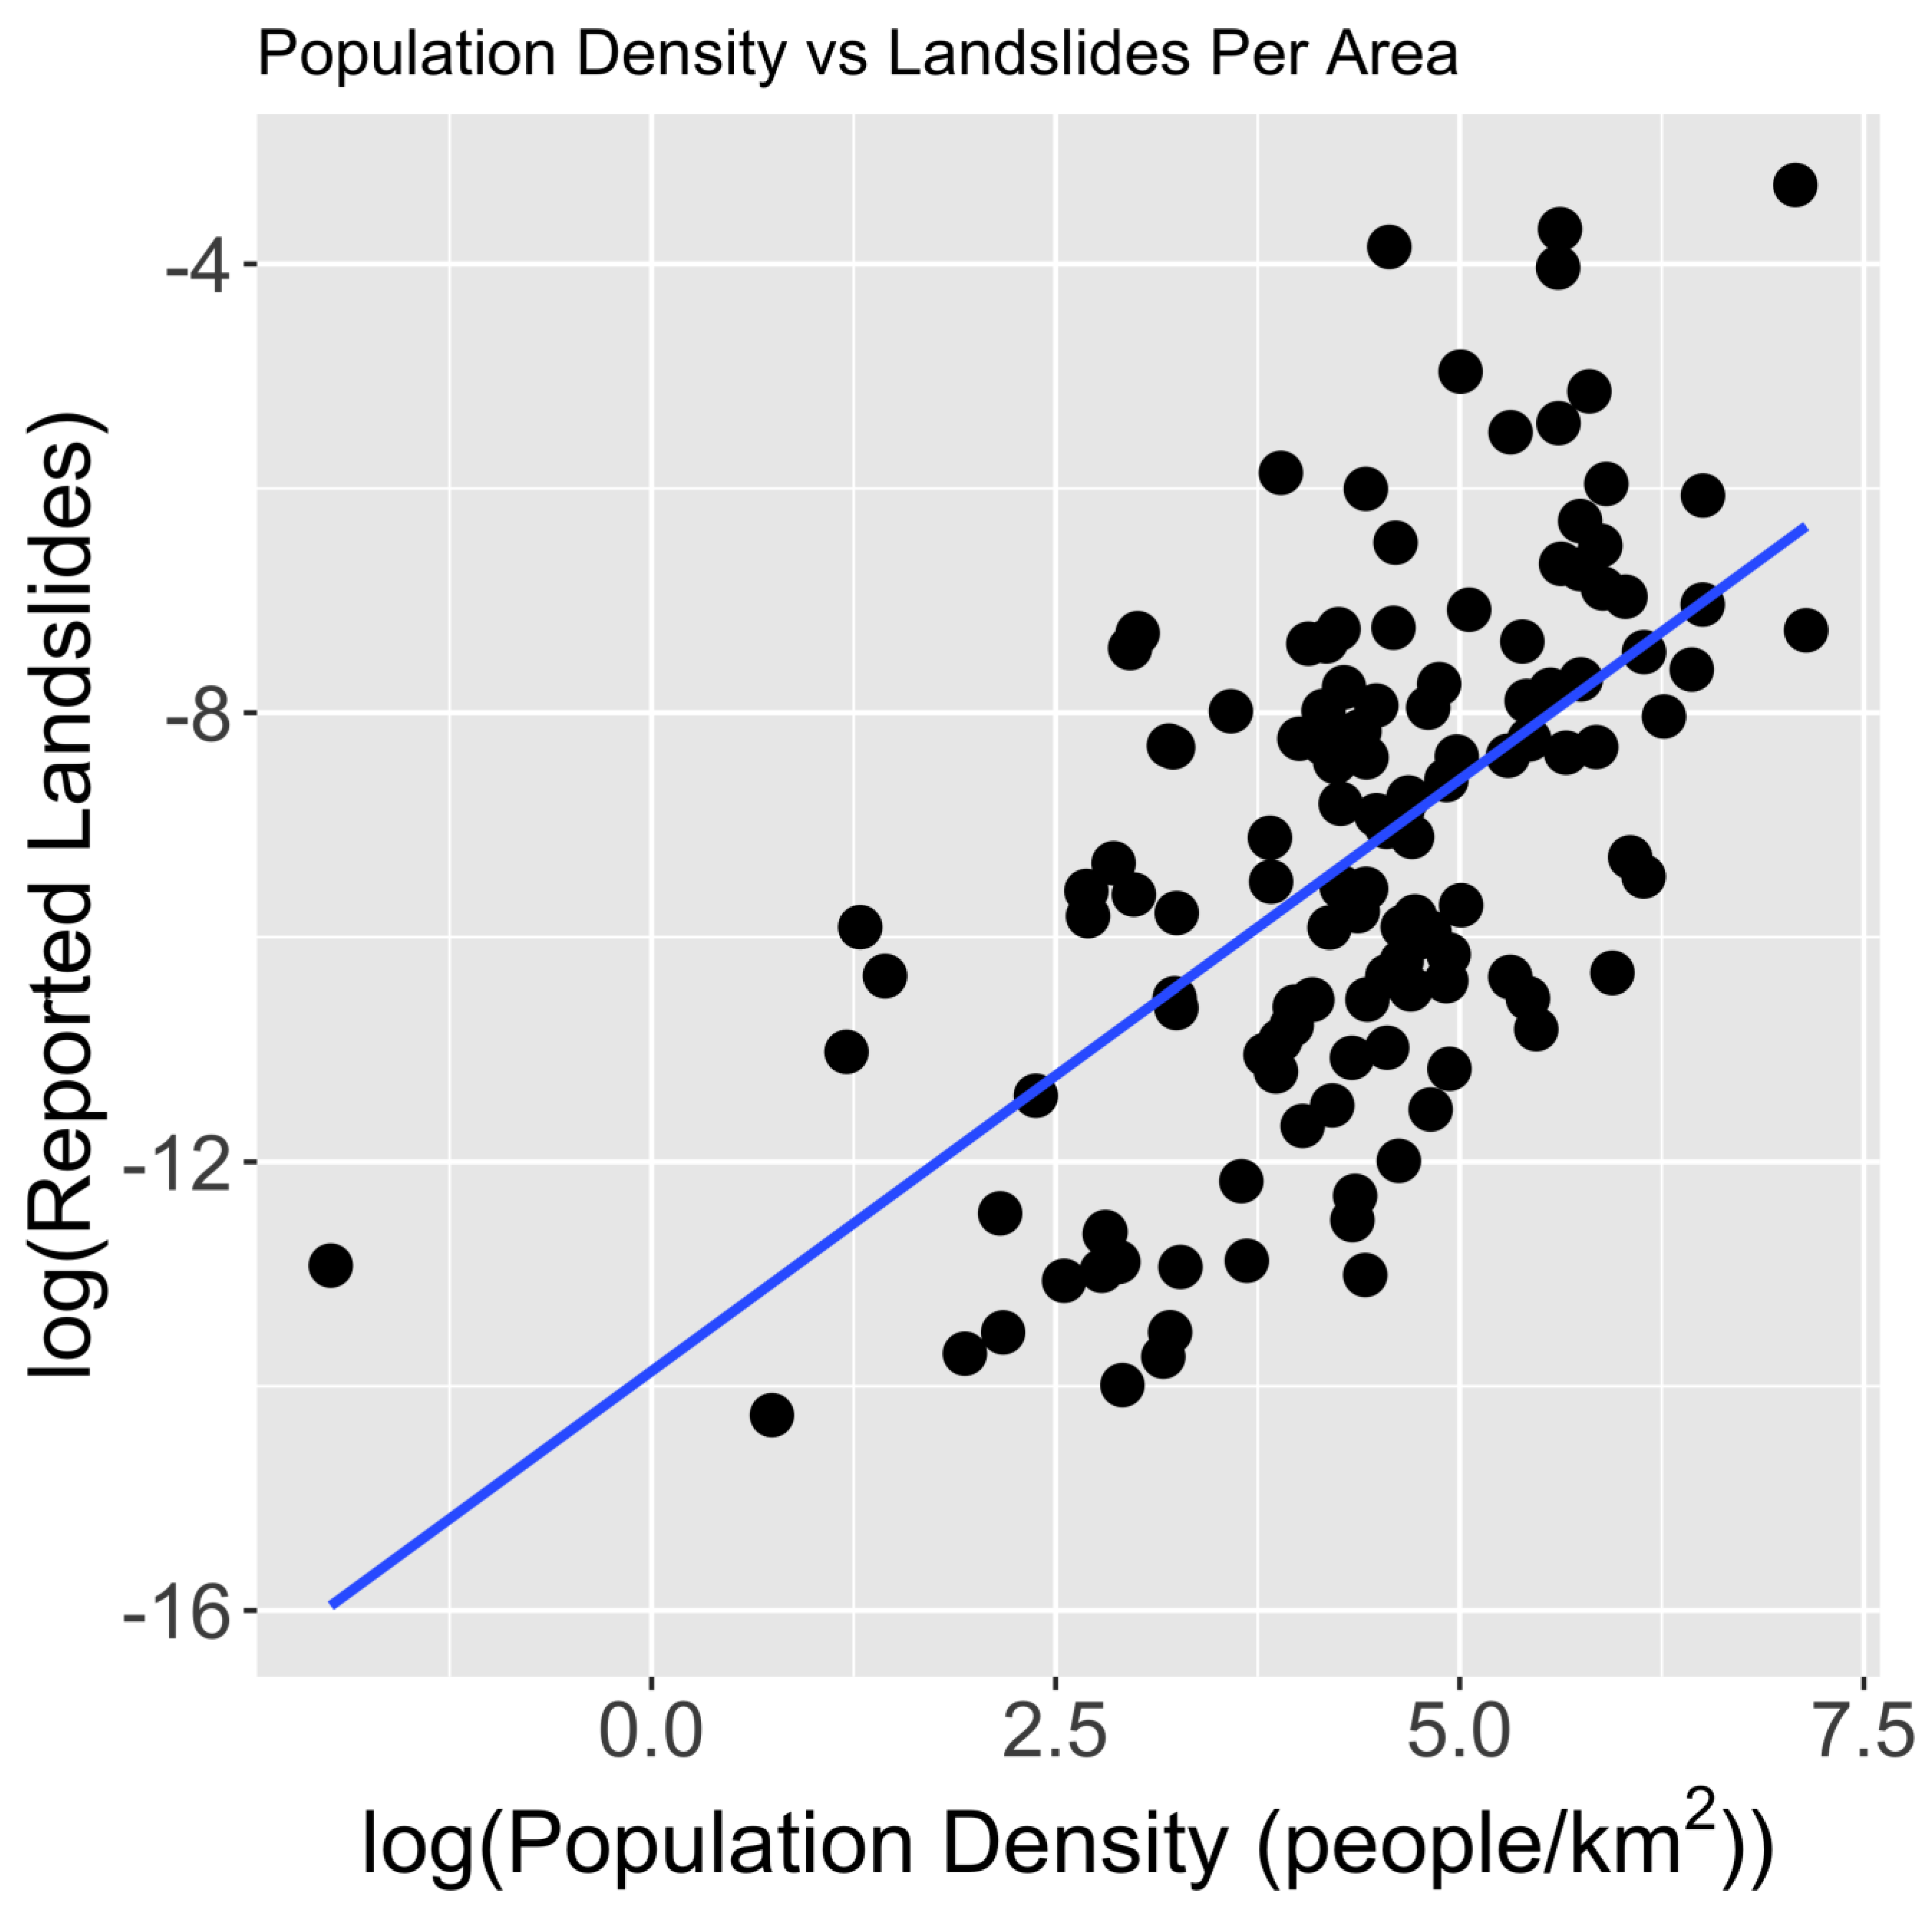
Economic variables are compared against landslide activity reported in the GLC to determine the effect of a country’s economic status on landslide event reporting. The income status of each country is classified as low, lower middle, upper middle, or high and compared against the number of reported landslide events as well as landslide density. The landslide density is determined by the number of events in the GLC per land area of each country. The comparisons are shown in Figure 10A,B, respectively. The largest percentage of events (40.8%) was reported in lower middle income status countries, which is slightly higher than the percentage of events reported in high income status countries (39.9%), and interestingly, only 18.1% of events were reported in countries associated with upper middle income status (Figure 10A). In both income status comparisons with number of events and landslide density, countries considered to have low income status represent much less landslide activity (less than 2%) compared to higher income statuses. However, countries classified as having high income status experienced greater landslide density than countries with lesser income statuses, and an increase in landslide density with increasing economic status is apparent in Figure 10B. Furthermore, the gross domestic product (GDP) per capita is compared against landslide event density for countries represented in the GLC and is shown in Figure 11, which reveals a positive correlation between the two variables. The countries shown represent the top 25% of countries with the highest GDP per capita to highlight outliers within the comparison. Similarly, the population density of each country represented in the GLC is compared against landslide density in Figure 12. This comparison reveals a positive correlation between population density and landslide reporting, which can be explained by increased landslide exposure near dense populations. However, the trend of increased GLC events in wealthier or more populated countries suggests that more landslides are reported but does not necessarily indicate that more landslide events occur in these countries.

4. Discussion

This study evaluates the spatial and temporal distribution of global landslide events and global patterns of landslides represented in this dataset including hotspot location and investigation of fatalities associated with landslides. The most notable landslide event hotspots at global scale appear to be in the Pacific Northwest, High Mountain Asia, and the Philippines as reported in the GLC. The GLC contains several outlier events that lead to large spikes in the data trend lines representing fatalities and number of events per month (Figure 1C, Figure 2C, Figure 3C, Figure 4C, Figure 5C, Figure 6C and Figure 7C). For example, the average number of fatalities in August for the continent of Africa is 133, almost twice as high as any other month (Figure 2C). The large number of August fatalities can be attributed to one outlier event that occurred during this month and reported 1141 fatalities. Similar spikes in fatalities can be seen in other geographic locations due to anomaly events with large fatality counts. While the accuracy of these descriptors is not analyzed in depth, important attributes such as landslide category, location accuracy, landslide size, and triggering mechanism reported with each landslide event were assessed and found mostly complete, which further supports the application of the GLC in rainfall-triggered landslide studies. Furthermore, the most landslide events were reported in English-speaking countries, but the most fatal landslide events were reported in India, China, and Nepal. This indicates a clear reporting bias in the GLC towards English-speaking countries.
A positive correlation was discovered between the economic status of countries and the landslide density present in that country’s borders, which indicates that richer countries are more prone to reporting landslides than poorer regions with less available resources. Countries with higher economic status have advanced natural disaster mitigation and more detailed landslide recording than low-income countries with less effort to prevent landslide disasters. This does not indicate that low-income countries have fewer landslides within their borders than high-income countries, but landslide events are reported more often and more precisely. Similarly, a positive relationship was found between population density and landslide reporting, which indicates that more landslides are reported in populated areas versus remote locations. Landslides are more likely to be reported in populated locations rather than remote areas due to greater risk of economic damage and casualties. These biases should be considered when applying the GLC. While the GLC shows a level of bias in regards to reporting language and underrepresentation of landslide activity in certain regions, it still can be beneficial for rainfall-triggered landslide research including landslide prediction and hazard awareness.

5. Conclusions

The research presented here evaluates the spatial and temporal distribution of global rainfall-triggered landslide reporting using NASA’s Global Landslide Catalog (GLC), which presents a minimum number of events and is recorded from 2007 to 2018. The collection of this dataset is no longer active and will not be updated past 2018. However, the GLC covers one of the largest spatiotemporal ranges of any landslide inventory. Hotspot analysis of global landslide reports and fatalities associated with landslides as well as temporal trends in reporting can be visualized using the GLC and show that most landslides occur in High Mountain Asia and the Pacific Northwest and more landslides occur globally from July to September. The majority of event locations reported in the GLC are known within a small radius of confidence and coincide with NASA’s global landslide susceptibility map. The GLC also contains various attributes that describe each event in terms of size, impact, location, and casualties. However, the GLC has several limitations that should be considered when using this dataset. The GLC represents global landslides with less spatial precision than local landslide inventories and inventories mapped via image analysis. Outliers in fatalities associated with landslide events make it difficult to assess temporal trends in global landslide casualties. Additionally, landslide reporting is geographically biased towards English-speaking populations largely due to the method of compiling the GLC. Landslide reporting also occurs more regularly and consistently in areas with high economic status compared to low economic regions. Similarly, this study reveals greater landslide reporting in areas with high population density, which can be attributed to increased landslide exposure near dense populations. Despite its limitations and biases, the GLC is shown to be a useful tool for rainfall-triggered landslide research.

Author Contributions

Conceptualization, C.D., T.A.S., D.B.K. and V.L.; methodology, C.D., T.A.S., D.B.K. and V.L.; validation, C.D., T.A.S., D.B.K. and V.L.; formal analysis, C.D.; data curation, C.D. and T.A.S.; writing—original draft preparation, C.D.; writing—review and editing, T.A.S., D.B.K. and V.L.; visualization, C.D.; supervision, T.A.S., D.B.K. and V.L.; project administration, T.A.S., D.B.K. and V.L.; funding acquisition, V.L. All authors have read and agreed to the published version of the manuscript.

Funding

C.D. was funded by the Graduate Assistance in Areas of National Need (GAANN) and ARCS Washington Metropolitan Chapter Scholarship. D.B.K. and T.A.S. were funded by NASA SERVIR Science Team (NNH18ZDA001N-18-SERVIR18_2-0036) and NASA’s Disasters program through the solicitation for Earth Science Applications: Disaster Risk Reduction and Response (NNH18ZDA001N).

Institutional Review Board Statement

Not applicable.

Informed Consent Statement

Not applicable.

Data Availability Statement

Publicly available datasets were analyzed in this study. The landslide inventory data presented in this study are openly available at https://doi.org/10.6084/m9.figshare.14199227; https://doi.org/10.1002/esp.3284; https://doi.org/10.1016/j.geomorph.2013.11.020; https://doi.org/10.5194/esurf-6-903-2018. Data available in a publicly accessible repository that does not issue DOIs can be found here: Gross Domestic Product per Capita: https://data.worldbank.org/indicator/NY.GDP.PCAP.CD (accessed on 15 March 2022); Land Area: https://data.worldbank.org/indicator/AG.SRF.TOTL.K2 (accessed on 15 March 2022); Population Density: https://data.worldbank.org/indicator/EN.POP.DNST (accessed on 15 March 2022); The Global Susceptibility Map: https://gpm.nasa.gov/landslides/projects.html (accessed on 15 March 2022); Hurricane Maria landslide inventory http://www.unitar.org/unosat/node/44/2762 (accessed on 15 March 2022).

Conflicts of Interest

The authors declare no conflict of interest.

References

  1. Crozier, M.J. Deciphering the effect of climate change on landslide activity: A review. Geomorphology 2010, 124, 260–267. [Google Scholar] [CrossRef]
  2. Gariano, S.L.; Guzzetti, F. Landslides in a changing climate. Earth-Sci. Rev. 2016, 162, 227–252. [Google Scholar] [CrossRef]
  3. Marc, O.; Jucá Oliveira, R.A.; Gosset, M.; Emberson, R.; Malet, J.P. Global assessment of the capability of satellite precipitation products to retrieve landslide-triggering extreme rainfall events. Earth Interact. 2022, 26, 122–138. [Google Scholar] [CrossRef]
  4. Froude, M.J.; Petley, D.N. Global fatal landslide occurrence from 2004 to 2016. Nat. Hazards Earth Syst. Sci. 2018, 18, 2161–2181. [Google Scholar] [CrossRef]
  5. Emberson, R.; Kirschbaum, D.B.; Amatya, P.; Tanyas, H.; Marc, O. Insights from the topographic characteristics of a large global catalog of rainfall-induced landslide event inventories. Nat. Hazards Earth Syst. Sci. 2022, 22, 1129–1149. [Google Scholar] [CrossRef]
  6. Kirschbaum, D.B.; Adler, R.; Hong, Y.; Hill, S.; Lerner-Lam, A. A global landslide catalog for hazard applications: Method, results, and limitations. Nat. Hazards 2010, 52, 561–575. [Google Scholar] [CrossRef]
  7. Kirschbaum, D.B.; Adler, R.; Adler, D.; Peters-Lidard, C.; Huffman, G. Global distribution of extreme precipitation and high-impact landslides in 2010 relative to previous years. J. Hydrometeorol. 2012, 13, 1536–1551. [Google Scholar] [CrossRef]
  8. Kirschbaum, D.; Stanley, T.; Zhou, Y. Spatial and temporal analysis of a global landslide catalog. Geomorphology 2015, 249, 4–15. [Google Scholar] [CrossRef]
  9. Juang, C.S.; Stanley, T.A.; Kirschbaum, D.B. Using citizen science to expand the global map of landslides: Introducing the cooperative open online landslide repository (COOLR). PLoS ONE 2019, 14, e0218657. [Google Scholar] [CrossRef]
  10. Petley, D. Global patterns of loss of life from landslides. Geology 2012, 40, 927–930. [Google Scholar] [CrossRef]
  11. Abella, E.A.C.; Van Westen, C.J. Generation of a landslide risk index map for Cuba using spatial multi-criteria evaluation. Landslides 2007, 4, 311–325. [Google Scholar] [CrossRef]
  12. Chang, K.T.; Chiang, S.H.; Chen, Y.C.; Mondini, A.C. Landslide hazard analysis for Hong Kong using landslide inventory and GIS. Comput. Geosci. 2004, 30, 429–443. [Google Scholar] [CrossRef]
  13. Guzzetti, F. Landslide fatalities and the evaluation of landslide risk in Italy. Eng. Geol. 2000, 58, 89–107. [Google Scholar] [CrossRef]
  14. Mirus, B.B.; Jones, E.S.; Baum, R.L.; Godt, J.W.; Slaughter, S.; Crawford, M.M.; Lancaster, J.; Stanley, T.; Kirschbaum, D.B.; Burns, W.J.; et al. Landslides across the USA: Occurrence, susceptibility, and data limitations. Landslides 2020, 17, 2271–2285. [Google Scholar] [CrossRef]
  15. Hughes, K.S.; Schulz, W.H. Map Depicting Susceptibility to Landslides Triggered by Intense Rainfall, Puerto Rico; U.S. Geological Survey Open-File Report 2020–1022; 1 plate, scale 1:150,000; U.S. Geological Survey: Reston, VA, USA, 2020; 91p. [CrossRef]
  16. Bhandary, N.P.; Dahal, R.K.; Timilsina, M.; Yatabe, R. Rainfall event-based landslide susceptibility zonation mapping. Nat. Hazards 2013, 69, 365–388. [Google Scholar] [CrossRef]
  17. Amatya, P.; Kirschbaum, D.; Stanley, T. Rainfall-induced landslide inventories for Lower Mekong based on Planet imagery and a semi-automatic mapping method. Geosci. Data J. 2022, 9, 315–327. [Google Scholar] [CrossRef]
  18. Marc, O.; Stumpf, A.; Malet, J.P.; Gosset, M.; Uchida, T.; Chiang, S.H. Initial insights from a global database of rainfall-induced landslide inventories: The weak influence of slope and strong influence of total storm rainfall. Earth Surf. Dyn. 2018, 6, 903–922. [Google Scholar] [CrossRef]
  19. Bessette-Kirton, E.K.; Cerovski-Darriau, C.; Schulz, W.H.; Coe, J.A.; Kean, J.W.; Godt, J.W.; Thomas, M.A.; Stephen Hughes, K. Landslides triggered by Hurricane Maria: Assessment of an extreme event in Puerto Rico. GSA Today 2019, 29, 4–10. [Google Scholar] [CrossRef]
  20. Guzzetti, F.; Cardinali, M.; Reichenbach, P. The AVI project: A bibliographical and archive inventory of landslides and floods in Italy. Environ. Manag. 1994, 18, 623–633. [Google Scholar] [CrossRef]
  21. Amatya, P.; Kirschbaum, D.; Stanley, T. Use of very high-resolution optical data for landslide mapping and susceptibility analysis along the Karnali highway, Nepal. Remote Sens. 2019, 11, 2284. [Google Scholar] [CrossRef]
  22. Lin, Q.; Wang, Y. Spatial and temporal analysis of a fatal landslide inventory in China from 1950 to 2016. Landslides 2018, 15, 2357–2372. [Google Scholar] [CrossRef]
  23. Chandrasekaran, S.S.; Sayed Owaise, R.; Ashwin, S.; Jain, R.M.; Prasanth, S.; Venugopalan, R.B. Investigation on infrastructural damages by rainfall-induced landslides during November 2009 in Nilgiris, India. Nat. Hazards 2013, 65, 1535–1557. [Google Scholar] [CrossRef]
  24. Benz, S.A.; Blum, P. Global detection of rainfall-triggered landslide clusters. Nat. Hazards Earth Syst. Sci. 2019, 19, 1433–1444. [Google Scholar] [CrossRef]
  25. Culler, E.; Livneh, B.; Rajagopalan, B.; Tiampo, K. A data-driven evaluation of post-fire landslide susceptibility. Nat. Hazards Earth Syst. Sci. 2021, 1–24. [Google Scholar] [CrossRef]
  26. Whiteley, J.S.; Chambers, J.E.; Uhlemann, S.; Wilkinson, P.B.; Kendall, J.M. Geophysical Monitoring of Moisture-Induced Landslides: A Review. Rev. Geophys. 2019, 57, 106–145. [Google Scholar] [CrossRef]
  27. Lin, L.; Lin, Q.; Wang, Y. Landslide susceptibility mapping on a global scale using the method of logistic regression. Nat. Hazards Earth Syst. Sci. 2017, 17, 1411–1424. [Google Scholar] [CrossRef]
  28. Farahmand, A.; Aghakouchak, A. A satellite-based global landslide model. Nat. Hazards Earth Syst. Sci. 2013, 13, 1259–1267. [Google Scholar] [CrossRef]
  29. Liao, Z.; Hong, Y.; Wang, J.; Fukuoka, H.; Sassa, K.; Karnawati, D.; Fathani, F. Prototyping an experimental early warning system for rainfall-induced landslides in Indonesia using satellite remote sensing and geospatial datasets. Landslides 2010, 7, 317–324. [Google Scholar] [CrossRef]
  30. Kirschbaum, D.B.; Stanley, T.; Simmons, J. A dynamic landslide hazard assessment system for Central America and Hispaniola. Nat. Hazards Earth Syst. Sci. 2015, 15, 2257–2272. [Google Scholar] [CrossRef] [Green Version]
  31. Kirschbaum, D.B.; Adler, R.; Hong, Y.; Kumar, S.; Peters-Lidard, C.; Lerner-Lam, A. Advances in landslide nowcasting: Evaluation of a global and regional modeling approach. Environ. Earth Sci. 2012, 66, 1683–1696. [Google Scholar] [CrossRef]
  32. Food and Agriculture Organization Surface Area. Available online: https://data.worldbank.org/indicator/AG.SRF.TOTL.K2 (accessed on 15 March 2022).
  33. Food and Agriculture Organization and World Bank Population Density. Available online: https://data.worldbank.org/indicator/EN.POP.DNST (accessed on 15 March 2022).
  34. World Bank and OECD National Accounts data files GDP Per Capita. Available online: https://data.worldbank.org/indicator/NY.GDP.PCAP.CD (accessed on 15 March 2022).
  35. Stanley, T.A.; Kirschbaum, D.B. A heuristic approach to global landslide susceptibility mapping. Nat. Hazards 2017, 87, 145–164. [Google Scholar] [CrossRef]
  36. Chang, K.; Chiang, S.H.; Chen, Y.C.; Mondini, A.C. Modeling the spatial occurrence of shallow landslides triggered by typhoons. Geomorphology 2014, 208, 137–148. [Google Scholar] [CrossRef]
  37. Chen, Y.C.; Chang, K.T.; Chiu, Y.J.; Lau, S.M.; Lee, H.Y. Quantifying rainfall controls on catchment-scale landslide erosion in Taiwan. Earth Surf. Process. Landf. 2013, 38, 372–382. [Google Scholar] [CrossRef]
  38. van Westen, C.J.; Zhang, J. Landslides and Floods Triggered by Hurricane Maria. Unitar-Unosat. 2018. Available online: http://www.unitar.org/unosat/node/44/2762 (accessed on 15 March 2022).
  39. Vennari, C.; Salvati, P.; Bianchi, C.; Casarano, D.; Parise, M.; Basso, A.; Marchesini, I. AReGeoDatHa: Apulian Regional GeoDatabase for geo-hydrological Hazards. J. Environ. Manag. 2022, 322, 116051. [Google Scholar] [CrossRef]
  40. Loo, Y.Y.; Billa, L.; Singh, A. Effect of climate change on seasonal monsoon in Asia and its impact on the variability of monsoon rainfall in Southeast Asia. Geosci. Front. 2015, 6, 817–823. [Google Scholar] [CrossRef]
  41. Petley, D.N.; Hearn, G.J.; Hart, A.; Rosser, N.J.; Dunning, S.A.; Oven, K.; Mitchell, W.A. Trends in landslide occurrence in Nepal. Nat. Hazards 2007, 43, 23–44. [Google Scholar] [CrossRef]
  42. Leiba, M. Impact of landslides in Australia to December 2011. Aust. J. Emerg. Manag. 2013, 28, 30–36. [Google Scholar]
Figure 1. (A) Global susceptibility map overlaid with landslide events and hotspot estimation (red); (B) Total and percentage of reports and number of fatalities for each landslide susceptibility class; (C) Average number of reports and fatalities for each month.
Sustainability 15 03323 g001
Figure 2. (A) Susceptibility map of Africa overlaid with landslide events and fatalities; (B) Total and percentage of reports and number of fatalities for each landslide susceptibility class over Africa; (C) Average number of reports and fatalities for each month over Africa.
Sustainability 15 03323 g002
Figure 3. (A) Susceptibility map of Asia overlaid with landslide events and fatalities; (B) Total and percentage of reports and number of fatalities for each landslide susceptibility class over Asia; (C) Average number and percentage of reports and fatalities for each month over Asia.
Sustainability 15 03323 g003
Figure 4. (A) Susceptibility map of Europe overlaid with landslide events and fatalities; (B) Total and percentage of reports and number of fatalities for each landslide susceptibility class over Europe; (C) Average number and percentage of reports and fatalities for each month over Europe.
Sustainability 15 03323 g004
Figure 5. (A) Susceptibility map of North America overlaid with landslide events and fatalities; (B) Total and percentage of reports and number of fatalities for each landslide susceptibility class over North America; (C) Average number and percentage of reports and fatalities for each month over North America.
Sustainability 15 03323 g005
Figure 6. (A) Susceptibility map of Oceania overlaid with landslide events and fatalities; (B) Total and percentage of reports and number of fatalities for each landslide susceptibility class over Oceania; (C) Average number and percentage of reports and fatalities for each month over Oceania.
Sustainability 15 03323 g006
Figure 7. (A) Susceptibility map of South America overlaid with landslide events and fatalities; (B) Total and percentage of reports and number of fatalities for each landslide susceptibility class over South America; (C) Average number and percentage of reports and fatalities for each month over South America.
Sustainability 15 03323 g007
Figure 8. (A) Total number and percentage of total events by language; (B) Number of fatal events, percentage of total events, and number of fatalities by language.
Sustainability 15 03323 g008
Figure 9. The cumulative sum of reported events in the GLC for each year from 2007 to 2018.
Sustainability 15 03323 g009
Figure 10. (A) Total reported events per income status classification; (B) Landslide density (events per km2) per income status classification. The income status represents the reported income status of each country represented in the GLC.
Sustainability 15 03323 g010
Figure 11. The log of the Gross Domestic Product (GDP) per capita in US dollars versus the log of the landslide density (events per km2) for countries reported in the GLC with the highest reported GDP per capita.
Sustainability 15 03323 g011
Figure 12. The log of the Population density (people per km2) versus the log of the landslide density (events per km2) for each country reported in the GLC.
Sustainability 15 03323 g012
Table 1. Data descriptions and source information.
NameDescriptionSource
Global Landslide CatalogGlobal compilation of rainfall-triggered landslides from 2007 to 2018[6]
Area (km2)A country’s total area[32]
Population Density (people/km2)Midyear population divided by land area in square kilometers[33]
GDP per Capita (USD)Gross Domestic Product (GDP) divided by the midyear population[34]
Landslide HazardGlobal landslide susceptibility map[5,35]
Landslide InventoriesLandslide event inventories from 2008 to 2018[3,17,36,37,38]
Region-specific landslide inventory for the Apulian region of southern Italy collected from 2008 to 2016[39]
Table 2. Distribution of the radius of confidence of the reported location for all events.
Location AccuracyNumber of EventsPercentage of Total Events (%)
Exact138612.7
1 km218519.8
5 km317828.8
10 km143513.0
25 km147013.3
50 km7947.2
100 km250.2
250 km160.1
Unknown5424.8
Table 3. Distribution of reported landslide size for all events.
SizeNumber of EventsPercentage of Total Events (%)
Small319928.2
Medium688060.7
Large9007.9
Very large1181.0
Catastrophic80.1
Unknown2292.0
Table 4. Distribution of triggering mechanism for reported events in the GLC.
Triggering MechanismNumber of EventsPercentage of Total Events (%)
downpour483642.68
rain287425.37
unknown117410.36
continuous rain8397.41
tropical cyclone6015.30
monsoon2452.16
snowfall snowmelt1551.37
mining1171.03
construction1020.90
earthquake990.87
flooding920.81
no apparent trigger730.64
freeze–thaw410.36
other410.36
dam embankment collapse190.17
Leaking pipe170.15
volcano40.04
vibration10.01
Table 5. Rainfall-induced landslide event inventories used in this study.
LocationNumber of PointsRainfall Event DatePoints in GLCSizeLocation AccuracySource
Khao Phanom, Thailand22530 March 20112Large (1)5 km (2)[17]
Medium (1)
Falam, Myanmar508630–31 July 20151Medium5 km[17]
Hakha, Myanmar173730–31 July 20151Small5 km[17]
Thaphabath, Laos24211 September 20150 [17]
Mu Chang Chai, Vietnam12562–3 August 20170 [17]
Muong La, Vietnam7582–3 August 20170 [17]
Bat Xat, Vietnam9923–28 August 20171Large25 km[17]
Da Bac, Vietnam108610–11 October 20171Large5 km [17]
Phu Yen, Vietnam136810–11 October 20170 [17]
Tram Tau, Vietnam149010–11 October 20170 [17]
Sin Ho, Vietnam70723–24 June 20180 [17]
Tam Duong, Vietnam15923–24 June 20180 [17]
Than Uyen, Vietnam31223–24 June 20180 [17]
Vi Xuyen, Vietnam15723–24 June 20180 [17]
Hpa-An, Myanmar99228–30 July 20180 [17]
Phong Tho, Vietnam3023 August 20180 [17]
Xieng Ngeun, Laos117830 August 20180 [17]
Muong Lat, Vietnam171827 August–1 September 20180 [17]
Nha Trang, Vietnam20718 November 20181Medium5 km[17]
Blumenau, Brazil59720–25 November 20080 [18]
Teresópolis, Brazil726811–13 January 201116Medium (8)1 km (1)[18]
Large (4)5 km (9)
Very Large (4)10 km (6)
Salgar, Colombia13117–18 May 20150 [18]
Dominica175625–28 August 20151Large5 km[38]
Dominica21,37918–22 September 20170 [38]
Kii Province, Japan19012–5 September 20110 [18]
South Taiwan42915–18 July 20081Medium10 km[18,37]
Taiwan10,2366–9 August 20080 [18,36,37]
Disclaimer/Publisher’s Note: The statements, opinions and data contained in all publications are solely those of the individual author(s) and contributor(s) and not of MDPI and/or the editor(s). MDPI and/or the editor(s) disclaim responsibility for any injury to people or property resulting from any ideas, methods, instructions or products referred to in the content.