Article

Influence of Soluble Salt NaCl on Cracking Characteristics and Mechanism of Loess

School of Human Settlements and Civil Engineering, Xi’an Jiaotong University, Xi’an 710049, China
*
Author to whom correspondence should be addressed.
Sustainability 2023, 15(6), 5268; https://doi.org/10.3390/su15065268
Submission received: 30 January 2023 / Revised: 3 March 2023 / Accepted: 7 March 2023 / Published: 16 March 2023
(This article belongs to the Special Issue Geological Hazards and Risk Management)

Abstract

:
Under the conditions of drought, cracks are likely to appear in loess due to shrinkage, which leads to salt precipitation and accumulation on the surface of loess. Therefore, salinized lands are created in loess areas. Deep study into the influence of soluble salt content on the cracking characteristics and mechanism of loess is of great significance to engineering constructions, geological problems, and disaster prevention for salinized lands in loess regions. In this paper, free desiccation experiments were carried out on the loess samples with different NaCl concentrations (a soluble salt). A high-resolution digital camera was used to obtain the sequence images of loess during the drying process. With the advantage of digital image correlation (DIC) technology and the non-contact full-field strain measurement method, the local displacement and strain on the surface of loess samples were calculated. The microstructure and main elements distribution of loess samples were obtained by scanning electron microscopy (SEM) and energy-dispersive spectrum (EDS) methods. Finally, the influence of NaCl concentrations on cracking characteristics and mechanism of loess was analyzed. The results show that, with the increase in NaCl concentration, the evaporation rate of loess samples decreased and the residual water content increased. The NaCl content can prevent the development of desiccation cracks in loess.

1. Introduction

Loess is a special soil formed since the Quaternary. Defined by various pores and weak cementation, this soil is widely distributed throughout Asia, Europe, North America and South America. Loess in China is unique in the world because of its wide distribution, large thickness, typical sedimentation environment and complete topography [1]. As a special geotechnical material, loess has a sub-stable structure and a large number of pores. Its physical properties, chemical compositions and mechanical behaviors vary under the aqueous conditions [2]. Due to the special physical properties, microstructure and semi-arid climate of the Chinese Loess Plateau, cracks in the loess are likely to be generated. In addition, under drought conditions, salt accumulates in the loess easily on the surface of soil, resulting in different salinization degrees of land [3]. Salt is one of the important components in loess. It exists in the microstructure of loess as cement and skeleton particles and plays an important role in the formation of structural loess and strength. Due to soil salinization or leaching effects, the precipitation of salt from the loess will inevitably affect the integrity of the loess structure, resulting in variations in the mechanical behavior of the loess [4].
With global warming, arid climates are becoming more and more widespread. The phenomenon of cracks in loess due to desiccation is also common. The generation of cracks will have a significant impact on the mechanical and hydraulic properties of soil, leading to various geotechnical problems [5,6,7,8,9]. For example, in landfill projects, cracks in soil may lead to more serious water infiltration and landfill gas emissions, further polluting the surrounding groundwater and air [10,11]. In slope engineering, the drying cracks will increase the risk of water infiltration and further reduce the stability of slopes [12,13]. The cracks formed on the surface of loess slope under the arid climate conditions provide preferential channels for rainfall or evaporation. The salt content in soil is affected by various factors such as water flows in pores and temperature, resulting in the extremely unstable engineering properties of loess. With the effect of leaching, a large amount of salt in the loess is precipitated, forming a white layer on the loess surface. Salinization of loess is often accompanied by the geological problems such as erosion and water and soil loss [14]. Therefore, it is of great significance to carry out research about the impact of salt on the cracks of loess in northwestern China.
Research into the cracks in soil has always been a hot topic. In order to better analyze the evolution characteristics of cracks in soils, Miller et al. introduced the factor of crack strength to quantify the cracking degree of soil [7]. Péron et al. defined the cracking degree of soil with the number of cracks, crack spacing, opening degree of cracks, truncation angles and other parameters [15]. These studies showed that the development of cracks is affected by various factors. The shrinkage cracks of soil are closely related to its mineral compositions and contents, structures, densities, etc. [16,17]. In addition, factors from the natural environment, such as temperature, relative humidity, soil thickness, dry–wet cycle times, boundary conditions and soil size, also have important impacts on the cracks of soil [18,19]. However, there are relatively few studies about the effect of salts on cracks in soils. Waler et al. found that, under drying conditions, the proportions of the cracking area gradually decreased with the increase in soil salt content [20]. DeCarlo et al. found that, with the increase in NaCl concentration, the evaporation rate of the sample under the same conditions decreased. The time of the first crack occurrence was gradually delayed during the drying process. The critical water content corresponding to the first crack gradually decreased. The more salt the sample contains, the lower the degree of cracking on the surface of soil [3,21]. Meanwhile, the crack width, length, fractal dimension, etc., also decrease with the increase in salt content [3]. Some scholars have also studied the cracking mechanism of soils and found different cracking modes, including opening mode, sliding mode and tearing mode [22]. Wei et al. used digital image correlation methods to quantitatively analyze the cracking characteristics and mechanism of the two clays during drying [23].
Although many scholars have conducted numerous field observations [24] and laboratory tests [25,26,27] on the cracks of different soils, relatively few studies have taken the cracks in loess as a research topic. For example, Corte et al. conducted drying tests on Bloomington clay to explore the influence of soil density, soil sample thickness, etc., on cracks [16]. Wei et al. studied the cracking process, local strains and displacements evolutions of mixtures of kaolinite and montmorillonite [22]. Tang et al. studied the evaporation rate, volumetric shrinkage rate and crack evolution of Nanjing Xiashu clay during drying [28]. Lakshmikantha et al. carried out quantitative research on the cracking parameters of silt [29]. Cordero et al. conducted a study on the sequence of cracks in the mixtures of sand and clay [30]. There are few studies on the dynamics and related mechanisms of cracking mode formation in loess, which is a complex cohesive soil [31]. The spatio-temporal evolution characteristics of the stress field during the drying process of loess have not been quantitatively characterized, leads to a lack of data on the evolution of the stress field during the desiccation of loess.
Several studies showed that the content of Na+ and Cl in the loess is much higher than that of other ions [32,33]. Therefore, in this research, different percentages of NaCl to the loess are chosen for the purpose of analyzing the impact of salt concentration on the cracks in loess during the drying process. The development process of cracks is captured with a high-resolution camera. The parameters of cracks were quantitatively analyzed with an image processing software named PCAS [34,35,36,37]. Non-contact full-field strain analyses were conducted using VIC-2D software [18,19,22]. The local displacement and strain on the surface of loess samples were calculated during drying. At the same time, combined with the use pf scanning electron microscopy (SEM) and energy-dispersive spectrum (EDS) element analyses, the effect of salt on the microstructure of loess was interpreted. Through the above experimental methods, the development of cracks in loess was observed. The local displacements and strains on sample surface were quantitatively calculated, and the mechanism of how the soluble salt NaCl impacts on cracks of loess was explained. This study provides insights into factors which influence the evolutions of cracks in loess. In addition, the results are of significance for the understanding of geological disasters related to cracks in saline loess areas.

2. Materials and Methods

2.1. Materials

The soil samples used in this study were taken from Jingyang, Shaanxi Province, China from a depth of approximately 50 m and belonged to clayey loess [38]. The physical properties of the clayey loess are shown in Table 1. In addition, the grain size distribution curve, measured by the laser method, is shown in Figure 1. The clay content is 17% and the silt content is 82.7%. According to the classification standard, the loess belongs to low-plasticity clay (CL).

2.2. Experimental Methods

2.2.1. Free Desiccation Test

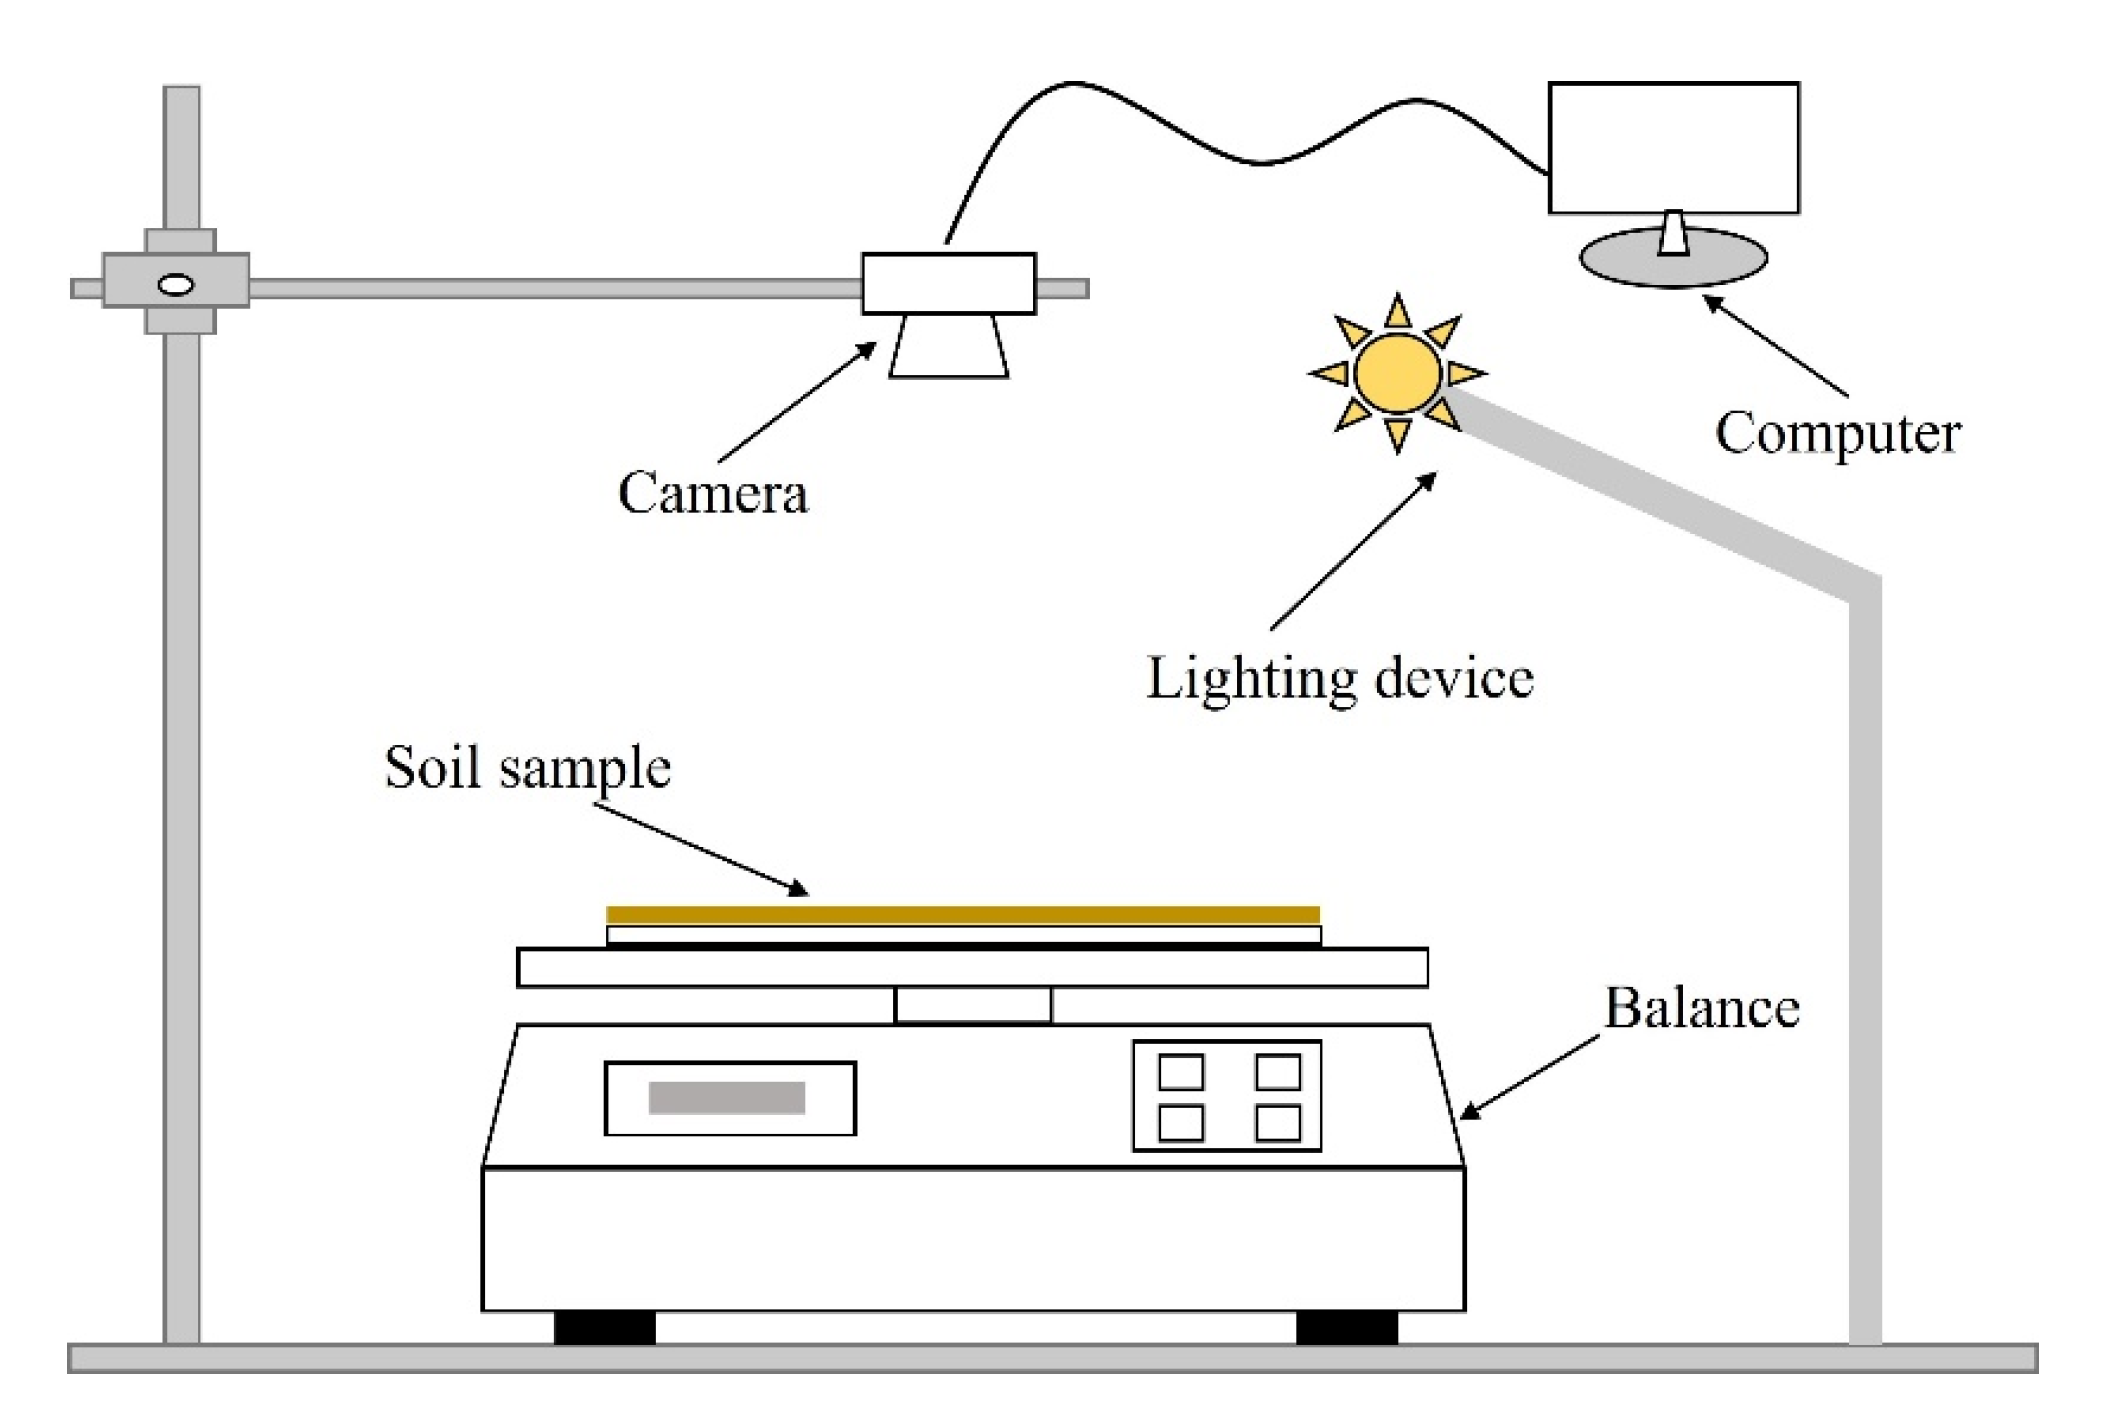
The free desiccation tests of loess with different NaCl concentration were carried out in the laboratory environment with a temperature of around 30 °C and a relative humidity of 35%. The test set-up consists of the soil sample, a balance, a high-resolution camera and a lighting device, as shown in Figure 2. The dimensions of loess samples are 300 mm (length) × 200 mm (width) × 4 mm (thickness), and they are placed on the plexiglass support. The high-resolution camera fixed above the loess sample is connected to a computer. Photos of a loess sample surface are taken at an interval of 10 min to record the whole cracking process. The balance below the sample records the sample weight during drying, which is then used to calculate the water content variations in the sample.

2.2.2. Preparation of Loess Samples with Different NaCl Concentration

In this study, the soluble salt NaCl is selected as the influence factor on the cracks in loess [32,33]. Chlorine-salinized and chlorite-salinized soils can be divided into non-saline soil (N < 0.3%), weakly saline soil (0.3% < N < 1.0%), medium saline soil (1.0% < N < 5.0%), strongly saline soil (5.0% < N < 8.0%) and hypersaline soil (N > 8.0%), where N presents the mass percentage of soluble salt content in 100 g dry soil. In order to eliminate the interference of other soluble salts on the test, the soluble salts in the sample were removed with distilled water before the test was performed. The process was carried out by taking a certain amount of disturbed loess and pouring it into the container, injecting distilled water, and then mixing them completely; removing the supernatant with bubble ball, refilling the container with distilled water; repeating the previous steps on approximately 5 occasions; and ensuring that most of the soluble salt is washed out. After the above process, the washed loess samples were put into the oven, ground and passed a 1 mm sieve. The loess sample without soluble salt were prepared [39,40,41,42,43,44,45]. In order to study the effect of NaCl concentration on the cracks in loess, four groups of tests were carried out in this research. These corresponded to the four different salinization degree of loess sample. The relevant parameters are shown in Table 2.
A certain amount of loess without soluble salts was put into the container. Then, the solutions of NaCl were prepared at different concentrations. The NaCl solutions were poured into the containers with loess and mixed evenly. Finally, slurry loess samples with initial water contents of 36%, equal to the liquid limit, were prepared. The samples were sealed with film for about 24 h to make the mixtures reach a homogeneous state.

2.2.3. Analysis of Crack Parameters with PCAS

PCAS is a software used for particle (pore) and crack recognition and analysis which was developed by Nanjing University. The original photos, taken by the high-resolution camera, are first treated by Photoshop in order to obtain photos with the same surface area and resolution. Then, the pretreated photos are imported into the PCAS software and the photos with cracks are binarized. PCAS software can automatically identify the blocks in the cracking network, repair the crack section, remove the impurities, and identify the crack network [34,35,36,37]. Finally, various geometric parameters of the crack network can be obtained, including the number of nodes, number, length, width, area, direction of cracks, etc. Taking the loess sample with 3.6% NaCl concentration at t = 50 h as an example, the image processing and results of PCAS are shown in Figure 3.

2.2.4. Digital Image Correlation Method

The digital image correlation (DIC) method [18,19,22] was used in this research. Random speckle patterns were created by spraying black paint onto the surface of the soil sample at a distance of about 50 cm from the surface of the loess samples. Speckle patterns are necessary in the DIC method to enable the image processing software to calculate the local surface displacements and strains. The DIC principle is to calculate the displacement and strain fields by correlating the speckle pixel subsets before and after the deformation of loess samples. The paint used in the tests is quick-drying and has good adhesion and compatibility. In this study, the local displacement and strain of loess samples during drying are calculated with commercial software VIC-2D, the accuracy of which is estimated to be better than about ±0.5% [22]. Considering the characteristics of the paint and the accuracy of the VIC-2D software, the drying of the paint barely affects the results of local displacements and strains. The following two displacement components and three strain components can be obtained with VIC-2D:
  • U (mm)—longitudinal displacement along x axis;
  • V (mm)—transversal displacement along y axis;
  • ε x x (%)—longitudinal strain along x axis;
  • ε y y (%)—transversal strain along y axis;
  • ε x y (%)—shear strain.
The above five components can be used to accurately analyze the cracking behavior of the loess samples during the drying process and to assess the influence of the sample heterogeneity. Figure 4 shows the longitudinal strains ε x x of the loess sample with 7.2% NaCl concentration at t = 4.67 h. The positive values of ε x x show tensile strains (in red or yellow) and the negative values denote compressive strains (in green, blue to purple). The white vectors in the figure show the displacement directions of the deformed specimen compared with the referenced specimen (0 h), and the length of the vector represents the value of the displacement. It is worth noting that near the boundaries of the cracks, VIC-2D software cannot calculate the displacement and strain because of the large deformations. These areas that cannot be calculated are shown in a gray color in Figure 4.

2.3. Microstructure Analysis with SEM

Different NaCl concentrations will affect the microstructure of loess, especially in the cementation degrees and cementation modes among soil particles. The mechanical properties and macroscopic cracking characteristics of soil will be further affected. Therefore, in this study, the cracking section of soil sample, after the free-drying test has been performed, is selected for use in SEM observation to analyze the variations in microstructures and cementations with different NaCl concentrations. Combined with the EDS element analysis method, the distribution of elements can be measured qualitatively and quantitatively to better analyze the cementation degree of NaCl.

3. Results and Discussion

3.1. Influence of NaCl to the Characteristics of Cracks in Loess

During the free-drying process, the concentration of NaCl influences the water content variations in loess samples. The curve of water content variations versus time of loess samples with different NaCl concentrations is shown in Figure 5. The initial water content of these four loess samples is 36%. The water content of all loess samples decreases in the beginning of desiccation and then samples become stable after a certain time. However, with the increase in NaCl concentration, the residual water content of loess samples increases gradually. The maximum and minimum residual water contents are 21.5% and 1.3%, respectively, corresponding to the sample with the maximum NaCl concentration of 10.8% and the minimum NaCl concentration of 0%. This is because the ion concentration in the pore water of the loess sample increases with the increase in NaCl concentration, resulting in the increase in the osmotic suction of water molecules. Therefore, the ability of water evaporation decreases during drying process in the samples with larger NaCl concentration.
NaCl has a great influence on the evolution characteristics of cracking in loess. By comparing the final crack patterns at the end of desiccation in these four loess samples, it can be found that, for the loess samples with 0%, 3.6% and 7.6% NaCl, crack networks are generated. However, for loess samples with 10.8% NaCl, there is no crack (Figure 6). With the increase in NaCl concentration, the cracks of loess samples become less developed.
In order to better analyze the influence of NaCl on the evolution characteristics of cracks in loess, the final crack patterns of different samples were analyzed with PCAS software (Figure 7). In addition, the quantitative analysis on the crack parameters of loess samples was carried out with PCAS, such as crack ratio, crack number, total crack length, etc. Figure 8 shows the evolution of crack parameters versus water contents. R s c is the surface crack ratio, that is, the ratio of the crack area to the total surface area of the loess sample. N c and L c represent the number and the total length of cracks, respectively.
It can be seen from Figure 8 that the crack parameters of loess samples, R s c , N c and L c , firstly increase and then stabilize with the decrease in the water content during the drying process. However, with the increase in NaCl concentration, the above three parameters all gradually decrease. The increase in NaCl concentration restrains the development of cracks in loess samples.

3.2. Influence of NaCl on Cracking Mechanisms in Loess

The appearance of cracks will result in the failure of loess. For drying cracks in loess, matrix suction and tensile strength are the two key mechanical parameters to controlling the initiation, evolution and stability of cracks. During the drying process of loess, the water in the soil begins to evaporate from the surface. The free water in the pores of loess is firstly evaporated. With continuous drying, the water in the interieur of loess will be continuously transferred to the upper water–air surface in order to maintain the evaporation. During this process, matrix suction and the surface tension of pore water will be generated. Thus, tensile stress will appear in the loess. When the tensile stress exceeds the tensile strength of loess, cracks will be generated and the tensile stress around the cracks will be released [28].
In order to understand the cracking mechanism of loess during the drying and shrinkage process of soil, the evolution characteristics of the stress, especially the tensile stress, is very significant. In this research, the local displacements and strains on the surface of the loess sample can be obtained by the DIC method. The longitudinal strain ε x x results of the loess sample with 0% NaCl at different times are taken as examples (Figure 9). At t = 2 h, the ε x x in zone A is relatively larger than that in other areas, equals to about 0.26% (Figure 9a), which indicates that there is strain energy accumulation in this zone. It can be predicted that more cracks will appear in zone A during the following drying process. When t = 8 h, a new crack was developed in zone A. From Figure 9b it can be observed that the energy accumulated in zone A has been released around the new crack and the strain field is readjusted. In the process of crack evolution, when the tensile stress exceeds the tensile strength of the soil, the crack is generated. The energy accumulated in related zones is released, and the strain field is readjusted [18,22].
For the purpose of analyzing the effect of NaCl on the cracking mechanism of loess, the loess samples with different NaCl concentrations were selected at the same time of t = 5 h. The strains ε x x of these four samples are presented in Figure 10. The maximum longitudinal strains ε x x m a x for these samples are 0.36%, 0.355%, 0.245% and 0.0011%, respectively (Figure 10a–d). With the increase in NaCl concentration in the loess sample, the maximum strain ε x x m a x of the loess sample at the same time gradually decreases. It is concluded that the increase in NaCl concentration reduces the energy accumulation capacity in the loess sample, thus slowing down the rate of crack evolution.
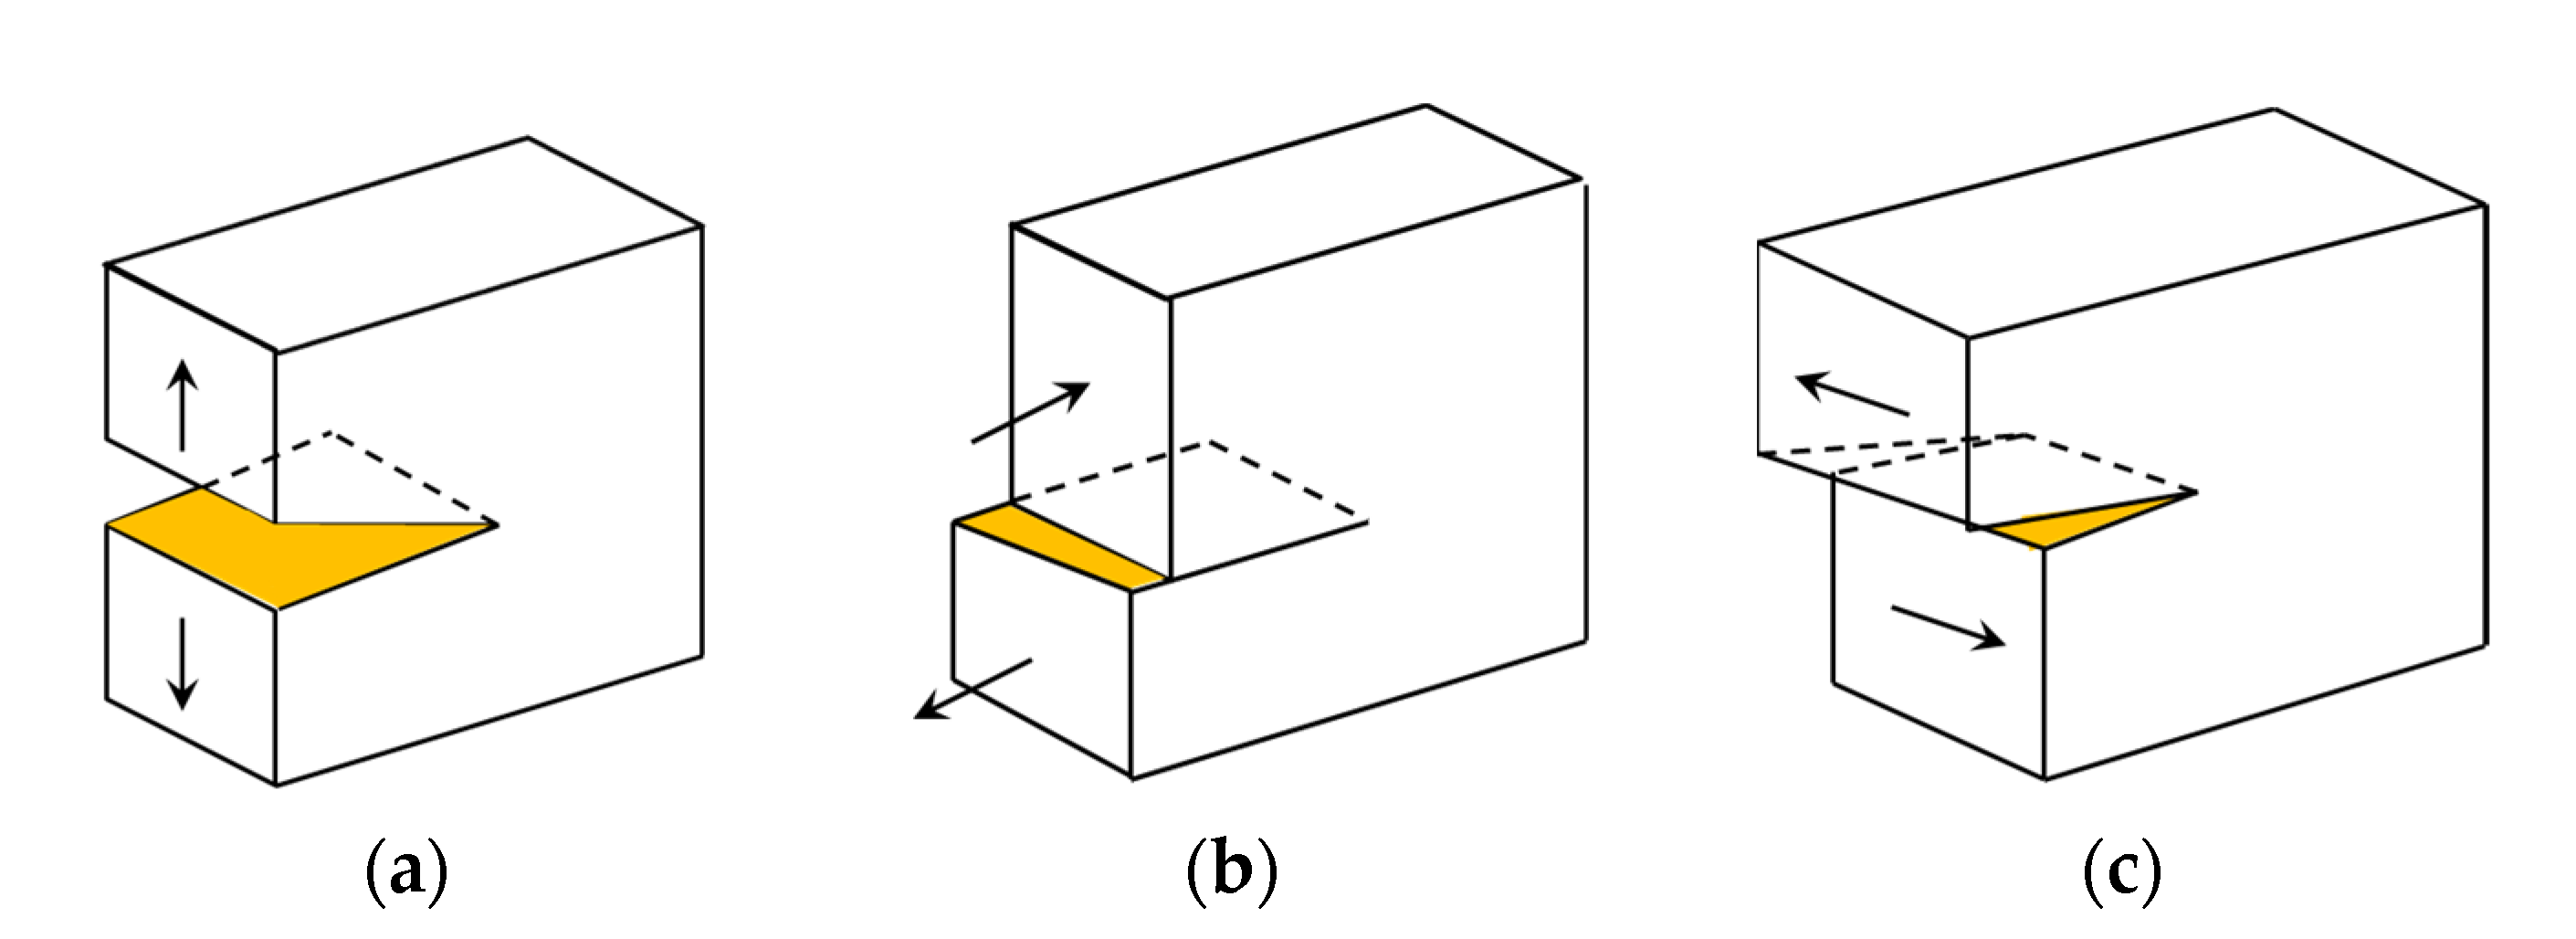
Some researchers have analyzed the distribution of strain and displacement near the cracks and concluded that there are three modes in the process of crack evolution, as shown in Figure 11: (1) opening mode; (2) sliding mode; (3) tearing mode [21]. The results of strain ε x x of loess samples with 0% NaCl and 7.2% NaCl are taken as examples to further explore the influence of NaCl concentration on cracking mode (Figure 12). The local displacement D on the surface of the loess sample can be decomposed into the components DPA and DPE, which are parallel and perpendicular to the direction of crack, respectively. When the directions of the displacements on both sides of the crack are perpendicular to the developing direction of crack, it indicates that the strains acting on both sides of the crack are mainly tensile. The crack is developed in the opening mode. When the directions of displacements of both sides of the crack are parallel to the developing direction of the crack, the crack is mainly formed by shear strain. It can be concluded that the crack corresponds to a shearing mechanism. As shown in Figure 12a, there are components DPA and DPE on both sides of the crack during drying in loess sample with 0% NaCl. It shows that there are tensile strains perpendicular to the developing direction of crack and shear strains parallel to the developing direction of crack on both sides. Therefore, in this crack, a mixed opening–sliding mechanism is activated (Figure 12a). In Figure 12b, for loess sample with 7.2% NaCl, the displacement directions of both sides of the crack are perpendicular to the extension direction of crack, which indicates an opening mode. As shown in Figure 12c, for a loess sample with 7.2% NaCl, a crack is developed in a mixed opening–sliding mode. It can be concluded that the opening mode and sliding modes exist in the drying process of loess samples with different NaCl concentrations. The NaCl concentration has no significant effect on the cracking modes of loess.

3.3. Microscopic Cracking Mechanism of Loess with Different NaCl Concentration

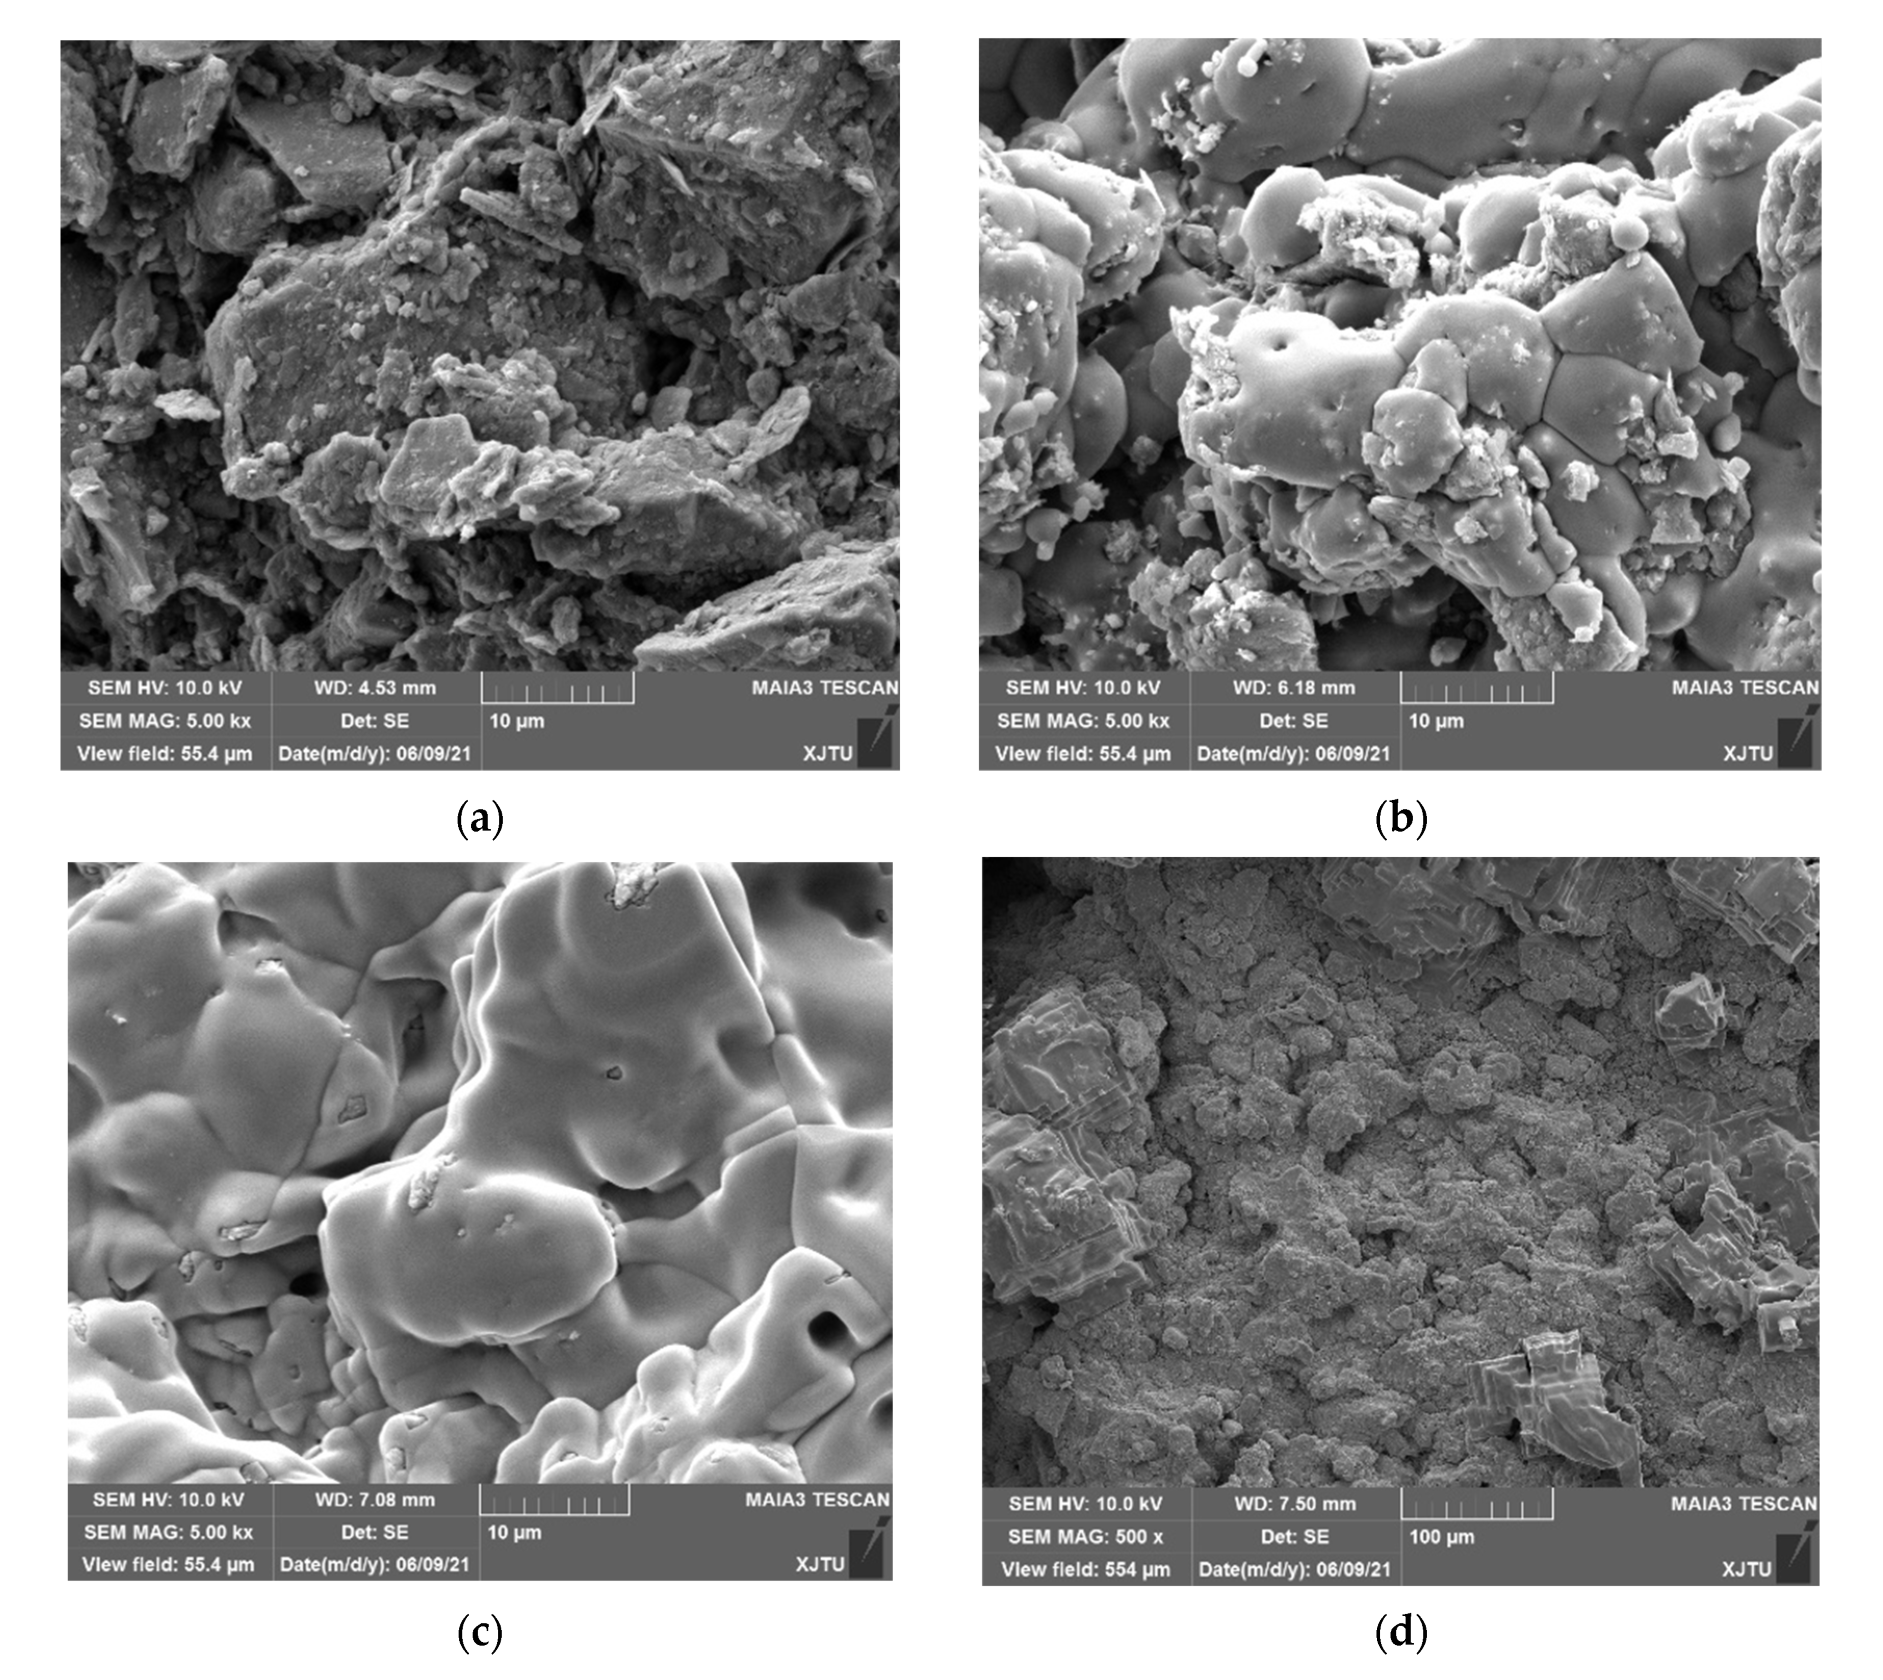
In order to better analyze the influence of NaCl on the cracking characteristics and mechanisms of loess from a microscopic perspective, this study uses scanning electron microscopy (SEM) methods to observe the microstructure of the cracking surface of loess samples with different NaCl concentrations at the end of the free desiccation test with the same magnification (5000 times), as shown in Figure 13.
Figure 13a shows SEM photos of loess sample with 0% NaCl. It can be observed that flaky clay particles are attached to the surface of the larger silt particles. There are many pores among the soil particles. Figure 13b shows the microstructure of the loess sample with 3.6% NaCl. Compared with the loess sample with 0% NaCl, the microstructure of loess samples with a small amount of NaCl has changed significantly at the end of the free-drying test. A layer of smooth cementation is produced on the surface of the loess particles. Some flaky clay particles and silt particles with larger particle size are flocculated and agglomerated with a layer of smooth film-like cementation, which significantly reduces the dimensions of pores among soil particles. Therefore, the microstructures of loess become more compacted. This can be explained by the interaction between NaCl and clay particles. The thickness of electric double layers can also be used for the variation of microstructures. Na+ in NaCl reacts with clay particles by cation exchange, which results in the flocculation and agglomeration of clay particles. Figure 13c shows the microstructure of loess sample with 7.2% NaCl. With the increase in NaCl concentration in loess samples, almost all flaky clay particles and larger silt particles are tightly cemented by the smooth layer. The cementation between soil particles is significantly enhanced. When the NaCl content increases to 10.8%, a large number of NaCl crystals precipitate from the loess sample during the free desiccation. Some of the NaCl crystals are with large volumes and are embedded between the soil particles or adhere to the structural surface, which plays an important role in cementing the soil particles, as shown in Figure 13d.
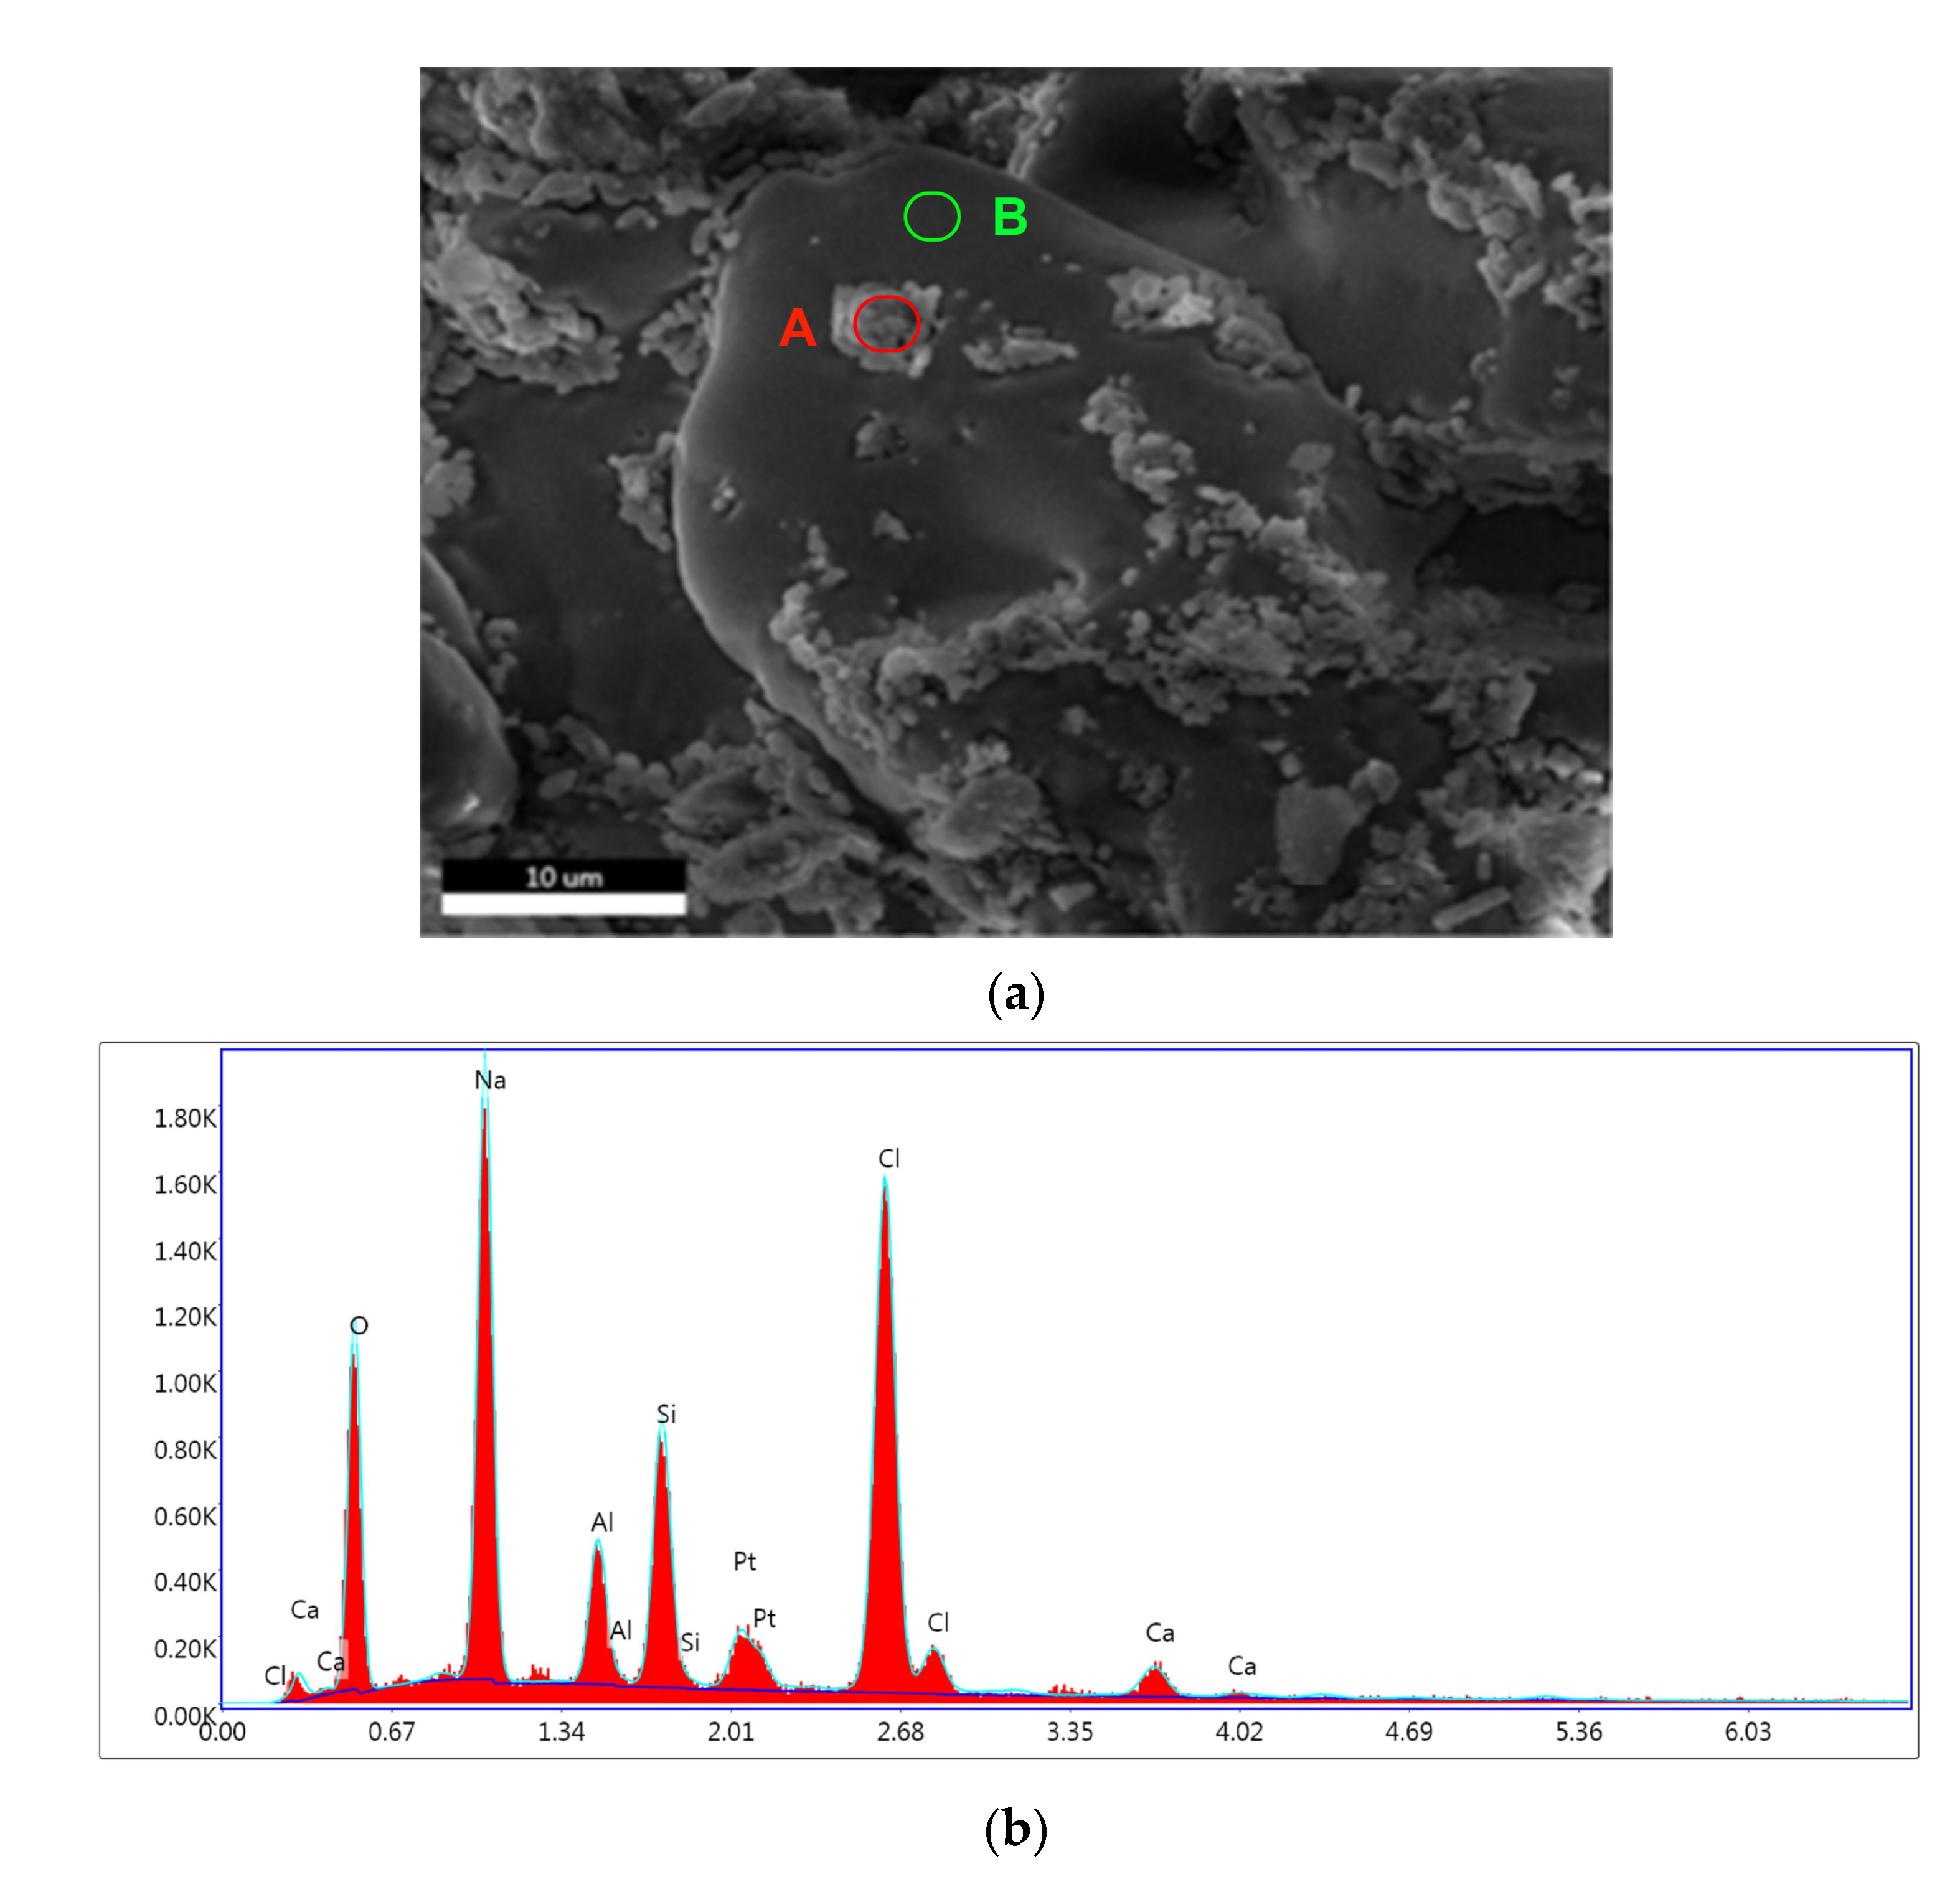
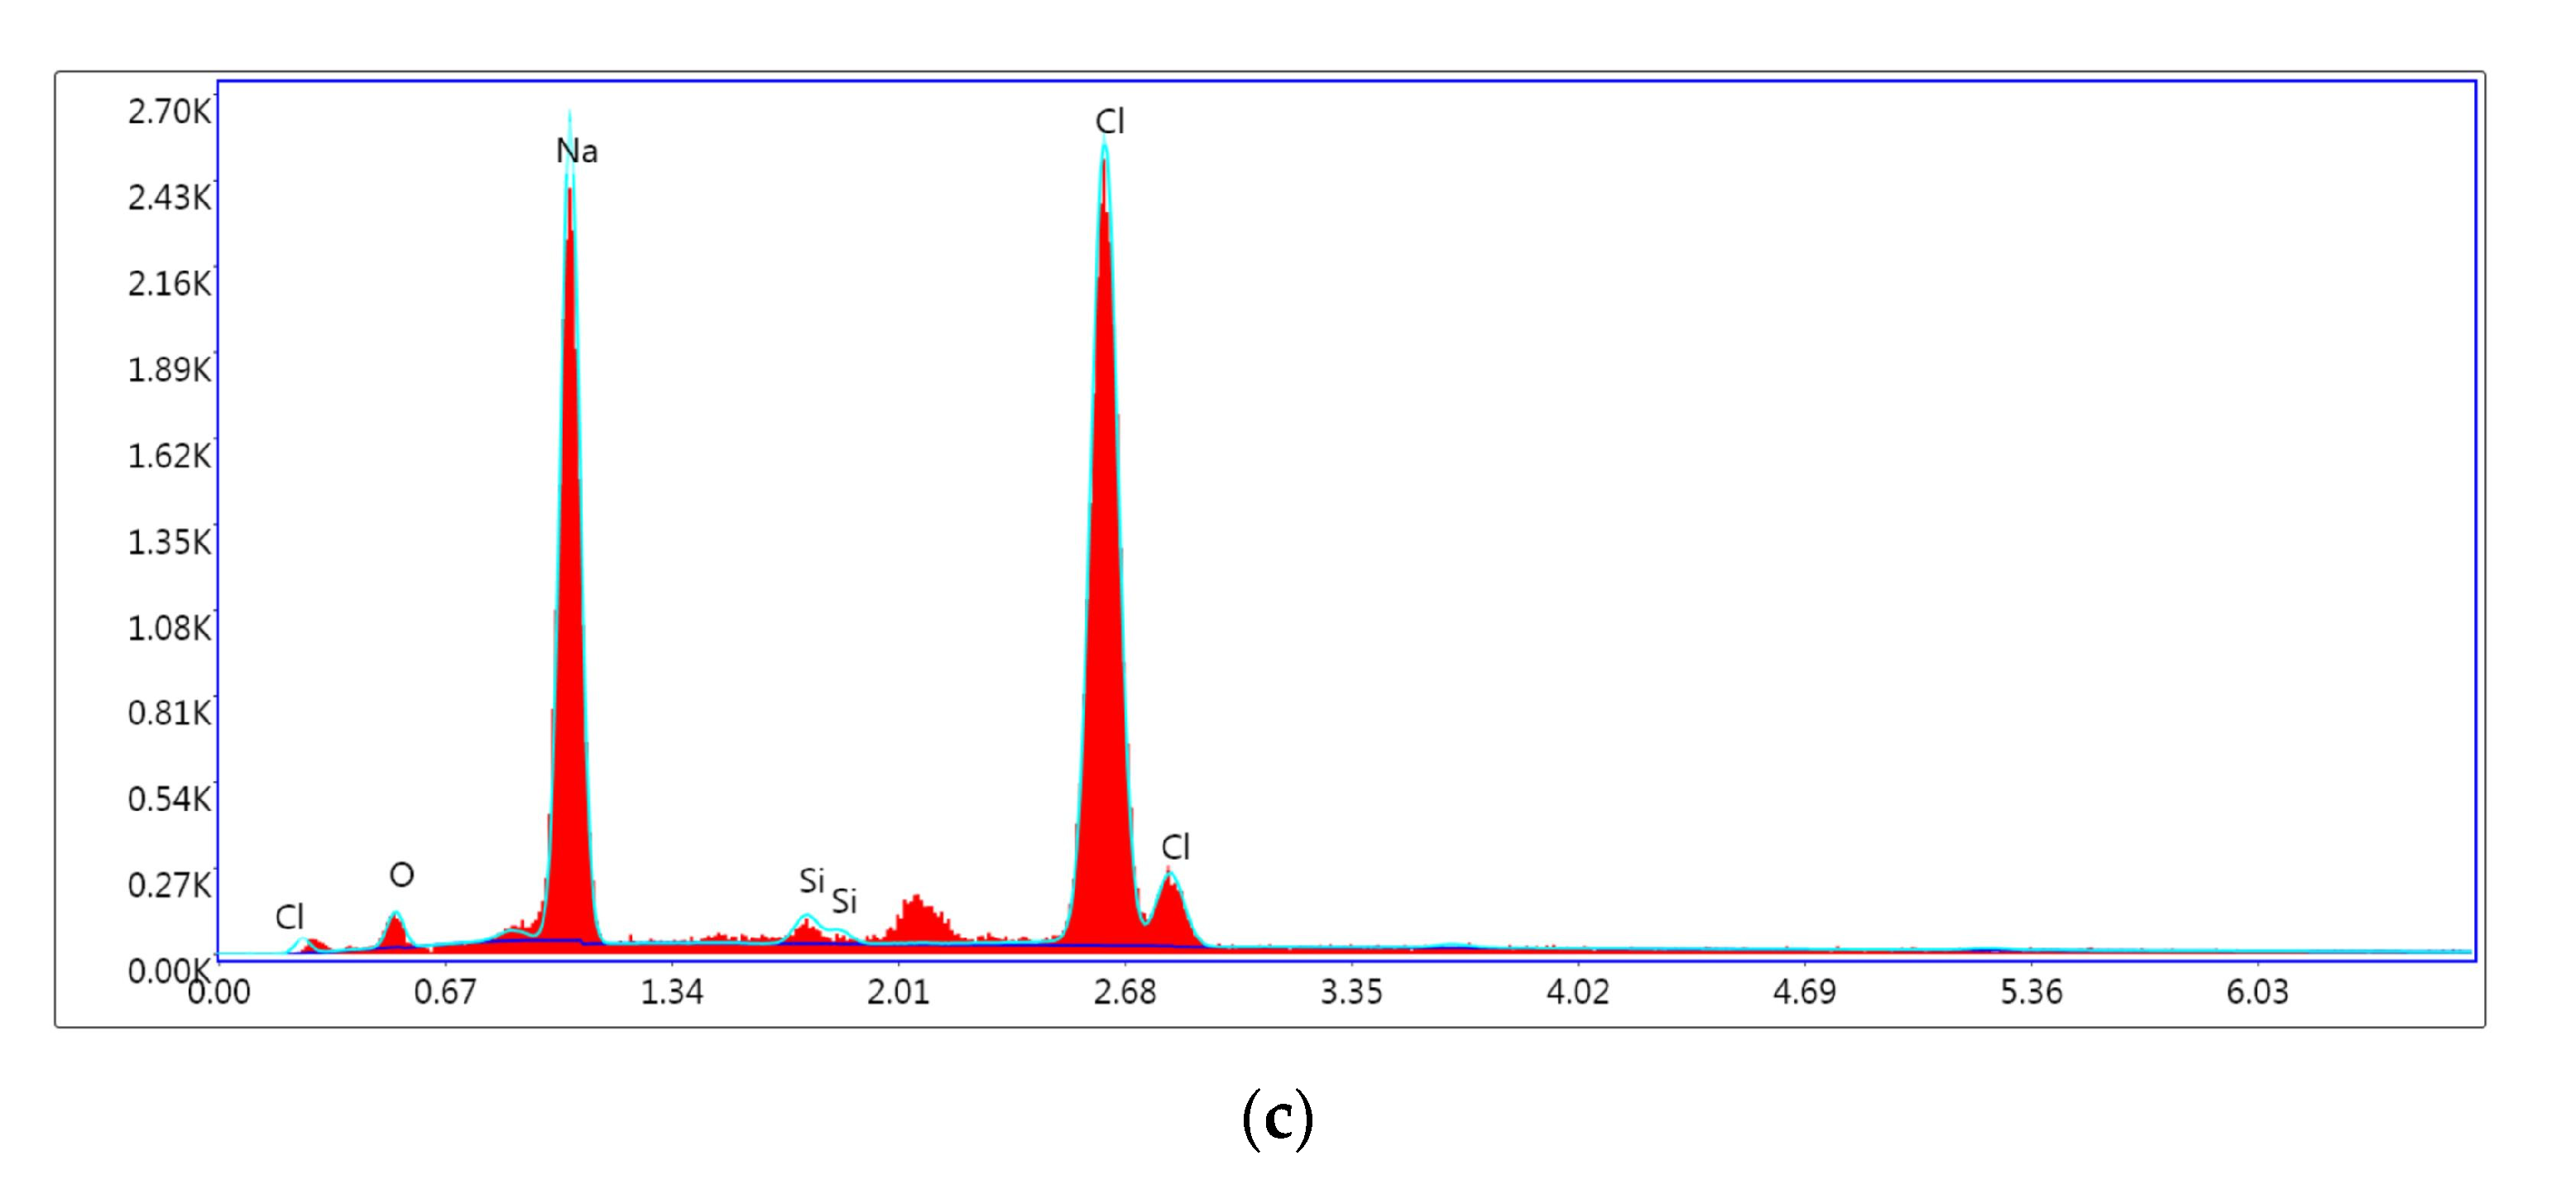
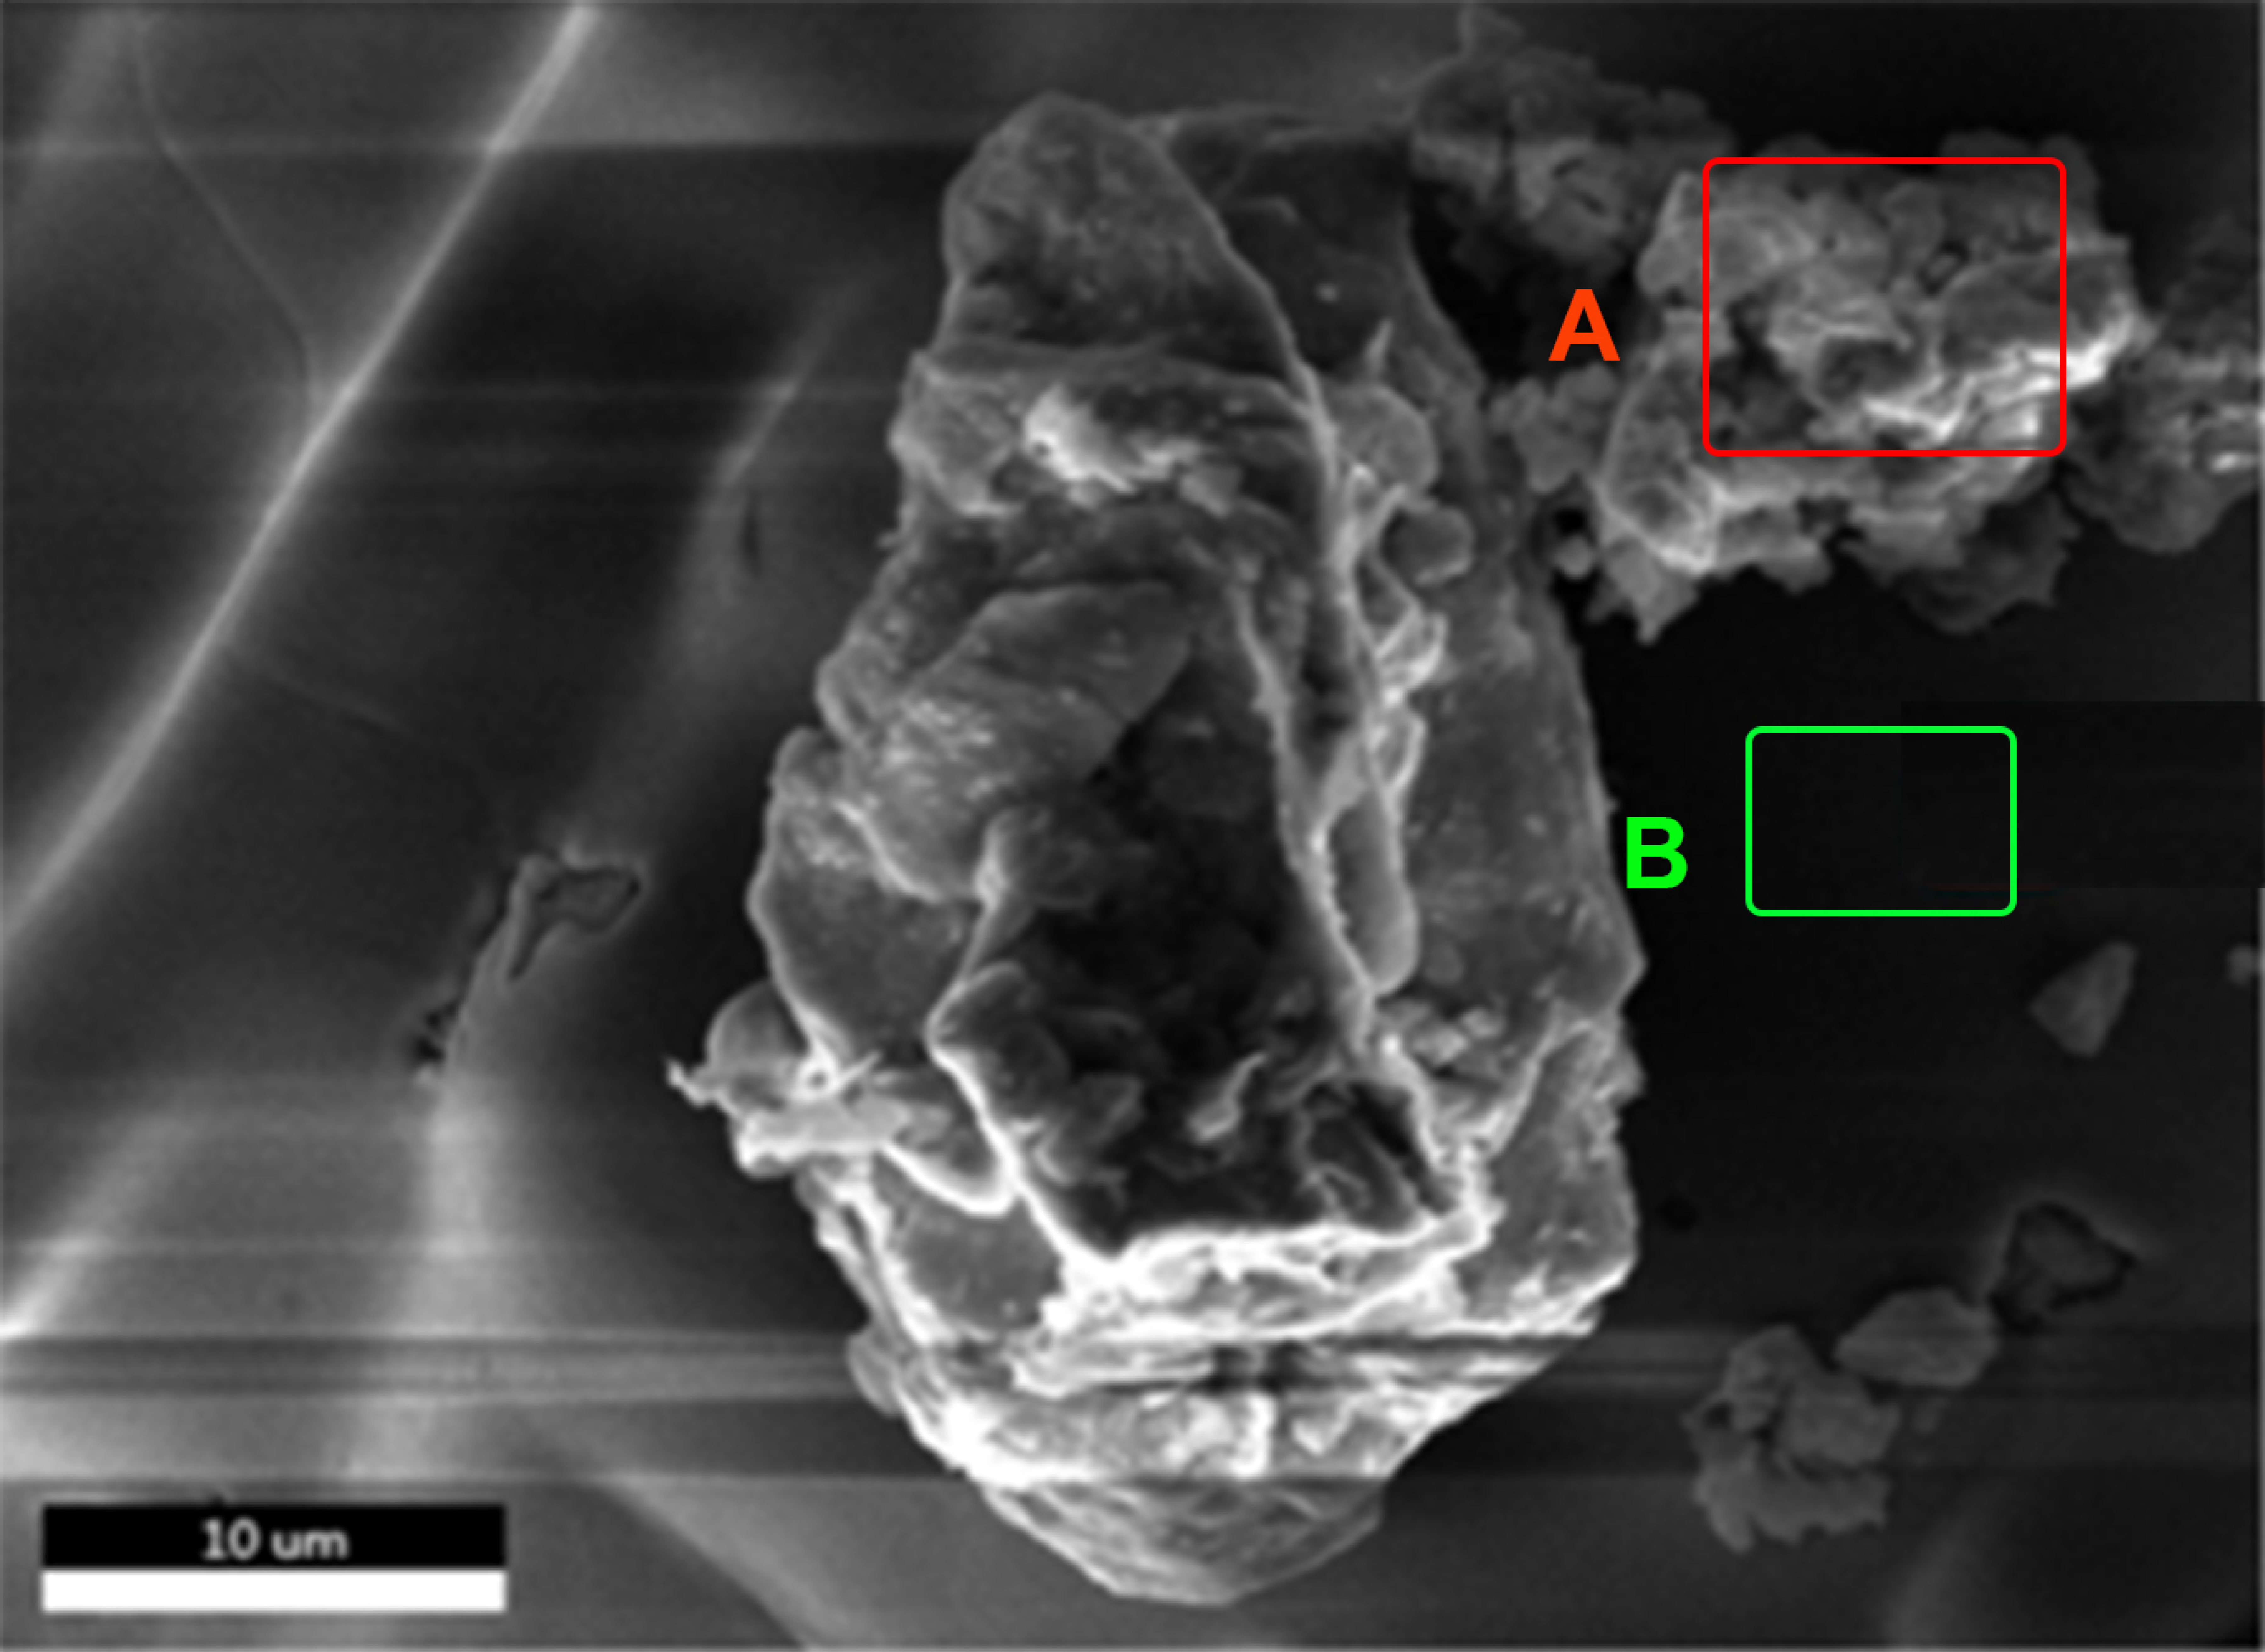
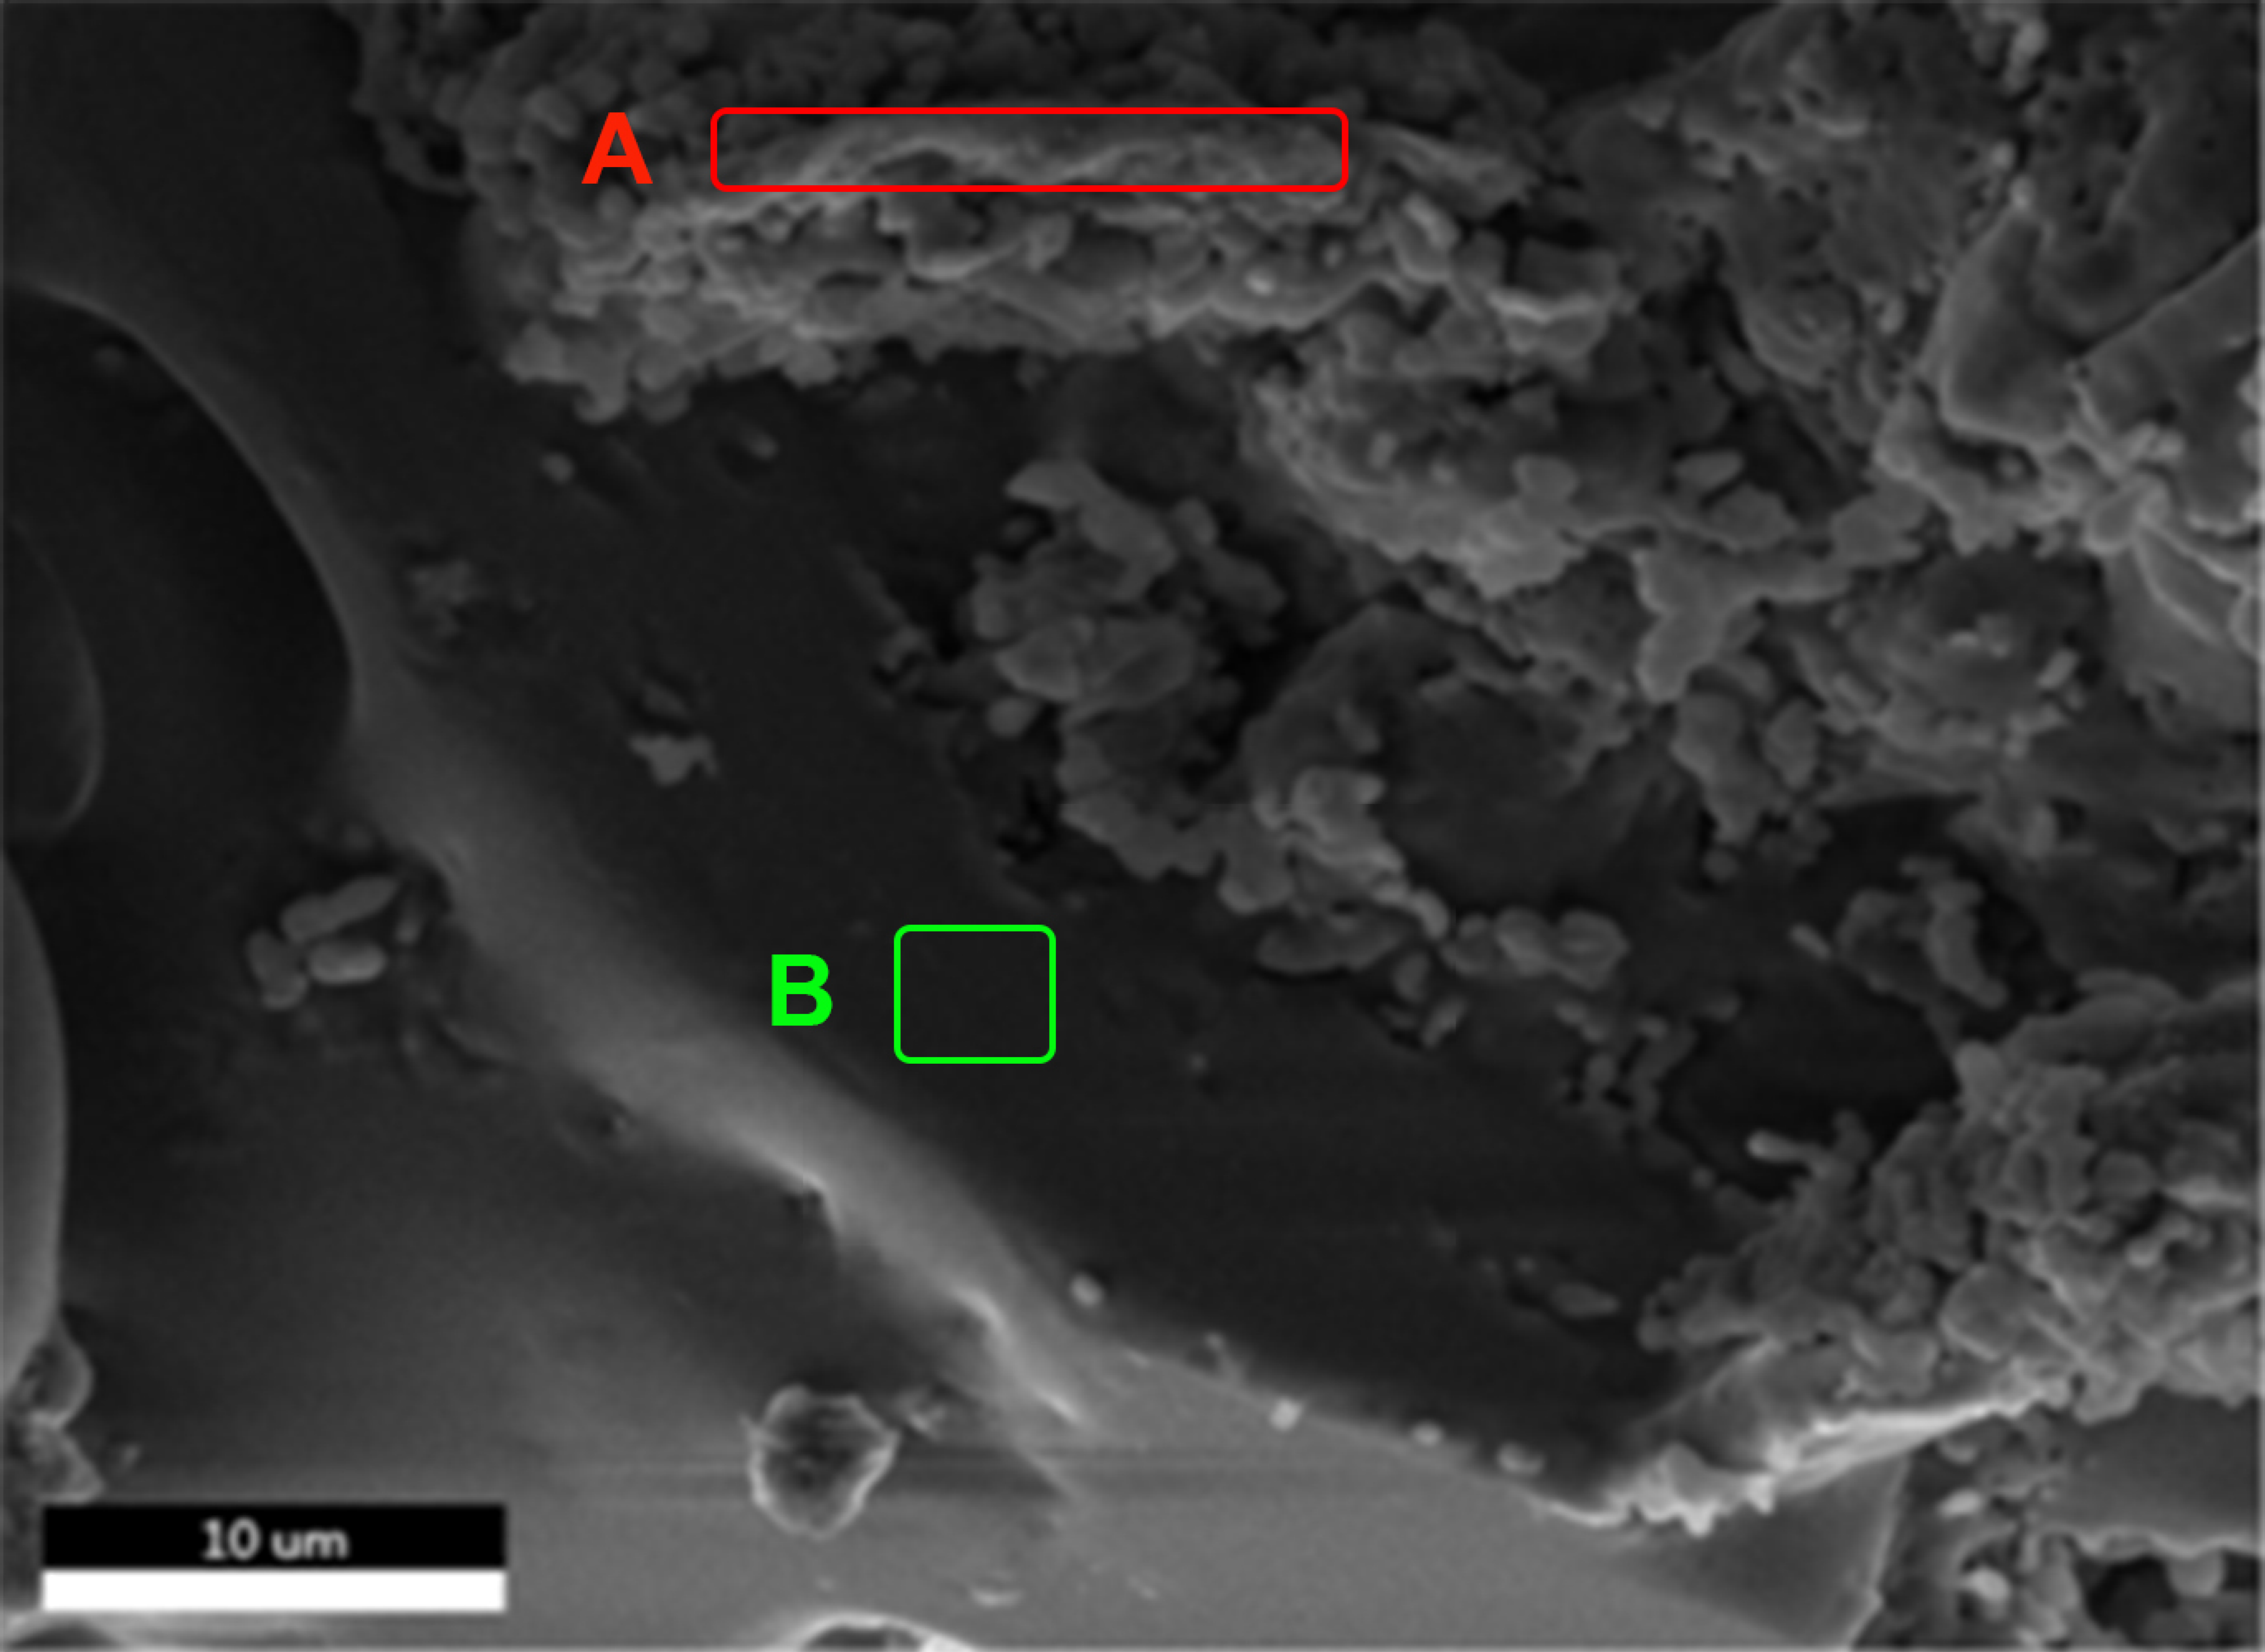
In order to further verify that the smooth layer on the surface of soil particles in the loess sample is caused by NaCl, the energy-dispersive spectrum (EDS) element analysis was combined with the SEM observation in different zones of the loess sample. Figure 14a shows the SEM image of the loess sample with 3.6% NaCl. Two zones, A and B, were selected on loess sample, which is on the soil particles and smooth layer, respectively. The element distributions diagrams in zones A and B, obtained from the EDS analysis are presented in Figure 14b,c. The related contents of elements are shown in Table 3. It is verified that for the smooth layer which cements the particles in zone B, the elements are mainly O, Si, Na and Cl, etc. The content of Na and Cl are larger than the other elements, which are 31.45% and 64.65%, respectively. In zone A, except the elements like Na and Cl, there are Al and Ca compared with the element in zone B. This is due to the existence of moderately soluble salt and insoluble salts, such as SiO2, CaCO3, Al2O3, in the salt content of loess [14]. The moderately soluble salt and insoluble salt were not eliminated during the sample preparation. Figure 15 and Figure 16 show the EDS analysis results of loess samples with 7.2% NaCl and 10.8% NaCl, respectively. The correspondent contents of element are presented in Table 4 and Table 5. The results are similar for these loess samples: for smooth layers, the main elements are Na and Cl. Therefore, the SEM observation combined with EDS analysis on loess samples with different concentration of NaCl identified that the smooth layer formed during the drying process is the cementation of NaCl, which increases the cementation of loess particles.
The above microscopic observations and analysis have confirmed the cementation degree in loess samples with different NaCl concentrations. For the loess samples with NaCl concentration of 3.6%, 7.2% and 10.8%, respectively, the flocculation and agglomeration of soil particles and smooth layer caused by Na+ make the cementation degree between soil particles become larger. Thus, the soil structure becomes denser, leading to the reduction in crack evolution of loess.

4. Conclusions

In this paper, the free desiccation tests were carried out on loess samples with different NaCl concentrations. The whole process of crack initiation and propagation was captured with a high-resolution camera. With the help of the image processing software named PCAS, the variations in the crack parameters of loess samples were assessed. With the DIC method, the local displacement and strain on the surface of the loess sample were calculated. The microstructure and the element distribution of loess samples were obtained by SEM and EDS. Finally, the influence of different NaCl concentration on the cracking characteristics and mechanism in loess was interpreted. The conclusions drawn are as follows:
(1)
With the increase in NaCl concentration, the evaporation rate of loess samples gradually decreases and the residual water content gradually increases during the free-drying process.
(2)
NaCl in the loess sample will restrain the development of cracks in loess. With the increase in NaCl concentration in the loess sample, some parameters of cracks in the loess sample, such as crack ratio, numbers, and total length, decrease.
(3)
Based on the local displacements and strains measurement results of the loess sample, the evolution characteristics of cracks can be predicted. The cracking modes in loess can be classified as opening, sliding and mixed opening–sliding modes. The concentration of NaCl does not affect the cracking modes of loess. The increase in NaCl reduces the accumulation capacity of energy in loess samples and decreases the rate of crack evolution.
(4)
During the free desiccation process, the NaCl in the loess sample will react with the mineral components in the clay to form a smooth layer, which has the function of cementing clay particles and making the soil structure compact. The cementation increases with the increase in NaCl concentration, thus restraining the crack evolution.

Author Contributions

Conceptualization, X.W.; methodology, X.W.; software, L.D.; validation, X.C. and Y.Z.; investigation, L.D. and X.C.; resources, X.W.; data curation, L.D.; writing—original draft preparation, X.W.; writing—review and editing, X.W. and L.D.; supervision, X.W.; project administration, X.W.; funding acquisition, X.W. All authors have read and agreed to the published version of the manuscript.

Funding

This research was funded by the National Natural Science Foundation of Youth, grant number 42007278 and the Fundamental Research Funds for the Central Universities, grant number xhj032021017-02.

Institutional Review Board Statement

Not applicable.

Informed Consent Statement

Not applicable.

Data Availability Statement

The data that support the findings of this study are available within the article.

Acknowledgments

Ling. X. of School of Human Settlements and Civil Engineering, Xi’an Jiaotong University provided the experimental devices and aided with the field investigation. The authors would like to extend their deepest gratitude to him.

Conflicts of Interest

The authors declare no conflict of interest.

References

  1. Xu, L.; Coop, M.R.; Zhang, M.S.; Wang, G.L. The mechanics of a saturated silty loess and implications for landslides. Eng. Geol. 2018, 236, 29–42. [Google Scholar] [CrossRef]
  2. Rogers, C.D.F.; Dijkstra, T.A.; Smalley, I.J. Hydroconsolidation and subsidence of loess: Studies from China, Russia, North America and Europe. Eng. Geol. 1994, 37, 83–113. [Google Scholar] [CrossRef]
  3. DeCarlo, K.F.; Shokri, N. Slinity effects on cracking morphology and dynamics in 3-D desiccating clays. Water Resour. Res. 2013, 50, 3052–3072. [Google Scholar] [CrossRef]
  4. Zuo, L.; Xu, L.; Baudet, B.A.; Gao, C.Y.; Huang, C. The structure degradation of a silty loess induced by long-term water seepage. Eng. Geol. 2020, 272, 105634. [Google Scholar] [CrossRef]
  5. Yesiller, N.; Miller, C.J.; Inci, G.; Yaldo, K. Desiccation and cracking behavior of three compacted landfill liner soils. Eng. Geol. 2000, 57, 105–121. [Google Scholar] [CrossRef] [Green Version]
  6. Morris, P.H.; Graham, J.; Williams, D.J. Cracking in drying soils. Can. Geotech. J. 1992, 29, 263–277. [Google Scholar] [CrossRef]
  7. Miller, C.J.; Mi, H.; Yesiller, N. Experimental analysis of desiccation cracking propagation in clay liners. J. Am. Water Resour. Assoc. 1998, 34, 677–686. [Google Scholar] [CrossRef] [Green Version]
  8. Tang, C.S.; Shi, B.; Liu, C.; Zhao, L.Z.; Wang, B.J. Influencing factors of geometrical structure of surface shrinkage cracks in clayey soils. Eng. Geol. 2008, 101, 204–217. [Google Scholar] [CrossRef]
  9. An, N.; Tang, C.S.; Xu, S.K.; Gong, X.P.; Shi, B.; Inyang, H.I. Effects of soil characteristics on moisture evaporation. Eng. Geol. 2018, 239, 126–135. [Google Scholar] [CrossRef]
  10. Li, H.D.; Tang, C.S.; Cheng, Q.; Li, S.J.; Gong, X.P.; Shi, B. Tensile strength of clayey soil and the strain analysis based on image processing techniques. Eng. Geol. 2019, 253, 137–148. [Google Scholar] [CrossRef]
  11. Tang, C.S.; Zhu, C.; Leng, T.; Shi, B.; Cheng, Q.; Zeng, H. Three-dimensional characterization of desiccation cracking behavior of compacted clayey soil using X-ray computed tomography. Eng. Geol. 2019, 255, 1–10. [Google Scholar] [CrossRef]
  12. Wang, L.L.; Tang, C.S.; Shi, B.; Cui, Y.J.; Zhang, G.Q.; Hilary, I. Nucleation and propagation mechanisms of soil desiccation cracks. Eng. Geol. 2018, 238, 27–35. [Google Scholar] [CrossRef]
  13. Jiang, N.J.; Tang, C.S.; Yin, L.Y.; Xie, Y.H.; Shi, B. Applicability of Microbial Calcification Method for Sandy-Slope Surface Erosion Control. J. Mater. Civil Eng. 2019, 31, 04019250. [Google Scholar] [CrossRef]
  14. Zuo, L.; Lv, B.R.; Xu, L.; Li, L.W. The influence of salt contents on the compressibility of remolded loess soils. Bull. Eng. Geol. Environ. 2022, 81, 185. [Google Scholar] [CrossRef]
  15. Péron, H.; Herchel, T.; Laloui, L. Fundamentals of desiccation cracking of fine-grained soils experimental characterization and mechanisms identification. Can. Geotech. J. 2009, 46, 1177–1201. [Google Scholar] [CrossRef]
  16. Corte, A.; Higashi, A. Experimental Research on Desiccation Cracks in Soils; U.S. Army Snow Ice and Permafrost Research Establishment, Research Report No. 66; Corps of Engineers: Wilmette, IL, USA, 1960. [Google Scholar]
  17. Xu, L.; Coop, M.R. Influence of structure on the behaviour of a saturated clayey loess. J. Can. Geotech. 2016, 53, 1026–1037. [Google Scholar] [CrossRef]
  18. Wei, X.; Hattab, M.; Taibi, S.; Bicalho, K.V.; Xu, L.; Fleureau, J.M. Crack development and coalescence process in drying clayey loess. Geomech. Eng. 2021, 25, 535–552. [Google Scholar]
  19. Wei, X.; Bicalho, K.V.; Hajjar, A.E.; Taibi, S.; Hattab, M.; Fleureau, J.M. Experimental techniques for the study of the cracking mechanisms in drying clays. Geotech. Test. J. 2020, 44, 323–338. [Google Scholar] [CrossRef]
  20. Waler, P. Irrigation on Swelling Clays Soils. Master’s Thesis, Agricultural Engineering, Central Region, Moldova, 1989. [Google Scholar]
  21. Shokri, N.; Zhou, P.; Keshmiri, A. Patterns of desiccation cracks in saline bentonite layers. Transp. Porous Med. 2015, 110, 333–344. [Google Scholar] [CrossRef]
  22. Wei, X.; Hattab, M.; Bompard, P. Highlighting some mechanisms of crack formation and propagation in clays on drying path. Géotechnique 2016, 66, 287–300. [Google Scholar] [CrossRef]
  23. Wei, X.; Hattab, M.; Fleureau, J.M. Micro-macro-experimental study of two clayey materials on drying paths. Bull. Eng. Geol. Environ. 2013, 72, 495–508. [Google Scholar] [CrossRef]
  24. Kodikara, J.; Costa, S. Desiccation cracking in clayey Soils: Mechanisms and Modelling. In Multiphysical testing of Soils and Shales; Springer: Berlin/Heidelberg, Germany, 2013; pp. 21–32. [Google Scholar]
  25. Li, J.H.; Li, L.; Chen, R. Cracking and vertical preferential flow through landfill clay liners. Eng. Geol. 2016, 206, 33–41. [Google Scholar] [CrossRef]
  26. Wang, D.Y.; Tang, C.S.; Shi, B. Studying the effect of drying on soil hydromechanical properties using micro-penetration method. Environ. Earth Sci. 2016, 75, 1–13. [Google Scholar]
  27. Zhang, X.D.; Chen, Y.G.; Ye, W.M. Effect of salt concentration on desiccation cracking behavior of GMZ bentonite. Environ. Earth Sci. 2017, 76, 531. [Google Scholar] [CrossRef]
  28. Tang, C.S.; Shi, B.; Liu, C.; Suo, W.B.; Gao, L. Experimental characterization of shrinkage and desiccation cracking in thin clay layer. Appl. Clay Sci. 2011, 52, 69–77. [Google Scholar] [CrossRef]
  29. Lakshmikantha, M.R.; Prat, P.C.; Ledesma, A. An Experimental Study of Cracking Mechanisms in Drying Soils; Thomas Telford Publishing: London, UK, 2006; pp. 533–540. [Google Scholar]
  30. Cordero, J.A.; Useche, G.; Prat, P.C. Soil desiccation cracks as a suction–contraction process. Géotech. Lett. 2017, 7, 279–285. [Google Scholar] [CrossRef]
  31. Lu, H.; Li, J.; Wang, W. Cracking and water seepage of Xiashu loess used as landfill cover under wetting–drying cycles. Environ. Earth Sci. 2015, 74, 7441–7450. [Google Scholar] [CrossRef]
  32. Zhang, Y.S.; Qu, Y.X. Cements of sand loess and their cementation in North Shaan Xi and West Shan Xi. J. Eng. Geol. 2005, 13, 18–28, (In Chinese with English abstract). [Google Scholar]
  33. Liu, D.S. (Ed.) Loess and the Environment; Science Press: Beijing, China, 1985. [Google Scholar]
  34. Liu, C.; Shi, B.; Zhou, J.; Tang, C.S. Quantification and characterization of microporosity by image processing, geometric measurement and statistical methods: Application on SEM images of clay materials. Appl. Clay Sci. 2011, 54, 97–106. [Google Scholar] [CrossRef]
  35. Liu, C.; Tang, C.S.; Shi, B. Automatic quantification of crack patterns by image processing. Comput. Geosci. 2013, 57, 77–80. [Google Scholar] [CrossRef]
  36. Zeng, H.; Tang, C.S.; Cheng, Q.; Zhu, C.; Yin, L.Y.; Shi, B. Drought induced soil desiccation cracking behavior with consideration of basal friction and layer thickness. Water Resour. Res. 2019, 56, e2019WR026948. [Google Scholar] [CrossRef]
  37. Fang, H.Q.; Ding, X.M.; Jiang, C.Y.; Peng, Y.; Wang, C.Y. Effects of layer thickness and temperature on desiccation cracking characteristics of coral clay. Bull. Eng. Geol. Environ. 2022, 81, 391. [Google Scholar] [CrossRef]
  38. Wei, X.; Yang, Z.T.; Fleureau, J.M.; Hattab, M.; Taibi, S.; Xu, L. Tensile strength identification of remolded clayey soils. Bull. Eng. Geol. Environ. 2022, 81, 405. [Google Scholar] [CrossRef]
  39. Lebron, I.; Suarez, D.I.; Schaap, M.G. Soil pore size and geometry as a result of aggregate-size distribution and chemical composition. Soil Sci. 2002, 167, 165–172. [Google Scholar] [CrossRef]
  40. Malik, M.; Mustafa, M.A.; Letey, J. Effect of mixed Na/Ca solutions on swelling, dispersion and transient water flow in unsaturated montmorillonitic soils. Geoderma 1992, 52, 17–28. [Google Scholar] [CrossRef]
  41. Shokri, N.; Lehmann, P.; Vontobel, P.; Or, D. Drying front and water content dynamics during evaporation from sand delineated by neutron radiography. Water Resour. Res. 2008, 44, 1–11. [Google Scholar] [CrossRef] [Green Version]
  42. Ding, J.; Yu, D. Monitoring and evaluating spatial variability of soil salinity in dry and wet seasons in the Werigan-Kuqa Oasis, China, using remote sensing and electromagnetic induction instruments. Geoderma 2014, 235–236, 316–322. [Google Scholar] [CrossRef]
  43. Feikema, P.M.; Baker, T.G. Effect of soil salinity on growth of irrigated plantation eucalyptus in south-eastern Australia. Agric. Water Manag. 2011, 98, 1180–1188. [Google Scholar] [CrossRef]
  44. Zhang, G.H.; Yu, Q.C.; Wei, G.Q.; Chen, B.; Yang, L.S.; Hu, C.Y.; Li, J.P.; Chen, H.H. Study on the basic properties of the soda-saline soils in Songnen plain. Hydrogeol. Eng. Geol. 2007, 2, 37–40. [Google Scholar]
  45. Zhang, Y.; Hu, Z.; Li, L. Improving the structure and mechanical properties of loess by acid solutions—An experimental study. Eng. Geol. 2018, 244, 132–145. [Google Scholar] [CrossRef]
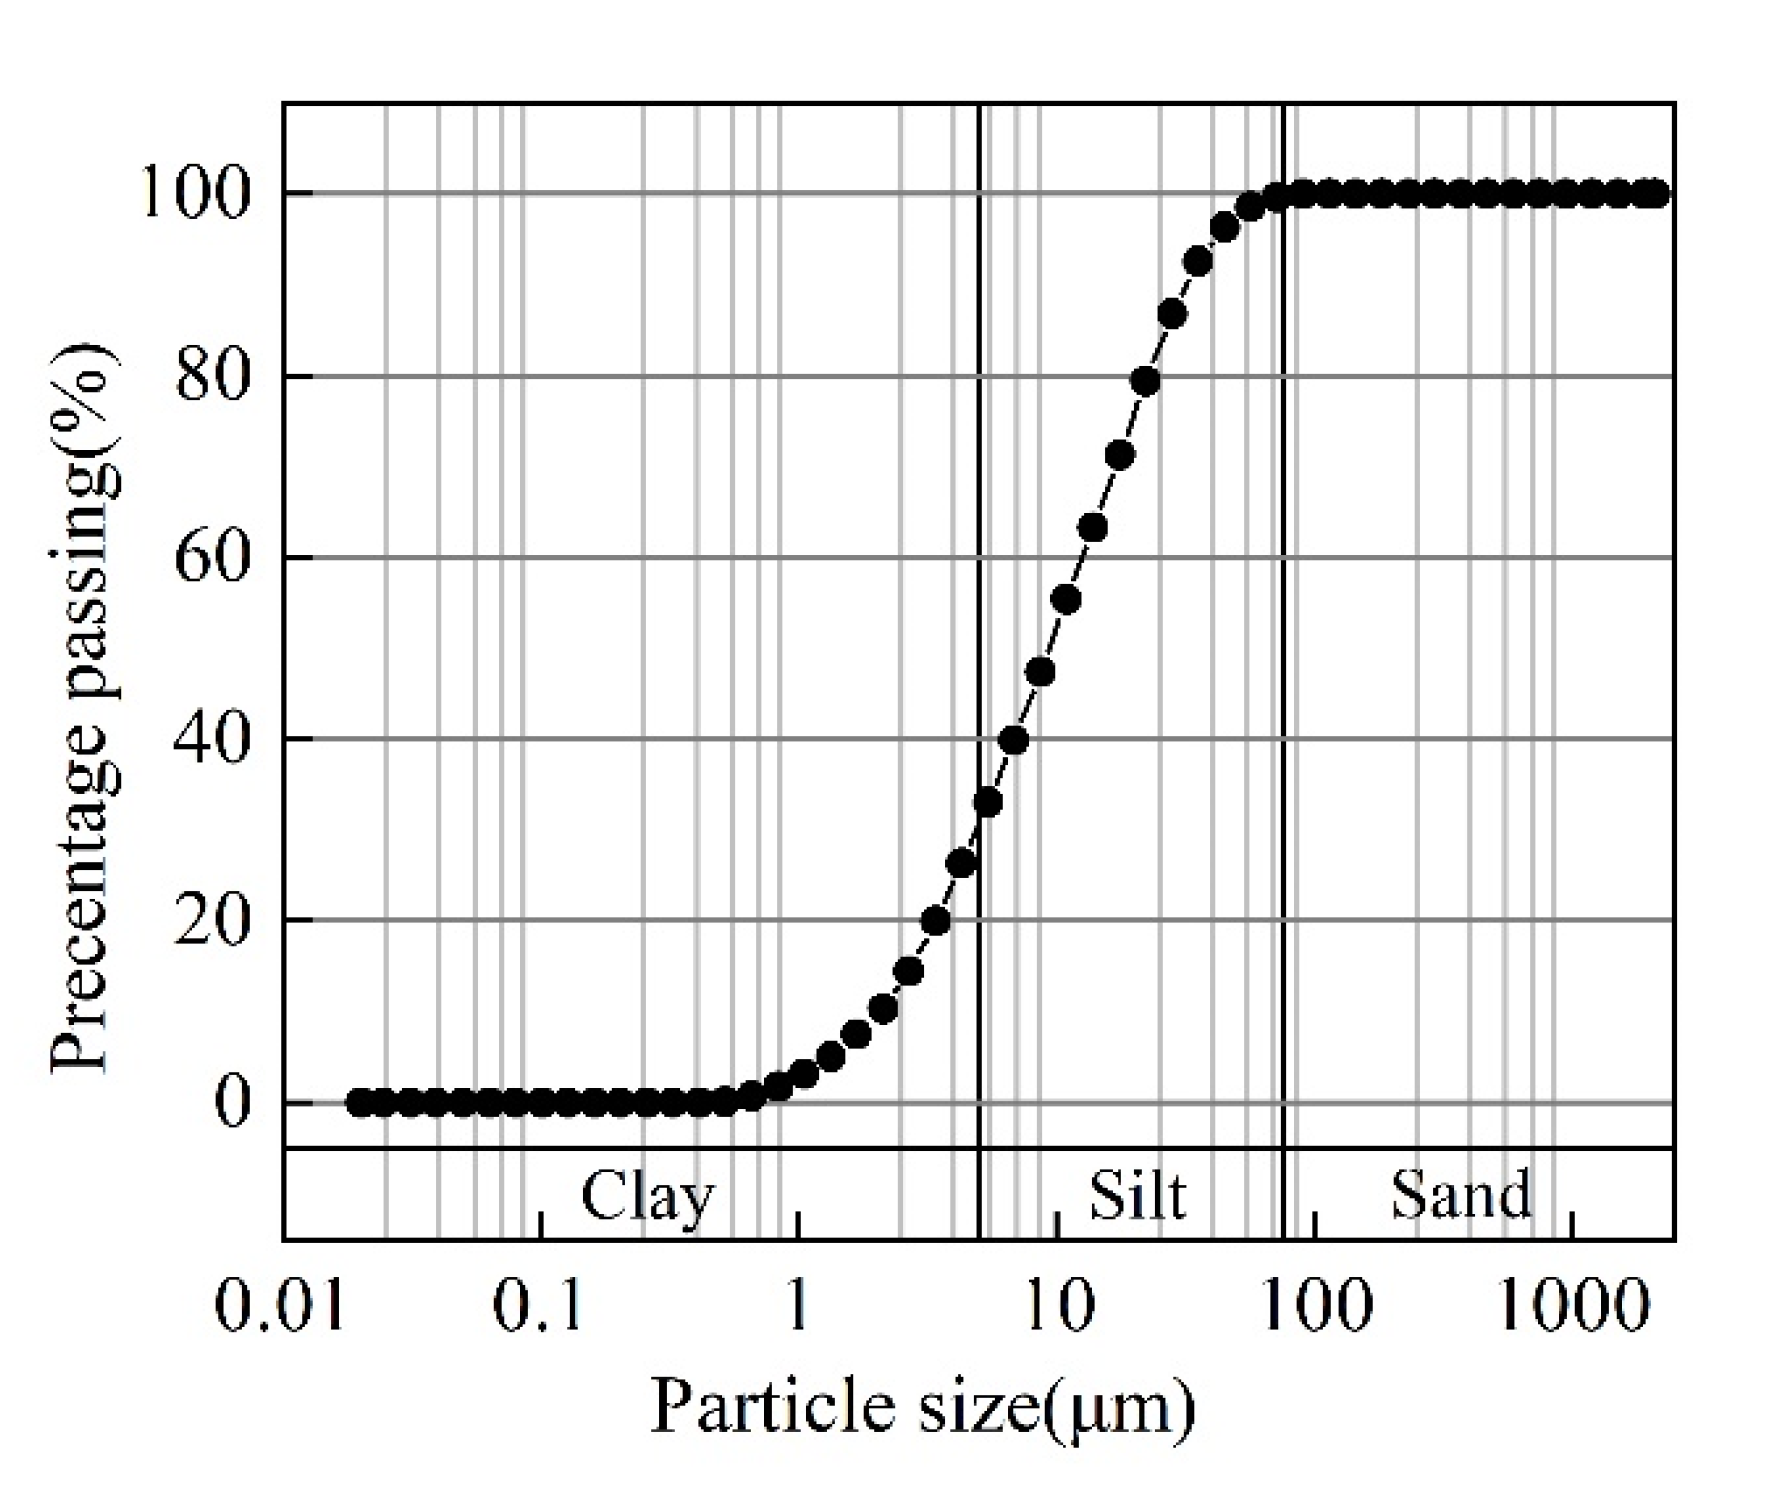
Figure 1. Grain size distributions of Jingyang loess.
Sustainability 15 05268 g001
Figure 2. Schematic diagram of the experimental set-up.
Sustainability 15 05268 g002
Figure 3. An example of PCAS software results (loess sample with 3.6% NaCl concentration, t = 50 h): (a) original photo; (b) binarization of photo; (c) blockization of cracks; (d) skeletonization of cracks; (e) analysis of cracks; (f) results of crack parameters.
Sustainability 15 05268 g003
Figure 4. An example of longitudinal strain ε x x (loess sample with 7.2% NaCl concentration, t = 4.67 h).
Sustainability 15 05268 g004
Figure 5. Variations in water content versus time of loess samples with different NaCl concentration.
Sustainability 15 05268 g005
Figure 6. Different crack patterns in loess samples with different NaCl concentration at the end of free desiccation tests: (a) 0% NaCl; (b) 3.6% NaCl; (c) 7.2% NaCl; (d) 10.8% NaCl.
Sustainability 15 05268 g006
Figure 7. Images of cracks in loess samples with different NaCl concentration after PCAS treatment at the end of free desiccation tests: (a) 0% NaCl; (b) 3.6% NaCl; (c) 7.2% NaCl.
Sustainability 15 05268 g007
Figure 8. Variations in cracking parameters on the surface of loess samples versus water content: (a) Variations in R S C ; (b) Variations in N C ; (c) Variations in L C .
Sustainability 15 05268 g008
Figure 9. Longitudinal strains results of 0% NaCl loess samples at different times: (a) t = 2 h; (b) t = 8 h (Zone A presents area of interest).
Sustainability 15 05268 g009
Figure 10. Longitudinal strain results of loess samples with different NaCl concentration at t = 5 h: (a) 0% NaCl; (b) 3.6% NaCl; (c) 7.2% NaCl; (d) 10.8% NaCl.
Sustainability 15 05268 g010
Figure 11. Three cracking modes: (a) opening mode; (b) shearing mode; (c) tearing mode.
Sustainability 15 05268 g011
Figure 12. Different cracking modes in loess samples with different NaCl concentration during free desiccation tests: (a) Crack with mixed opening–sliding mode in loess sample with 0% NaCl; (b) Crack with opening mode in loess sample with 7.2% NaCl; (c) Crack with mixed opening–sliding mode in loess sample with 7.2% NaCl.
Sustainability 15 05268 g012
Figure 13. SEM images of loess samples with different NaCl concentration: (a) 0% NaCl; (b) 3.6% NaCl; (c) 7.2% NaCl; (d) 10.8% NaCl.
Sustainability 15 05268 g013
Figure 14. Results of EDS element analysis: (a) SEM photo of loess sample with 3.6% NaCl; (b) Element analysis in zone A; (c) Element analysis in zone B.
Sustainability 15 05268 g014aSustainability 15 05268 g014b
Figure 15. SEM photo of loess sample with 7.2% NaCl (zone A and B represent areas of soil particles and smooth layer, respectively).
Sustainability 15 05268 g015
Figure 16. SEM photo of loess sample with 10.8% NaCl (zone A and B represent areas of soil particles and smooth layer, respectively).
Sustainability 15 05268 g016
Table 1. Physical properties of Jingyang loess.
Specific GravityDry Density
(g/cm3)
Liquid Limit
w L   ( % )
Plastic Limit
w P   ( % )
Plasticity Index
I P
Granulometry (%)
Sand Content
(4.75–0.075 mm)
Silt Content
(0.075–0.002 mm)
Clay Content
(≤0.002 mm)
2.691.5735.617.118.50.382.717
Table 2. Different NaCl concentrations of sample in the tests.
Number of the SampleThe Concentration of NaCl (%)Salinization Degree
10Non-saline soil
23.6Weakly saline soil
37.2Medium saline soil
410.8Strongly saline soil
Table 3. Comparisons of element contents in zones A and B on the surface of loess sample with 3.6% NaCl.
Element ContentNaClSiOCa
(%)
Zone A21.3735.529.6519.290
Zone B31.4564.651.202.713.63
Table 4. Comparison of element contents in zones A and B on the surface of loess sample with 7.2% NaCl.
Element ContentNaClSiOCa
(%)
Zone A27.3740.848.8619.570
Zone B45.7852.0802.130
Table 5. Comparison of element contents in zones A and B on the surface of loess sample with 10.8% NaCl.
Element ContentNaClSiOCa
(%)
Zone A9.7515.8814.8743.622.53
Zone B44.5754.940.040.450
Disclaimer/Publisher’s Note: The statements, opinions and data contained in all publications are solely those of the individual author(s) and contributor(s) and not of MDPI and/or the editor(s). MDPI and/or the editor(s) disclaim responsibility for any injury to people or property resulting from any ideas, methods, instructions or products referred to in the content.