Article

Proposal of a Gas Sensor-Based Device for Detecting Adulteration in Essential Oil of Cistus ladanifer

Instituto de Investigación para la Gestión Integrada de Zonas Costeras, Universitat Politècnica de València, C/Paranimf, 1, Grao de Gandia, 46730 Gandia, Valencia, Spain
*
Author to whom correspondence should be addressed.
Sustainability 2023, 15(4), 3357; https://doi.org/10.3390/su15043357
Submission received: 31 December 2022 / Revised: 27 January 2023 / Accepted: 10 February 2023 / Published: 12 February 2023
(This article belongs to the Special Issue Green Technology and Sustainable Development)

Abstract

:
Essential oils are a valuable raw material for several industries. Low-cost methods cannot detect its adulteration; specialised equipment is required. In this paper, we proposed the use of gas sensors to detect the adulteration process in the essential oil of Cistus ladanifer. Gas sensors are used in a measuring chamber to measure pure and adulterated oils. We compare the suitability of the tested sensors for detecting adulterated oil and the required measuring time. A total of five samples are determined, with a measuring time of 12 h. Each gas sensor is configured to be sensitive to different compounds. Even though sensors are not specific to detect the volatile organic compounds (VOCs) present in the essential oil, our objective is to evaluate if these VOCs might interact with the sensors as an interferent. Results indicate that various gas sensors sensitive to the same chemical compound offered different values. It might indicate that the interaction of VOCs is different among the tested sensors or that the location of the sensors and the heterogeneous distribution of VOCs along the measurement chamber impact the data. Regarding the performed analyses, we can affirm that identifying the adulterated essential oil is possible using the generated data. Moreover, the results suggest that most of the data, even for different compounds and sensors, are highly correlated, allowing a reduction in the studied variables. According to the high correlation, data are reduced, and 100% of correct classification can be obtained even when only the MQ3 and MQ8 are used.

1. Introduction

Essential oils are aromatic liquids obtained from different parts of plants. They are widely used in various industries, such as pharmaceuticals, cosmetics, and food. Essential oils are composed of secondary metabolites generated by plants. Due to adulteration, the properties of the essential oils are modified, lowering their quality. Essential oils can be adulterated in four ways: (i) adding other, less expensive essential oils, (ii) adding a natural chemical component, (iii) diluting with other carrier oils, and (iv) adding laboratory-synthesised components [1]. According to [2], 80% of the essential oils we can find on the market have been adulterated. Another problem similar to the adulteration of essential oils is their contamination. Adulteration and contamination of essential oils are usually detected with organoleptic tests, gas chromatography, and mass spectrometry. Among the analytical methods used for detection, we can highlight high-performance liquid chromatography [3] and gas chromatography mass spectrometry [4]. The cost of carrying out the previously described tests is high. Therefore, designing, testing, and applying new low-cost methods is necessary.
Electronic Noses (eNoses) allow the detection and classification of aromas and odours [5]. The use of eNoses has varied over time. Nowadays, eNoses are applied in many fields, such as the agricultural industry or agro-industry, medicine, the detection of volatile organic components, security, etc. [6]. Improving eNose was due to the enhanced ability to recognise patterns of substances through informatics. Its capacity was based on comparing those patterns with those observed during the measurement. Calibration is a significant drawback when generating an eNose. Usually, the eNose is based on a set of gas sensors. Thus, the current strategies for eNose are to define a narrow-range application and create a tailored eNose with a minimum number of sensors [7]. The temperature had a significant impact on the results [8]. One of the most used combinations for eNose applications is the initial combination of gas sensors with an additional measurement process for the verification of the system. A system based on a hybrid eNose was presented for VOCs determination [9]. This system was made up of colourimeter sensors and gas sensors. A USB microscope captured the alteration in the dyes exposed to the tested gas. Principal Component Analysis (PCA) was carried out with the gas sensors and the colourimetric data. The hybrid system could improve the classification of VOCs. The combined gas chromatographic methods with sensory analysis to analyse odorous air samples was presented in [10]. They combined PCA, Discriminant Function Analysis (DFA), support vectors, and hierarchical analysis. The results confirmed that thermal desorption-gas chromatography-mass spectrometry and eNose could adequately measure odour.
Multiple reviews can be found where eNose is related to agriculture. A review of eNose applied to the analysis and evaluation of agricultural products to evaluate freshness and quality and to identify the variety and geographical origin, among others, was presented in [11]. Regarding the use of eNose for food quality evaluation, additional information is presented in [5]. A last survey in 2022 by Seesaard et al. [12] pointed out the high impact of eNoses in agricultural applications shortly. In related fields such as medicine, eNoses have been used for the detection of prostate cancer from benign prostatic hyperplasia [13] and to detect VOCs in the breath of patients with diabetes and lung cancer [14]. With regard to patient breath, eNoses have also been used for COVID-19 [15]. A review of applications of eNose to diagnose lung cancer successfully was published in 2020 [16]. The use of eNoses in air quality monitoring has also been assessed for de discrimination of toxic and non-toxic gases in indoor environments [17], detecting VOCs [18], and carbon monoxide and other dangerous gases [19].
The aim of this paper is to test the use of eNose to differentiate between the essential oils of Cistus ladanifer and Pinus pinaster and adulterated oil. The gas sensors used include the MQ2, MQ3, MQ4, MQ5, MQ6, MQ7, MQ8, and MQ135. All these sensors are sensitive to a wide variety of gasses and can be configurated with different equations to sense different compounds. The experiments include measuring the essential oils and the empty chamber after measuring the essential oil to verify the required time to clean the sensors and the atmosphere. Each test has a duration of 12 h. The initial 60 min of data are not considered since the sensors need to heat before providing a stable measurement. Simple analyses of data, multivariate analyses, dendrograms, and Artificial Neural Networks (ANN) are used to achieve the highest accuracy possible. The evaluation of data reduction in terms of input variables and time is explored in the paper. The main contributions, and novelty, of this paper are the following:
  • Design, develop, and test devices based on MQ-based sensors to measure volatile compounds’ changes.
  • Test that an MQ-based device can be used to differentiate between essential oils from different plant species.
  • Verify the usability of the proposed device for recognising adulteration of essential oils.
  • Identify the MQ sensor or sensors among the tested ones and the best-predefined equation which offered the most accurate classification of essential oils.
  • Determine the minimum duration of the measuring process to ensure the correct classification of results.
The rest of the paper is organised as follows. Section 2 summarises the state of the art of gas sensors for identifying adulterated food or distinguishing between food sources. Section 3 describes the materials and methods employed in implementing the proposed electronic device and the measuring chamber. The test bench is fully defined in Section 4. Results are discussed in Section 5. Finally, the conclusion and future work are highlighted in Section 6.

2. Related Work

This section outlines different studies using eNoses and other gas sensors in the food industry to offer a comprehensive vision of the current state of the art. Among the most widely used gas sensors, the MQ family stands out. The MQ family is a group of different low-cost gas sensors generally used for air quality monitoring with Arduino or other microcontrollers; more details are provided in Section 3. As described in the subsequent paragraphs, many authors have implemented different gas detection systems to detect adulterated products or to identify the specific variety or origin of products. In many studies, different analyses were conducted to establish correlations between the different sensors’ accuracies and optimise their use.
The use of gas sensors in the industry to detect fraudulent products has been studied in different publications. In 2019, Mohammad-Razdari et al. [20] tested an eNose to differentiate between adulterated and pure tomato paste using an eNose. The device was composed of the following gas sensors: TGS2600. TGS2620, MQ3, TGS880, and TGS2610. The authors used PCA and DFA explained to classify the analysed tomato pastes with precisions of 97.7, 83.9, and 92.2 for the tomato pastes adulterated with pumpkin, potato, and starch, respectively. Their results indicated that TGS2610 and MQ3 are the sensors which offered better results. In 2020, Karami et al. [21] applied an eNose to detect adulterated edible oils. Their eNose combined the following gas sensors MQ3, MQ-9, MQ135, MQ136, TGS813, TGS822, TGS2602, and TGS2620. The classification methods include Cluster Analysis (CA), PCA, DFA, and ANN, among others. Mean classification accuracy of 97.3% was achieved with ANN compared with 88% with DFA.
Roy et al., in 2021 [22], developed a system based on an eNose. Their device used the MQ2, MQ3, MQ4, MQ5, MQ6, MQ7, MQ8, MQ-9, and MQ135 gas sensors. In this way, they detected adulteration in ghee with hydrogenated fat (vanaspati). The results obtained by PCA and DFA explained a variation of 98.10% and 99.10%, respectively. Finally, the DFA model was characterised by a success rate of 90.90%. They concluded that the developed system could successfully identify adulterated samples from unadulterated ones. In that same year, Montoya et al. [23], using the 32-bit ESP32 WROOM microcontroller and the MQ2, MQ3, MQ4, and MQ135, developed a low-cost eNose. Their goal was to detect and quantify alcohol to enhance production processes in the beer and wine industry. Their results pointed out that the MQ3 sensor offered stable results up to 20% of alcohol, while MQ2, MQ4, and MQ135 sensors only offered stable results up to 5%. Finally, they concluded that the degree of alcohol could be determined with a precision more significant than 92%. Wang et al. [24], in 2021, presented a study aimed at eliminating those irrelevant sensors to detect tea aroma. They proposed a study based on correlation coefficients and clusters. The classification accuracy using DFA methods based on the average value combined with the nearest neighbour analysis reaches values of 94.44 to 100%. They conclude that the different teas can be differentiated and saved on the electronic nose system with fewer sensors.
In 2022, Delmo et al. [25] developed an electronic nose to identify the aroma of coffee. They tested four gas sensors from the MQ family (MQ2, MQ7, MQ135, and MQ-137). The data obtained were extracted by using the Arduino microcontroller. The authors concluded that the four sensors were necessary to differentiate coffee’s different aromas. Nevertheless, the combination of two sensors can be used for certain coffees. In the same year, Avian et al. [26] proposed using an eNose, which combined gas sensors and a DHT22 sensor to detect adulteration in beef products with pork. They included the MQ2, MQ4, MQ6, MQ-9, MQ135, MQ136, MQ-137, and MQ-138 gas sensors. Classification of data was done with deep extreme learning and PCA. A maximum accuracy of 99.97% was achieved using all sensors. No information about reducing the number of sensors was provided.
Another area of application for the gas sensor is to prevent the adulteration of essential oils used in cosmetics. Hence, the importance of the study is presented here. A single case of the use of eNose for the classification of essential oils was found. In 2021, Rasekh et al. [27] used MQ3, MQ4, MQ8, MQ-9, MQ136, MQ136, TGS813, TGS822, and TGS2620 for the classification of 6 different essential oils from fruits and herbs. No adulterated oil was tested. PCA and DFA were used for sample classification. An accuracy of 100% was obtained.

3. Proposed Sensor for Measuring Essential Oils

This section presents the sensors used to develop our system and how measurements have been processed.

3.1. Gas Sensors

One of the main goals of this paper is to develop a low-cost system capable of measuring the presence of different essential oils and if they have been adulterated. Therefore, the MQ family of gas sensors has been selected to develop our gas monitoring node.
Due to the high sensitivity and fast response of MQ family sensors, a type of metal oxide sensor, they are widely used in monitoring applications. These devices are electrochemical sensors and vary their resistance when they are exposed to certain gases. Internally, they have a heater in charge of increasing the internal temperature of a metal wire (typically SnO2), and with this, the sensor can react with the gases causing a change in the resistance value. The sensor is enclosed between two layers of stainless steel mesh that ensures that the internal heating element does not cause any damage to elements of the environment or studied materials. Figure 1 shows the general MQ-XX Gas sensor connection diagram.
As we can see, there are two different circuits inside the sensor. On the one hand, there is a heating circuit between points H of the diagram. On the other hand, the circuit between points A and B is used to measure the resistive change of the sensor due to the presence of the gas. A wide range of these types of sensors is sensitive to different gases naturally present in our environment. Table 1 shows the list of these sensors.
In order to develop our essential oil monitoring system, the sensors MQ2, MQ3, MQ4, MQ5, MQ6, MQ7, MQ8, MQ-9, and MQ-135 have been used. Additionally, it is important to note that gas measurements are seriously affected by ambient temperature and relative humidity. Therefore, a DHT11 sensor is also included to ensure that temperature is stable along the measuring process.
The DHT11 [40] sensor consists of a capacitive humidity sensing element and a thermistor to sense ambient temperature. The moisture-sensing component has two electrodes with a moisture-retaining substrate between them. The substrate releases ions as it absorbs water vapour. The conductivity between the electrodes decreases when water vapour is deposited over the substrate. The change in resistance between the two electrodes is proportional to the relative humidity. This sensor uses a negative temperature coefficient thermistor (NTC) to measure temperature, i.e., its resistance value decreases when the temperature increases. The temperature range of the DHT11 is between 0 °C to 50 °C with an accuracy of ±2 °C. The relative humidity range of this sensor is 20% to 90%, with an accuracy of ±5%. The DHT11 has an operating voltage of 3 to 5 volts, and the maximum current used in the measurement is 2.5 mA. Finally, the sampling rate of this sensor is 1 Hz, i.e., it is possible to take a reading each second.
The sensors described are controlled with an Arduino Mega 2560 module, since it is the module that contains the biggest number of analogue inputs. Arduino Mega 2560 is a microcontroller board based on the ATmega2560 processor. It has 54 digital input/output pins (of which 15 can be used as PWM outputs), 16 analogue inputs, and 4 UARTs (hardware serial ports).
Figure 2a represents the connection diagram of the entire system. As the image shows, the system also contains a screen that allows checking the correct operation of the system, a storage module with a micro SD card, and a real-time clock module that allows labelling the measurements with a temporary mark for further processing.
Figure 2b shows a photograph of the prototype developed during preliminary tests, the top part of the picture. In them, the essential oil samples are introduced in a measuring chamber (bottom of the picture), together with the gas sensors, while the electronic board remains outside the container to be able to extract the SD card and check the correct operation of the entire system.

3.2. Gas Sensors Configuration

Every one of the gas sensors mentioned in the previous subsection and included in the measuring devices (MQ8 to MQ135) can be configured with different equations to measure different compounds. In most cases, the same compound can be measured by several sensors according to the programmed equations. Different equations added in the node configuration allow measuring different chemical compounds. The equations used for the configuration of these electronic devices can be found in the sensors’ datasheets [26,32,33,34,35,36,37,38]. In our eNose, we have prepared the script to apply all the different equations, allowing us to measure all the compounds simultaneously, maximising the amount of generated information. Table 2 summarises the different compounds that can measure each MQ sensor. In the results, data are indicated as the Sensor-Compound. For example, MQ2-1, represents the data of the MQ2 sensor with the equation for compound 1.

3.3. Measuring Chamber

The measuring chamber is made of acrylonitrile butadiene styrene. The selected measuring chamber was the PB5322413 [41]. We have chosen this material due to its low cost and resistance. The dimensions of the chamber are the following: 20 × 10 × 25; see Figure 2c for more detail. Its size allows the sample and sensors to be introduced while enclosing the included atmosphere, ensuring a high concentration of VOCs.
The sample holder is located at the centre of the measuring chamber, in which the flasks are deployed. Regarding the placement of the MQ sensors, they are located perpendicularly to the sample, see Figure 2c, in two groups of four sensors. The measuring chamber is completely sealed to ensure the retention of the VOCs.

4. Test Bench

In this section, we describe the performed tests to evaluate the suitability of gas sensors for detecting adulteration in the essential oil of Cistus ladanifer. For the tests, two different essential oils were used. The duration and procedure for data gathering are defined in the second subsection.

4.1. Oil Samples

As oil samples, two different essential oils were used. On the one hand, the essential oil of Cistus ladanifer was obtained with the steam distillation of young individuals on 24 November 2019, in Berzosa del Lozoya (Spain). The steam distillation was conducted on a cylindrical stainless steel still, which is characterised by a capacity of 130 L. The temperature for the distillation was under 95 °C. The distillation has a duration of 2.5 h.
On the other hand, a second essential oil, from Pinus pinaster, is used. In this case, the essential oil is a commercial oil (from Natural Essenza batch identification 210610). Both essential oils were stored in transparent crystal flasks, as in Figure 3. The samples were stored in the refrigerator at 3 °C from the reception of the samples to their utilisation. The samples have a volume of 20 mL.
To create the adulterated essential oil of Cistus ladanifer, 2 mL of the essential oil of Cistus ladanifer was mixed with 2 mL of the essential oil of Pinus pinaster. The adulterated essential oil was created at the moment of the data gathering. Volumes were measured using an automatic pipette of 5 mL. The adulterated essential oil was mixed by shaking and inverting it.
Essential oils are composed of a great variation of metabolites. The composition of essential oils includes several types of organic compounds. Part of the metabolites are Volatile Organic Compounds (VOCs), and the proportion of VOCs changes among individuals, species, and harvest moments. In general, monoterpenes hydrocarbons have a higher volatility than sesquiterpenes and oxygenated monoterpenes [42]. Examples of the composition of Pinus pinaster and Cistus ladanifer essential oils can be found in the literature [43,44].

4.2. Data Gathering Methodology

For measuring the essential oil, a protocol for data gathering was established. The protocol is composed of the following steps:
  • Get the flask with the oil sample from the refrigerator (Cistus ladanifer, Pinus pinaster, or adulterated Cistus ladanifer).
  • Turn on the measuring device.
  • Open the flask and introduce it into the measuring chamber. For blank measuring (empty chamber), no flask is introduced.
  • Check that the data-gathering process is started.
  • After 12 h, stop the data-gathering process.
  • Turn off the measuring device.
  • Close the flask and store it in the fridge.
For the generated data, the first hour of information must be removed. This is the estimated time that requires the essential oil to reach the standard temperature and the required time for the sensors to be heated. The oil is not heated; the gas sensors sense the presence of the oil’s VOCs, which pass into the chamber’s atmosphere.
With the remanent data, the average value for each variable is calculated every 1 h. These average values are the ones included in Section 5.
The performed tests include the following scenarios: Cistus ladanifer essential oil, Pinus pinaster essential oil, Cistus ladanifer adulterated essential oil, and an empty chamber. Since it is important to evaluate if the evaporated compounds from the essential oil might rely on the measuring chamber and interfere with the subsequent measures, the empty chamber test, or blank test, is included. Considering that different essential oils can have different concentrations of several compounds, the empty chamber was measured after 12 h of exposition with each essential oil. The measurement of the empty chamber after Cistus ladanifer and after Pinus pinaster essential oils was performed for 12 h.

4.3. Data Analysis Procedure

For the data analyses, first of all, we compare the variation of data along the time for each one of the samples, including (i) essential oil of Cistus ladanifer, (ii) empty chamber after essential oil of Cistus ladanifer, (iii) essential oil of Pinus pinaster, (iv) empty chamber after essential oil of Pinus pinaster, and (v) adulterated essential oil of Cistus ladanifer. This will allow us to understand whether the data change over time. If the data change, it will be necessary to define the minimum or maximum measuring interval.
In the case that the data increase constantly, it indicates that the VOCs in the essential oil are being evaporated, their concentration in the chamber is increasing, and the sensors are capable of sensing them. If the data increase and after a few hours become stable, we can assume that the VOCs are saturated in the chamber’s atmosphere. Moreover, it can also be explained by the fact that the sensors have reached their maximum sensing range and even if the concentration of VOCs increase, sensors cannot detect it. In some cases, VOCs might require more time to get volatile. Thus, a long period is initially used. In the samples of empty chambers, the slow reduction of values of sensed data might indicate the time needed to restore initial values after a measuring process. This information is essential to ensure the atmosphere is clean before starting a new measuring process.
Once we have defined the minimum measuring time, the next step is to determine if sensors can differentiate between essential oils. Thus, we compare the data of all samples, including blanks, using multivariate analyses and other statistical methods such as CA. Our objective is to define which sensor or sensor can more accurately identify the source of the essential oil and, if possible, determine the presence of adulterated essential oil. Once the best sensors are identified, an Artificial Neural Network (ANN) is used to achieve maximum accuracy.

5. Results and Discussion

In this section, we discuss the results of conducted measures to determine the measuring time and the best sensors and if it is possible to identify adulterated essential oil.

5.1. Preliminary Analyses

This subsection defines the preliminary results to identify the maximum and minimum measuring periods by analysing the differences among samples over the 12 h of each measure. First, we discuss the results for each sample. Then, the general findings are described. It is important to note that the data from the MQ135 are not included in the analyses due to problems in data obtention. Furthermore, the data from MQ2 for compound number 8 were equal to 0 in all the tests. Thus, data have been removed from the analyses.

5.1.1. Measures with Essential Oil of Cistus Ladanifer

The sensors’ responses when the essential oil of Cistus ladanifer was introduced into the measuring chamber can be seen in Figure 4. The different subfigures, Figure 4A–F represent the data for different chemical compounds. The axes of Figure 4 have no units. From 1 to 11, the time is represented, while, on the other axis, the response values of the sensor.
In Figure 4A, it can be seen that all sensors show a stable response to Cistus ladanifer oil. The response of the MQ5 sensor is greater than the rest of the sensors. These responses keep constant over time. In Figure 4B, all the sensors remain stable over time for compound 2. However, the MQ7 sensor decreases compared to response 2 from time 6. Possibly, the sensed compound evaporates over time.
Concerning Figure 4C, it can be seen how all the sensors, except for the MQ4 sensor, present a stable response for compound 3. The sensor with a more significant response is the MQ8 sensor. At the same time, the MQ5 and MQ6 sensors present similar responses. Regarding time, it is observed that the MQ4 sensor decreases its response over time. Figure 4D depicts the results of the different sensors against compound 4. It is observed that, in general, all sensors have a stable response. However, the MQ2 sensor presents a decrease in its response versus time. In Figure 4E, we can see, in general terms, the great stability of sensors for compound 5. It is observed that, although the responses of the sensors remain stable, it is the MQ8 sensor that presents the most significant response to rockrose oil. Nevertheless, the MQ7 sensor presents a smaller response compared to the rest of the sensors. Regarding the variation in time, compound 5 remains constant.
Finally, in Figure 4F, the responses of the MQ3, MQ4, and MQ2 sensors are represented for compounds 8, 9, and 6, respectively. The MQ2 sensor presents a decrease in its response for compound 6 as time goes by.

5.1.2. Measures with Essential Oil of Pinus Pinaster

Figure 4 and Figure 5 represent the response of the included sensors along the time for the diverse chemical compounds in the different subfigures. In this case, the measured essential oil is from Pinus pinaster.
In Figure 5A, it can be seen that only some of the sensors have the same response for compound 1. The response of the MQ6 and MQ8 sensors are similar. Nevertheless, the MQ6 decreases its response as time increases. Similarly, the responses of MQ2 and MQ7 are analogous. However, while the MQ2 sensor presents a similar response to the MQ7, this response is not stable in time. As for the MQ5 sensor, it increases its response as time passes.
Regarding Figure 5B, the MQ5 and MQ7 sensors present similar responses to compound 2. However, as can be seen in the previous subfigure, the response of MQ5 begins to decrease as time passes. MQ4 and MQ6 sensors offered similar data. It should be noted that the MQ4 sensor initially presents a peak that stabilises after a few hours. Finally, the data from the MQ3 sensor destabilises as soon as it starts with data collection. Moreover, its sensitivity for compound 2 is negligible.
In Figure 5C, it can be seen that all sensors generally present good stability for response 3. However, the trend of each of them differs. On the one hand, data from sensors MQ5, MQ7, and MQ8 remain stable over time. In contrast, the responses of the MQ2 and MQ6 sensors decrease as time progresses. Finally, data from MQ3 and MQ4 sensors present a significantly lower response than the rest of the sensors compared to compound 3 and decrease their response as time increases.
Sensor responses for compound 4 are displayed in Figure 5D. Although these sensors’ response is generally stable, some differences are observed. It can be determined that the sensor which presents the most outstanding stability for detecting compound 4 is the MQ8 sensor. The MQ6 and MQ7 sensors gave a similar response. Furthermore, the MQ5 sensor increases its response as time increases. Meanwhile, data from the MQ4 sensor decrease over time. Figure 5E summarises the response of the sensors for compound 5. Although they all generally present similar responses, we will highlight that the MQ7 sensor presents a high peak, which might imply an abnormal value. The data from the MQ8 sensor decrease between the fourth and seventh hours and finally stabilise again.
To finalise the detection of the different compounds in Pinus pinaster oil, the sensors’ responses to compounds 8, 9, and 6 are shown using sensors MQ3, MQ4, and MQ2, respectively, are displayed in Figure 5F. The sensor that shows a more stable signal is the MQ2 sensor for compound 6, while the MQ3 shows a decrease in the response for compound 8 as time increases. Finally, the MQ4 sensor is unstable for the measurement of compound 9.

5.1.3. Measures with Adulterated Essential Oil of Cistus Ladanifer

Data obtained when adulterated essential oil (50:50) from Cistus ladanifer and Pinus pinaster is measured can be seen in Figure 6.
Figure 6A shows the response of the sensors for compound 1. Although the stability of data is similar, it should be noted that the MQ2 response drops as time increases. In addition, the MQ8 sensor presents a more significant response for compound 1 than the rest of the sensors. The MQ5 and MQ7 sensors have almost the same response. Figure 6B displays the response for compound 2. All the sensors are quite stable except for the MQ7 sensor, which presents a high instability in its response. In addition, it can be seen that the MQ5 and MQ4 sensors present similar responses. Both decrease their response between hours 7 and 8. Meanwhile, the data from MQ8 and MQ6 sensors remain stable over time.
Concerning data for compound 3, it can be observed in Figure 6C. Sensors MQ6 and MQ7 are characterised by a similar response. Meanwhile, the MQ8, MQ3, MQ4, and MQ2 sensors tend to decrease their response as time progresses. The MQ8 sensor is the one that presents the greatest response for compound 3.
In Figure 6D, the response to compound 4 is portrayed. Sensors MQ8, MQ6, and MQ5 exhibit similar temporal variability for compound 4 but with different magnitudes in their response. Conversely, it is observed that the data of the MQ4 sensor abruptly decrease. The MQ2 and MQ7 sensors also decrease their response, but less abruptly. The response to compound 5 can be seen in Figure 6E. The data from MQ5 and MQ6 sensors are characterised by the same trend but with different magnitudes. Meanwhile, the response of the MQ8, MQ4, and MQ7 sensors decreases as time progresses.
Finally, in Figure 6F, the responses to compounds 8, 9, and 6 are outlined. It can be observed that the three sensors tend to make similar responses, with the MQ4 sensor being the one with the highest response and the MQ3 the least. MQ3, MQ2, and MQ4 tend to decrease their response for their respective chemical compounds as time progresses.

5.1.4. Measures without Essential Oil

Focusing on data from blank tests, Figure 7 represents the response of the sensors when the Cistus ladanifer oil is removed from the tests. In Figure 7A, it can be seen how the MQ5 sensor decreases its response for compound 1 over time. On the contrary, MQ7 increases its response and MQ8 and MQ6 remain stable. Data for compound 2 are displayed in Figure 7B. All sensors remain stable except for the MQ7 sensor, which presents significantly tiny values. In addition, as time progresses, the MQ3 sensor tends to decrease its response. Figure 7C shows the data of the sensors for compound 3. The MQ8 sensor has the most significant response and tends to decrease the response as time passes. Similarly, MQ5 and MQ7 tend to get less responsive over time. Meanwhile, the MQ6 sensor exhibits an increase in its response. The MQ2 is stable throughout the experiment. Finally, MQ4 and MQ3 increase their response between the eighth and eleventh hours.
In Figure 7D, the response to the sensors for compound 4 is depicted. The MQ8 sensor presents a stable measurement during the entire period. However, although MQ6 is stable, its values increase from the eighth to the eleventh hour. MQ5 and MQ2 present a similar response to compound 4. MQ7 increases its response considerably after the seventh hour. Responses to compound 5 are presented in Figure 7E. A stable response characterises all sensors. The MQ6 and MQ4 sensor present similar responses. In contrast, the MQ5 sensor presents a lower response for the same compound.
Finally, the MQ7 sensor exhibits a considerable increase in its response to compound 5 after the seventh hour. Finally, in Figure 7F, the responses to compounds 8, 9, and 6 are summarised. It is observed that the MQ4 and MQ2 sensors are stable for compounds 9 and 6, respectively. In contrast, the MQ3 sensor has low stability.
The results of the blank second test, data of the empty chamber after using essential oil from Pinus pinaster can be found in Figure 8. In Figure 8A, the response for compound 1 is shown. It is observed that all the sensors remain stable. The MQ6 and MQ8 sensors are the ones that present the greater response.
Figure 8B displays the response of sensors for compound 2. The MQ8 and MQ6 sensors follow the same trend and have a similar response. A stable and similar response characterises the MQ4 and MQ5. In contrast, the MQ4 presents a higher response than the rest of the sensors for compound 2. Finally, it is observed that the MQ7 sensor decreases its response as time progresses.
The response for compound 3 is represented in Figure 8C. On the one hand, the MQ2, MQ3, MQ7, and MQ8 sensors remain stable during the data collection. They present a similar type of response, although with different values. On the other hand, the MQ4 and MQ6 sensors decrease their signal over time. In Figure 8D, the response of the sensors for compound 4 is represented. In Figure 8D, sensors MQ6, MQ8, MQ5, and MQ2 show similar responses. MQ6 is the one that offered a greater value for compound 4. The trend of the MQ5 sensor initially increases its response and, after a while, begins to decrease. A decrease characterises the response of MQ7 in its response over time.
Figure 8E details the responses of the different sensors for compound 5. While the response of sensor MQ6 remains stable, data from MQ7 and MQ3 gently decrease. The MQ5 slightly increases its response at the end of the test. Finally, in Figure 8F, the response for compounds 8, 9, and 6 can be observed. The three sensors, MQ4 and MQ2, maintain their response stable. Meanwhile, MQ3 decreases its response over time.

5.1.5. General Findings of Preliminary Analyses

In general terms, we can affirm that the included sensors have diverse sensed values for the same compound in the same conditions. It means that the gathered value for the same compound varies according to the sensor used. This might be explained by the diverse ways in which the VOCs of the essential oils interfere with the MQ sensors of the eNose. Therefore, in the following section, it is necessary to include all the data. Another possible explanation is the sensors’ location and the heterogeneous VOCs’ distribution. A fan will be included in future designs to ensure a homogeneous distribution of VOCs along the measuring chamber.
Regarding the measuring time and the trends, the most observed trend is the decrease in the signal of the sensors over time, mainly in samples with essential oil. The rapid evaporation of VOCs of the superficial layer of the essential oil might explain it. The compounds can then be consumed in the MQ sensor or even retained in the walls of the measuring chamber. Regarding the samples with empty chambers, no general trends can be highlighted. In most cases, the measures remain stable during the studied period. In some cases with the empty chamber, abnormal values are detected; a sensor malfunction or abnormal conditions within the chamber can explain this. This will be studied in future experiments. After analysing the observed trends, we can affirm that simply measuring the initial hours could be enough. The subsequent section deals with the effect of including different amounts of data on the system’s accuracy.

5.2. Definition of Best Sensors and Formulas

5.2.1. Multivariate Analyses and ANN Using All Generated Data

As a part of the multivariate analyses, Figure 9 depicts the correlation between all parameters for the whole dataset. The first column represents the different samples. High correlation coefficients in the first column indicate what sensors, configured with which equation, seem promising for the correct classification. The rest of the columns indicate the correlation between sensors and the equations used. It is possible to see that all values gathered with MQ2 are highly correlated. It indicates that barely any differences can be observed between the selection of one equation on another. This suggests that the interference of VOCs of essential oils affects similarly regardless of the configuration of the sensor. The sole difference is found in MQ2-3, which is not correlated with other MQ2 values.
MQ2 values are positively correlated with MQ5 and MQ8 data; and negatively correlated with MQ6 and MQ7. Regarding MQ3, we can only identify a high correlation between MQ3-4 and MQ5. MQ3 is positively or negatively correlated with MQ4, MQ5, MQ7, and MQ8. Nonetheless, the correlations are less evident than in MQ2 data. MQ3-8 is only correlated with MQ7-1 and MQ7-3. Nevertheless, the correlation value is very low. MQ3-2 and MQ3-3 are correlated with most of the MQ5 and MQ7 parameters negatively and positively correlated with the MQ8-1, MQ8-2, and MQ8-4. Again, the correlations were not so strong as for MQ2.
The MQ4 has a weak positive correlation with MQ5 and MQ8 and a negative correlation with MQ6 and MQ7. MQ5 is strongly positively correlated with MQ2 and MQ8 and negatively with MQ6. In addition, a weak negative correlation is found between MQ5 and MQ7. MQ6 and MQ7 have similar results, with a strong and positive correlation between them and a negative correlation with MQ2, MQ4, MQ5, and MQ8. For MQ6, the negative correlations are stronger for MQ 2, MQ5, and MQ8 and weaker for MQ4. In the case of the MQ7 sensor, the negative correlations are only strong for MQ8 and weak for the rest. In addition, MQ7 is strongly positively correlated with MQ6. The correlations for MQ8 parameters are already explained in previous cases.
The fact that no strong correlation can be found among compounds verifies the general findings of preliminary results in which we affirm that the response of sensors for the same compound is different. It is necessary to remark that essential oils are not composed of any of the chemical compounds the sensors can measure. The VOCs of essential oil become an interferent for the MQ-based sensors.
Figure 10 represents the dendrogram obtained when all data is included in the CA. The results of Figure 10a indicated that for the different samples and timing, accurate classification is possible. The ID of the samples is composed of four digits. The first digit indicates the number of the sample; see Table 3. The other three digits refer to the time the sample remains in the measuring chamber. The results showed that the samples of essential oil of Cistus ladanifer could be distinguished from the samples of adulterated essential oil. Moreover, both of them can be distinguished from the Pinus pinaster essential oil sample. The only mixture is between some values of the blank tests, the empty chamber. The results for Figure 10b, which include only the initial 5 h of data, are similar to the results in Figure 10a. This indicates that a reduced measuring time does not impact the classification of data using CA.
Finally, in order to achieve a better classification, an ANN is used. According to the confusion matrix of the ANN, 100% of samples can be correctly classified, see Table 4. In total, 2 hidden layers are used for the ANN and 33 input neurons are considered. The ANN is trained with jackknifing and assumes an equal previous probability for all groups with an equal error cost for all groups. When only the initial 5 h are included in the ANN, the classification results are the same, 100% of correctly classified cases. Thus, these results sustain that the measuring time can be reduced.

5.2.2. Best Equation for Each Sensor

In this subsection, we select for each sensor the equation that better differentiates the samples. For this selection, analyses of variance (ANOVA) are used. A summary of the F-value and p-value for each MQ sensor and each compound is presented in Table 5. The combination of the MQ sensor and equation (or compound) that had a higher F-value, or lower p-value, resulted in the ANOVA being selected. The selected ones are MQ2-4, MQ3-3, MQ4-9, MQ5-1, MQ6-2, MQ7-2, and MQ8-1.
Regarding the data of the selected sensors and equations and to outline the information, a correlation matrix from the multivariate analyses of selected data is drawn, as shown in Figure 11. There are still strong positive and negative correlations among selected sensors, which might indicate that a further reduction in data can be applied.
Using these data, new CA, dendrograms, and ANN were generated. The dendrograms of Figure 12a,b include all the selected data and the initial 5 h of the selected data, respectively. The dendrograms showed a more precise differentiation of samples. In this case, no measurements of the empty chamber are mixed with the measurements of the chamber with the essential oil in Figure 12 b. Again, the adulterated and pure essential oil of Cistus ladanifer are differentiated. Regarding the ANN, the results are the same as when all data are included. A success rate of 100% of samples correctly classified is achieved both with all the data and only with the initial 5 h of the data.

5.2.3. Best Sensor Combination

Considering that after reducing the used data by using only the selected sensors and equations, (i) dendrograms have improved in terms of better clusters creation for differentiating the samples, (ii) ANN maintains 100% of correctly classified cases, and (iii) the multivariate analyses indicate a high degree of correlation, further data reduction is explored in this section. This reduction of data has two main functionalities. On the one hand, reduced data involve fewer processing requirements, which can facilitate the device to operate in less powerful nodes. On the other hand, the use of fewer sensors impacts the price of the device and its energy consumption. Thus, we have set as an objective to use only two MQ sensors for the detection of adulterated essential oil.
To determine which combination of sensors offers the best results, ANN was trained for the different combinations of selected sensors in pairs. For this purpose, a total of 21 ANNs were trained and compared. Data from the 11 h are used in the training of each one of the ANN. Table 6 summarises the percentage of correctly classified cases for each ANN. The combination that achieves the 100% of correctly classified cases is MQ3-3 and MQ8-1. Focusing on the ANN with MQ3-3 and MQ8-1, the 2D classification graphic can be seen in Figure 13. This graphic corresponds to the classification done with the 11 h of generated data. Nonetheless, in order to verify that the time can be reduced, an additional ANN is done solely with the initial 5 h of data. Again, the correctly classified cases are maintained as 100%.

5.2.4. General Findings of the Selected Sensors and the Classification Results

The general findings of this second subsection can be summarised as follows:
  • Identifying the different essential oils and even pure and adulterated essential oil is possible. This implies that the sensing device can identify fraudulent products or differentiate between products in the pharmaceutical industry, cosmetics, perfumery, and the food industry.
  • The multivariate analyses and the correlation matrix pointed out that there is a high degree of correlation on sensed data of most of the sensors. This might indicate that the VOCs in the essential oils similarly affect most of the sensors.
  • The dendrograms and ANNs proved that it is possible to reduce the data size both in terms of input variables and time. Thus, it is possible to correctly classify the samples using only two sensors with a single equation in the code of the eNose. The selected sensors are the MQ3-3 and the MQ8-1. The time reduction allows the correct classification even when only the 5 initial hours of data are included in the dendrograms or the ANN.
  • Apparently, empty chamber measurements are not easily mixed with other data, which might indicate that 1 h, the erased data portion, is enough to clean the chamber. Nonetheless, since existing data are still limited, it is recommended to wait at least 5 h with the empty chamber before performing an additional measurement. This is particularly important in future tests when the quantification of compounds will be done. It is also important when the sample to be identified is characterised by a lower concentration of VOCs than the previous one.

5.3. Comparison with Related Work

In Section 2, we have presented the state of the art of eNoses and the detection of fraudulent products in food and cosmetics. The information is summarised in Table 7 to allow a fair comparison with obtained results.
We should highlight that no paper has analysed the use of eNose for detecting fraudulent essential oil. Among the papers focused on fraudulent products [20,21,22,26], none of them achieves an accuracy of 100%, as in our case. The detection of fraudulent meat is the one with the highest accuracy, i.e., 99.97%. The detection of fraudulent edible oil, which might have similar characteristics (liquid with VOCs), has an accuracy of 97.3%, lower than the one reported in this paper. The lowest accuracies were for the ghee, vanaspati, and tomato paste, with values from 79 to 92.2%. Focusing on liquids, the classification of beer, wine, tea, coffee, and essential oils, with no adulterations, offered generally better results than previous ones, except for beer and wine.
Focusing on the classification methods, most papers used DFA and PCA, and some used AI. CA and correlation analyses are the less used methods. In our paper, we combine CA- and IA-based methods, i.e., the ANN.
Regarding the sensors used, sensors from the MQ family were used in all the cases. In some cases, sensors from the TGS family were also used [20,21,24,27]. As in our case, some authors focused on determining the minimum number of sensors that can be used for accurate classification [20,22,23,24]. When TSG and MQ sensors are included, MQ sensors are preferred [24] or combined with TSG [23]. This might indicate that MQ sensors are more accurate than TSG. MQ3 sensors were selected as preferred sensors in all cases, except in [24], which is only included as the third sensor. MQ8 is considered a preferred sensor in two cases [22,24]. Note that [20], which did not select MQ8 sensors as a preferred sensor, did not include it in the eNose. This information confirms our results, which indicate that MQ3 and MQ8 sensors are preferred among the tested ones.

6. Conclusions

Detecting adulterated products in pharmaceutics, cosmetics, and the food industry is important for consumers and producers. Essential oils are used for the elaboration of many products. Different prices characterise essential oils as raw materials, and detecting adulteration might be challenging with low-cost methods.
In this paper, we have proposed using an eNose to identify the adulteration in the essential oil of Cistus ladanifer with the oil of Pinus pinaster. In addition, we have compared which of the tested MQ sensors provides more accurate classification results when data are used as input for an ANN. The analyses of the variability of gas sensors’ response over time are evaluated. Our results indicate that using MQ3-3 and MQ8-1 sensors, it is possible to detect adulterated essential oil with 100% of accuracy.
In future work, we will analyse the adulteration of Cistus ladanifer with additional essential oils and different percentages. Moreover, modifications of the measuring chamber by adding a heating plate to reduce the measuring time will be studied. Regarding the measurement chamber, the use of other designs, such as a spherical-shaped chamber and a fan, will be evaluated to maximise the homogeneous distributions of VOCs. Finally, the use of this measuring chamber with the Cistus ladanifer individuals to estimate the quality and quantity of essential oil, gathering measurements for distributed database [45] and smart farming [46], will be tested as part of an ongoing research project. Additional tests will include the study of the long-term stability and resistance drift of the device on gas-sensitive performance.

Author Contributions

Conceptualisation, S.S. and J.L.; methodology, L.P.; formal analysis, S.V.-T.; investigation, S.V.-T., S.S. and J.L.; resources, S.S. and J.L.; data curation, L.P. and S.V.-T.; writing—original draft preparation, L.P., S.S., J.M.J. and S.V.-T.; writing—review and editing, J.L.; supervision, S.S. and J.L.; project administration, S.S. and J.L.; funding acquisition, S.S. and J.L. All authors have read and agreed to the published version of the manuscript.
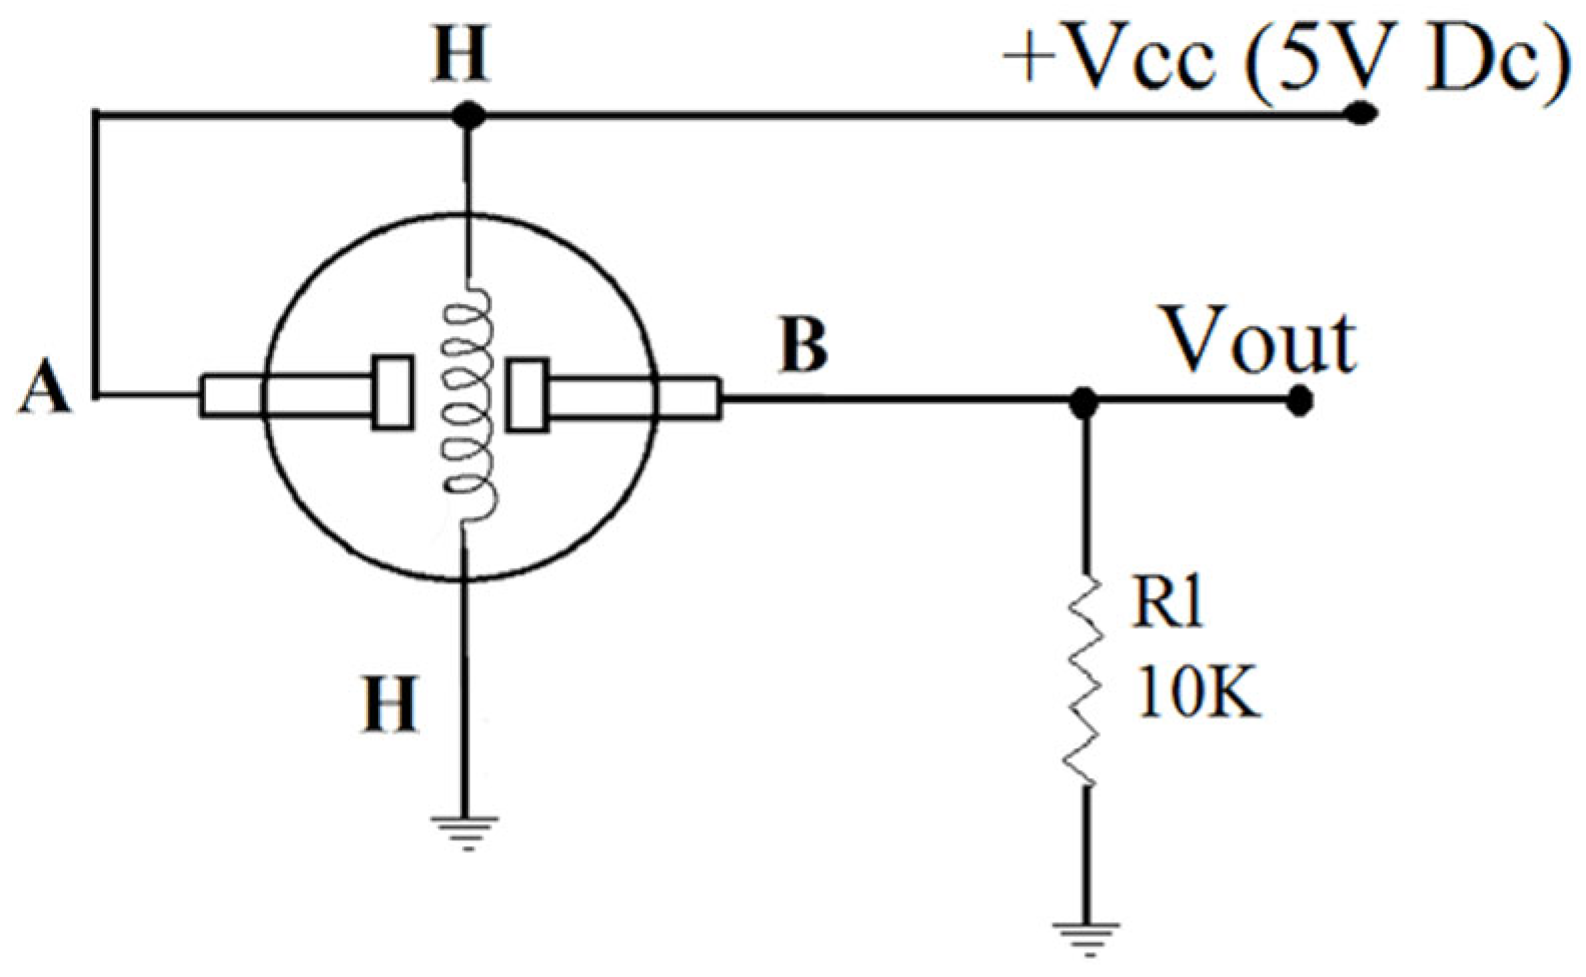
Funding

This work has been funded by the “Ministerio de Ciencia e Innovación” through the Project PID2020-114467RR-C33/AEI/10.13039/501100011033, by “Ministerio de Agricultura, Pesca y Alimentación” through the “proyectos de innovación de interés general por grupos operativos de la Asociación Europea para la Innovación en materia de productividad y sostenibilidad agrícolas (AEI-Agri)”, project GO TECNOGAR, and by the “Ministerio de Economía y Competitividad” through the Project TED2021-131040B-C31.

Institutional Review Board Statement

Not applicable.

Informed Consent Statement

Not applicable.

Data Availability Statement

The data presented in this study are available on request from the corresponding author. The data are not publicly available due to privacy constraints.

Conflicts of Interest

The authors declare no conflict of interest.

References

  1. Dubnicka, M.; Cromwell, B.; Levine, M. Investigation of the Adulteration of Essential Oils by GC-MS. Curr. Anal. Chem. 2020, 16, 965–969. [Google Scholar] [CrossRef]
  2. Pappas, R.; Satyal, P. Adulteration Analysis in Essential Oils. Int. J. Prof. Holist. Aromather. 2016, 5, 33. [Google Scholar]
  3. da Gomes, M.V.S.; da Silva, J.D.; Ribeiro, A.F.; Cabral, L.M.; de Sousa, V.P. Development and validation of a quantification method for α-humulene and trans-caryophyllene in Cordia verbenacea by high performance liquid chromatography. Rev. Bras. Farmacogn. 2019, 29, 182–190. [Google Scholar] [CrossRef]
  4. Lebanov, L.; Tedone, L.; Ghiasvand, A.; Paull, B. Random Forests machine learning applied to gas chromatography–Mass spectrometry derived average mass spectrum data sets for classification and characterisation of essential oils. Talanta 2020, 208, 120471. [Google Scholar] [CrossRef]
  5. Ali, M.M.; Hashim, N.; Abd Aziz, S.; Lasekan, O. Principles and recent advances in electronic nose for quality inspection of agricultural and food products. Trends Food Sci. Technol. 2020, 99, 1–10. [Google Scholar]
  6. Karakaya, D.; Ulucan, O.; Turkan, M. Electronic nose and its applications: A survey. Int. J. Autom. Comput. 2020, 17, 179–209. [Google Scholar] [CrossRef]
  7. Park, S.Y.; Kim, Y.; Kim, T.; Eom, T.H.; Kim, S.Y.; Jang, H.W. Chemoresistive materials for electronic nose: Progress, perspectives, and challenges. InfoMat 2019, 1, 289–316. [Google Scholar] [CrossRef]
  8. Wu, Z.; Wang, H.; Wang, X.; Zheng, H.; Chen, Z.; Meng, C. Development of Electronic Nose for Qualitative and Quantitative Monitoring of Volatile Flammable Liquids. Sensors 2020, 20, 1817. [Google Scholar] [CrossRef]
  9. Maw, A.K.; Somboon, P.; Srituravanich, W.; Teeramongkonrasmee, A. A Hybrid E-nose System based on Metal Oxide Semiconductor Gas Sensors and Compact Colorimetric Sensors. In Proceedings of the 2021 IEEE International Conference on Automatic Control & Intelligent Systems (I2CACIS), Shah Alam, Malaysia, 26 June 2021; IEEE: Piscataway, NJ, USA, 2021; pp. 352–357. [Google Scholar]
  10. Moufid, M.; Tiebe, C.; El Bari, N.; Bartholmai, M.; Bouchikhi, B. Characterisation of Unpleasant Odors in Poultry Houses Using Metal Oxide Semiconductor-Based Gas Sensor Arrays and Pattern Recognition Methods. Chem. Proc. 2021, 5, 52. [Google Scholar]
  11. Jia, W.; Liang, G.; Jiang, Z.; Wang, J. Advances in Electronic Nose Development for Application to Agricultural Products. Food Anal. Methods 2019, 12, 2226–2240. [Google Scholar] [CrossRef]
  12. Seesaard, T.; Goel, N.; Kumar, M.; Wongchoosuk, C. Advances in gas sensors and electronic nose technologies for agricultural cycle applications. Comput. Electron. Agric. 2022, 193, 106673. [Google Scholar] [CrossRef]
  13. Roine, A.; Veskimäe, E.; Tuokko, A.; Kumpulainen, P.; Koskimäki, J.; Keinänen, T.A.; Häkkinen, M.R.; Vepsäläinen, J.; Paavonen, T.; Lekkala, J.; et al. Detection of Prostate Cancer by an Electronic Nose: A Proof of Principle Study. J. Urol. 2014, 192, 230–235. [Google Scholar] [CrossRef] [PubMed]
  14. Behera, B.; Joshi, R.; Anil Vishnu, G.K.; Bhalerao, S.; Pandya, H.J. Electronic nose: A non-invasive technology for breath analysis of diabetes and lung cancer patients. J. Breath Res. 2019, 13, 024001. [Google Scholar] [CrossRef]
  15. Miller, T.C.; Morgera, S.D.; Saddow, S.E.; Takshi, A.; Palm, M. Electronic Nose With Detection Method for Alcohol, Acetone, and Carbon Monoxide in Coronavirus Disease 2019 Breath Simulation Model. IEEE Sens. J. 2021, 21, 15935–15943. [Google Scholar] [CrossRef] [PubMed]
  16. Baldini, C.; Billeci, L.; Sansone, F.; Conte, R.; Domenici, C.; Tonacci, A. Electronic Nose as a Novel Method for Diagnosing Cancer: A Systematic Review. Biosensors 2020, 10, 84. [Google Scholar] [CrossRef] [PubMed]
  17. Taştan, M.; Gökozan, H. Real-time monitoring of indoor air quality with internet of things-based E-nose. Appl. Sci. 2019, 9, 3435. [Google Scholar] [CrossRef]
  18. Mahmud, M.M.; Seok, C.; Wu, X.; Şennik, E.; Biliroğlu, A.Ö.; Adelegan, O.J.; Kim, I.; Jur, J.S.; Yamaner, F.Y.; Oralkan, Ö. A Low-Power Wearable E-Nose System Based on a Capacitive Micromachined Ultrasonic Transducer (CMUT) Array for Indoor VOC Monitoring. IEEE Sens. J. 2021, 21, 19684–19696. [Google Scholar] [CrossRef]
  19. Ma, H.; Wang, T.; Li, B.; Cao, W.; Zeng, M.; Yang, J.; Su, Y.; Hu, N.; Zhou, Z.; Yang, Z. A low-cost and efficient electronic nose system for quantification of multiple indoor air contaminants utilizing HC and PLSR. Sens. Actuators B Chem. 2022, 350, 130768. [Google Scholar] [CrossRef]
  20. Mohammad-Razdari, A.; Ghasemi-Varnamkhasti, M.; Yoosefian, S.H.; Izadi, Z.; Siadat, M. Potential application of electronic nose coupled with chemometric tools for authentication assessment in tomato paste. J. Food Process. Eng. 2019, 42, e13119. [Google Scholar] [CrossRef]
  21. Karami, H.; Rasekh, M.; Mirzaee-Ghaleh, E. Application of the E-nose machine system to detect adulterations in mixed edible oils using chemometrics methods. J. Food Process. Preserv. 2020, 44, e14696. [Google Scholar] [CrossRef]
  22. Roy, M.; Hariharan, N.; Manoj, D.; Auddy, I.; Shanmugasundaram, S. Development of metal oxide semiconductor gas sensor based electronic nose system for adulteration detection in ghee. Pharm. Innov. J. 2021, 10, 30–38. [Google Scholar]
  23. Montoya, J.J.M.; Penalva, G.T.; Navarro, E.À.; Zea, K.H.; Suaña, J.A.R.; Chilo, J. IoT Aroma Sensor Module to Determine Beverage Alcohol Grade. In Proceedings of the 2021 11th IEEE International Conference on Intelligent Data Acquisition and Advanced Computing Systems: Technology and Applications (IDAACS), Cracow, Poland, 22–25 September 2021; IEEE: Piscataway, NJ, USA, 2021; Volume 1, pp. 43–48. [Google Scholar]
  24. Wang, J.; Zhang, C.; Chang, M.; He, W.; Lu, X.; Fei, S.; Lu, G. Optimisation of electronic nose sensor array for tea aroma detecting based on correlation coefficient and cluster analysis. Chemosensors 2021, 9, 266. [Google Scholar] [CrossRef]
  25. Avian, C.; Leu, J.S.; Prakosa, S.W.; Faisal, M. An Improved Classification of Pork Adulteration in Beef Based on Electronic Nose Using Modified Deep Extreme Learning with Principal Component Analysis as Feature Learning. Food Anal. Methods 2022, 15, 3020–3031. [Google Scholar] [CrossRef]
  26. MQ-135 Datasheet. Available online: https://datasheet4u.com/datasheet-parts/MQ-135-datasheet.php?id=605076 (accessed on 27 December 2022).
  27. MQ-131 Datasheet. Available online: https://www.mysensors.org/dl/57c3ebeb071cb0e34c90057a/design/Ozone.pdf (accessed on 27 December 2022).
  28. MQ-136 Datasheet. Available online: https://www.mysensors.org/dl/57c3ebeb071cb0e34c90057a/design/MQ-136.pdf (accessed on 27 December 2022).
  29. MQ-137 Datasheet. Available online: https://www.mysensors.org/dl/57c3ebeb071cb0e34c90057a/design/NH3.pdf (accessed on 27 December 2022).
  30. MQ-138 Datasheet. Available online: https://www.mysensors.org/dl/57c3ebeb071cb0e34c90057a/design/MQ-138.pdf (accessed on 27 December 2022).
  31. MQ-214 Datasheet. Available online: https://www.mysensors.org/dl/57c3ebeb071cb0e34c90057a/design/1341.pdf (accessed on 27 December 2022).
  32. MQ-2 Datasheet. Available online: https://www.mysensors.org/dl/57c3ebeb071cb0e34c90057a/design/MQ2.pdf (accessed on 27 December 2022).
  33. MQ-3 Datasheet. Available online: https://www.mysensors.org/dl/57c3ebeb071cb0e34c90057a/design/MQ-3.pdf (accessed on 27 December 2022).
  34. MQ-4 Datasheet. Available online: https://www.mysensors.org/dl/57c3ebeb071cb0e34c90057a/design/MQ-4.pdf (accessed on 27 December 2022).
  35. MQ-5 Datasheet. Available online: https://www.mysensors.org/dl/57c3ebeb071cb0e34c90057a/design/MQ5.pdf (accessed on 27 December 2022).
  36. MQ-6 Datasheet. Available online: https://www.mysensors.org/dl/57c3ebeb071cb0e34c90057a/design/MQ-6.pdf (accessed on 27 December 2022).
  37. MQ-7 Datasheet. Available online: https://www.mysensors.org/dl/57c3ebeb071cb0e34c90057a/design/MQ-7.pdf (accessed on 27 December 2022).
  38. MQ-8 Datasheet. Available online: https://www.mysensors.org/dl/57c3ebeb071cb0e34c90057a/design/MQ-8%20Ver1.3%20-%20Manual.pdf (accessed on 27 December 2022).
  39. MQ-9 Datasheet. Available online: https://www.mysensors.org/dl/57c3ebeb071cb0e34c90057a/design/MQ9.pdf (accessed on 27 December 2022).
  40. DHT-11 Datasheet. Available online: https://www.mouser.com/datasheet/2/758/DHT11-Technical-Data-Sheet-Translated-Version-1143054.pdf (accessed on 27 December 2022).
  41. PB5322413 Datasheet. Available online: https://www.farnell.com/datasheets/2311476.pdf (accessed on 27 December 2022).
  42. Gomes, P.B.; Mata, V.G.; Rodrigues, A.E. Characterization of the Portuguese-grown Cistus ladanifer essential oil. J. Essent. Oil Res. 2005, 17, 160–165. [Google Scholar] [CrossRef]
  43. Faria, J.; Rodrigues, A.M. Metabolomic Variability in the Volatile Composition of Essential Oils from Pinus pinea and P. pinaster. In Biology and Life Sciences Forum; Multidisciplinary Digital Publishing Institute: Basel, Switzerland, 2021; Volume 2, p. 14. [Google Scholar]
  44. Morales-Soto, A.; Oruna-Concha, M.J.; Elmore, J.S.; Barrajon-Catalan, E.; Micol, V.; Roldan, C.; Segura-Carretero, A. Volatile profile of Spanish Cistus plants as sources of antimicrobials for industrial applications. Ind. Crops Prod. 2015, 74, 425–433. [Google Scholar] [CrossRef]
  45. Diallo, O.; Rodrigues, J.J.P.C.; Sene, M.; Lloret, J. Distributed database management techniques for wireless sensor networks. IEEE Trans. Parallel Distrib. Syst. 2013, 26, 604–620. [Google Scholar] [CrossRef]
  46. Cambra Baseca, C.; Sendra, S.; Lloret, J.; Tomas, J. A smart decision system for digital farming. Agronomy 2019, 9, 216. [Google Scholar] [CrossRef]
Figure 1. MQ-XX Gas sensor connection diagram.
Sustainability 15 03357 g001
Figure 2. Measuring device. (a) Connection diagram of our gas monitoring node. (b) Prototype developed during preliminary tests. (c) Detailed view of measuring chamber.
Sustainability 15 03357 g002
Figure 3. Sample of essential oil of Cistus ladanifer.
Sustainability 15 03357 g003
Figure 4. Measures of MQ-XX sensors for Cistus ladanifer essential oil for 11 h. The axes represent the sensor response for each one of the chemical compounds, with no units. (AF) display each of the responses to the different sensors. (A) shows the response to compound 1, (B) shows the response to compound 2, (C) shows the response to compound 3, (D) shows the response to compound 4, (E) shows the response to compound 5, and (F) shows the response to compound 6, 8 and 9.
Sustainability 15 03357 g004
Figure 5. Measures of MQ-XX sensors for Pinus pinaster essential oil for 11 h. The axes represent the sensor response for each one of the chemical compounds, with no units. (AF) display each of the responses to the different sensors. (A) shows the response to compound 1, (B) shows the response to compound 2, (C) shows the response to compound 3, (D) shows the response to compound 4, (E) shows the response to compound 5, and (F) shows the response to compound 6, 8 and 9.
Sustainability 15 03357 g005
Figure 6. Measures of MQ-XX sensors for Cistus ladanifer adulterated essential oil for 11 h. The axes represent the sensor response for each one of the chemical compounds, with no units. (AF) display each of the responses to the different sensors. (A) shows the response to compound 1, (B) shows the response to compound 2, (C) shows the response to compound 3, (D) shows the response to compound 4, (E) shows the response to compound 5, and (F) shows the response to compound 6, 8 and 9.
Sustainability 15 03357 g006
Figure 7. Measures of MQ-XX sensors after removing the Cistus ladanifer essential oil for 11 h. The axes represent the sensor response for each one of the chemical compounds, with no units. (AF) display each of the responses to the different sensors. (A) shows the response to compound 1, (B) shows the response to compound 2, (C) shows the response to compound 3, (D) shows the response to compound 4, (E) shows the response to compound 5, and (F) shows the response to compound 6, 8 and 9.
Sustainability 15 03357 g007
Figure 8. Measures of MQ-XX sensors after removing the Pinus pinaster essential oil for 11 h. The axes represent the sensor response for each one of the chemical compounds, with no units. (AF) display each of the responses to the different sensors. (A) shows the response to compound 1, (B) shows the response to compound 2, (C) shows the response to compound 3, (D) shows the response to compound 4, (E) shows the response to compound 5, and (F) shows the response to compound 6, 8 and 9.
Sustainability 15 03357 g008
Figure 9. Correlation coefficients of the multivariate analysis with the different data of the previous subsection. The X indicates that the correlation is not significant.
Sustainability 15 03357 g009
Figure 10. Dendrogram with the data from the previous subsection (a) with all the data and (b) with the data of the initial 5 h.
Sustainability 15 03357 g010
Figure 11. Correlation coefficients of the multivariate analysis with the selected data. The X value indicates that the correlation is not significant.
Sustainability 15 03357 g011
Figure 12. Dendrograms with the selected data: (a) with all the data and (b) only with the data of the initial 5 h.
Sustainability 15 03357 g012
Figure 13. Two-dimensional classification diagram of the ANN for the MQ3-3 and MQ8-1 sensors.
Sustainability 15 03357 g013
Table 1. Existing MQ-based sensors and their sensitivities.
SensorSensitive to
MQ135 [26]Air Quality (CO, CO2, Ammonia, Benzene, Alcohol, smoke)
MQ-131 [27]Ozone
MQ136 [28]Hydrogen Sulphide gas
MQ-137 [29]Ammonia, NH3, Ethanol, CO
MQ-138 [30]Benzene, Toluene, Alcohol, Acetone, Propane, Formaldehyde gas, Hydrogen
MQ214 [31]Methane, Natural gas
MQ2 [32]Methane, Butane, LPG, smoke
MQ3 [33]Alcohol, Ethanol, smoke
MQ4 [34]Methane, CNG Gas
MQ5 [35]Natural gas, LPG
MQ6 [36]LPG, butane gas
MQ7 [37]Carbon Monoxide
MQ8 [38]Hydrogen Gas
MQ-9 [39]Carbon Monoxide, LPG, CH4
Table 2. Used MQ sensors and their sensibility to the different compounds.
SensorSensible to Compound
123456789
MQ2xxxx x x
MQ3 xx x
MQ4 xxxx x
MQ5xxx x
MQ6xxxxx
MQ7xxxxx
MQ8xxxxx
MQ135 xx x x
Table 3. Description of the digits of the sample ID of Figure 10.
First Digit of the Sample IDDescription
1Essential oil of Cistus ladanifer
2Adulterated essential oil of Cistus ladanifer
3Essential oil of Pinus pinaster
4Empty chamber after Cistus ladanifer measurement
5Empty chamber after Pinus pinaster measurement
Table 4. Confusion matrix when all data are used in the ANN.
Current Sample Assigned Sample
12345
1100%0%0%0%0%
20%100%0%0%0%
30%0%100%0%0%
40%0%0%100%0%
50%0%0%0%100%
Table 5. Summary of ANOVA results for different sensors and predefined equations for each compound.
SensorF-Valuep-ValueSelectedSensorF-Valuep-ValueSelected
MQ2-13.390.0156 MQ5-5116.650.000
MQ2-224.980.000 MQ6-123.940.000
MQ2-317.440.000 MQ6-232.520.000x
MQ2-420.560.000 MQ6-35.010.0018
MQ2-625.770.000xMQ6-414.880.000
MQ3-299.120.000 MQ6-531.350.000
MQ3-3112.20.000xMQ7-1114.940.000
MQ3-73.090.0236 MQ7-2766.270.000x
MQ4-212.360.000 MQ7-3120.260.000
MQ4-317.650.000 MQ7-4159.390.000
MQ4-433.390.000 MQ7-51.130.3532
MQ4-545.870.000 MQ8-1247.820.000x
MQ4-962.040.000xMQ8-2110.460.000
MQ5-1119.920.000xMQ8-324.920.000
MQ5-2250.000 MQ8-4170.720.000
MQ5-3104.870.000 MQ8-534.530.000
MQ4108.980.000
Table 6. Summation of correctly classified cases for ANN with the combination of the selected sensors.
CombinationMQ2-6MQ3-3MQ4-9MQ5-1MQ6-2MQ7-2MQ8-1
MQ2-6x
MQ3-389.09x
MQ4-992.7396.36x
MQ5-185.4585.4590.91x
MQ6-285.4690.9187.2787.27x
MQ7-289.0994.5592.7394.5598.18x
MQ8-198.1810096.3696.3692.7389.09x
Table 7. Comparison of attained accuracy in other published papers and our case.
Ref.Main UseTested ProductsIncluded SensorsSelected SensorsClassification MethodClassification Accuracy (%)
[22]Fraudulent productsGhee and vanaspatiMQ2, MQ3, MQ4, MQ5, MQ6, MQ7, MQ8, MQ9, and MQ135MQ2, MQ3, MQ6, MQ7, MQ8DFA90.9
[20]Fraudulent productsTomato paste with starch/pumpkin/potatoTGS2600. TGS2620, MQ3, TGS880, and TGS2610TGS2610 and MQ3PCA and FDA79.1 to 92.2
[26]Fraudulent productsBeef meat with pork meatMQ2, MQ4, MQ6, MQ-9, MQ135, MQ136, MQ137, and MQ138AllDeep learning and PCA99.97
[21]Fraudulent productsEdible oilsMQ3, MQ9, MQ135, MQ136, TGS813, TGS822, TGS2602, and TGS2620AllCA, PCA, DFA, and ANN, among others97.3
[23]Quantify alcoholBeer and wineMQ2, MQ3, MQ4 and MQ135,MQ3Several AI-based93.39; 86.78, 80.16, and 88.43
[24]Differentiate productsTeaTGS800, TGS813, TGS822, TGS826, TGS832, TGS2600, TGS2610, TGS2620, MQ3, MQ5, MQ6, MQ8, MQK2, 2M00, 2M012MQK2, MQ8 (second option MQK2, MQ3, MQ8Correlation analyses and CA93.84, 94.35 (98.87 with 10 sensors)
[25]Differentiate productsCoffeeMQ2, MQ7, MQ135, MQ-137AllCorrelation analyses-
[27]Differentiate productsEssential oilsMQ3, MQ4, MQ8, MQ-9, MQ136, MQ136, TGS813, TGS822AllPCA and DFA100
OurFraudulent productsEssential oilsMQ2, MQ3, MQ4, MQ5, MQ6, MQ7, MQ8MQ3 and MQ8CA and ANN100
Disclaimer/Publisher’s Note: The statements, opinions and data contained in all publications are solely those of the individual author(s) and contributor(s) and not of MDPI and/or the editor(s). MDPI and/or the editor(s) disclaim responsibility for any injury to people or property resulting from any ideas, methods, instructions or products referred to in the content.

