Article

A Simulation Study on the Impact of the Digital Economy on CO2 Emission Based on the System Dynamics Model

1
School of Economics & Management, Northwest University, Xi’an 710127, China
2
The Western Economic Development Research Institute, Northwest University, Xi’an 710127, China
*
Author to whom correspondence should be addressed.
Sustainability 2023, 15(4), 3368; https://doi.org/10.3390/su15043368
Submission received: 30 December 2022 / Revised: 7 February 2023 / Accepted: 9 February 2023 / Published: 12 February 2023

Abstract

:
The digital economy plays an important role in achieving the strategic goal of “carbon peaking and carbon neutrality” in China. In this study, we construct a system dynamics (SD) model to comprehensively analyze the impact of the digital economy on CO2 emission. First, we simulate and forecast the future baseline of the digital economy, energy consumption, and CO2 emission in China from 2005 to 2040. Second, we study the impact of the digital economy on CO2 emission based on scenario analysis of different digital economy growth rates. Finally, we study the influencing factors of CO2 emission reduction effect of the digital economy. The results indicate the following: (1) CO2 emission will peak in 2034. From 2020 to 2025, the cumulative reduction in energy consumption intensity will be 15.75% and the cumulative reduction in CO2 emission intensity will be 20.9%. Both indicators will reach the national goals during the 14th Five-Year Plan period. However, it will require more effort to realize the goal of the share of non-fossil energy. (2) There is an inverted U-shaped relationship between the digital economy and CO2 emission. The digital economy aggravates CO2 emission mainly by promoting energy consumption, but it reduces CO2 emission by promoting the upgrading of the energy consumption structure and reducing the energy consumption intensity. (3) The R&D investment intensity and the environment investment intensity can strengthen the CO2 emission reduction effect of the digital economy. The results will be crucial for carbon reduction and provide policymakers with suggestions for sustainability.

1. Introduction

The increase in fossil energy consumption has caused a sharp growth in CO2 emission. Global warming caused by CO2 emission is a huge threat to the global environment, production, and life [1]. Reducing CO2 emission is vital for sustainable development and is an urgent policy challenge worldwide [2,3,4]. During the 75th United Nations General Assembly in 2020, the President of China announced that the country will “Strive to reach the peak of CO2 emission before 2030 and strive to achieve carbon neutrality before 2060” (referred to as dual carbon) [5]. The proposal of dual carbon provides a new goal for China. However, according to British Petroleum (BP) statistics, CO2 emission in China reached up to 9899 million tons in 2020, which was 30.7% of the global total CO2 emission [6]. In the short term, China is facing a coal-biased energy structure and has difficulties in rapidly improving clean technology [7]. With such dilemmas, the realization of the dual carbon goal and sustainability will face enormous pressure and challenges.
The Chinese government has issued a series of carbon-peaking implementation plans to build a “1+N” policy system of dual carbon. In this policy system, it is proposed to accelerate the application of digital technologies such as big data, 5G, and artificial intelligence in green and low-carbon industries. The digital economy has become a key force for China to implement the dual carbon goal and sustainability [4,8]. The digital economy has a complex impact on CO2 emission. On the one hand, it can reduce CO2 emission from fossil energy consumption and contribute to sustainability. The digital economy can promote clean technology innovation, improve production efficiency, optimize energy consumption structure, and improve energy utilization efficiency [4,9]. On the other hand, it applies more pressure to implement the dual carbon goal and sustainability in China. The digital industry itself has led to more electricity consumption and energy demand [10,11]. According to the data from the Open Data Center Council, the total energy consumption of China’s data centers was 93.9 billion kWh in 2020. It is expected that the total energy consumption of China’s data centers will reach about 380 billion kWh and the growth rate of CO2 emission will exceed 300% by 2030 [12].
It is vital to clarify the following three questions for achieving the dual carbon goal in the age of the digital economy: (i) What is the future trend of China’s digital economy, energy consumption, and CO2 emission in the age of digital economy? (ii) How does the digital economy affect CO2 emission? (iii) What factors affect the CO2 emission reduction effect of the digital economy (CREDE) and what measures can be taken to promote CO2 emission reduction and sustainability? A few studies have focused on the impact of the digital economy on CO2 emission based on a regression model. They seldom predicted the future trend and ignored the complex interaction among the digital economy, CO2 emission, and the influencing factors of CO2 emission. Additionally, there has been a lack of a research framework that could examine these three issues simultaneously. Therefore, we construct a system dynamics (SD) model to consider the interaction among multiple factors, and further study the above three issues. In this paper, firstly, we simulate and forecast the trend of the digital economy, energy consumption, and CO2 emission in China from 2005 to 2040 based on the baseline scenario. Secondly, we study the impact of the digital economy on CO2 emission based on scenario analysis of different digital economy growth rates. Finally, we study how the R&D investment intensity and the environment investment intensity affect CREDE based on the given scenario. The corresponding research findings are significant to provide policy implications for CO2 emission reduction and sustainable development.
The rest of this study is structured as follows. Section 2 is the literature review. Section 3 describes the methodology, including the subsystem division of the SD model, the model setting, the model testing, and the scenario designs. Section 4 presents the simulation results and discussion. This section analyzes the development trend of the digital economy, energy consumption, and CO2 emission subsystem, and discusses the impact of the digital economy on CO2 emission and the influencing factors of CREDE. Section 5 contains conclusions and policy implications.

2. Literature Review

The studies on the digital economy and CO2 emission can be divided into two types according to the three questions or objectives of this study mentioned in the introduction. The first type of research mainly focuses on the impact of the digital economy on CO2 emission based on the regression model. The second type of research uses the SD model to predict the future trend of CO2 emission.

2.1. Reviews of the Impact of the Digital Economy on CO2 Emission

There is a large body of research on the impact of the digital economy on CO2 emission. However, different scholars have different views on how the digital economy affects CO2 emission, which can be divided into three views:
(1) Some scholars have believed that the development of the digital economy could reduce CO2 emission [4,13,14,15]. Zhang et al. [4] used the panel data of China’s 277 cities from 2011 to 2019. They found that the digital economy can reduce CO2 emission by reducing energy consumption intensity and total energy consumption, and improving urban greening rates. Lin and Zhou [15] concluded that the digital economy can promote industrial structure upgrading and technological diffusion to reduce CO2 emission. In addition, Li and Yang [8] used the panel data of China’s 30 provinces from 2011 to 2017 and found that the digital economy would weaken the positive effect of the coal-based energy structure on CO2 emission.
(2) Some scholars have found that the development of the digital economy would exacerbate CO2 emission [16,17,18]. Sadorsky [16] held that the development of information and communication technology (ICT) intensified electricity consumption and energy consumption, which in turn increased CO2 emission. Based on the input–output analysis method, Zhou et al. [10] found that when digital demand and supply were comprehensively considered, the CO2 emission caused by the digital economy accounted for about 6%. Salahuddin et al. [11] conducted an empirical analysis of the panel data from the Organization for Economic Cooperation and Development (OECD). They found that ICT not only increased power consumption but also failed to improve energy efficiency. Furthermore, using data from the top 10 countries ranked for the competitiveness of their digital economy in 2019, Shvakov and Petrova [17] concluded that the digital economy could increase CO2 emission.
(3) Some scholars have agreed that the relationship between the digital economy and CO2 emission was an inverted U-shape. Li et al. [19] and Li and Wang [20] used panel data from 190 countries around the world and 274 cities in China. They both found an inverted U-shaped relationship between the digital economy and CO2 emission. The digital economy could increase CO2 emission by promoting energy consumption and non-green technological progress, but it would reduce CO2 emission by improving green technological progress and promoting industrial structure upgrading [20].

2.2. Reviews of CO2 Emission Prediction Based on the SD Model

Some scholars have used the SD model to predict the future trend of CO2 emission in the context of the industrial economy. They considered the dynamic and complex interaction between CO2 emission and its influencing factors. Yang et al. [2] found that China’s CO2 emission would peak in 2043 (15.2 billion tons). However, with the implementation of comprehensive measures of technological innovation, construction of the infrastructure, residents’ behavior improvement, and adjustment of the industrial structure, the peak can be brought forward to 2028. Li et al. [21] found that from 2016 to 2030, the CO2 emission from the construction industry would increase at an average annual rate of 5.58%, reaching 530 million tons in Jiangsu Province by 2030. By increasing research and experimental development (R&D) funds, accelerating the promotion of energy-efficient buildings, and promoting the implementation of carbon trading, the peak of CO2 emission can be brought forward. Gu et al. [3] held that CO2 emission would reach a peak of 2.182 million tons in 2025 in Shanghai, while the increase in the share of the tertiary industry, the promotion of the public travel modes, and the optimization of the power-generation structure and primary energy structure can promote CO2 emission reduction. Especially, the above research forecasted CO2 emission by the SD model. The model is capable of comprehensively considering the interaction of a series of factors such as GDP, energy structure, industrial structure, energy consumption intensity, technological innovation, and CO2 emission, among others.

2.3. The Research Gap

The summary of two types of research on the digital economy and CO2 emission is shown in Table 1. The research gap can be summarized as follows: (i) There is a lack of a systemic research framework to meet simultaneously the four goals listed in the last four columns of Table 1. (ii) According to Table 1, the first type of research has focused on the OLS method [4], the fixed-effect model [8,15,19], the qualitative analysis method [13], the threshold model, and the spatial Durbin model [4,20], etc., but these methods are insufficient at depicting the complex interaction and dynamic feedback among CO2 emission, the digital economy, and other related factors. The SD model used in the second type of research can address this difficulty by building causal chains and stock-flow diagrams to simulate the dynamic and complex interaction of the system [2,22]. However, the second type of research failed to involve the digital economy, which could affect the accuracy of the forecast results of CO2 emission in the age of the digital economy.
Therefore, this paper is designed to explore the impact of the digital economy on CO2 emission and forecast the future trend of CO2 emission based on the SD model. The novelty of this paper mainly includes the following three points: (i) The existing literature on the impact of the digital economy on CO2 emission failed to study the interaction and dynamic feedback of factors and forecast the future trend of CO2 emission. In this paper, we consider the complex and dynamic relationship among digital economy, CO2 emission, and the influencing factors of CO2 emission, and further construct a SD model to study the impact of the digital economy on CO2 emission. (ii) Most of the existing articles on CO2 emission projection are based on the industrial economy context and ignore the digital economy. This paper presents a forecast for the future trend of CO2 emission in the context of the digital economy. (iii) There is little research on what factors influence CREDE. We further discuss the impact of the R&D investment intensity and the environment investment intensity on CREDE by scenario analysis. This paper not only presents a new method for analyzing the impact of the digital economy on CO2 emission, but also provides a unique perspective on the digital economy for predicting CO2 emission.

3. Methodology

The SD model was first proposed by Professor J.W. Forrester in 1956 [21]. The model is built on feedback theory and uses computer simulation technology as the main approach. The model is capable of analyzing problems of non-linear, high-order and multi-feedback in a complex time-varying system, and it is helpful in studying the interaction and dynamic evolution among different factors [21,22,23]. The model has good adaptability for studying the complex socioeconomic-environmental system, and it has been widely used to research the issues of economic growth, energy, and environment [2,3]. According to Figure 1, the construction of the SD model usually consists of four steps: subsystem division, model setting, model testing, and scenario analysis [2,3,21]. In this paper, the four steps are as follows: (i) Subsystem division—the SD model can accommodate many factors, which could make the system spread without limit, so the system boundary must be defined by subsystem division. We divided it into four subsystems: the digital economy, energy consumption, population, and CO2 emission subsystem. (ii) Model setting—the causal chains and the stock-flow diagram of the digital economy and CO2 emission were constructed based on the interaction among multiple factors. (iii) Model testing—the validation of the model must be checked by calculating the relative error. (iv) Scenario analysis—after the model validity has been passed, the simulation results would be output under the designed scenarios. First, we designed the baseline scenario to simulate and forecast the development trend of the system. Second, different digital economy growth-rate scenarios were designed to analyze the impact of the digital economy on CO2 emission. Third, different R&D investment intensity and environment investment intensity scenarios were used to study their impact on CREDE.

3.1. Subsystem Division

According to our research objectives and the existing research on the influencing factors of CO2 emission [2,3,21], we divided the system into four subsystems: digital economy, energy consumption, population, and CO2 emission.
(1) Digital economy subsystem. Some scholars have defined the digital economy as a series of economic activities with data as the factor of production, and built an indicator system based on digital development foundation, digital innovation, and digital application [4,19]. Based on the existing definitions of the digital economy, we defined the digital economy as a new paradigm, and the paradigm promotes economic growth, structural optimization, and efficiency improvement by digital industrialization and industrial digitalization. According to the China Academy of Information and Communications Technology (CAICT), digital industrialization refers to the development of digital industry. Industrial digitization refers to the development of traditional industry caused by the integration of digital technology, data elements, and traditional industry [24].
(2) Energy consumption subsystem. The energy consumption subsystem can be regarded as a conduction (intermediary) system. Specifically, the digital economy mainly affects CO2 emission by acting on the energy consumption subsystem [4,17,20]. Referring to the China Energy Statistical Yearbook [25] and the study of Yang et al. [2], we divided energy consumption into coal, oil, natural gas, and other energy consumption (hydropower and nuclear power). Additionally, energy consumption can be divided into primary industrial energy consumption (agriculture, forestry, animal husbandry, fishery), secondary industrial energy consumption (industry, construction), and tertiary industrial energy consumption (warehousing and postal industry, transportation, wholesale and retail industry, accommodation and catering industry, among others), and residents’ energy consumption.
(3) Population subsystem. The growth in population will increase energy consumption demand. Therefore, the population subsystem also has an important impact on energy consumption and CO2 emission [2,3]. We mainly considered that the change in the total population might cause a change in per capita income, and the increase in per capita income would bring about growth in the residents’ energy purchasing power to affect energy consumption and CO2 emission. Since we mainly focused on the impact of the digital economy on CO2 emission in this paper, the population subsystem can be regarded as a control subsystem and not the focus.
(4) CO2 emission subsystem. CO2 emission mainly originates from fossil fuel combustion [2]. Considering the availability of data, we mainly investigated CO2 emission from fossil energy consumption. Referring to the research of Yang et al. [2], CO2 emission is equal to the sum of CO2 emission from coal, oil, and natural gas. The CO2 emission from each fossil energy consumption is equal to the multiplication of each fossil energy consumption by its carbon emission coefficient.

3.2. Model Setting

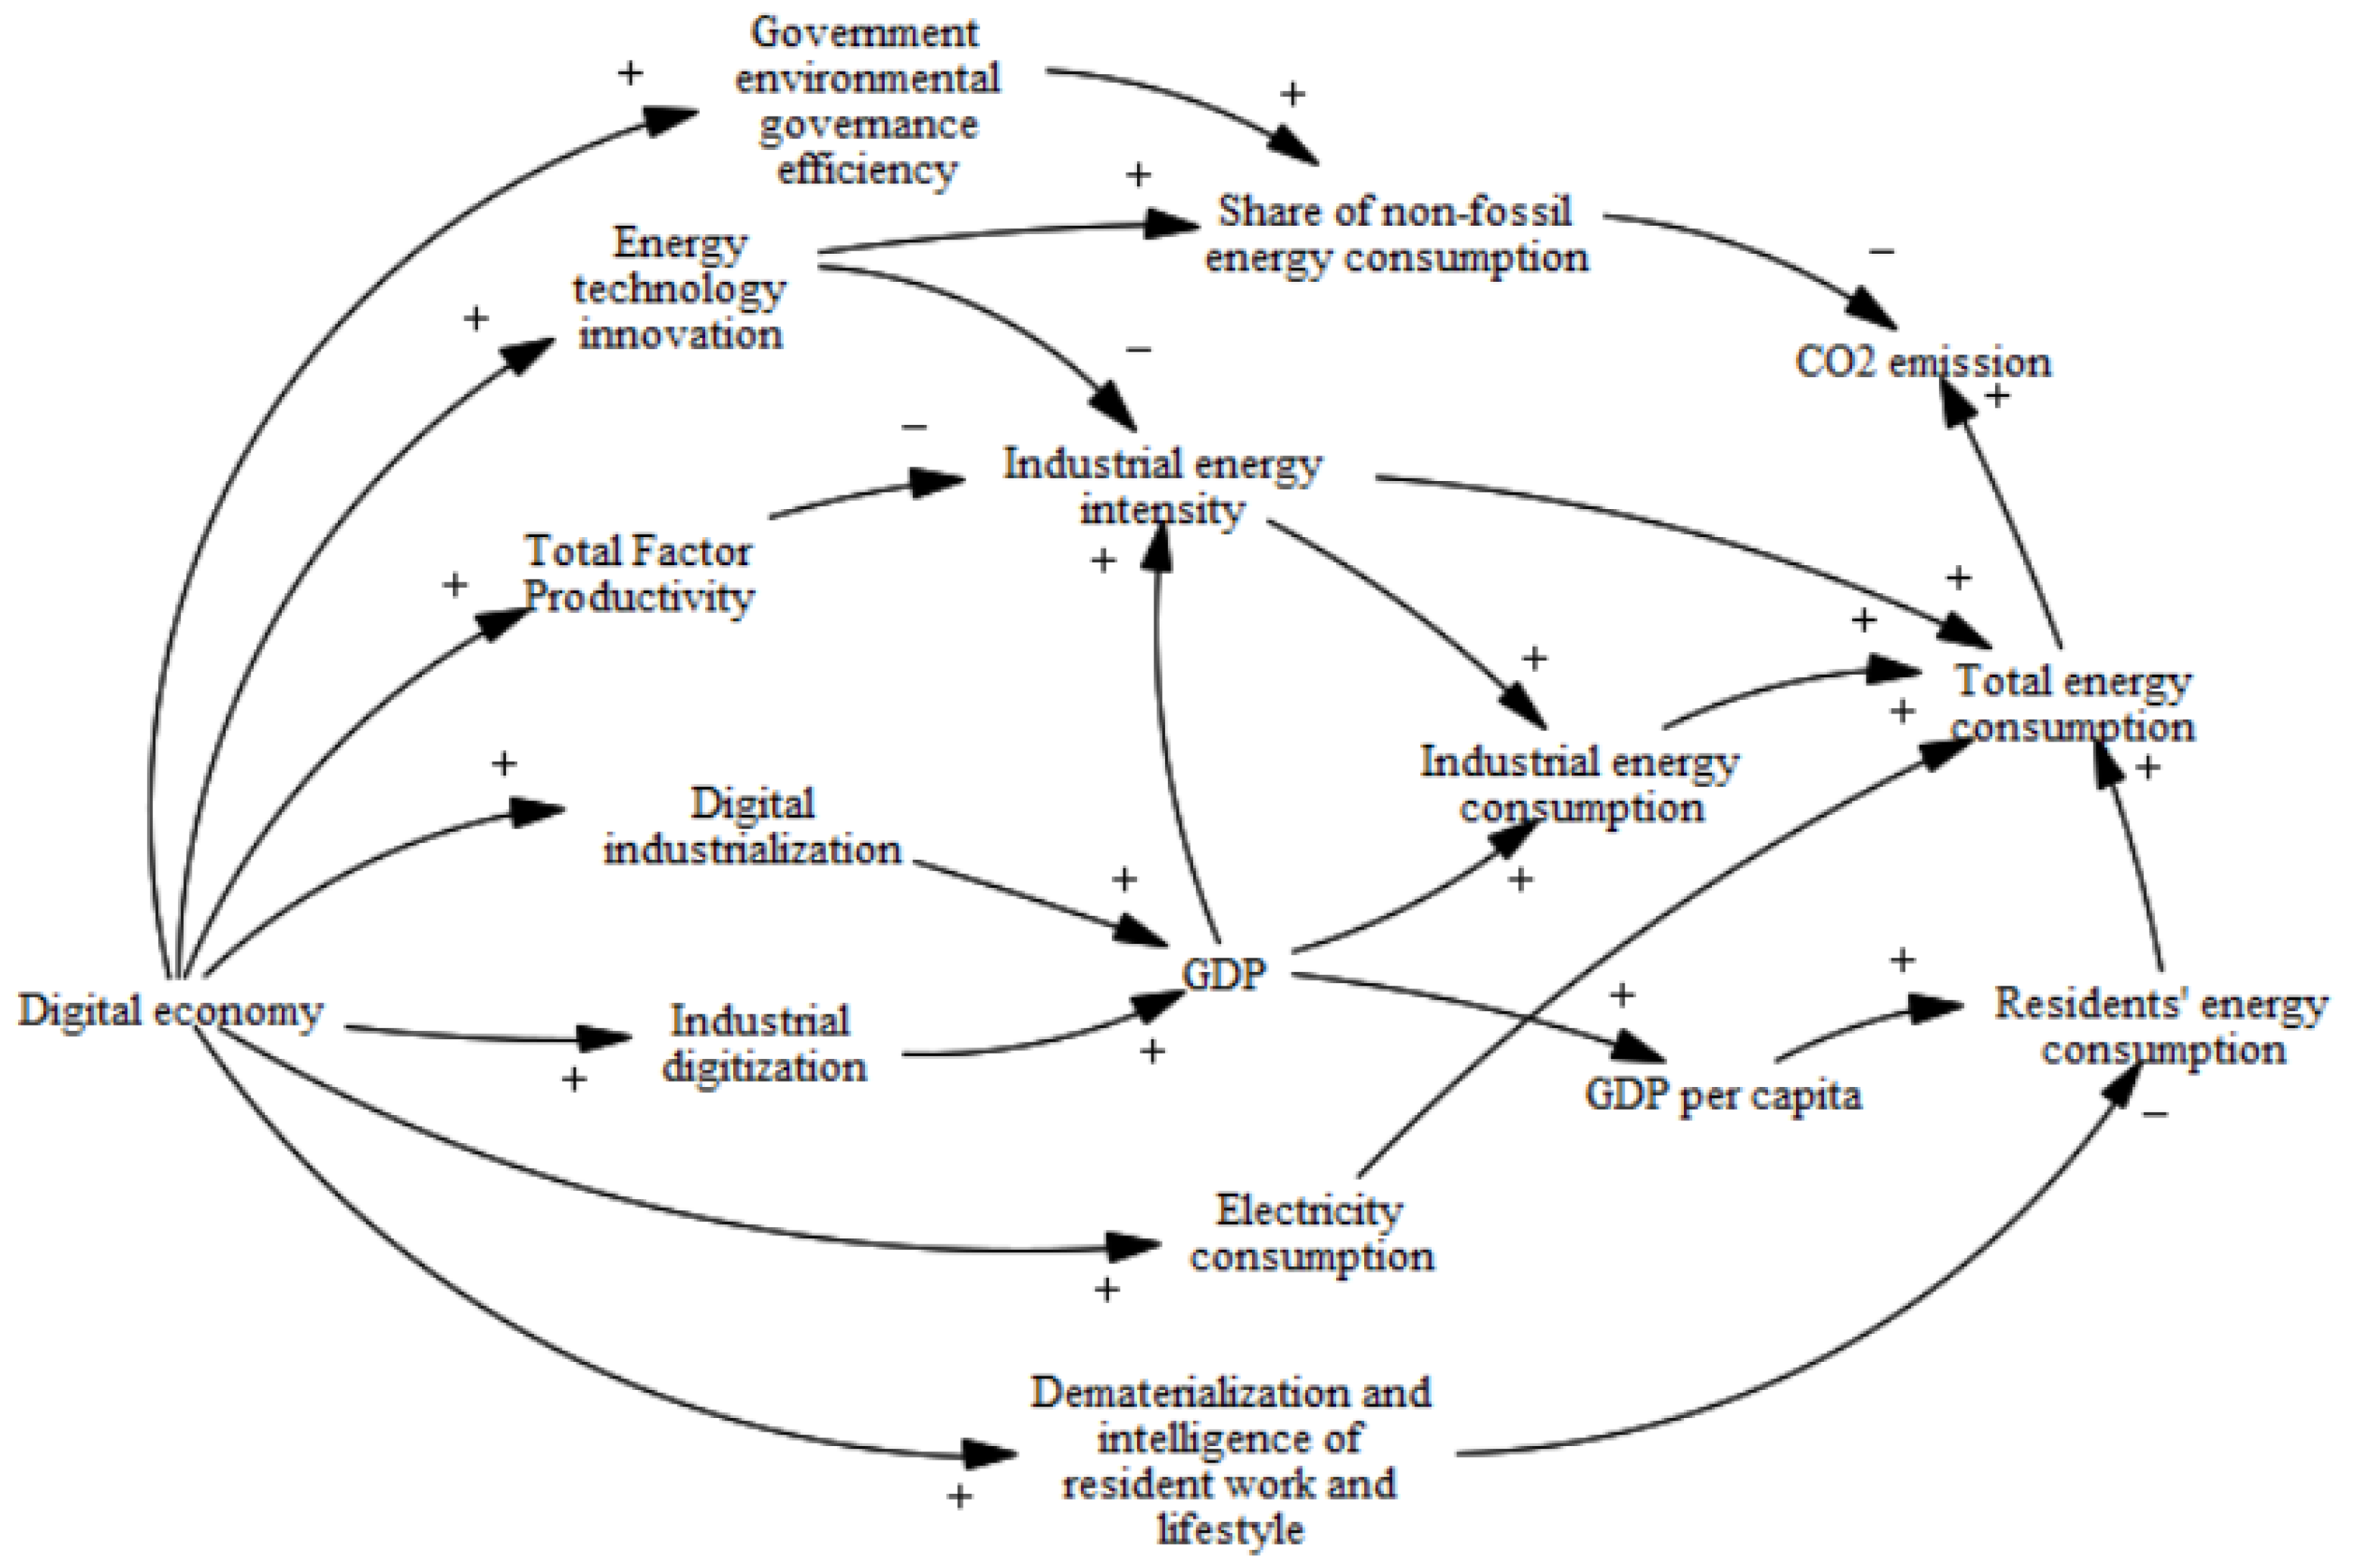
3.2.1. Causal Chains of the Digital Economy and CO2 Emission

Based on the subsystem division, we first qualitatively analyzed the impact of the digital economy on CO2 emission by the causal chains between the digital economy and CO2 emission. The major causal chains of the digital economy affecting CO2 emission are shown in Figure 2, and the following 8 causal chains were analyzed in detail (the “+” indicates that the variables changed in the same direction, and “−” indicates the opposite direction).
(1) Digital economy →+ digital industrialization or industrial digitization →+ GDP →+ industrial energy consumption →+ total energy consumption →+ CO2 emission. The digital economy manifests digital industrialization or industrial digitization, which can promote economic growth and capital accumulation [26,27]. There is a complementary relationship between capital accumulation, economic growth, and energy consumption [28]. Therefore, economic growth increases industrial energy consumption in the process of production. The growth in industrial energy consumption increases total energy consumption. The increase in total energy consumption could include a portion of the increase in fossil energy consumption, so the increase in total energy consumption might increase CO2 emission.
(2) Digital economy →+ digital industrialization/industrial digitization →+ GDP →+ GDP per capita →+ residents’ energy consumption →+ total energy consumption →+ CO2 emission. The digital economy can promote economic growth by digital industrialization and industrial digitization. Economic growth causes the growth in GDP per capita, and GDP per capita increases the residents’ purchasing power for energy-related products and services, further increasing residents’ energy consumption. The expansion of the residents’ energy consumption would increase CO2 emission.
(3) Digital economy →+ electricity consumption →+ total energy consumption →+ CO2 emission. The production, use, and disposal of digital products; the construction and operation of digital infrastructures such as the telecommunication infrastructure and data centers; and the mining of digital currencies have greatly exacerbated electricity consumption [10,28,29]. A European Strategy for data, released by the European Commission in 2020, determined that the electricity consumption of digital industry is about 5–9% of the total global electricity consumption [30]. The latest calculations from Cambridge University’s Bitcoin Electricity Consumption Index indicated that Bitcoin mining consumes 133.68 terawatt hours (TWh). This figure is higher than Sweden’s electricity usage in 2020 and has continued to rise over the past five years [31]. According to data from the Open Data Center Committee (CDCC), in 2021, the proportion of electricity consumption by data centers in China exceeded 1% of the total electricity consumption of the entire society [32]. Electricity is generated from energy consumption, so increasing electricity consumption means the growth in total energy consumption, further leading to an increase in CO2 emission.
(4) Digital economy →+ the dematerialization and intelligence of resident work and lifestyle →− residents’ energy consumption →+ CO2 emission. Digital technology can also promote the dematerialization and intelligence of resident work and lifestyle, thereby helping reduce residents’ energy needs [9,33]. Digital technology can make house design and household appliances more intelligent, thus contributing to energy saving and environmental protection of residential buildings. Moreover, during the COVID-19 pandemic, residents’ energy consumption could be reduced [34], because digital technology makes it possible to move residents’ offline activities online. The reduction in residents’ energy consumption might contribute to CO2 emission reduction.
(5) Digital economy →+ energy technology innovation →− industrial energy consumption intensity →+ industrial energy consumption →+ total energy consumption →+ CO2 emission. The application of digital technology to the energy field has promoted energy technology innovation [8,35], which helps to improve energy efficiency or decrease industrial energy consumption intensity [4,8]. For example, relying on advanced information technology, distributed energy system (DES) can integrate users’ various energy needs and optimize resource allocation by adopting digital technologies such as intelligent monitoring, networked group control, and remote control. DES can produce and supply energy according to local user needs, which can promote energy cascade utilization, reduce energy loss and transportation costs in the transmission link, and decrease energy consumption intensity. The decrease in energy consumption intensity means that the total energy consumption to produce the same output decreases. The decrease in total energy consumption might help reduce CO2 emission.
(6) Digital economy →+ total factor productivity (TFP) →− industrial energy consumption intensity →+ industrial energy consumption →+ total energy consumption →+ CO2 emission. The digital economy has realized digital simulation of production processes; created smart design, deployment, and operation for different products and services; and automated digital distribution, logistics, and intelligent management, which contribute to optimizing the production process and improving TFP [8,36,37]. For example, cyber-physical production systems (CPPS) or cyber-physical manufacturing systems (CPMS) can perceive and collect data in the manufacturing process, use big data and intelligent algorithms to make production decisions, and meet all kinds of temporary or long-term customer needs. CPPS and CPMS can enable the traditional production process to be more digital, intelligent, networked, and sustainable, thereby optimizing resource allocation and improving TFP [37,38,39,40]. The increased TFP contributes to decreasing energy consumption intensity [20]. Lower energy consumption intensity may lead to less total energy consumption and CO2 emission.
(7) Digital economy →+ energy technology innovation →+ the share of non-fossil energy consumption →− CO2 emission. The integration of artificial intelligence, big data, wireless networks, and blockchain in the energy field can promote energy technology innovation, such as the energy internet, smart grid, distributed power generation, microgrid, and other technologies. Additionally, data-sharing platforms and machine learning methods can also promote advances in battery technology [41]. Energy technology innovation can promote the acceptance and stability of non-fossil energy, and improve the utilization, transmission, and distribution efficiency of non-fossil energy. It reduces the production costs of non-fossil energy and promotes the development of non-fossil energy [8,35,42,43]. The Renewable Energy Generation Costs 2020 released by the International Renewable Energy Agency (IRENA) indicated the global grid-connected, large-scale solar photovoltaic power generation cost fell by 85% from 2010 to 2020, which made it possible to replace coal power generation with renewable energy on a large scale [44]. Because non-fossil energy often has a lower carbon emission coefficient compared with fossil energy, the development of non-fossil energy can help reduce CO2 emission.
(8) Digital economy →+ government environmental governance efficiency →+ share of non-fossil energy consumption →− CO2 emission. Digital technology can help the government establish an ecological environment data information management system (EEDIMS). EEDIMS can help the government to implement and supervise policies related to the development of non-fossil energy such as pricing and subsidy policies, strengthen the cooperation of different government departments, and ultimately improve government environmental governance efficiency [45]. Related research has shown that a 1% increase in the government governance index is accompanied by a 0.373% increase in the renewable energy consumption structure [46]. Therefore, digital technology can help improve government environmental governance efficiency, thereby promoting the upgrading of the energy consumption structure and ultimately reducing CO2 emission.
According to the above analysis, there are complex interactions and non-linear relationships among multiple factors. Thus, the SD model is appropriate to research the impact of the digital economy on CO2 emission. Next, we need to further build the stock-flow diagram of the SD model based on the causal chains.

3.2.2. Stock-Flow Diagram of the Digital Economy and CO2 Emission

For quantitative analysis, a stock-flow diagram of the digital economy on CO2 emission was constructed based on the causal chains (Figure 2) and the subsystem division, as shown in Figure 3. In Figure 3, 55 variables were selected, including 2 stocks, 2 rate variables, 46 auxiliary variables, and 5 constants. In the simulation of the stock-flow diagram, we needed to set the parameters and equations. The parameters and equations of the system in Figure 3 were mainly obtained by the following methods [2,3,21].
(1) Direct assignment method. This method is mainly based on historical data or relevant research results to directly assign values to the corresponding variables. For example, the value of the digital economy in 2005 and the value of the total population in 2005 were directly assigned based on historical data. Additionally, the CO2 emission coefficients of coal, oil, and natural gas were directly assigned according to the research of Yang et al. [2].
(2) Regression analysis method. Based on the causal relationship between variables, we mainly established the corresponding linear regression equations and estimated the regression coefficient by the OLS method. For example, by establishing the regression equation of residents’ energy consumption, GDP per capita, and the digital economy, the residents’ energy consumption could be simulated by GDP per capita and the digital economy.
(3) Ratio analysis method. Based on the proportional relationship of variables, this method simulates variables mainly depending on the quantitative relationship of variables and the corresponding calculation formula. For example, digital industrialization was equal to the digital economy multiplied by the ratio of digital industrialization to the digital economy.
(4) Table function method. This method is used to establish the non-linear relationship of variables. It is the most commonly used method in Vensim software. For example, the digital economy growth rate (DEGR) showed non-linear changes through time, so the table function could be used to input the historical data of DEGR and time.
The specific parameter settings of each variable and equations in Figure 3 are shown in Table A1 of the Appendix A. In the SD model, SPSS was used to establish the regression equations, and Vensim PLE was used to input parameters and regression equations for the simulation of the SD model.

3.3. Data Input

In the stock-flow diagram of the SD model, the simulation interval was designed to be 2021–2040 with a 1-year step. Considering the availability of data, the historical data of China from 2005 to 2020 were selected. The related historical data on the digital economy, digital industrialization, and industrial digitization were mainly from the White Paper on the Development of China’s Digital Economy, issued by the CAIT [47]. Some missing values of digital economy indicators were filled with linear interpolation. TFP was calculated by establishing the Cobb–Douglas function, the output elasticity coefficient of capital was 0.68, and the output elasticity coefficient of labor was 0.32, referring to Yang et al. [48]. The calculation of capital stock was based on the calculation of R&D capital stock [48] and the depreciation rate was 9.6% [49]. The other data, such as GDP, three industrial-added values, energy consumption, population, and others were mainly from the National Bureau of Statistics [50], the China Statistical Yearbook [51], and the China Energy Statistical Yearbook [25].

3.4. Model Testing

To ensure the reliability and accuracy of the SD model, the historical values of 50 variables (excluding 5 constants from 55 variables) from 2005–2020 were tested by the relative error. The relative error could be calculated from the historical values and the simulated values according to Equation (1) [21]:
e t = F t H t H t 100 %
where Ft is the simulation value in year t, Ht is the historical value or real value in year t, and et is the relative error in year t. The smaller et means a better fitting degree in the SD model. The mean of et is the mean absolute percentage error (MAPE), which is one of the most commonly used indicators to measure forecast error. The model is proven to be valid and reasonable only if most values of et are lower than 5% (maximum < 10%) [3] or MAPE values are lower than 7% [21].

3.5. Scenario Designs

After model validation, according to the research objectives, different research scenarios could be designed to output the corresponding simulation results. We set up the following scenarios.
(1) Baseline scenario: The baseline scenario assumed there were no limits and every factor would evolve based on a reasonable extrapolation of historical trends. Based on historical data, the trend forecast for the parameters in the table function from 2021 to 2040 was mainly carried out by the ARIMA model and by some available research results [2]. The specific parameter settings and forecast for each variable under the baseline scenario are shown in Table A1 of the Appendix A. According to the simulation of the baseline scenario, the future trend of the system could be analyzed.
(2) Different DEGR scenarios: To discuss the impact of the digital economy on CO2 emission, the table function of DEGR in the baseline scenario can be further adjusted. Based on the baseline scenario, the DEGR was designed to fall by 1%, 2%, and 3% (the DEGR was 6%, 7%, and 8%, respectively) and to rise by 1%, 2%, and 3% (the DEGR was 10%, 11%, and 12%, respectively), and the response of the other variables in the system to changes in DEGR could be observed. Additionally, to facilitate comparative analysis with the baseline scenario, other parameters in the system were kept consistent with the baseline scenario.
(3) Different R&D investment intensity and environment investment intensity scenarios: R&D investment intensity (the ratio of R&D investment to GDP(RRD)) and environment investment intensity (the ratio of the investment in environmental pollution control to GDP(RIEPC)) might have an influence on CREDE [52]. The Outline of the National Medium and Long-Term Science and Technology Development Plan (2006–2020) [53] and the National Urban Ecological Protection and Construction Plan (2015–2020) [54] proposed a series of related objectives and measures to improve RRD and RIEPC. The formulation of these strategic plans and corresponding measures has been of great significance for promoting the realization of the dual carbon goal and sustainability. Therefore, when studying the impact of the digital economy on CO2 emission, it is necessary to further examine how these measures affect CREDE. In this paper, RRD and RIEPC were designed to increase by 10%, and we investigated how CREDE was affected by RRD and RIEPC.

4. Simulation Results and Discussion

4.1. Results of Model Validation

We used Vensim software to simulate the SD model and calculated the et to test the model validation. Owing to limited space, Table 2 shows only the test results for the core variables, including the digital economy (DE), total energy consumption (TEC), and CO2 emission. In Table 2, we can see that, from 2005 to 2020, the et values of DE, TEC, and CO2 emission were mostly controlled within 5%. The MAPE of DE, TEC, and CO2 emission was 0.00%, 3.47%, and 3.52%, which were controlled within 5%. In addition, to fully verify the reliability of the model, the root mean square error (RMSE) of the prediction was calculated. The RMSE of DE, TEC, and CO2 emission was also low. According to MAPE and RMSE, the model accuracy was high. Therefore, in this paper, operating conditions and system parameters of the SD model were set reasonably, and the model can be further used for the complex relationship analysis of variables and trend prediction.

4.2. Analysis of the Development Trend under the Baseline Scenario

We simulated and predicted the future trend of the digital economy, energy consumption, and CO2 emission subsystem based on the baseline scenario. The baseline scenario assumed no policy limits and all parameters would be reasonably extrapolated from historical trends.

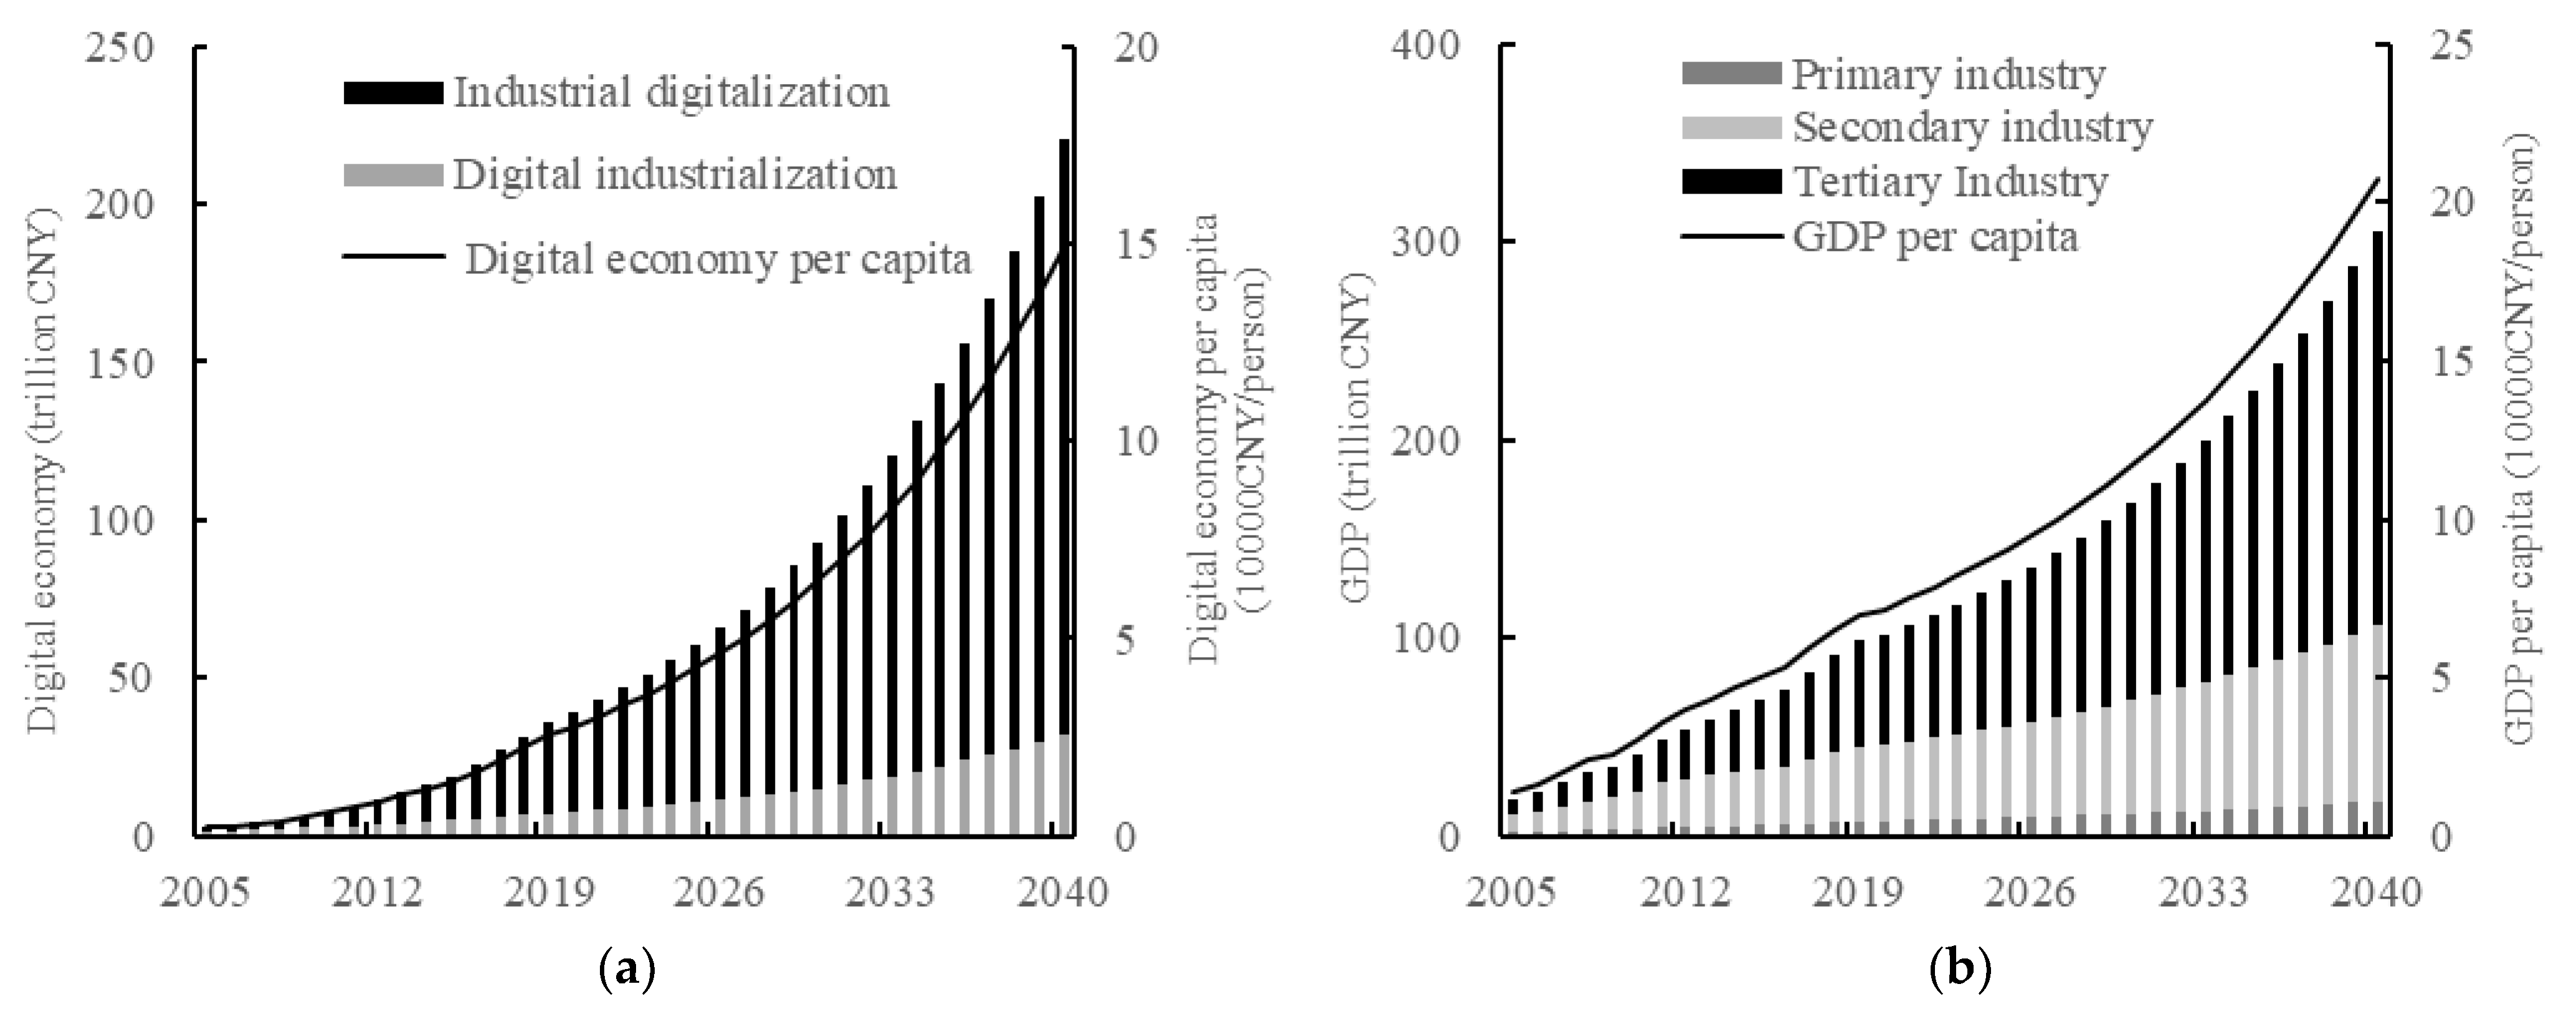
4.2.1. Analysis of the Development Trend for the Digital Economy Subsystem

The simulation results of the main variables in the digital economy subsystem under the baseline scenario are presented in Figure 4. During the period 2005–2040, the main variables in the digital economy subsystem show a rapid growth trend in China. During the period 2021–2040, the average annual growth rate of the digital economy, digital industrialization, industrial digitization, digital economy per capita, GDP, primary industrial GDP, secondary industrial GDP, tertiary industrial GDP, and GDP per capita will be 9%, 7.6%, 9.3%, 8.8%, 5.7%, 4.2%, 4.3%, 6.6%, and 5.4%, respectively. As seen in Figure 4a, by 2040, the value of the digital economy, digital industrialization, and industrial digitalization will be CNY 220.19 trillion (USD 32.59 trillion), CNY 32.15 trillion (USD 4.76 trillion), and CNY 188.04 trillion (USD 27.83 trillion), respectively, which are 5.62, 4.29, and 5.93 times that of 2020. Digital industrialization and industrial digitization will account for 15% and 85% of the digital economy in 2040, and industrial digitization will become the key driver for the development of the Chinese digital economy.
From Figure 4b, by 2040, the GDP, primary industrial GDP, secondary industrial GDP, and tertiary industrial GDP will be CNY 305.73 trillion (USD 45.25 trillion), CNY 17.73 trillion (USD 2.62 trillion), CNY 88.66 trillion (USD 13.12 trillion), and CNY 199.34 trillion (USD 29.50 trillion), respectively, which are 3.02, 2.27, 2.31, and 3.61 times that of 2020. GDP per capita will be CNY 0.2077 million per person in 2040 (USD 30,400), and there will still be a large gap among the levels of major developed countries (US was USD 55,700 in 2019). By 2040, the digital economy, digital industrialization, and industrial digitization will account for 72%, 10.5%, and 61.5% of the GDP, respectively, which means the digital economy will dominate economic growth.

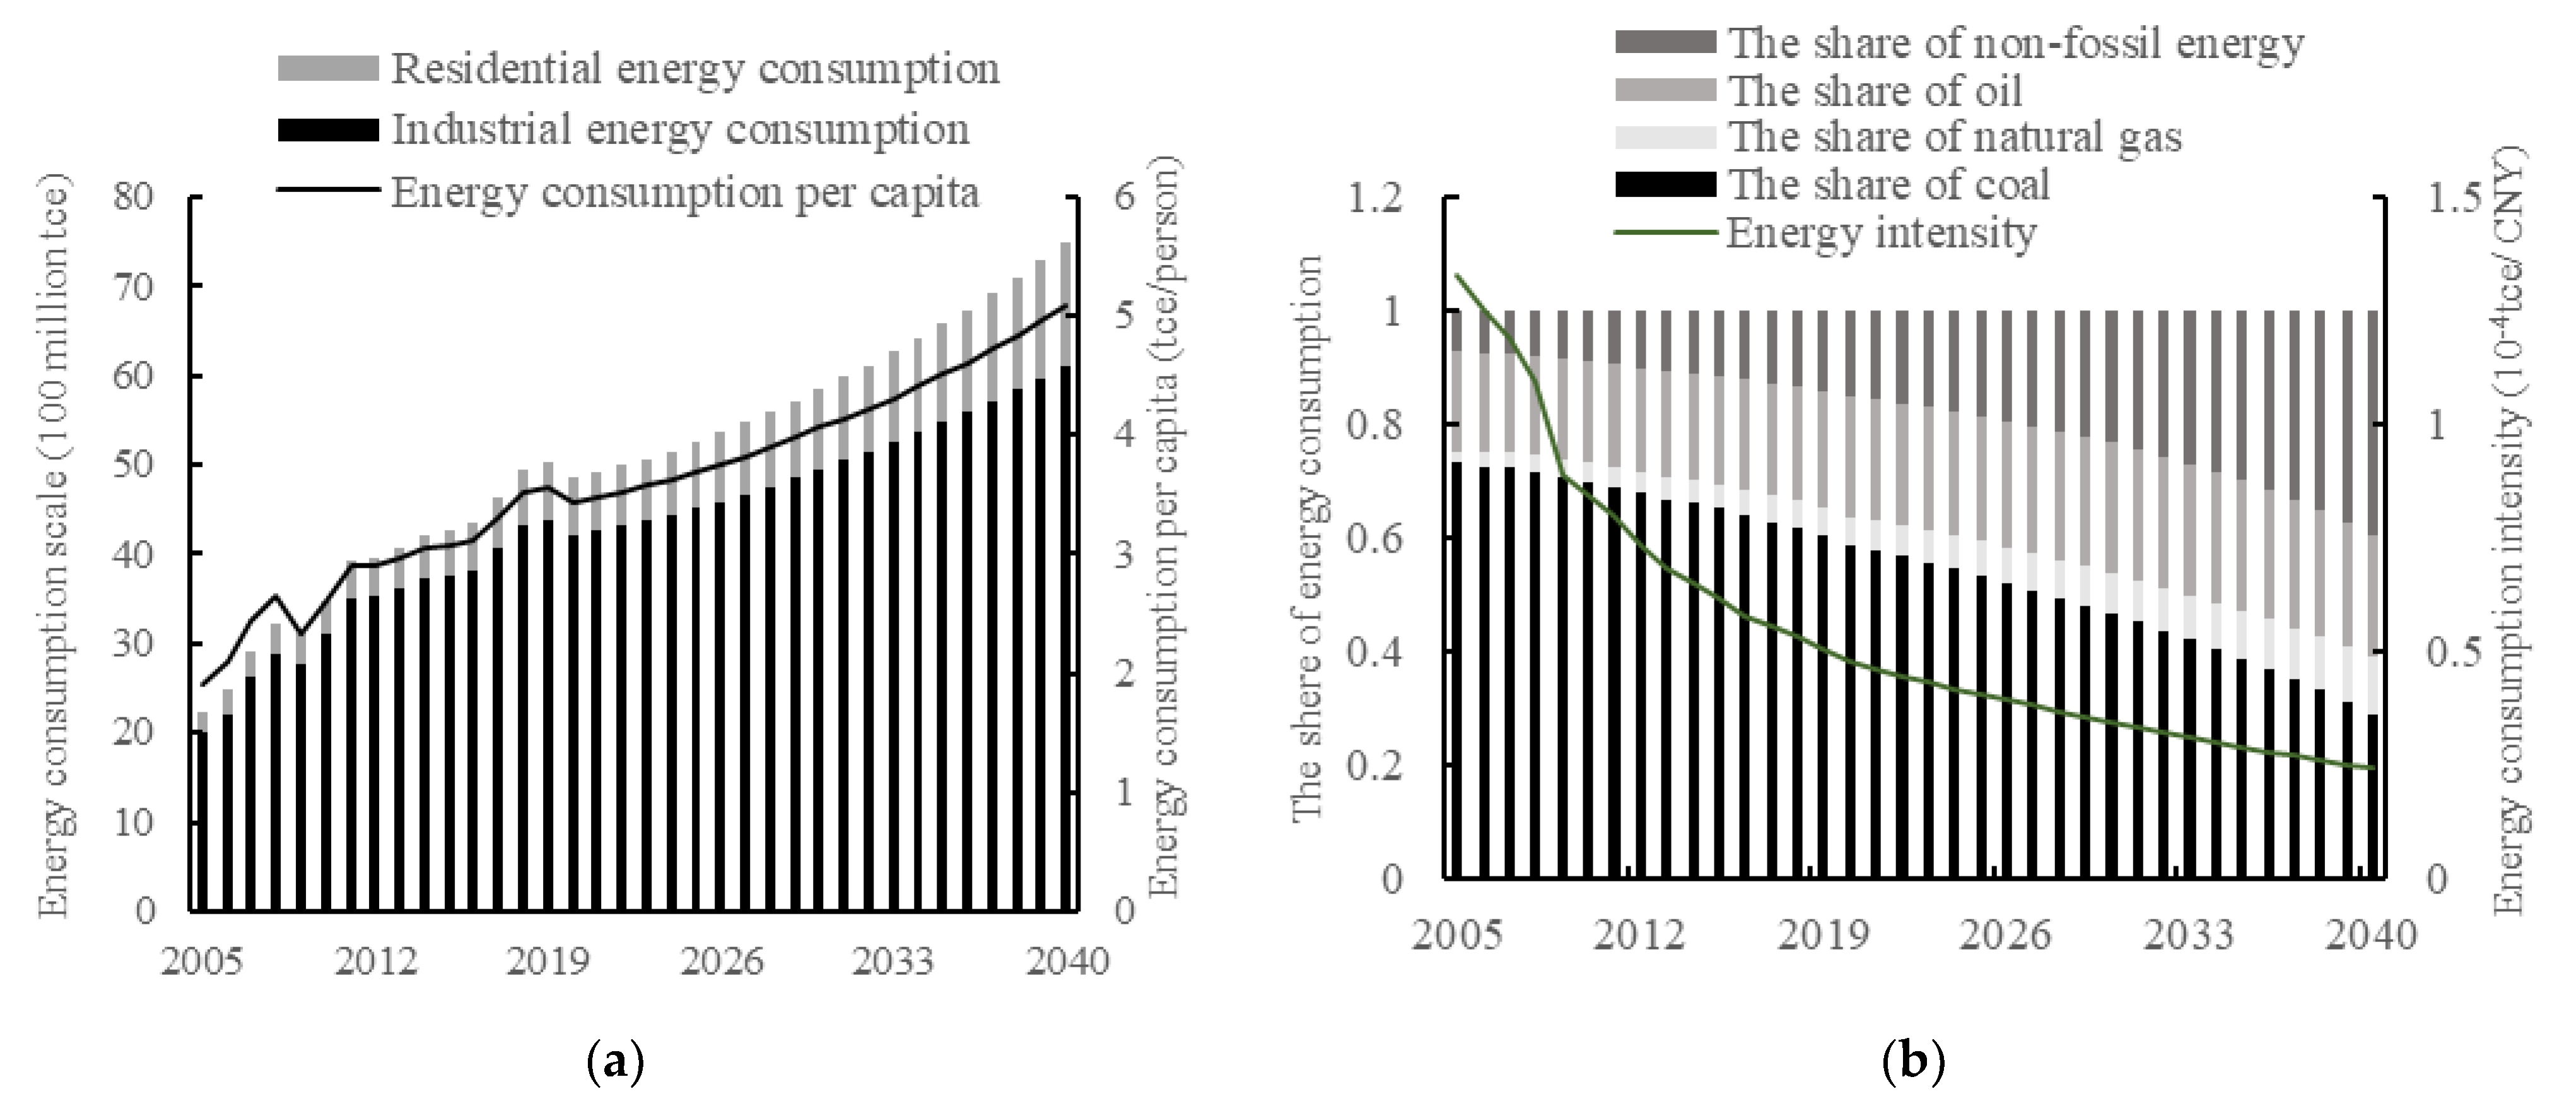
4.2.2. Analysis of the Development Trend for the Energy Consumption Subsystem

The digital economy has an important impact on the energy sector. The simulation results of the main variables in the energy consumption subsystem under the baseline scenario are shown in Figure 5. From Figure 5a, during the period 2005–2040, the total energy consumption shows an increasing trend. From 2021 to 2040, the average annual growth rates of total energy consumption, industrial energy consumption, residents’ energy consumption, and energy consumption per capita will be 2.16%, 3.92%, 1.84%, and 1.94%, respectively. By 2040, the total energy consumption, industrial energy consumption, and residents’ energy consumption will be 7.485, 6.102, and 1.383 billion tons of standard coal equivalent (tce), respectively. Energy consumption per capita will be 5.08 tce/capita, which is close to that of Germany in 1979 (6.83 tce/capita) and Japan in 2005 (5.91 tce/capita) [2].
From Figure 5b, during the period 2021 to 2040, the share of coal consumption (namely the share of coal consumption in total energy consumption) shows a downward trend. The share of oil consumption will reach the peak of 23.2% in 2033. The share of natural gas consumption and non-fossil energy shows an upward trend. By 2040, the share of coal, oil, natural gas, and non-fossil energy consumption will account for 29.2%, 21.2%, 10.02%, and 39.6%, respectively.

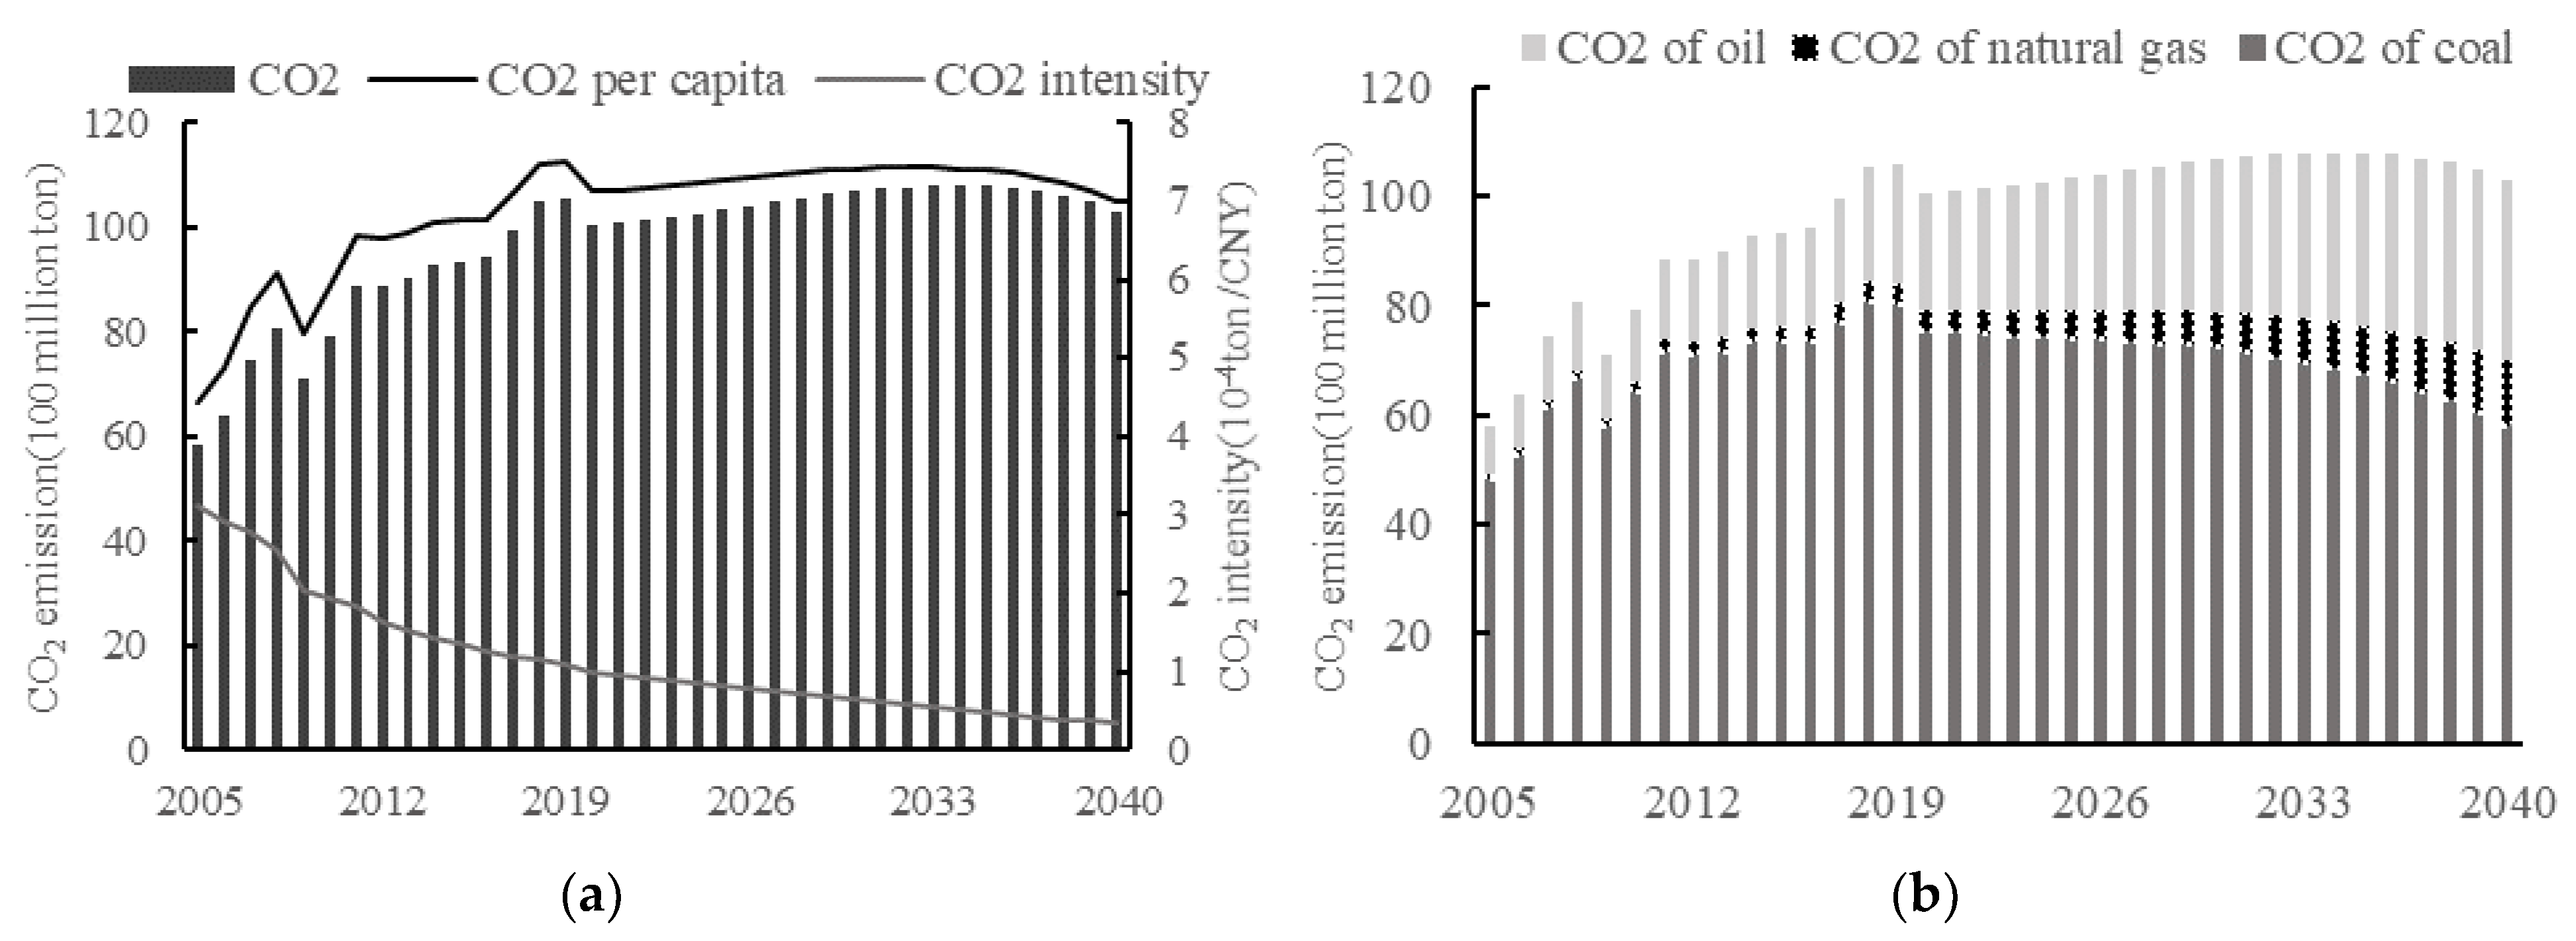
4.2.3. Analysis of the Development Trend for the CO2 Emission Subsystem

The simulation results of the main variables in the CO2 emission subsystem under the baseline scenario are presented in Figure 6. From Figure 6a, during the period 2005–2040, CO2 emission and CO2 emission per capita generally first increased and then decreased. The CO2 emission will peak in 2034 with the value of 10.79 billion tons. Efforts are still needed to reach the goal of peaking before 2030, which is consistent with the conclusion of Yang et al. [2]. CO2 emission intensity (CO2/GDP) shows a decreasing trend. From Figure 6b, during the period 2021–2040, the CO2 emission of coal shows a downward trend. CO2 emission of oil will reach its peak in 2039 (3.307 billion tons). CO2 emission of natural gas shows an increasing trend. Compared with 2005, CO2 emission of natural gas will increase 3.66 times by 2040. The main reason is that digital technology and environmental protection policies have promoted the substitution of natural gas for coal and oil, resulting in an increase in natural gas consumption.

4.2.4. Comparison with the National Goal and Contemporary Works

The Chinese government has attached great importance to the digital economy and CO2 emission and has proposed the corresponding national goal in the policy documents [55,56], especially the related goal during the 14th Five-Year Plan period (the period is from 2020 to 2025). Based on the prediction results of the three subsystems, we further compare the projection results with the national goal and published studies to analyze whether the relevant variables can meet the national goal.
In Table 3, the energy consumption intensity and CO2 emission intensity will meet the national goal during the 14th Five-Year Plan period, but the ratio of digital industrialization to GDP and the share of non-fossil energy consumption cannot meet the national goal. Additionally, CO2 emission cannot peak in 2030. Greater effort is needed to focus on the digital industry and carbon reduction. Moreover, compared with published studies, the prediction results of the share of non-fossil energy consumption and CO2 emission intensity are generally close to those of existing studies. However, there are different views on the peak of CO2 emission [57,58]. The main reason is that different studies differ in the selection of factors influencing CO2 emission. However, all published studies ignored the impact of digital economy on CO2 emission, which might cause inaccurate predicted results in the age of the digital economy.

4.3. Scenario Analysis of Different DEGR

4.3.1. Simulation Results under Different DEGR Scenarios

We designed different DEGR scenarios to discuss the impact of the digital economy on CO2 emission. The simulation results are shown in Figure 7 and Table 4.
Figure 7a shows the simulation results of CO2 emission under different DEGR scenarios. Compared with the baseline scenario, during the period 2021–2040, when the DEGR is lower than the baseline scenario, CO2 emission is always lower than the baseline scenario. The lower DEGR is accompanied by lower CO2 emission. When DEGR is higher than the baseline scenario, CO2 emission is first higher than the baseline scenario and then is lower than the baseline scenario. For example, when the DEGR is 12%, CO2 emission will increase first and then drop significantly. After 2038, the CO2 emission will be lower than the baseline scenario, even lower than that of the 6% DEGR scenario, which means CREDE begins to become prominent. Therefore, at a low level of the digital economy, the digital economy promotes CO2 emission, and when the digital economy is at a high level, it can reduce CO2 emission significantly. The relationship between the digital economy and CO2 emission was proven to present an inverted U-shape.
According to the analysis of the causal relationship between the digital economy and CO2 emission, it can be seen that the digital economy affects CO2 emission mainly by acting on the energy consumption subsystem. The simulation results of the total energy consumption, share of non-fossil energy, and energy consumption intensity under different DEGR scenarios are shown in Figure 7b,c and Table 4, respectively. It can be found that the higher DEGR is accompanied by more total energy consumption, a higher share of non-fossil energy consumption, and lower energy consumption intensity. For example, during the period 2021–2040, under the 12% DEGR scenario, compared with the baseline scenario, the total energy consumption and the share of non-fossil energy consumption annually increase by 7.65%, and 17%, respectively, and the energy consumption intensity annually decreases by 5.4%. This indicates that the digital economy can promote the expansion of energy consumption, increase the share of non-fossil energy consumption, and reduce the energy consumption intensity. Therefore, from the perspective of the energy subsystem as a conduction system, the digital economy aggravates CO2 emission mainly by promoting the expansion of energy consumption. However, the digital economy can also reduce CO2 emission by promoting the upgrading of the energy consumption structure and reducing the energy consumption intensity.

4.3.2. Comparison with Contemporary Works

It is necessary to compare the study’s findings with those of published studies. This study indicated that there is an inverted U-shaped relationship between the digital economy and CO2 emission. As seen in Table 5, this conclusion is consistent with the findings of Li et al. [19] and Li and Wang [20]. The selection of mechanisms for the impact of the digital economy on CO2 emission varied among studies. However, no matter which influence mechanism was chosen, the digital economy ultimately affected CO2 emission by influencing the energy consumption subsystem, which exactly is the focus of this study. The published studies assumed that each mechanism was independent, while we consider the interaction among different mechanisms (Figure 2). Compared with the existing studies, the interaction analysis of impact mechanism is more reasonable and consistent with reality, which can enable the analysis of the mechanism of the digital economy affecting CO2 emission to be clearer. For example, energy consumption intensity interacts with the scale of energy consumption, yet this fact was ignored in the mechanism study of Zhang et al. [4].

4.4. Scenario Analysis of Different R&D Investment Intensity and Environment Investment Intensity

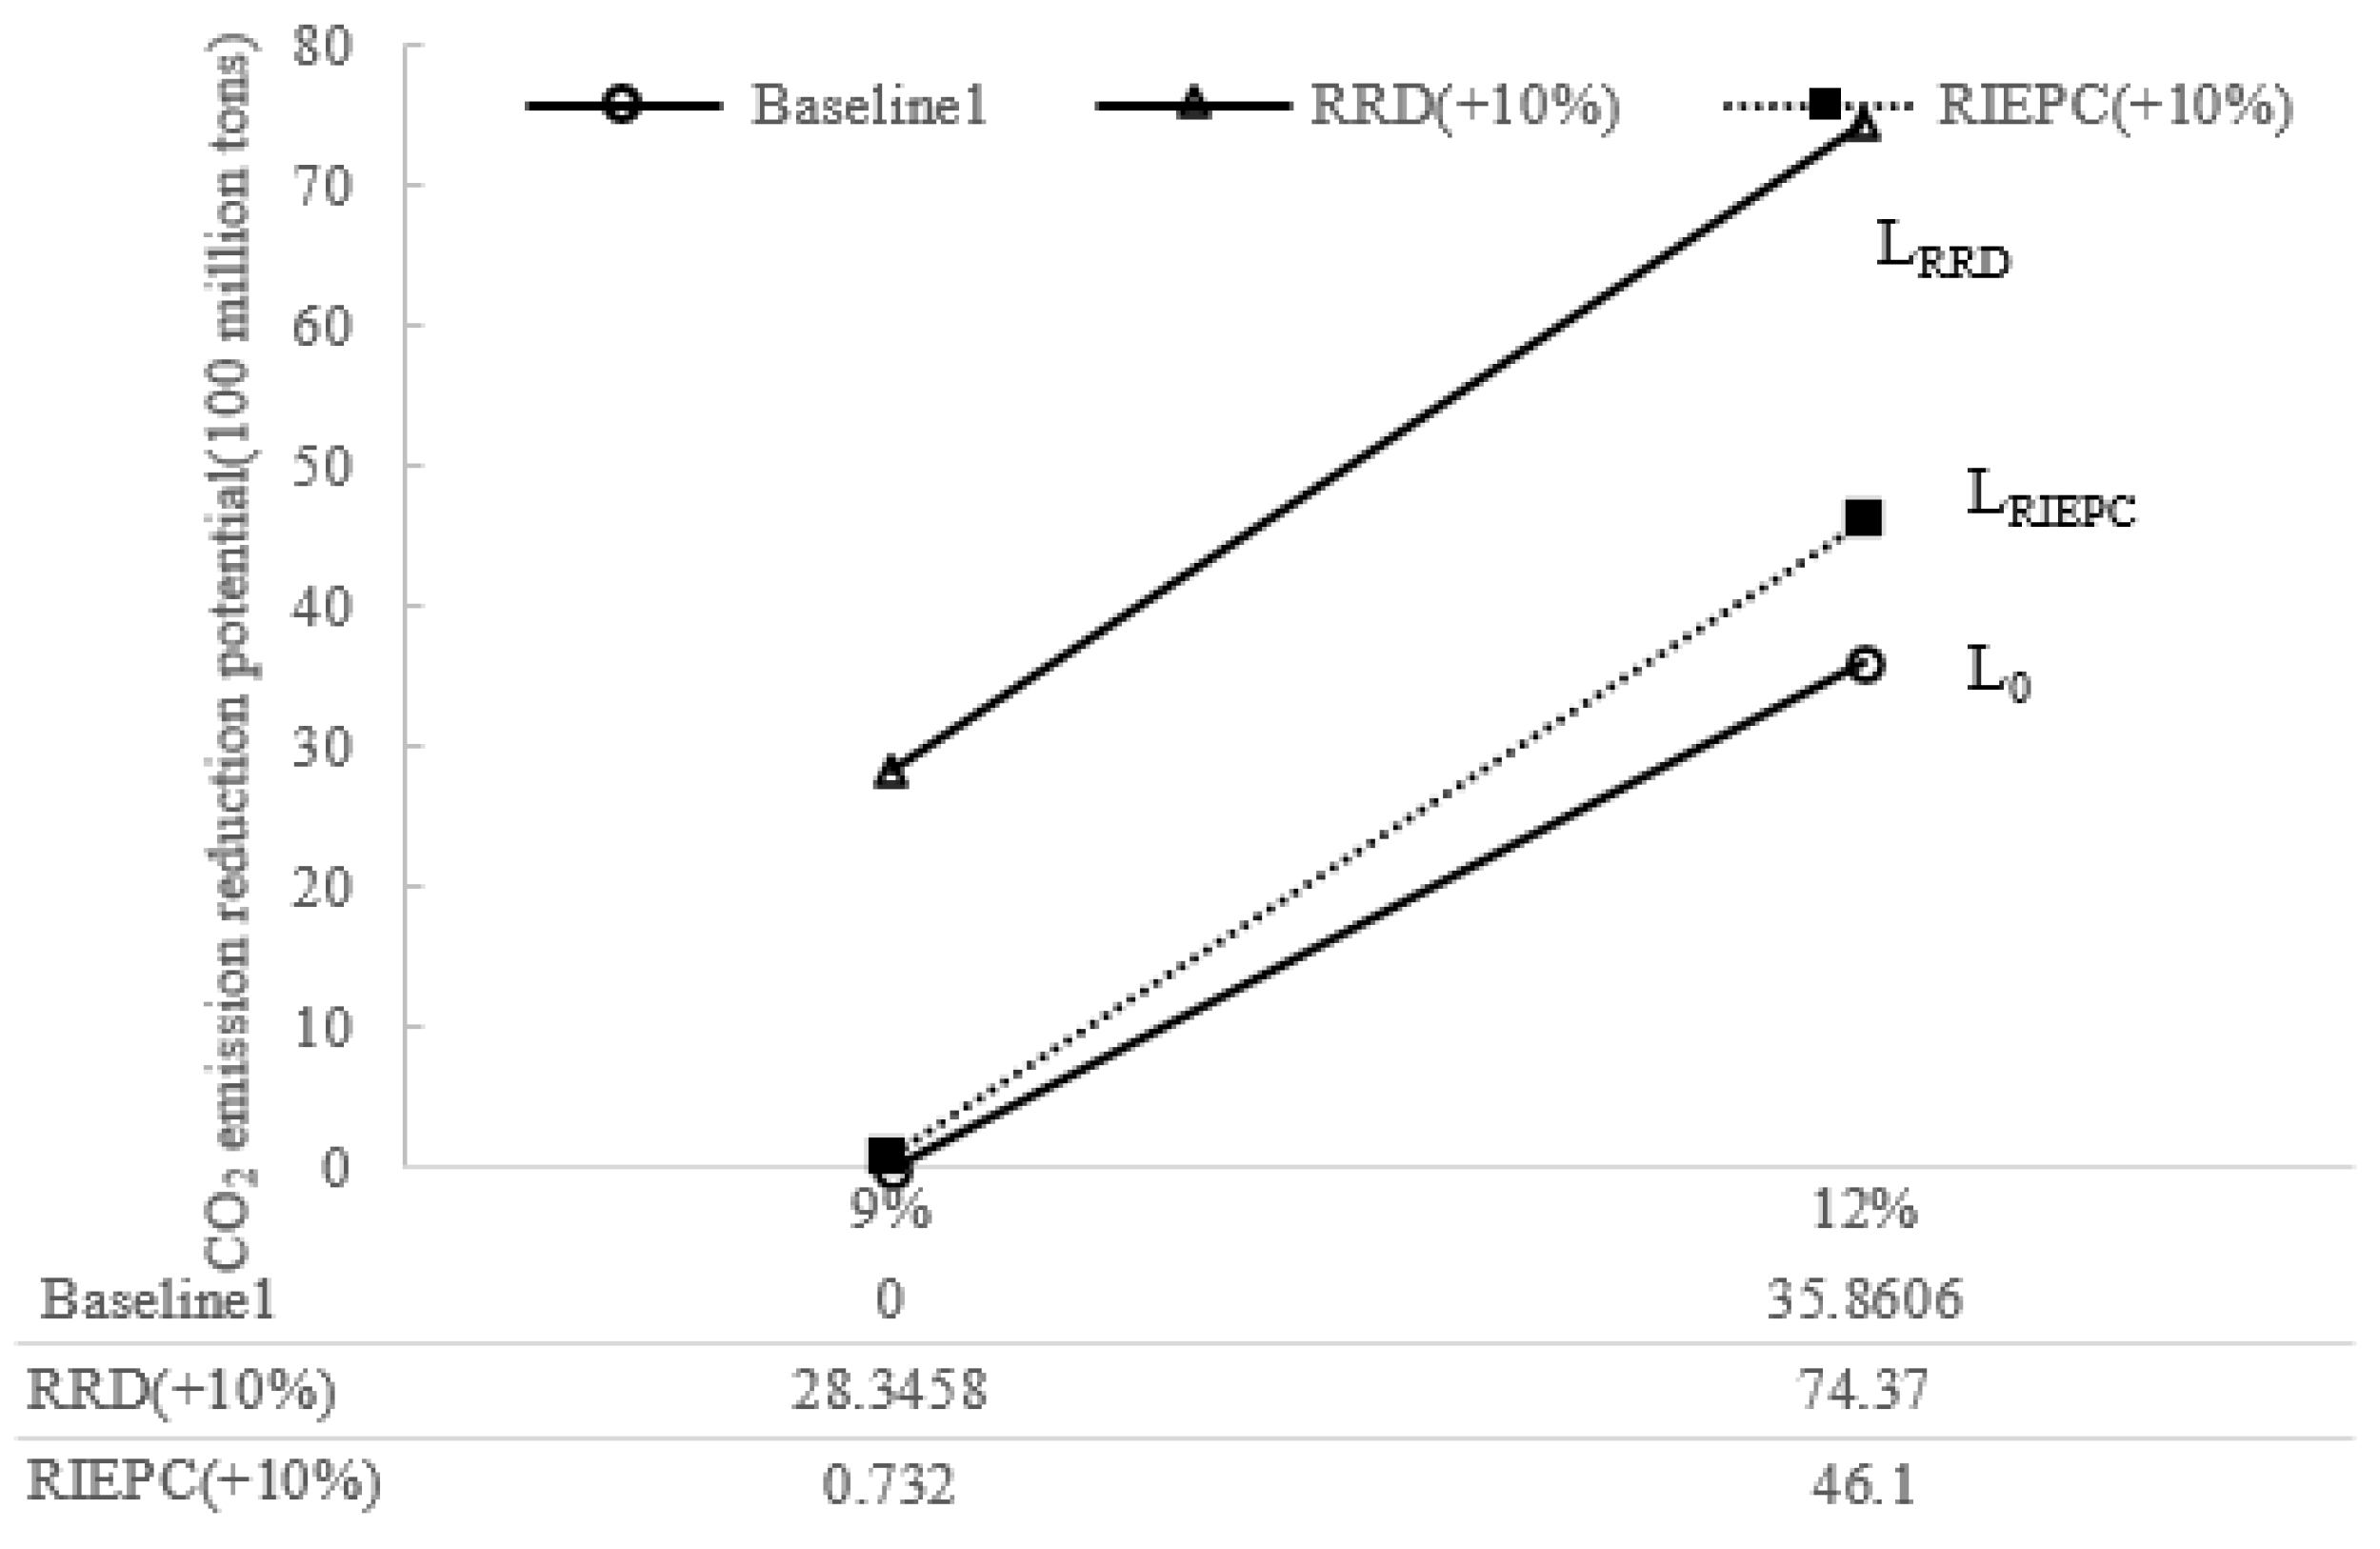
4.4.1. Simulation Results under Different R&D Investment Intensity and Environment Investment Intensity Scenarios

We set up different R&D investment intensity and environment investment intensity scenarios to study their impact on CREDE. Firstly, CREDE was defined as the ability of the digital economy to reduce CO2 emission. Since the digital economy can reduce CO2 emission after 2038, referring to the calculation of CO2 emission reduction potential of Yang et al. [1] and Gu et al. [2], we measured CREDE by the cumulative difference between CO2 emission in given scenarios and the baseline scenario after 2038. Additionally, RRD and RIEPC were designed to increase by 10%, and we investigated how RRD and RIEPC affected CREDE. The simulation results are shown in Figure 8.
As can be seen in Figure 8, when the DEGR is 9% and other parameters remain unchanged, the CREDE is 0. When the DEGR is 12% and other parameters remain unchanged, the CREDE increases to 3.586 billion tons. The two-point connection is recorded as L0, which represents the CO2 emission reduction potential line of the digital economy and is also regarded as the reference line of CREDE (Baseline1). The slope of L0 is greater than 0, which means that the higher DEGR has greater CO2 emission reduction potential when other conditions remain unchanged.
On the basis of L0, when RRD increases by 10%, under the 9% and 12% DEGR scenarios, CREDE increases to 28.35 and 7.437 billion tons, respectively. The two-point connection is recorded as LRRD. The slope of LRRD is greater than L0, indicating that the increase in RRD can promote CREDE. The LRIEPC can be obtained when the RIEPC increases by 10%. The slope of LRIEPC is greater than L0, which means that the increase in RIEPC can promote CREDE. Overall, the increase in R&D investment intensity and environment investment intensity can help strengthen CREDE.

4.4.2. Comparison with Contemporary Works

Compared with contemporary works, Ma et al. [52] concluded that R&D investment played a moderating role between the digital economy and CO2 emission, which was similar to our findings. Moreover, Tian and Li [59] found that reducing government investment in environmental protection would push back the peak of CO2 emission. Their study focused on the impact of government investment in environmental protection on CO2 emission and did not consider the impact of the digital economy on CO2 emission, while we considered the impact of government investment intensity in environmental protection and the digital economy on CO2 emission at the same time. Therefore, our finding is more realistic in the context of the digital economy.

5. Conclusions and Policy Implications

In this paper, we constructed an SD model of the digital economy and CO2 emission. In the case of China, we simulated the future trend of the digital economy, energy consumption, and CO2 emission subsystem during the period 2005 to 2040. We analyzed the impact of the digital economy on CO2 emission, together with the impact of the R&D investment intensity and environmental investment intensity on CREDE. The main conclusions are as follows:
(1) By 2040, the scale of the digital economy, digital industrialization, and industrial digitalization will be CNY 220.19, 32.15, and 188.04 trillion, accounting for 72%, 10.5%, and 61.5% of GDP, respectively. The CO2 emission will peak in 2034 with the value of 10.79 billion tons. From 2020 to 2025, the cumulative reduction in energy consumption intensity will be 15.75%, and the cumulative reduction in CO2 emission intensity will be 20.9%, and both will meet the national goals during the 14th Five-Year Plan period. In 2025 and 2030, the share of non-fossil energy consumption will be 18.47% and 23.18%, respectively, and more effort is needed to realize the goal of the share of non-fossil energy consumption and dual carbon.
(2) From 2021 to 2040, when the DEGR is lower than the baseline scenario, CO2 emission will always be lower than the baseline scenario, and the lower DEGR is accompanied by less CO2 emission. When the DEGR is higher than the baseline scenario, CO2 emission will first show a trend higher than the baseline scenario and then lower than the baseline scenario. This implies that there is an inverted U-shaped relationship between the digital economy and CO2 emission. The digital economy increases CO2 emission mainly by promoting energy consumption. The digital economy decreases CO2 emission mainly by promoting the upgrading of the energy consumption structure and reducing the energy consumption intensity.
(3) CREDE is affected by the R&D investment intensity and the environment investment intensity. The R&D investment intensity and the environment investment intensity can contribute to strengthening CREDE.
Based on the above research process and conclusions, we put forward the following policy implications:
(1) The government needs to accelerate the development of the digital economy and fully release the environmental dividends of the digital economy. This can be completed by building a “digital economy + dual carbon” service platform led by the government and digital enterprises. Digital technology can be used to comprehensively analyze the current situation and future development trends of various factors such as the digital economy; energy supply and consumption; resource endowment; climate and environmental quality; etc., which will promote the digital industry and digital infrastructures to become more intelligent, efficient, low-carbon, intensive, and sustainable.
(2) We can also promote the application and integration of digital technology in the renewable energy field to enhance and upgrade the energy consumption structure and the improvement of energy efficiency. This involves strengthening the collection, analysis, and accurate prediction of renewable energy data, and combining the demand side of production and life with the demand side to promote the in-depth integration of energy flow and information flow data, and to realize the multiple coordinated interaction of the energy, field, and industry sectors.
(3) The R&D and environment investment intensities can be improved. The government needs to coordinate and integrate strategic plans for R&D investment, environmental investment, digital economy, and dual carbon. The emphasis on R&D and environmental investment should be reflected in the related strategic planning for the development of the digital economy and dual carbon. At the same time, green digital technology, “digital economy + energy + carbon” compound talents, and digital governance should be supported in the related strategic planning for R&D investment and environmental pollution control.
Although this paper enriches the related research on the digital economy and CO2 emission, the research needs further improvement. First, we used national-level data, but this can be further refined to regions, provinces, and cities, and further spatial comparisons of the system development trends. Second, we used the ARIMA method in the SD model to extrapolate and predict post-2020 variables and parameters. However, the results might present some uncertainty, and better methods to manage this uncertainty can be further explored. Third, we simplified causality and feedback simplification in the system. These limitations can be the focus for future research. Additionally, there may be more subjects and links between the digital economy and CO2 emission. The first is to further consider the reverse causality of CO2 emission on the digital economy, including examining whether the setting of the dual carbon goal has an impact on the development of the digital economy. The second is to consider how CREDE is affected by other influencing factors in the SD model, such as carbon tax, carbon trading, and resident behavior.

Author Contributions

Conceptualization, Z.L. and S.R.; methodology, Z.L.; software, Z.L.; validation, Z.L.; formal analysis, Z.L.; investigation, Z.L.; resources, Z.L.; data curation, Z.L. and Y.C.; writing—original draft preparation, Z.L.; writing—review and editing, Z.L. and Y.C.; visualization, Z.L.; supervision, S.R. All authors have read and agreed to the published version of the manuscript.

Funding

This research received no external funding.

Institutional Review Board Statement

Not applicable.

Informed Consent Statement

Not applicable.

Data Availability Statement

The data on the digital economy, digital industrialization, and industrial digitization were from the White Paper on the Development of China’s Digital Economy, issued by the CAIT. The other data were from the National Bureau of Statistics, the China Statistical Yearbook, and the China Energy Statistical Yearbook.

Conflicts of Interest

The authors declare no conflict of interest.

Appendix A

Table A1. Value and equation of factors in the SD model during 2005–2040.
VariableAbbreviation of VariableUnitValue/Equation
Digital economy in 2005DE01012CNY2.6
Digital economy growth per yearDEG1012CNYDEG = DE*DEGR
Digital economy growth rateDEGR-WITH LOOKUP (time, [(2005,0)-(2040,1)], (2005,0.282), (2006,0.22),(2007,0.1803),(2008,0.3264),(2009,0.2461),(2010,0.1975),(2011,0.2351),(2012,0.1903),(2013,0.1599),(2014,0.158),(2015,0.2047),(2016,0.20354),(2017,0.1507),(2018,0.1438),(2019,0.09),(2021,0.09),(2040,0.09))
Digital economyDE1012CNYDE = INTEG (DEG, DEG0)
Ratio of digital economy to GDPRDGDP-WITH LOOKUP (time, [(2005,0)-(2040,1)], (2005,0.1389), (2006,0.1519),(2007,0.1506),(2008,0.1504),(2009,0.1827),(2010,0.1925),(2011,0.1947),(2012,0.2179),(2013,0.2355),(2014,0.2517),(2015,0.2723),(2016,0.3028),(2017,0.3269),(2018,0.3405),(2019,0.3629),(2020,0.3868),(2030,0.5518), (2040,0.7202))
Ratio of digital industrialization to digital economyRDI-RDI = 1 − RID
Ratio of industry digitization to digital economyRID-WITH LOOKUP (time, [(2005,0)-(2040,1)], (2005,0.49), (2008,0.58),(2011,0.68),(2015,0.743),(2016,0.77),(2017,0.774),(2018,0.795),(2019,0.802),(2020,0.809),(2030,0.838),(2040,0.854))
Digital industrializationDI1012CNYDI = DE*RDI
Industry digitizationID1012CNYID = DE*RID
Gross domestic productGDP1012CNYGDP = (ID + DI)/RDGDP
Share of primary industrySPI%IS1 = 100 − SSI − STI
Share of secondary industrySSI%WITH LOOKUP (time, [(2005,0)-(2040,100)], (2005,47), (2006,47.6),(2009,46),(2011,46.5),(2016,39.6),(2020,37.8),(2030,34),(2040,29))
Share of tertiary industrySTI%WITH LOOKUP (time, [(2005,0)-(2040,100)], (2005,41.3), (2006,41.8),(2009,44.4),(2011,44.3),(2016,52.4),(2020,54.5),(2030,59.2),(2040,65.2))
Primary industrial GDPGDPP1012CNYGDPP = GDP*SPI
Secondary
industrial GDP
GDPS1012CNYGDPS = GDP*SSI
Tertiary
industrial GDP
GDPT1012CNYGDPT = GDP*STI
Total factor productivityTFP-TFP = SQRT(−0.809 + 118.693*RRD + 0.009*DE)
R2 = 0.936
Ratio of R&D investment to GDPRRD-WITH LOOKUP (time, [(2005,0)-(2040,1)], (2005,0.0131), (2006,0.0137),(2007,0.0137),(2008,0.0145),(2009,0.0166),(2010,0.0171),(2011,0.0178),(2012,0.0191),(2013,0.02),(2014,0.0202),(2015,0.0206),(2016,0.021),(2017,0.0212),(2018,0.0214),(2019,0.0224),(2020,0.0241),(2030,0.0291),(2040,0.0341))
Energy technology innovation (hydropower and wind power generation capacity)ETI108kilowattsETI = EXP(−0.805 + 0.457*ln(DE) + 43.433*RRD)
R2 = 0.994
Energy consumption intensityECI10−4tce/CNYECI = TEC/GDP
Energy consumption intensity of primary industryECIP10−4tce/CNYECIP = EXP(−1.434 − 0.784*ln(TFP) − 0.18*ln(ETI))
R2 = 0.967
Energy consumption intensity of secondary industryECIS10−4tce/CNYECIS = EXP(0.607 − 0.496*ln(TFP) − 0.288*ln(ETI))
R2 = 0.973
Energy consumption intensity of tertiary industryECIT10−4tce/CNYECIT = EXP(−0.869 − 0.297*ln(TFP) − 0.447*ln(ETI))
R2 = 0.978
Energy consumption of primary industryECP108tceECP = GDPP*ECIP
Energy consumption of secondary industryECS108tceECS = GDPS*ECIS
Energy consumption of tertiary industryECT108tceECT = GDPT*ECIT
Industrial energy consumptionIEC108tceIEC = ECP + ECS + ECT
Total population in 2005POP0108 person13.1
Population growth per yearPOPG108 personPOPG = (1/1000)*TPOP*NPGR
Total populationTPOP108 personTPOP = INTEG (POPG, POP0)
Natural population growth rateNPGRWITH LOOKUP (time, [(2005,0)-(2040,10)], (2005,5.2923), (2006,5.1808), (2007,5.0935), (2008,4.8794), (2009,4.8033), (2010,6.1525),(2011,7.4565),(2012,5.9152),(2013,6.7288),(2014,4.9402),(2015,6.5497),(2016,5.595),(2017,3.7854),(2018,3.3229),(2019,1.4467),(2030,2.68),(2040,1.37))
GDP per capitaPGDP104CNY/personPGDP = GDP/TPOP
Digital economy per capitaPDE104CNY/personPDE = DE/TPOP
Residents’
energy consumption
REC108tceREC = 1.408 − 0.018*DE + 0.789*PGDP
R2 = 0.991
Other energy consumption from statistical biasOEC108tceWITH LOOKUP (time, [(2005,0)-(2040,10)], (2005,2.5372), (2006,2.7791),(2007,3.0934),(2008,2.9163),(2009,0),(2040,0))
Government environmental governance efficiencyGEGE109CNY/tonGEGE = EXP(−6.042 + 0.017*DE + 0.755*RIEPC)
R2 = 0.984
Ratio of investment in environmental pollution control to GDPRIEPC%WITH LOOKUP (time, [(2005,0)-(2040,100)], (2005,1.27), (2006,1.36),(2007,1.55),(2008,1.51),(2009,1.62),(2010,1.46),(2011,1.56),(2012,1.52),(2013,1.49),(2014,1.28),(2015,1.24),(2016,1.15),(2017,1.5),(2018,1.4),(2019,0.9),(2020,1),(2022,1.357),(2040,1.357))
Total energy consumptionTEC108tceTEC = IEC + REC + OEC
Share of coal consumptionSCC-SCC = EXP(−0.261 − 0.039*ETI − 0.239*GEGE)
R2 = 0.974
Share of oil consumptionSOC-SOC = IF THEN ELSE(1-SCC-SNGC-SNFC > 0, 1-ESC-ESG-ESNF, 0)
Share of natural gas consumptionSNGC-SNGC = 0.069 + 0.01*ln(GEGE) + 0.014*ln(ETI)
R2 = 0.986
Share of non-fossil energy consumptionSNFC-SNFC = 0.054 +0.063 *GEGE+ 0.014*ETI
R2 = 0.974
Coal consumptionCC108tceCC = TEC*SCC
Oil consumptionOC108tceOC = TEC*SOC
Natural gas consumptionNGC108tceNGC = TEC*SNGC
Non-fossil energy consumptionNFC108tceNFC = TEC*SNFC
CO2 emission of coalCEC108tonCEC = CC*CCEC
CO2 emission of oilCEO108tonCEO = OC*CCEO
CO2 emission of natural gasCENG108tonCENG = NGC*CCENG
Coefficient of CO2 emission of coalCCECton/tce2.64
Coefficient of CO2 emission of oilCCEOton/tce2.08
Coefficient of CO2 emission of natural gasCCENGton/tce1.63
CO2 emissionCO2108 tonCO2 = CEC + CEO + CENG
CO2 emission intensityCEI10−4ton /CNYCEI = CO2/GDP
CO2 emission per capitaCEPton /personCEP = CO2/TPOP

References

  1. Said, Z.; Sharma, P.; Elavarasan, R.M.; Tiwari, A.K.; Rathod, K. Exploring the specific heat capacity of water-based hybrid nanofluids for solar energy applications: A comparative evaluation of modern ensemble machine learning techniques. J. Energy Storage 2022, 54, 105230. [Google Scholar] [CrossRef]
  2. Yang, H.; Li, X.; Ma, L.; Li, Z. Using system dynamics to analyse key factors influencing China’s energy-related CO2 emission and emission reduction scenarios. J. Clean. Prod. 2021, 320, 128811. [Google Scholar] [CrossRef]
  3. Gu, S.; Fu, B.; Thriveni, T.; Fujita, T.; Ji, W.A. Coupled LMDI and system dynamics model for estimating urban CO2 emission mitigation potential in Shanghai, China. J. Clean. Prod. 2019, 240, 118034. [Google Scholar] [CrossRef]
  4. Zhang, W.; Liu, X.; Wang, D.; Zhou, J. Digital economy and carbon emission performance: Evidence at China’s city level. Energy Policy 2022, 165, 112927. [Google Scholar] [CrossRef]
  5. Jinping Xi Delivers a Keynote Speech at the 75th UN General Assembly General Debate. Available online: http://www.cppcc.gov.cn/zxww/2020/09/23/ARTI1600819264410115.shtml?from=groupmessage (accessed on 20 August 2022).
  6. British Petroleum. Statistical Review of World Energy 2021. Available online: https://www.bp.com/content/dam/bp/business-sites/en/global/corporate/pdfs/energy-economics/statistical-review/bp-stats-review-20 (accessed on 20 August 2022).
  7. Xu, B.; Lin, B. Can expanding natural gas consumption reduce China’s CO2 emission? Energy Econ. 2019, 81, 393–407. [Google Scholar] [CrossRef]
  8. Li, Y.; Yang, X.; Ran, Q.; Wu, H.; Irfan, M. Energy structure, digital economy, and carbon emissions: Evidence from China. Environ. Sci. Pollut. Res. 2021, 28, 64606–64629. [Google Scholar] [CrossRef]
  9. Heiskanen, E.; Jalas, M.; Timonen, P. Reducing the natural resource intensity of private and organizational consumption: The potential of ICT and service innovations. Prog. Ind. Ecol. Int. J. 2005, 2, 453–474. [Google Scholar] [CrossRef]
  10. Zhou, X.; Zhou, D.; Zhao, Z.; Wang, Q. A framework to analyze carbon impacts of digital economy: The case of China. Sustain. Prod. Consum. 2022, 31, 357–369. [Google Scholar] [CrossRef]
  11. Salahuddin, M.; Alam, K. Information and Communication Technology, electricity consumption and economic growth in OECD countries: A panel data analysis. Int. J. Electr. Power 2016, 76, 185–193. [Google Scholar] [CrossRef]
  12. Open Data Center Council. Data Center Computing Carbon Efficiency White Paper. Available online: http://www.odcc.org.cn/download/24 (accessed on 30 January 2023).
  13. Ghobakhloo, M. Industry 4.0, digitization, and opportunities for sustainability. J. Clean. Prod. 2020, 252, 119869. [Google Scholar] [CrossRef]
  14. Noussan, M.; Tagliapietra, S. The effect of digitalization in the energy consumption of passenger transport: An analysis of future scenarios for Europe. J. Clean. Prod. 2020, 258, 120926. [Google Scholar] [CrossRef]
  15. Lin, B.; Zhou, Y. Does the Internet development affect energy and carbon emission performance? Sustain. Prod. Consum. 2021, 28, 1–10. [Google Scholar] [CrossRef]
  16. Sadorsky, P. Information communication technology and electricity consumption in emerging economies. Energy Policy 2012, 48, 130–136. [Google Scholar] [CrossRef]
  17. Shvakov, E.E.; Petrova, E.A. Newest Trends and Future Scenarios for a Sustainable Digital Economy Development; Institute of Scientific Communications Conference; Springer: Cham, Germany, 2019; pp. 1378–1385. [Google Scholar] [CrossRef]
  18. Salahuddin, M.; Alam, K.; Ozturk, I. The effects of Internet usage and economic growth on CO2 emission in OECD countries: A panel investigation. Renew. Sustain. Energy Rev. 2016, 62, 1226–1235. [Google Scholar] [CrossRef]
  19. Li, X.; Liu, J.; Ni, P. The Impact of the digital economy on CO2 emission: A theoretical and empirical analysis. Sustainability 2021, 13, 7267. [Google Scholar] [CrossRef]
  20. Li, Z.; Wang, J. The Dynamic Impact of Digital Economy on Carbon Emission Reduction: Evidence City-level Empirical Data in China. J. Clean. Prod. 2022, 351, 131570. [Google Scholar] [CrossRef]
  21. Li, D.; Huang, G.; Zhu, S.; Chen, L.; Wang, J. How to peak carbon emissions of provincial construction industry? Scenario analysis of Jiangsu Province. Renew. Sustain. Energy Rev. 2021, 144, 110953. [Google Scholar] [CrossRef]
  22. Ansari, N.; Seifi, A. A system dynamics model for analyzing energy consumption and CO2 emission in Iranian cement industry under various production and export scenarios. Energy Policy 2013, 58, 75–89. [Google Scholar] [CrossRef]
  23. Liu, J.; Zhang, X.; Song, X. Regional carbon emission evolution mechanism and its prediction approach driven by carbon trading—A case study of Beijing. J. Clean. Prod. 2018, 172, 2793–2810. [Google Scholar] [CrossRef]
  24. China Academy of Information and Communications Technology (CAICT). China Digital Economy Development Report (2022). Available online: http://www.caict.ac.cn/kxyj/qwfb/bps/202207/P020220729609949023295.pdf (accessed on 20 August 2022).
  25. China Energy Statistical Yearbook. Available online: https://data.cnki.net/home (accessed on 20 August 2022).
  26. Ivus, O.; Boland, M. The employment and wage impact of broadband deployment in Canada. Can. J. Econ. 2015, 48, 1803–1830. [Google Scholar] [CrossRef]
  27. Jiménez, M.; Matus, J.A.; Martínez, M.A. Economic growth as a function of human capital, internet and work. Appl. Econ. 2014, 46, 3202–3210. [Google Scholar] [CrossRef]
  28. Lange, S.; Pohl, J.; Santarius, T. Digitalization and energy consumption. Does ICT reduce energy demand? Ecol. Econ. 2020, 176, 106760. [Google Scholar] [CrossRef]
  29. Zhou, X.; Zhou, D.; Wang, Q.; Su, B. How information and communication technology drives carbon emissions: A sector-level analysis for China. Energy Econ. 2019, 81, 380–392. [Google Scholar] [CrossRef]
  30. European Commission. A European Strategy for data.2020. Available online: https://ec.europa.eu/futurium/en/european-ai-alliance/european-strategy-data.html (accessed on 20 August 2022).
  31. The Cambridge Centre for Alternative Finance (CCAF). Cambridge University’s Bitcoin Electricity Consumption Index. Available online: https://www.ft.com/content/1aecb2db-8f61-427c-a413-3b929291c8ac (accessed on 20 August 2022).
  32. Open Data Center Committee. Data Center Server Carbon Accounting Guidelines. 2021. Available online: http://www.odcc.org.cn/download/p-1485866070699302913.html (accessed on 20 August 2022).
  33. Cui, P.; Xia, S.; Hao, L. Do different sizes of urban population matter differently to CO2 emission in different regions? Evidence from electricity consumption behavior of urban residents in China. J. Clean. Prod. 2019, 240, 118207. [Google Scholar] [CrossRef]
  34. Pop, R.A.; Dabija, D.C.; Pelău, C.; Dinu, V. Usage Intentions, Attitudes, and Behaviors towards Energy-Efficient Applications during the COVID-19 Pandemic. J. Bus. Econ. Manag. 2022, 23, 668–689. [Google Scholar] [CrossRef]
  35. Wang, Z.; Zhao, X.G.; Zhou, Y. Biased technological progress and total factor productivity growth: From the perspective of China’s renewable energy industry. Renew. Sustain. Energy Rev. 2021, 146, 111136. [Google Scholar] [CrossRef]
  36. Global e-Sustainability Initiative. GeSI SMARTer 2030: ICT Solutions for 21st Century Challenges. Available online: http://smarter2030.gesi.org/downloads (accessed on 20 August 2022).
  37. Liu, Y.; Yang, Y.; Li, H.; Zhong, K. Digital economy development, industrial structure upgrading and green total factor productivity: Empirical evidence from China’s cities. Int. J. Environ. Res. Public Health 2022, 19, 2414. [Google Scholar] [CrossRef]
  38. Graetz, G.; Michaels, G. Robots at work. Rev. Econ. Stat. 2018, 100, 753–768. [Google Scholar] [CrossRef]
  39. Andronie, M.; Lăzăroiu, G.; Ștefănescu, R.; Uță, C.; Dijmărescu, I. Sustainable, smart, and sensing technologies for cyber-physical manufacturing systems: A systematic literature review. Sustainability 2021, 13, 5495. [Google Scholar] [CrossRef]
  40. Andronie, M.; Lăzăroiu, G.; Iatagan, M.; Uță, C.; Ștefănescu, R.; Cocoșatu, M. Artificial Intelligence-Based Decision-Making Algorithms, Internet of Things Sensing Networks, and Deep Learning-Assisted Smart Process Management in Cyber-Physical Production Systems. Electronics 2021, 10, 2497. [Google Scholar] [CrossRef]
  41. Sharma, P.; Bora, B.J. A Review of Modern Machine Learning Techniques in the Prediction of Remaining Useful Life of Lithium-Ion Batteries. Batteries 2022, 9, 13. [Google Scholar] [CrossRef]
  42. He, R.; Zhong, M.; Huang, J. Technological progress and metal resource consumption in the electricity industry—A cross-country panel threshold data analysis. Energy 2021, 231, 120979. [Google Scholar] [CrossRef]
  43. Allam, Z.; Jones, D.S. Future (post-COVID) digital, smart and sustainable cities in the wake of 6G: Digital twins, immersive realities and new urban economies. Land Use Policy 2021, 101, 105201. [Google Scholar] [CrossRef]
  44. The International Renewable Energy Agency (IRENA). Renewable Energy Generation Costs 2020. Available online: https://www.irena.org/publications/2021/Jun/Renewable-Power-Costs-in-2020 (accessed on 20 August 2022).
  45. Bhattacharya, M.; Rafiq, S.; Bhattacharya, S. The role of technology on the dynamics of coal consumption–economic growth: New evidence from China. Appl. Energy 2015, 154, 686–695. [Google Scholar] [CrossRef]
  46. Shahbaz, M.; Wang, J.; Dong, K.; Zhao, J. The impact of digital economy on energy transition across the globe: The mediating role of government governance. Renew. Sustain. Energy Rev. 2022, 166, 112620. [Google Scholar] [CrossRef]
  47. China Academy of Information and Communications Technology (CAICT). White Paper on the Development of China’s Digital Economy. 2022. Available online: http://www.caict.ac.cn/kxyj/qwfb/bps/202201/t20220126_396162.htm (accessed on 20 August 2022).
  48. Yang, Y.; Cai, W.; Wang, C. Industrial CO2 intensity, indigenous innovation and R&D spillovers in China’s provinces. Appl. Energy 2014, 131, 117–127. [Google Scholar] [CrossRef]
  49. Shen, Y.; Yue, S.; Sun, S.; Guo, M. Sustainable total factor productivity growth: The case of China. J. Clean. Prod. 2020, 256, 120727. [Google Scholar] [CrossRef]
  50. The National Bureau of Statistics. Available online: https://data.stats.gov.cn/index.htm (accessed on 20 July 2022).
  51. China Statistical Yearbook. Available online: https://data.stats.gov.cn/publish.htm?sort=1 (accessed on 20 July 2022).
  52. Ma, Q.; Tariq, M.; Mahmood, H.; Khan, Z. The nexus between digital economy and CO2 emission in China: The moderating role of investments in research and development. Technol. Soc. 2022, 68, 101910. [Google Scholar] [CrossRef]
  53. The Outline of the National Medium- and Long-Term Science and Technology Development Plan (2006–2020). Available online: http://www.gov.cn/gongbao/content/2006/content_240244.htm (accessed on 20 July 2022).
  54. Ministry of Housing and Urban-Rural Development of the People’s Republic of China. National Urban Ecological Protection and Construction Plan (2015–2020). Available online: https://www.mohurd.gov.cn/gongkai/fdzdgknr/tzgg/201612/20161223_230049.html (accessed on 20 July 2022).
  55. National Development and Reform Commission. 14th Five-Year Plan for Digital Economy Development. Available online: https://www.ndrc.gov.cn/fggz/fzzlgh/gjjzxgh/202203/t20220325_1320207.html (accessed on 20 July 2022).
  56. Notice of Action Plan of State Council on the issuance of the carbon peak by 2030. Available online: http://www.gov.cn/zhengce/zhengceku/2021-10/26/content_5644984.htm (accessed on 20 July 2022).
  57. Liu, D.; Xiao, B. Can China achieve its carbon emission peaking? A scenario analysis based on STIRPAT and system dynamics model. Ecol. Indic. 2018, 93, 647–657. [Google Scholar] [CrossRef]
  58. Zhang, F.; Deng, X.Z.; Xie, L.; Xu, N. China’s energy-related carbon emissions projections for the shared socioeconomic pathways. Resour. Conserv. Recycl. 2021, 168, 105456. [Google Scholar] [CrossRef]
  59. Tian, Y.; Li, L. Will COVID-19 affect China’s peak CO2 emissions in 2030? An analysis based on the systems dynamics model of green finance. J. Clean. Prod. 2022, 356, 131777. [Google Scholar] [CrossRef]
Figure 1. Research framework of the SD model in this paper.
Sustainability 15 03368 g001
Figure 2. The causal chains of the digital economy and CO2 emission.
Sustainability 15 03368 g002
Figure 3. Stock-flow diagram of the digital economy and CO2 emission.
Sustainability 15 03368 g003
Figure 4. Simulation results of the digital economy subsystem from 2005 to 2040: (a) simulation results of related variables in the digital economy; (b) simulation results of related variables in GDP.
Sustainability 15 03368 g004
Figure 5. Simulation results of the energy consumption subsystem from 2005 to 2040: (a) simulation results of related variables in energy consumption scale; (b) simulation results of related variables in the share of energy consumption.
Sustainability 15 03368 g005
Figure 6. Simulation results of the CO2 emission subsystem from 2005 to 2040: (a) simulation results of related variables in CO2 emission; (b) simulation results of related variables in CO2 emission structure.
Sustainability 15 03368 g006
Figure 7. Simulation results under different DEGR scenarios: (a) CO2 emission under different DEGR scenarios; (b) total energy consumption under different DEGR scenarios; (c) energy consumption structure under different DEGR scenarios.
Sustainability 15 03368 g007
Figure 8. Simulation results under the increase in RRD and RIEPC scenarios.
Sustainability 15 03368 g008
Table 1. Summary of two types of research on the digital economy and CO2 emission.
Types of ResearchReferenceMethodWhether to Consider the Impact of the Digital Economy on CO2 EmissionWhether to Study the Interaction and Dynamic Feedback of FactorsWhether Key Variables Are PredictedWhether to Study the Influencing Factors of CERDE
First type of researchZhang et al. (2022) [4]Ordinary least square (OLS) method, threshold model, mediation effect model, and spatial Durbin modelYesNoNoNo
Li et al. (2021) [19]Fixed-effects modelYesNoNoNo
Lin and Zhou (2021) [15]Fixed-effect model and mediation
effect model
YesNoNoNo
Li and Wang (2022) [20]Spatial Durbin
model and panel threshold model
YesNoNoNo
Li et al. (2021) [8]System GMM model, moderation effect model, and threshold effect modelYesNoNoNo
Ghobakhloo et al. (2020) [13]Qualitative analysis methodYesNoNoNo
Second type of researchYang et al. (2021) [2]SD methodNoYesYesNo
Liu et al. (2018) [23]STIRPAT and SD modelNoYesYesNo
Gu et al. (2019) [3]Coupled LMDI and SD modelNoYesYesNo
Li et al. (2021) [21]SD modelNoYesYesNo
Table 2. Simulation results and the relative error of variables.
DE (Trillion Chinese Yuan (CNY))TEC (100 Million Tce)CO2 Emission
(100 Million Tons)
TimeFtHtet (%)FtHtet (%)FtHtet (%)
20052.602.600.0024.9326.144.6258.1460.664.15
20107.937.930.0034.8136.063.4779.1381.292.66
201518.7618.760.0042.5743.411.9493.3293.840.55
201622.6022.600.0143.4044.151.7094.2794.060.22
201727.2027.200.0146.3045.581.5899.5495.973.72
201831.3031.300.0149.3147.194.49105.1897.917.43
201935.8035.800.0150.1348.752.83105.7099.885.83
202039.2039.200.0048.4749.832.74100.61101.160.55
MAPE0.003.473.52
RMSE0.001.463.75
Table 3. Comparison of projection results with the national goal.
SubsystemIndicatorNational GoalPredicted Values in This PaperWhether They Meet the National GoalPredicted Values from Other Studies
Digital economyThe ratio of digital industrialization to GDP10% in 2025 [55]8.3% in 2025No-
Energy consumptionEnergy consumption intensityA cumulative reduction of 13.5% from 2020 to 2025 [56]A cumulative reduction of 15.75% from 2020 to 2025Yes-
The share of non-fossil energy consumption20% in 2025 and 25% in 2030 [56]18.47% in 2025 and 23.18% in 2030NoIt cannot meet the goal that the share of non-fossil energy should be more than 50% by 2050 [2]
CO2 emissionCO2 emissionPeaking in 2030 [5]Peaking in 2034NoPeaking before 2030 [57,58]; peaking in 2043 [2]
CO2 emission intensityA cumulative reduction of 18% from 2020 to 2025;
decreasing 60–65% in 2030 compared to 2005 [56]
A cumulative reduction of 20.9% from 2020 to 2025; decreasing by more than 65% in 2030 compared to 2005YesDecreasing 64.5% in 2030 compared to 2005 [2]
Table 4. Energy consumption intensity under different DEGR scenarios.
TimeBaseline (9%)DEGR (6%)DEGR (12%)TimeBaseline (9%)DEGR (6%)DEGR (12%)
20051.33181.33181.331820290.35840.37510.3425
20100.84480.84480.844820300.34690.36520.3297
20150.61790.61790.617920310.33520.35490.3167
20200.47830.47830.478320320.32390.34490.3042
20210.46310.46430.461920330.31290.33510.2921
20220.44850.45200.445120340.30220.32560.2804
20230.43440.44010.428920350.29190.31640.2691
20240.42080.42860.413320360.28190.30740.2581
20250.40750.41730.398220370.27220.29860.2476
20260.39470.40630.383620380.26280.29010.2375
20270.38220.39570.369420390.25360.28180.2277
20280.37010.38520.355820400.24480.27370.2182
Table 5. Comparison of the conclusions with published studies.
ReferenceRelationship between the Digital Economy and CO2 EmissionImpact MechanismWhether to Include the Interaction of Factors
Zhang et al.(2022) [4]The digital economy improves carbon emission performanceEnergy consumption intensity, urban afforestation, and energy consumption scale.No
Lin and Zhou(2021) [15]Internet development improves energy and carbon emission performanceIndustrial structure upgrading and technology diffusionNo
Zhou et al. (2022) [10]The digital economy generates CO2 emissionDigital and supply and demand, sectoral carbon efficiency and digital production and application structureNo
Li et al. (2021) [19]Inverted U-shapeNot studiedNo
Li and Wang(2022) [20]Inverted U-shapeTechnology progress, energy use, and industrial structureNo
Present studyInverted U-shapeEnergy consumption intensity, energy consumption scale, energy consumption structure, and other factorsYes
Disclaimer/Publisher’s Note: The statements, opinions and data contained in all publications are solely those of the individual author(s) and contributor(s) and not of MDPI and/or the editor(s). MDPI and/or the editor(s) disclaim responsibility for any injury to people or property resulting from any ideas, methods, instructions or products referred to in the content.

