Abstract
As a venue for the 2022 Winter Olympic and Paralympic Games, the National Alpine Skiing Center is located on Xiaohaitou Mountain in Beijing’s Yanqing district, where strong winds occur frequently. To reduce the impact of strong winds on the competition, windbreak fences have been installed in the ski area. To determine the effect and stability of the windbreak fences beside the ski slope of the alpine skiing center, the numerical simulation method was used to study the performance of 3.7 m, 4.7 m and 7.9 m high wind barriers. According to the actual meteorological conditions, two kinds of inlet wind speeds of 10 m/s and 33 m/s were set. The results show that the ambient wind speed is maximum only in a small area near the opening through the windbreak fence. When the ambient wind speed is 10 and 33 m/s, the wind speed in most drainage areas behind the barrier is below 5 and 15 m/s, respectively, which is significantly lower than the wind speed of incoming flow, and the wind protection effect is obvious. When the wind speed at the entrance height is 10 m and 33 m/s, the wind-proof effect is obvious. The wind-proof effect of 7.9 m high windproof bars is better than that of 3.7 and 4.7 m high windproof bars. The wind pressure at the top of the fence is the highest, and the wind pressure also increases when the wind speed increases. Under the action of maximum wind speed, the stability of a 7.9 m high storm fence is low.
1. Introduction
The 2022 Winter Olympic and Paralympic Games were successfully held in Beijing and Zhangjiakou. As one of the competition venues, the National Alpine Skiing Center hosted all the alpine skiing events of the Winter Olympic and Paralympic Games. It is also the first alpine skiing venue in China to be built according to the standards of the Winter Olympic events. The National Alpine Skiing Center is located at Xiaohaituo Mountain in Yanqing District, northwest of Beijing. The whole land is approximately lozenge-shaped, with the highest point of Xiaohaituo peak (2198 m) and the bottom of the center located at the upper mouth of Foyukougou (1238 m). A total of 7seven tracks are designed, with a total length of 21 km. The altitude difference of the track is about 960 m, and the slope length is nearly 3000 m [1,2]. However, strong winds often occur in the mountaintop area of the National Alpine Ski Center in winter, which will adversely affect snowmaking and storage, piste maintenance, piste quality and athletes’ performance. Therefore, it is of great significance to study the protection of alpine skiing.
The research on the protection of alpine skiing is basically blank, but the protection has been widely used in other fields, such as highways and railways with respect to wind and sand fixation, material pile wind and sand fixation, port dust control and so forth [3,4,5]. Generally, windproof structures will be set up along the highway, ports and other areas to achieve the purpose of wind and dust suppression [6,7,8,9], and associated studies have used experiments or numerical simulations to determine the sand control effect of wind protection structures. Cong et al. [5], through CFD simulation, confirmed that the porous fence can effectively reduce the dust emission of the yard, and the dust emission of different fence layouts can be reduced by 55–85%. The study on the windproof performance of windproof structures along the highway and railways shows that windproof structures can effectively reduce the wind speed in the highway area, and the windproof fence has the best windproof effect [10,11]. Zhang et al. [12] evaluated the windbreak efficiency and sand control efficiency effect of multiple rows of windbreak grids through wind tunnel simulation and suggested that double rows of windbreak grids with porosity of 30% should be used to control the windbreak sand in the Qinghai section of Golmud-Korla Railway. There are also studies on the design of wind protection structures and the resulting wind protection effect, including height, opening form, opening rate, etc. [13,14,15,16,17]. Li et al. [18] used the wind tunnel test method to analyze the windbreak effect and aerodynamic characteristics of the EMU with different heights in a strong wind environment, and the results showed that the reasonable height of the windbreak wall was 2.5 m above the rail surface. The study of Zhang et al. [19] showed that the circular open-hole windbreak fence could reduce wind speed and turbulence more than the horizontal lath fence. The wind tunnel test conducted by Dong et al. [20] showed that when the opening rate was about 0.2 or 0.3, the windbreak effect of the windbreak grid was the best. Li et al. [21] studied the wind-blocking effect of wind break fences to high-speed trains by CFD numerical simulation, and the results showed that the wind-blocking performance of wind break fences with 40% opening rate was favorable, while the operating efficiency of trains in the strong wind area could be improved. Chen and Ma [22] used FLUENT to conduct a numerical simulation of flat and butterfly windbreak nets with different opening rates. The results show that the windbreak net with lower opening rate has better protection effect near the net, and the windbreak net with higher opening rate has a longer windbreak range. The butterfly net has better windproof performance than the flat net. Chen et al. [23,24,25] used FLUENT and wind tunnel tests to study the flow field distribution of the diversion-type windbreak net under different opening rates and found that the dust suppression effect of the windbreak net was the best when the opening rate was 30%.
To solve the problem of strong wind in the alpine skiing center, the experience of other engineering fields in the use of windproof structures for protection is learned, and the windproof grid is set up in the ski area affected by the strong wind. However, the alpine ski center is located at the summit of Xiaohaituo and is at a high altitude. There are few studies on windbreak fences in complex mountain conditions; thus, in this study, the windbreak fences in the ski slope area of the alpine skiing center was taken as the research object, and the most likely meteorological conditions and extreme meteorological conditions around the ski center were taken as the boundary conditions. This paper uses ANSYS software to verify the wind protection effect of the windbreak fences and the impact on athletes under complex mountainous conditions, while considering the effect of height on the wind protection performance and stability of the windbreak fences.
2. Methodology
2.1. The Research Object
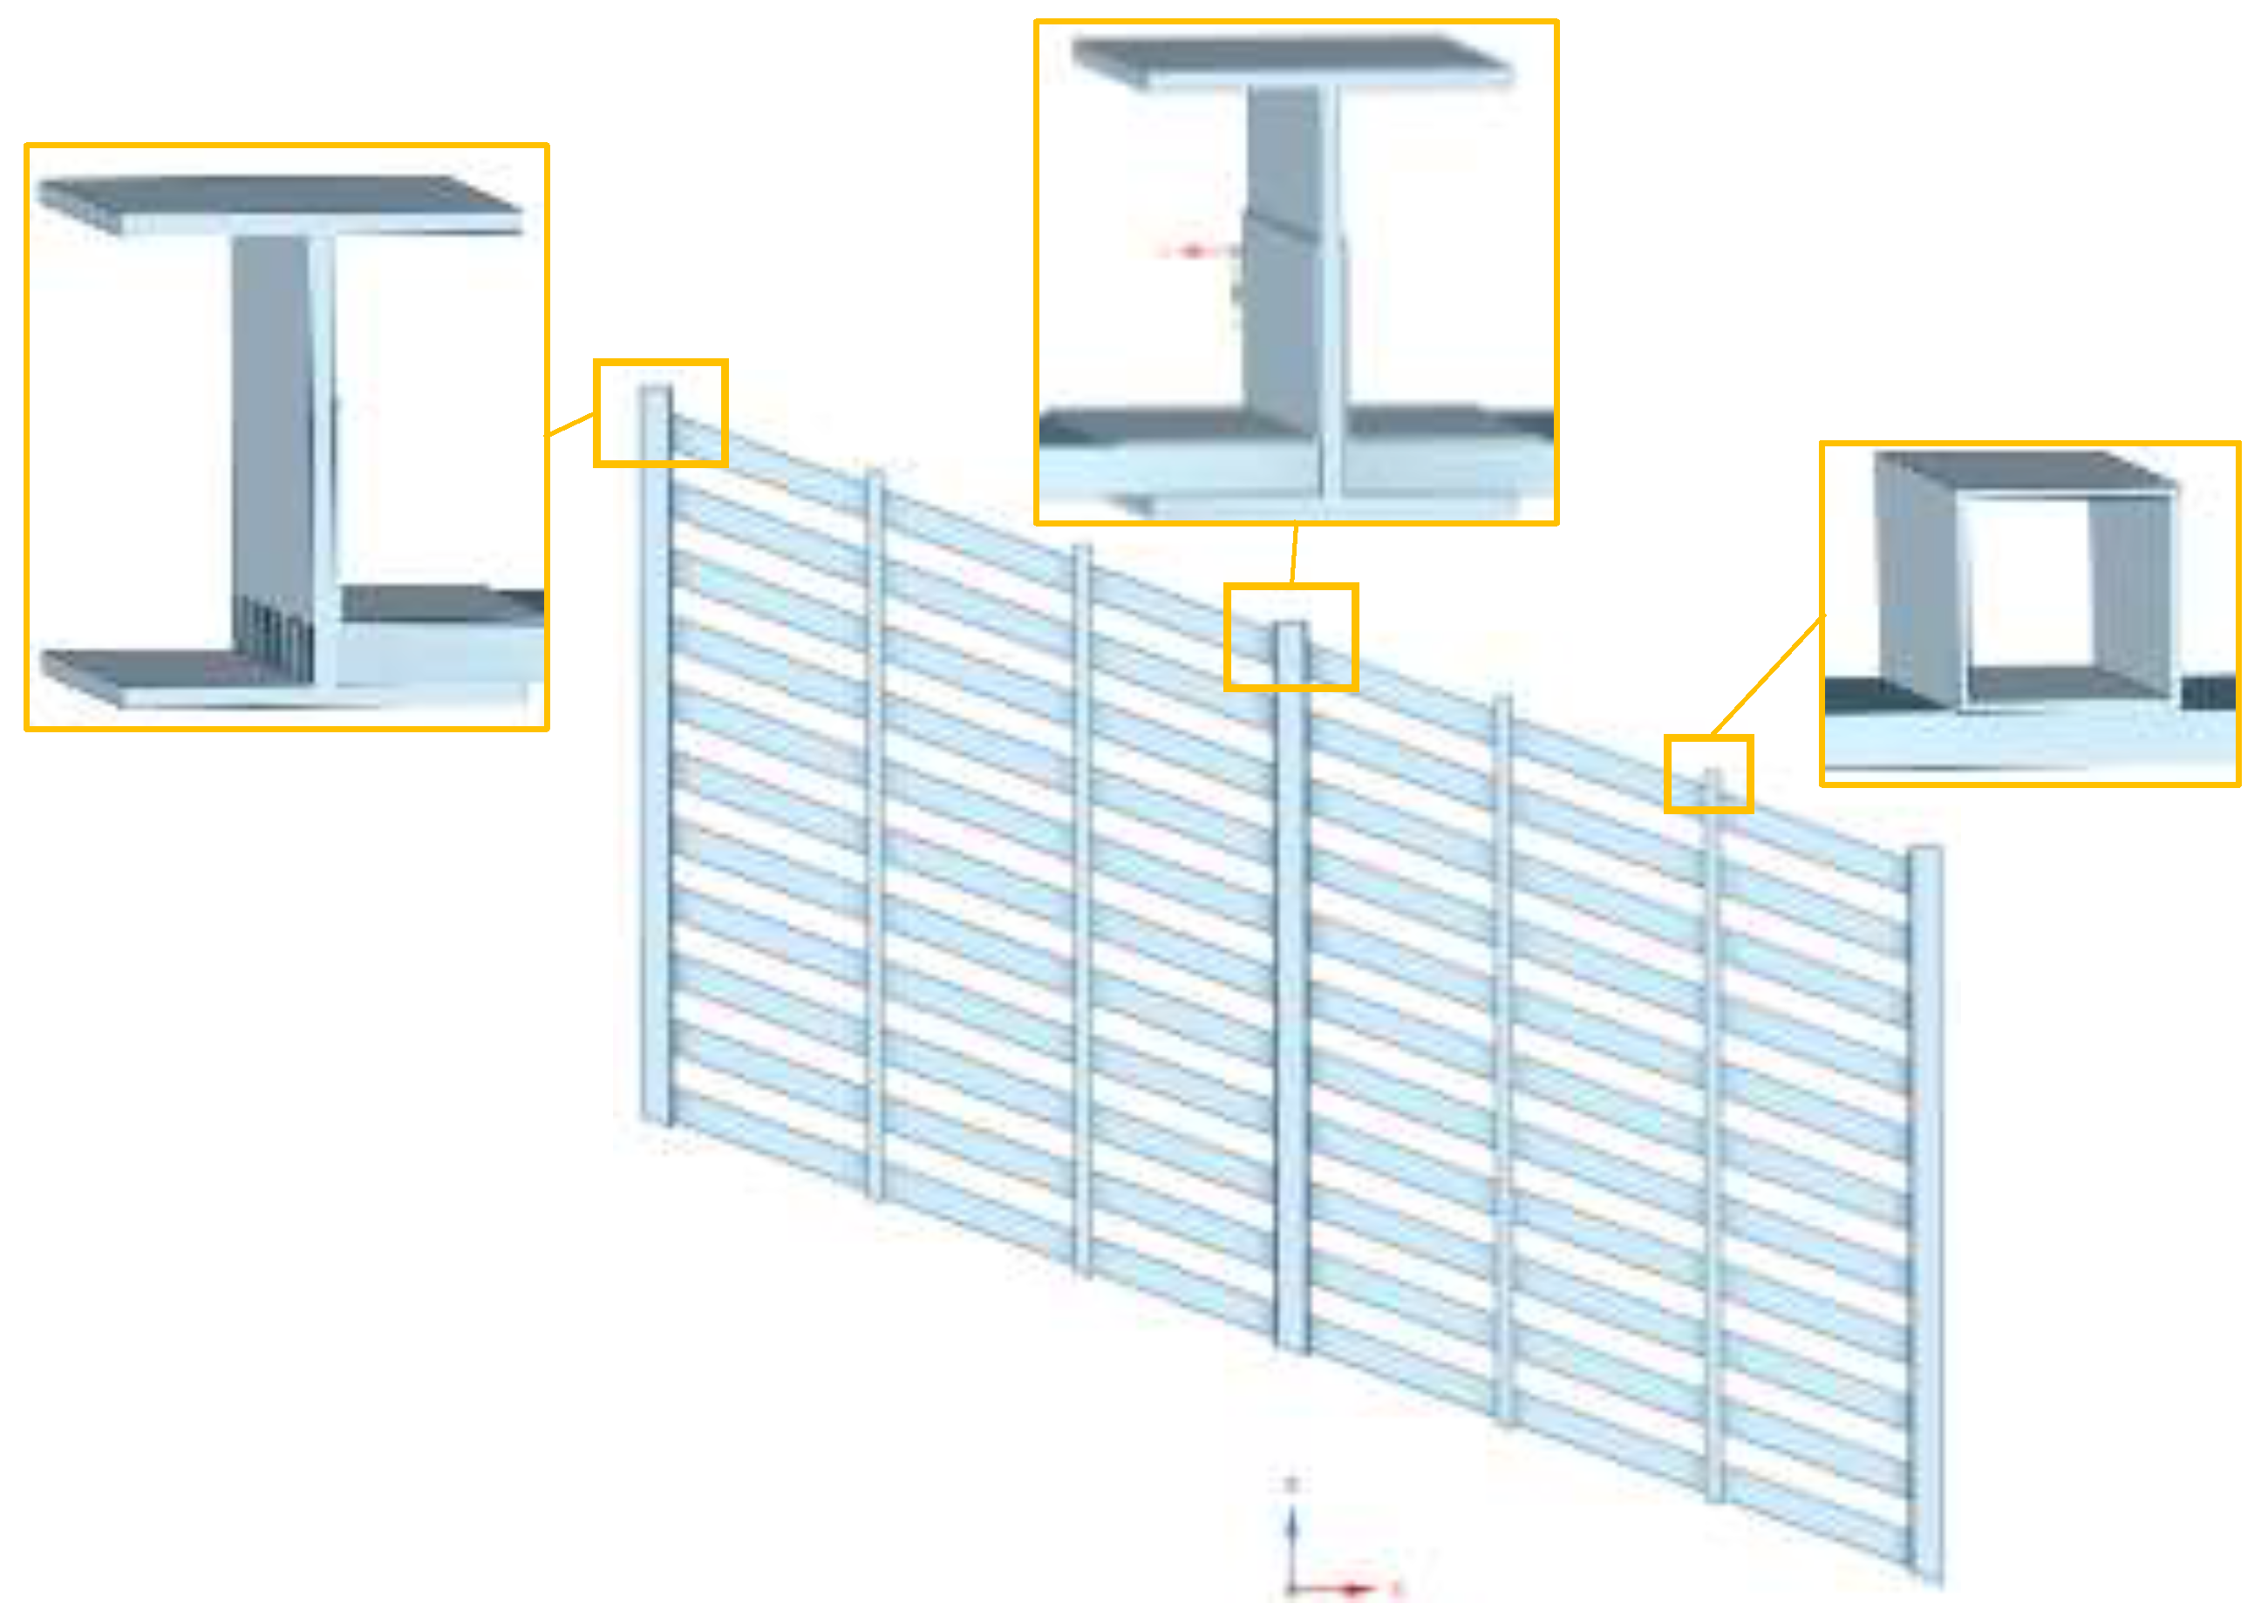
To prevent the adverse effect of strong wind conditions on the competition, storm barriers will be installed in the piste areas affected by high winds. The storm fence is made of pine boards connected to steel plates with a spacing of 4 m between the steel plate posts and 20 cm between the boards. The pine boards between the posts are reinforced by two square sheets of steel. The storm bars of the C2, G1 and E1 piste is selected as the simulation objects. The height and altitude of the storm bars are shown in Table 1, and the layout of the storm bars is shown in Figure 1. The storm fence was built on the hillside, and the slope is 20°.

Table 1.
Height and altitude of the storm barrier.
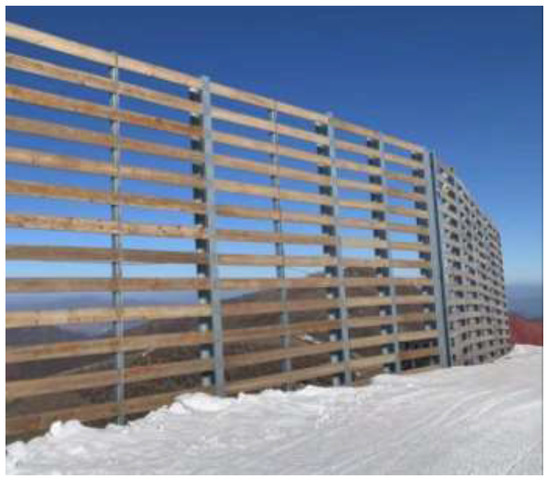
Figure 1.
Field layout of storm bars.
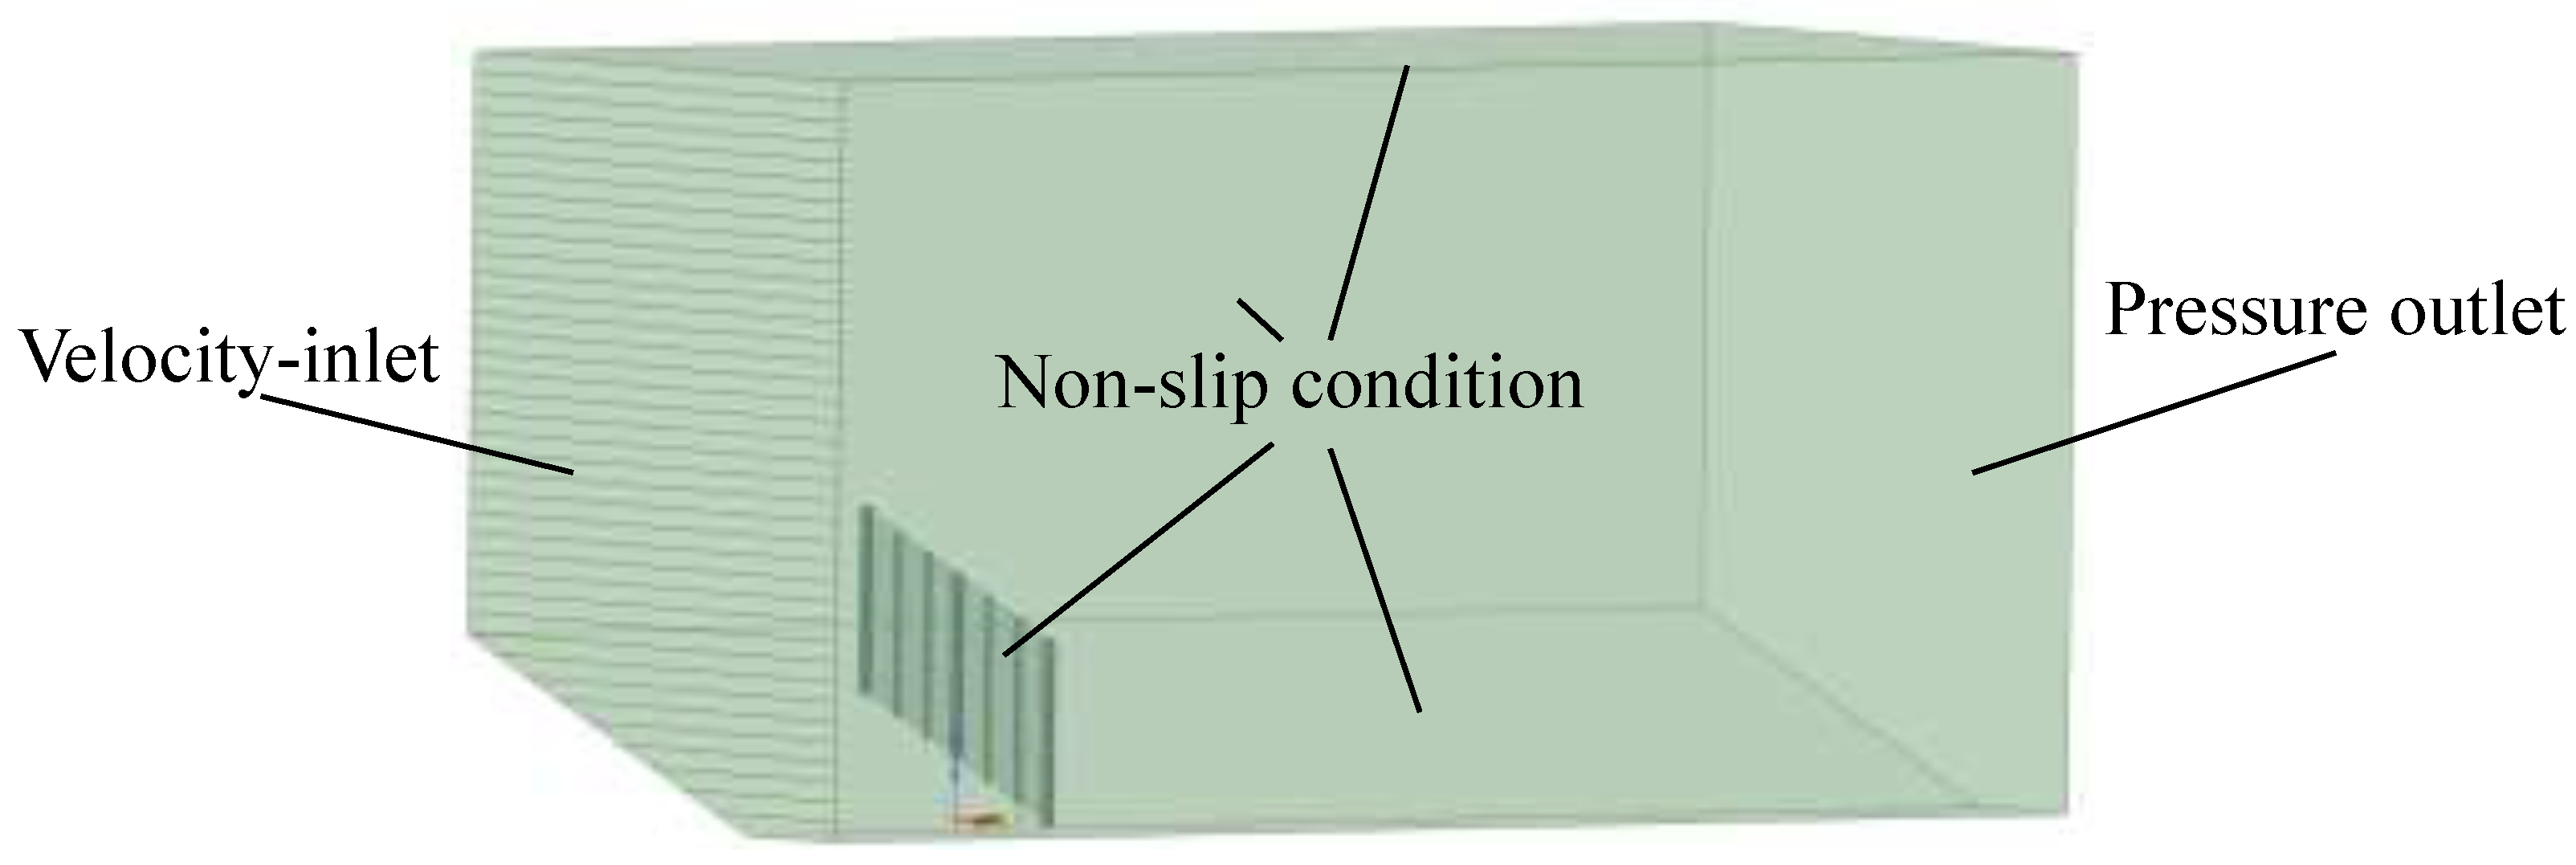
The SPACE CLAIM software was used to establish the storm fence models with heights of 3.7 m, 4.7 m and 7.9 m in a 1:1 ratio, respectively. The geometric models are shown in Figure 2. To consider the full development of the flow field, the calculation area should be larger than the model size. The calculation domains of 3.7, 4.7 and 7.9 m high storm barriers are 30 m × 13 m × 15 m, 38 m × 16 m × 19 m and 64 m × 28 m × 32 m, respectively. The calculation domains are shown in Figure 3.

Figure 2.
Schematic diagram of the storm fence model.
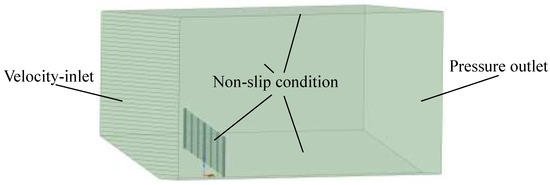
Figure 3.
Computational domain and boundary conditions.
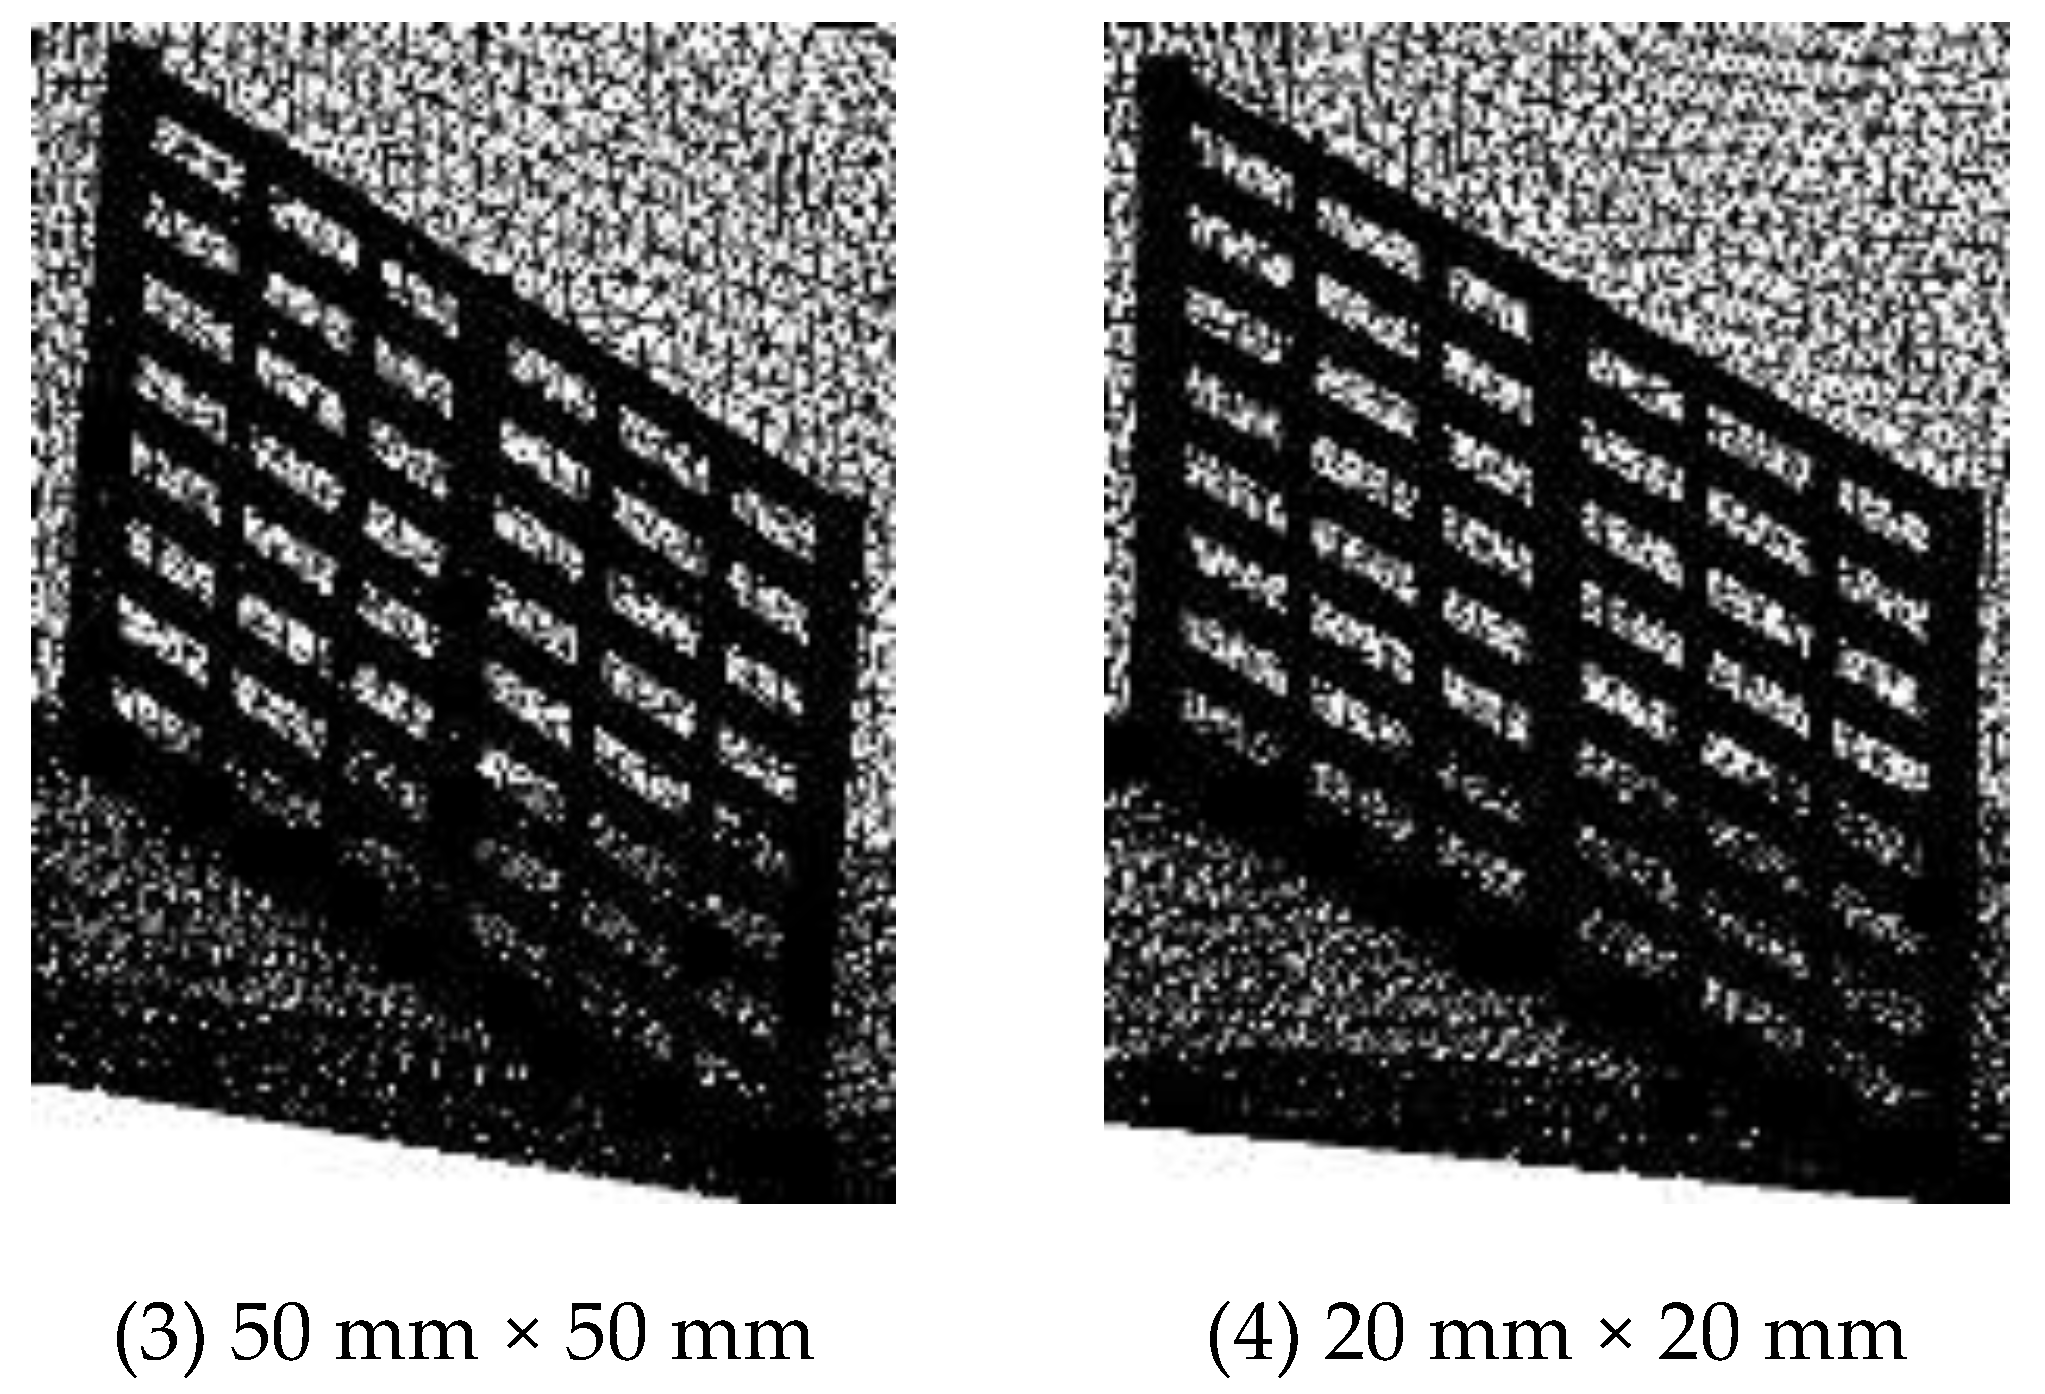
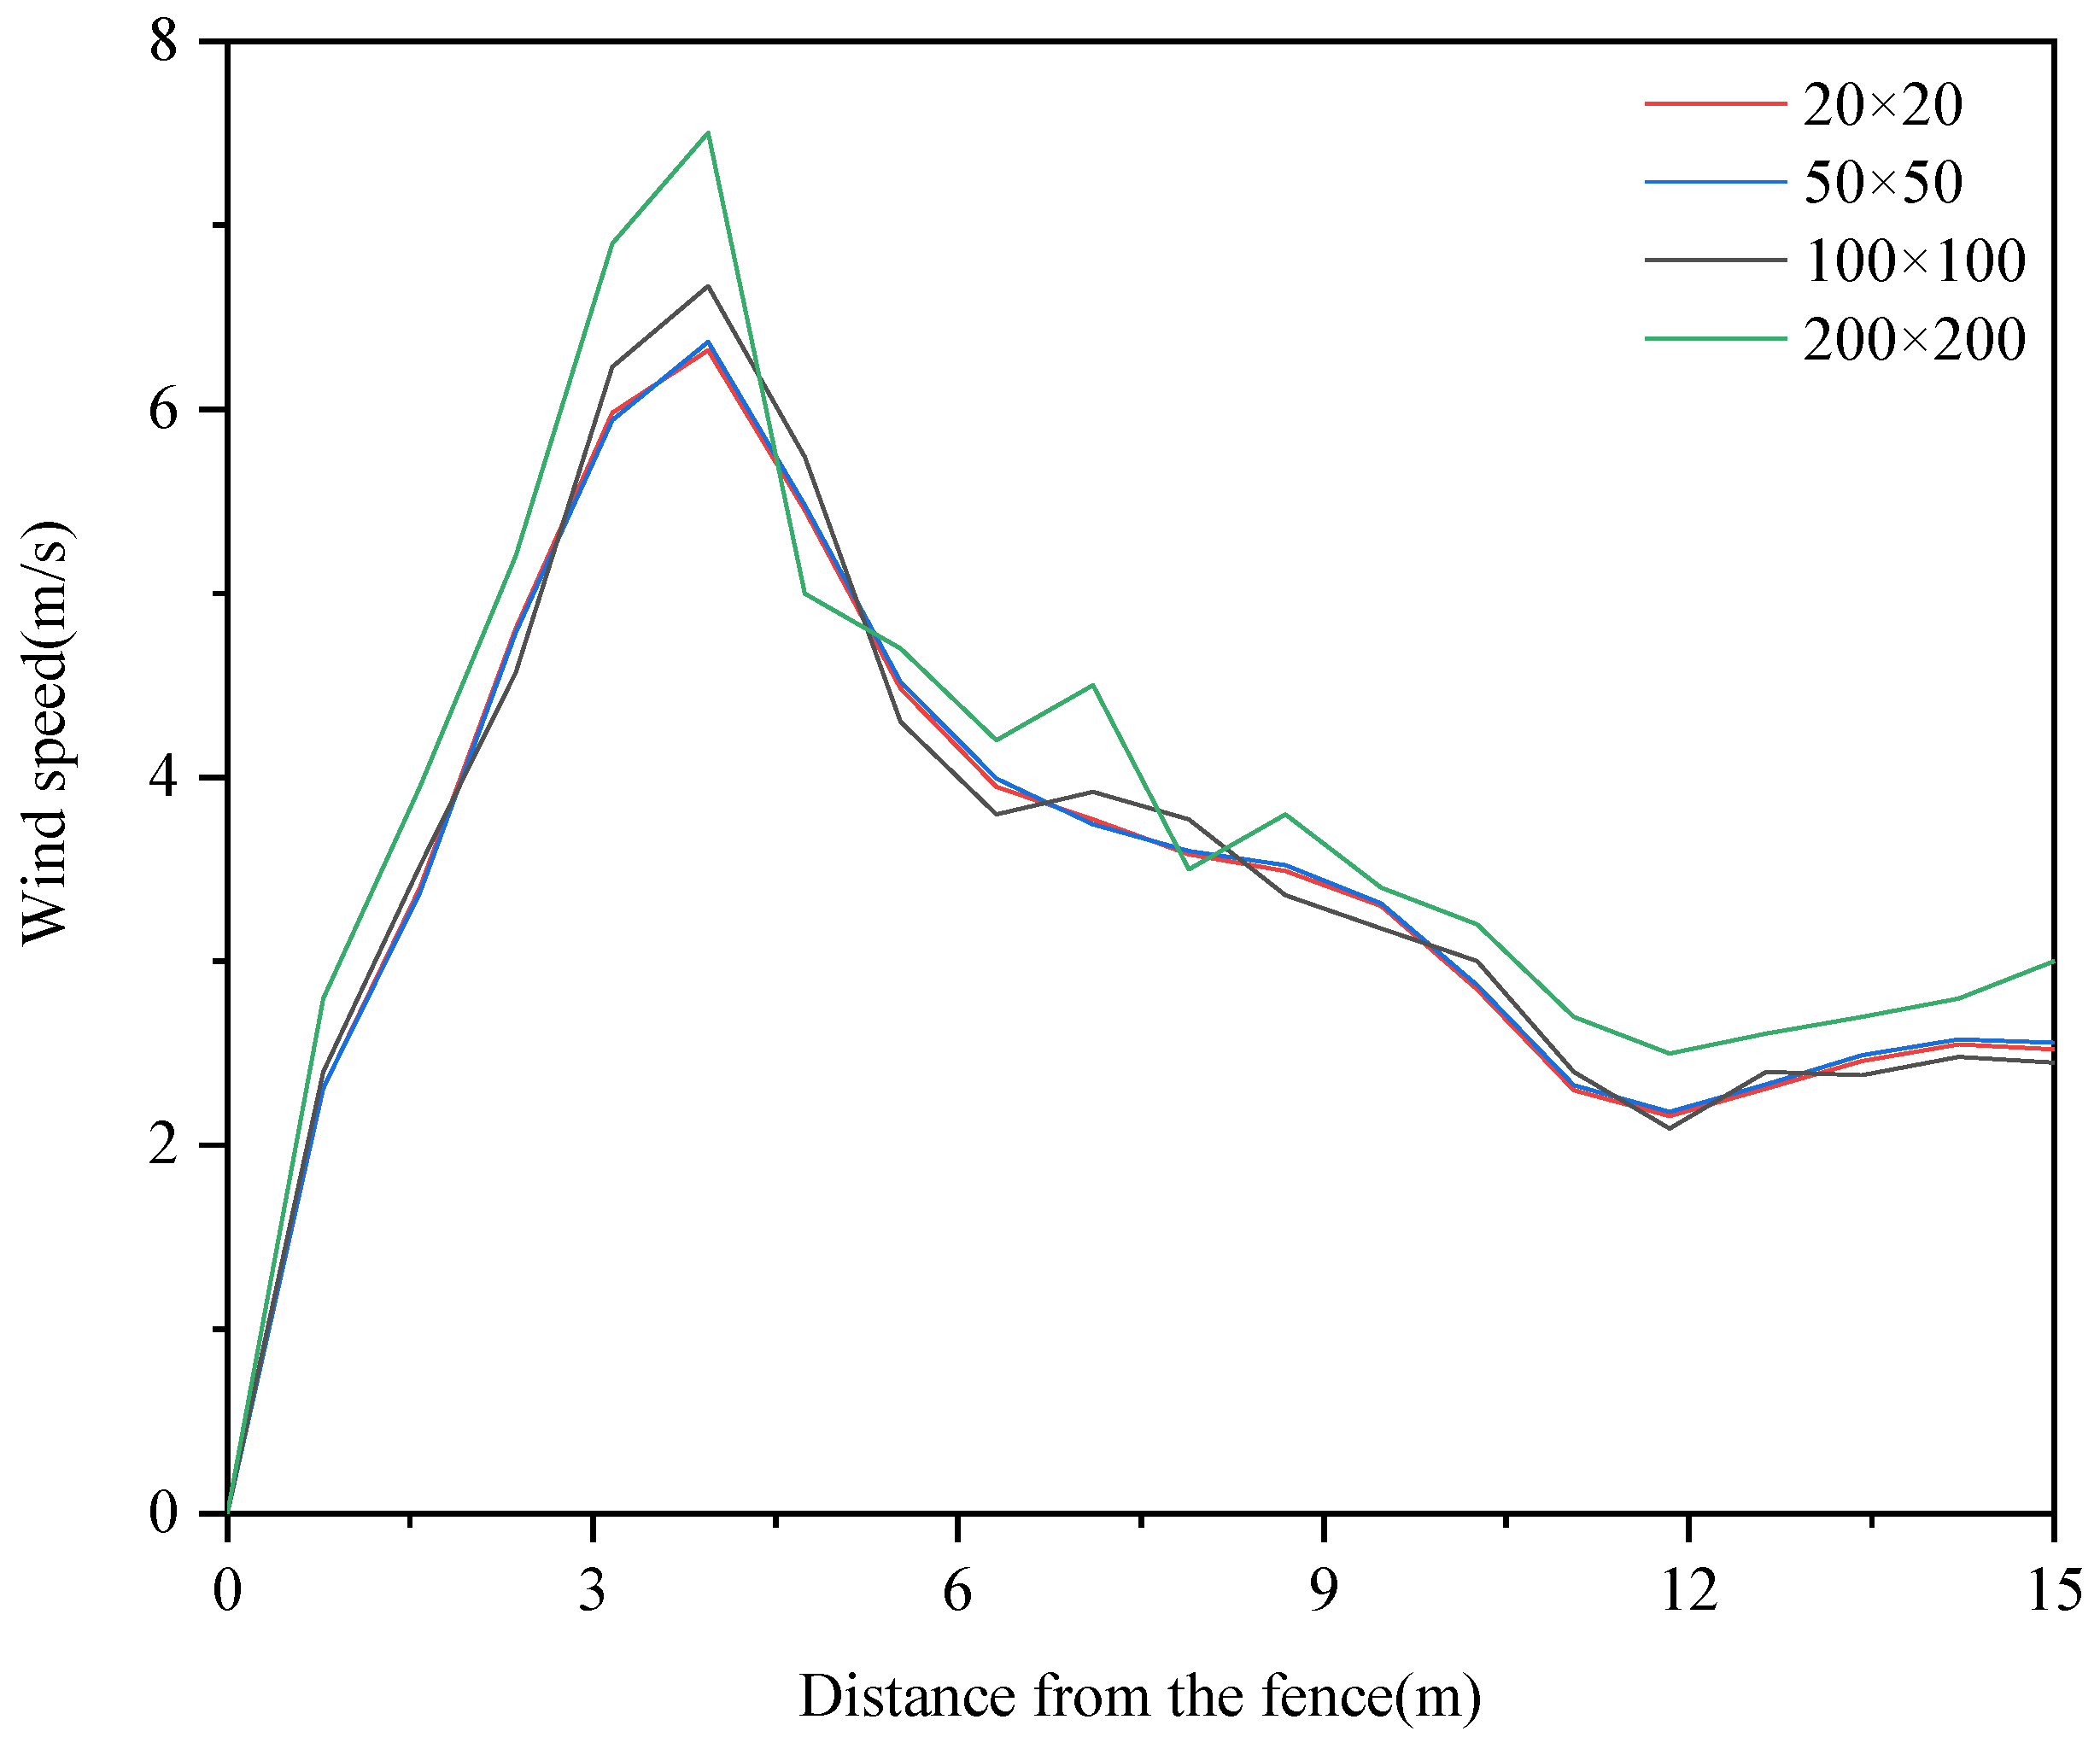
An unstructured tetrahedral mesh is used to divide the model of the windbreak grid, and the mesh near the wall of the windbreak grid is encrypted to reduce the influence of mesh quality on the calculation accuracy and stability. This paper uses hexahedral structured grids with precision of 200 mm × 200 mm, 100 mm × 100 mm, 50 mm × 50 mm and 20 mm × 20 mm, respectively, to verify the grid independence of wind velocity results at a height of 2 m above the ground on the central axis behind the windbreak. The mesh scheme is demonstrated as Figure 4 and the grid-independence assessment results are provided in Figure 5. The results show that the difference between the grid with the precision of 100 mm × 100 mm and 50 mm × 50 mm is 5%, while the difference between the grid with the precision of 50 mm × 50 mm and 20 mm × 20 mm is less than 1%. Considering the computation time and accuracy, the 50 mm × 50 mm grid is chosen. The total number of grids after the partition exceeds 6 million.
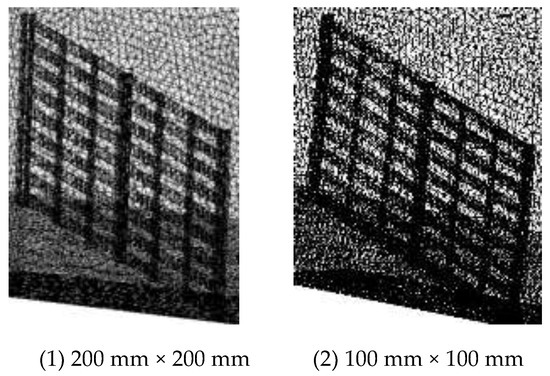

Figure 4.
Mesh schemes of grid meshing.
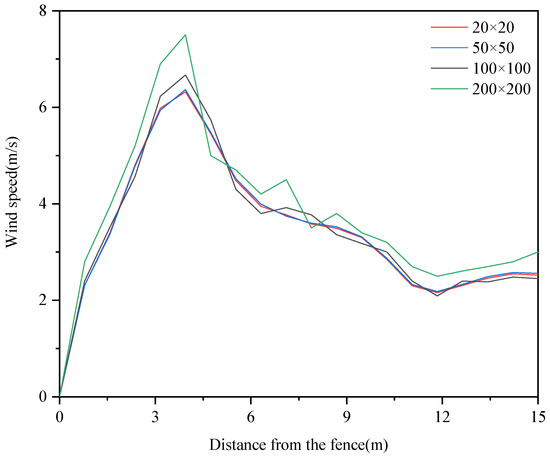
Figure 5.
Assessment of grid independence.
2.2. Meteorological Conditions near the Piste
To meet the demand for meteorological services and guarantee the Winter Olympic Games, Beijing Meteorological Bureau established a gradient observation system in Xiaohaituo Mountain in 2014, which consists of four automatic weather stations which can provide multi-factor meteorological data for the Winter Olympic Games. The four stations are built along the mountain and arranged in order of altitude from low to high. Zhang et al. (2017) [26] used the observation data of this system to analyze the 2-min average surface wind field data in the winter half-year from November 2014 to March 2016 and analyzed the characteristics of the surface wind field in the winter of Haituo Mountain racing area. Wu et al. [27] analyzed the characteristics of near-surface wind in the winter high mountain area of Yanqing District from December 2016 to February 2018. Based on the above literature, Table 2 lists the average and maximum wind speeds of four alpine stations in Yanqing District in winter. Table 2 shows the wind speed data of alpine weather stations (A1491 and A1492) with similar altitudes to the piste. The average wind speed of 10 m/s and the maximum wind speed of 33 m/s are taken as the inlet wind speed, respectively.
Table 2.
Wind speed characteristics of alpine meteorological stations in Yanqing District in winter.
2.3. The Numerical Model
The air around the fence is reduced to incompressible fluid and the flow is reduced to steady-state adiabatic. The spatial flow field was in a turbulent state, and the standard k-ε model widely used in engineering was used for calculation. Chen et al. [23] verified the standard k-ε turbulence model combined with the storm barrier model. The results show that the simulated wind speed is consistent with the measured value, and the simulated results reflect the actual wind environment. Turbulent pulsating kinetic energy and turbulent dissipation rate:
Turbulent viscosity coefficient:
where , , , is the empirical constant (1.44, 1.92, 1.0, 1.33) and is the turbulence constant (0.09).
A simple algorithm was used to calculate the coupling of the velocity field and the pressure field of the storm barrier. The simple algorithm is a semi-implicit method for solving the mass, momentum and energy transfer equations coupled with pressure, and is the main numerical method for calculating the incompressible flow field.
2.4. The Boundary Conditions
Figure 3 shows the boundary conditions of the model. Velocity inlet was used for the inlet boundary, which can be formulated as the following exponential form:
where is the wind speed at height Z; is the known wind speed at 10 m height; α is the surface roughness coefficient. According to the Load code for the design of building structures [28], the roughness coefficient of class B landform is 0.15. Class B refers to fields, villages, jungles, hills, towns and urban suburbs where houses are sparse. Two kinds of wind speeds of 10 and 33 m/s at the entrance height of 10 m were simulated, respectively, to analyze the wind field distribution near the storm barrier with different heights.
The outlet boundary is a pressure outlet, and the outlet pressure is atmospheric pressure. The internal cell surface and other boundaries are given as non-slip boundary conditions.
2.5. Hydrostatic Calculations
The results of the solid model and fluid solution in Fluent were transferred to Static Structural, which was used for the hydrostatic calculation of the windbreak. In the computational model, the Poisson’s ratio of pine wood is taken as μ = 0.2, the modulus of elasticity is taken as E = 1.2 × 10⁵ Mpa, and the density of wood is taken as 300 kg/m3. The steel type is Q345, the Poisson’s ratio is taken as μ = 0.3, the modulus of elasticity is taken as E = 2.06 × 10⁵ Mpa and the density of steel is taken as 7850 kg/m3. The calculations were performed using the von Mises yield criterion and its associated flow law.
3. Results and Discussion
3.1. Distribution Characteristics of the Wind Field in Storm Bars
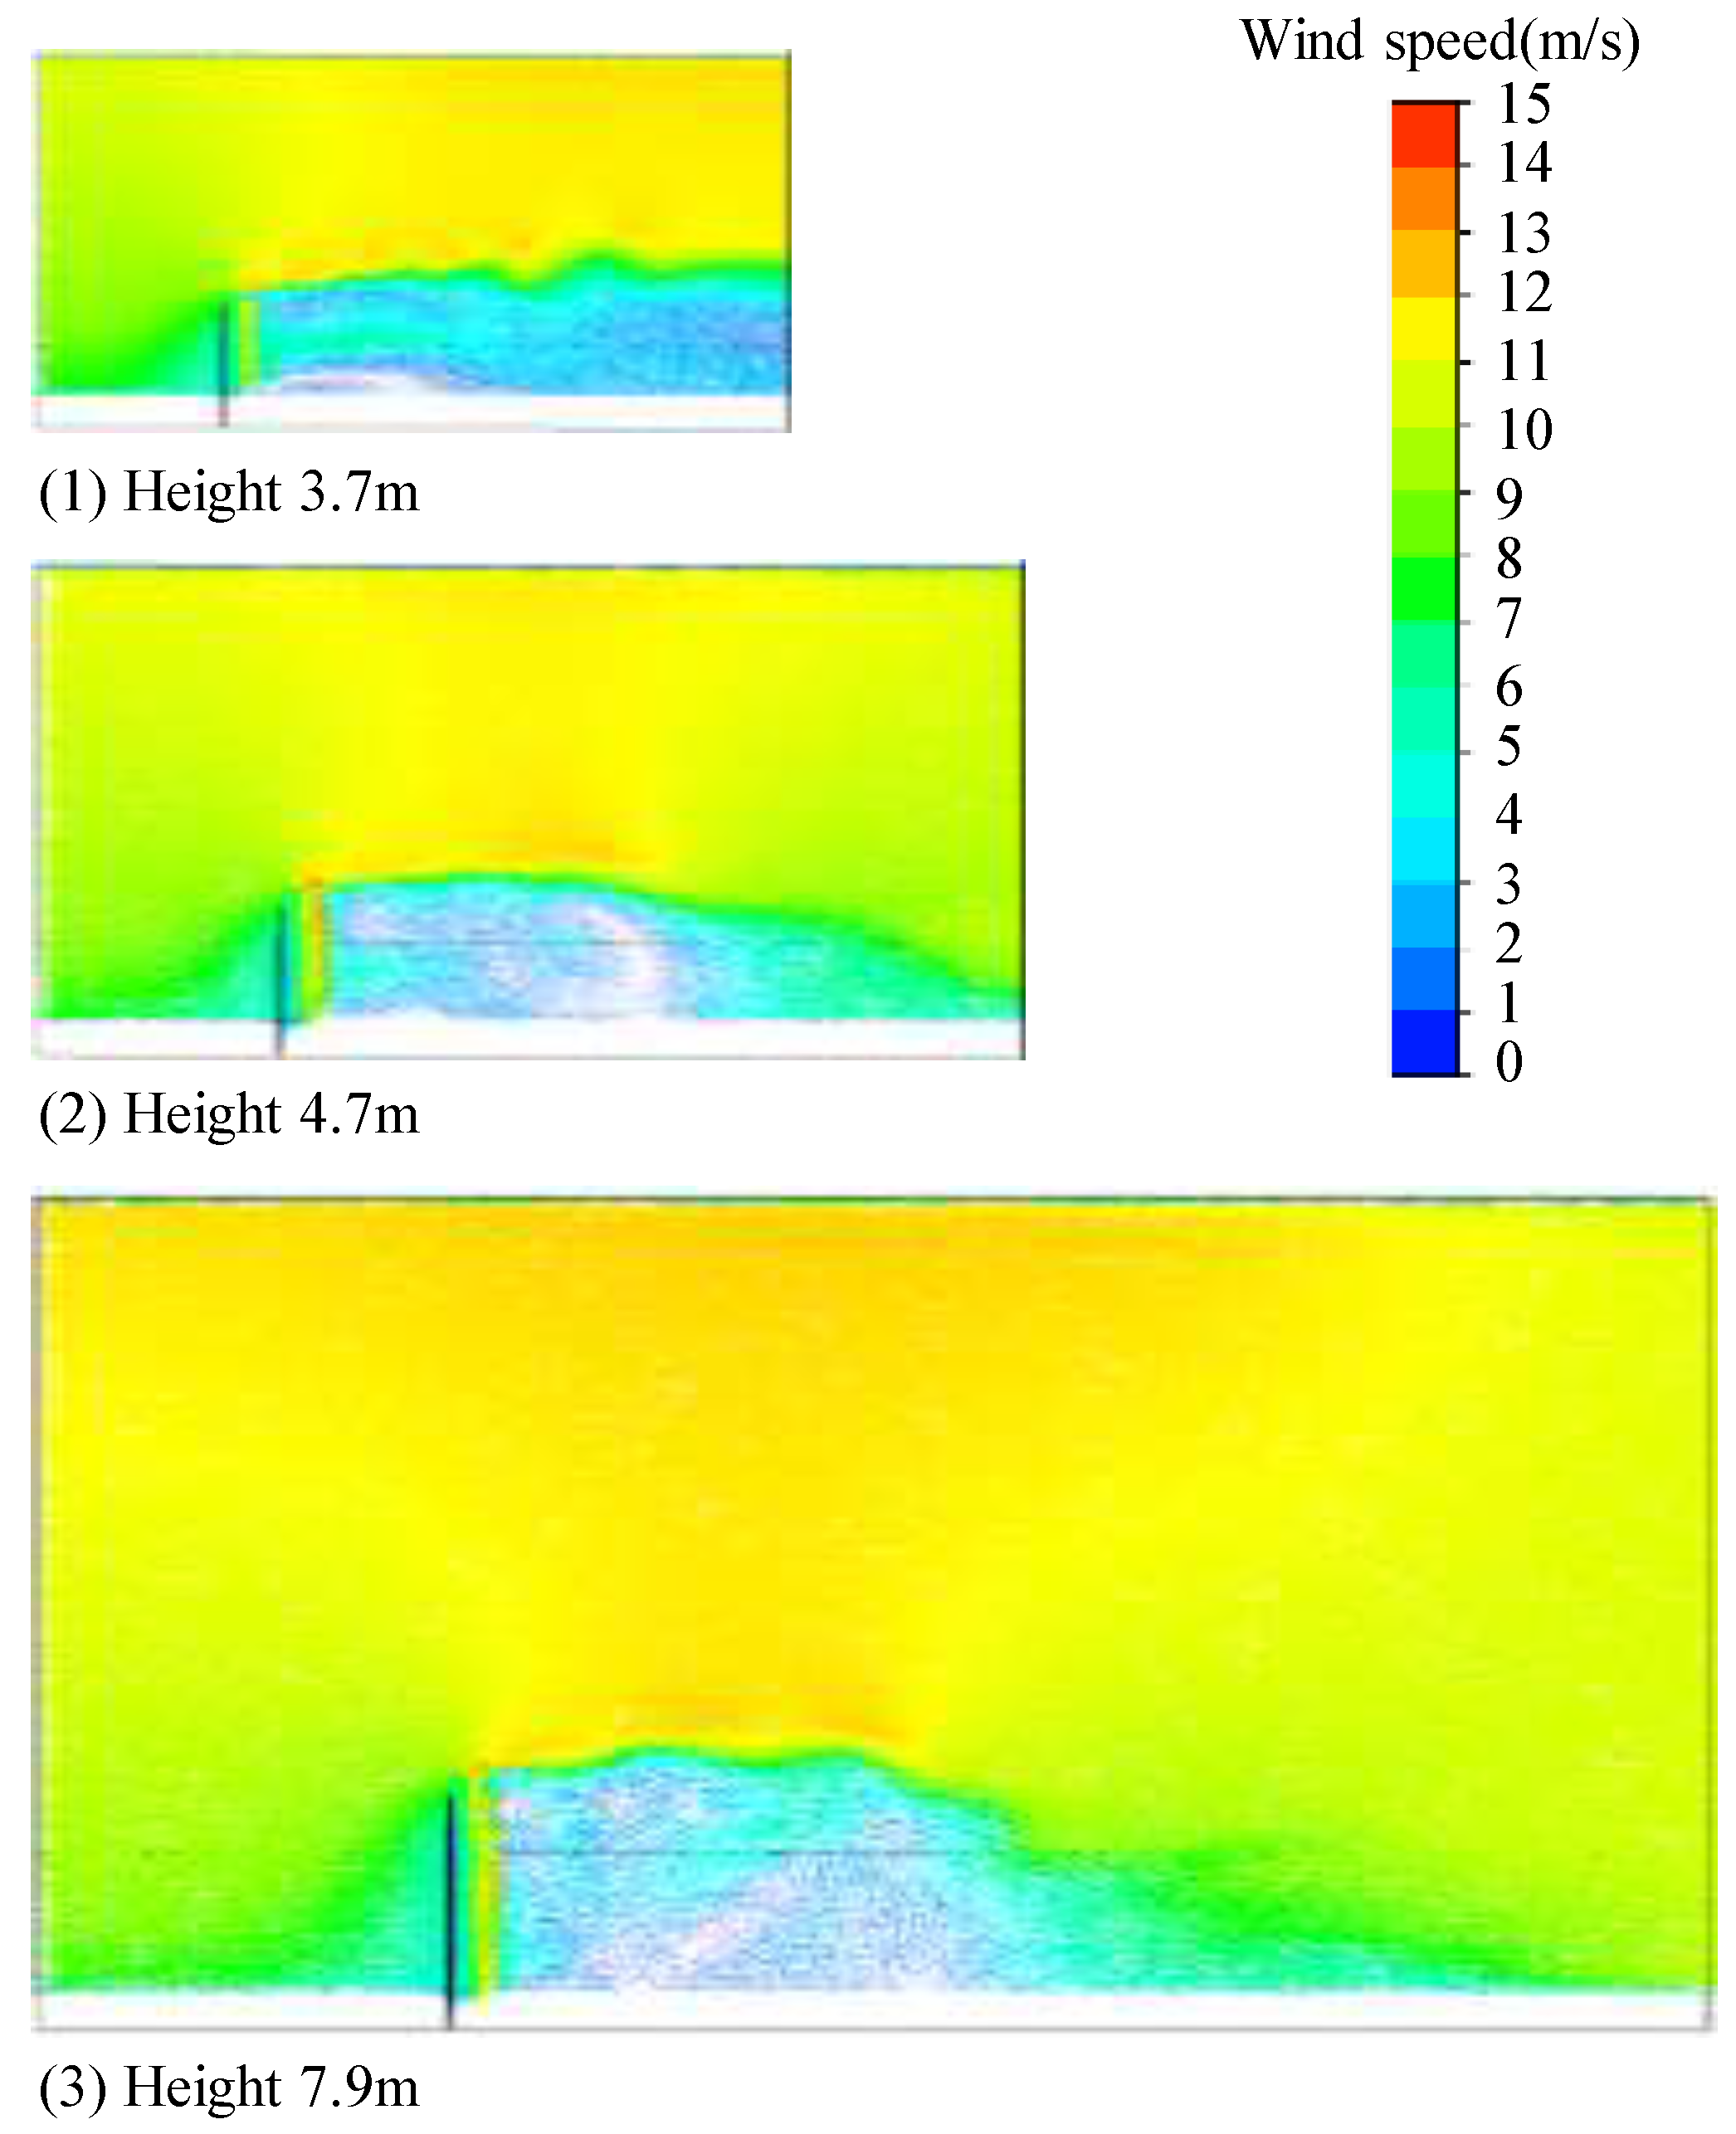
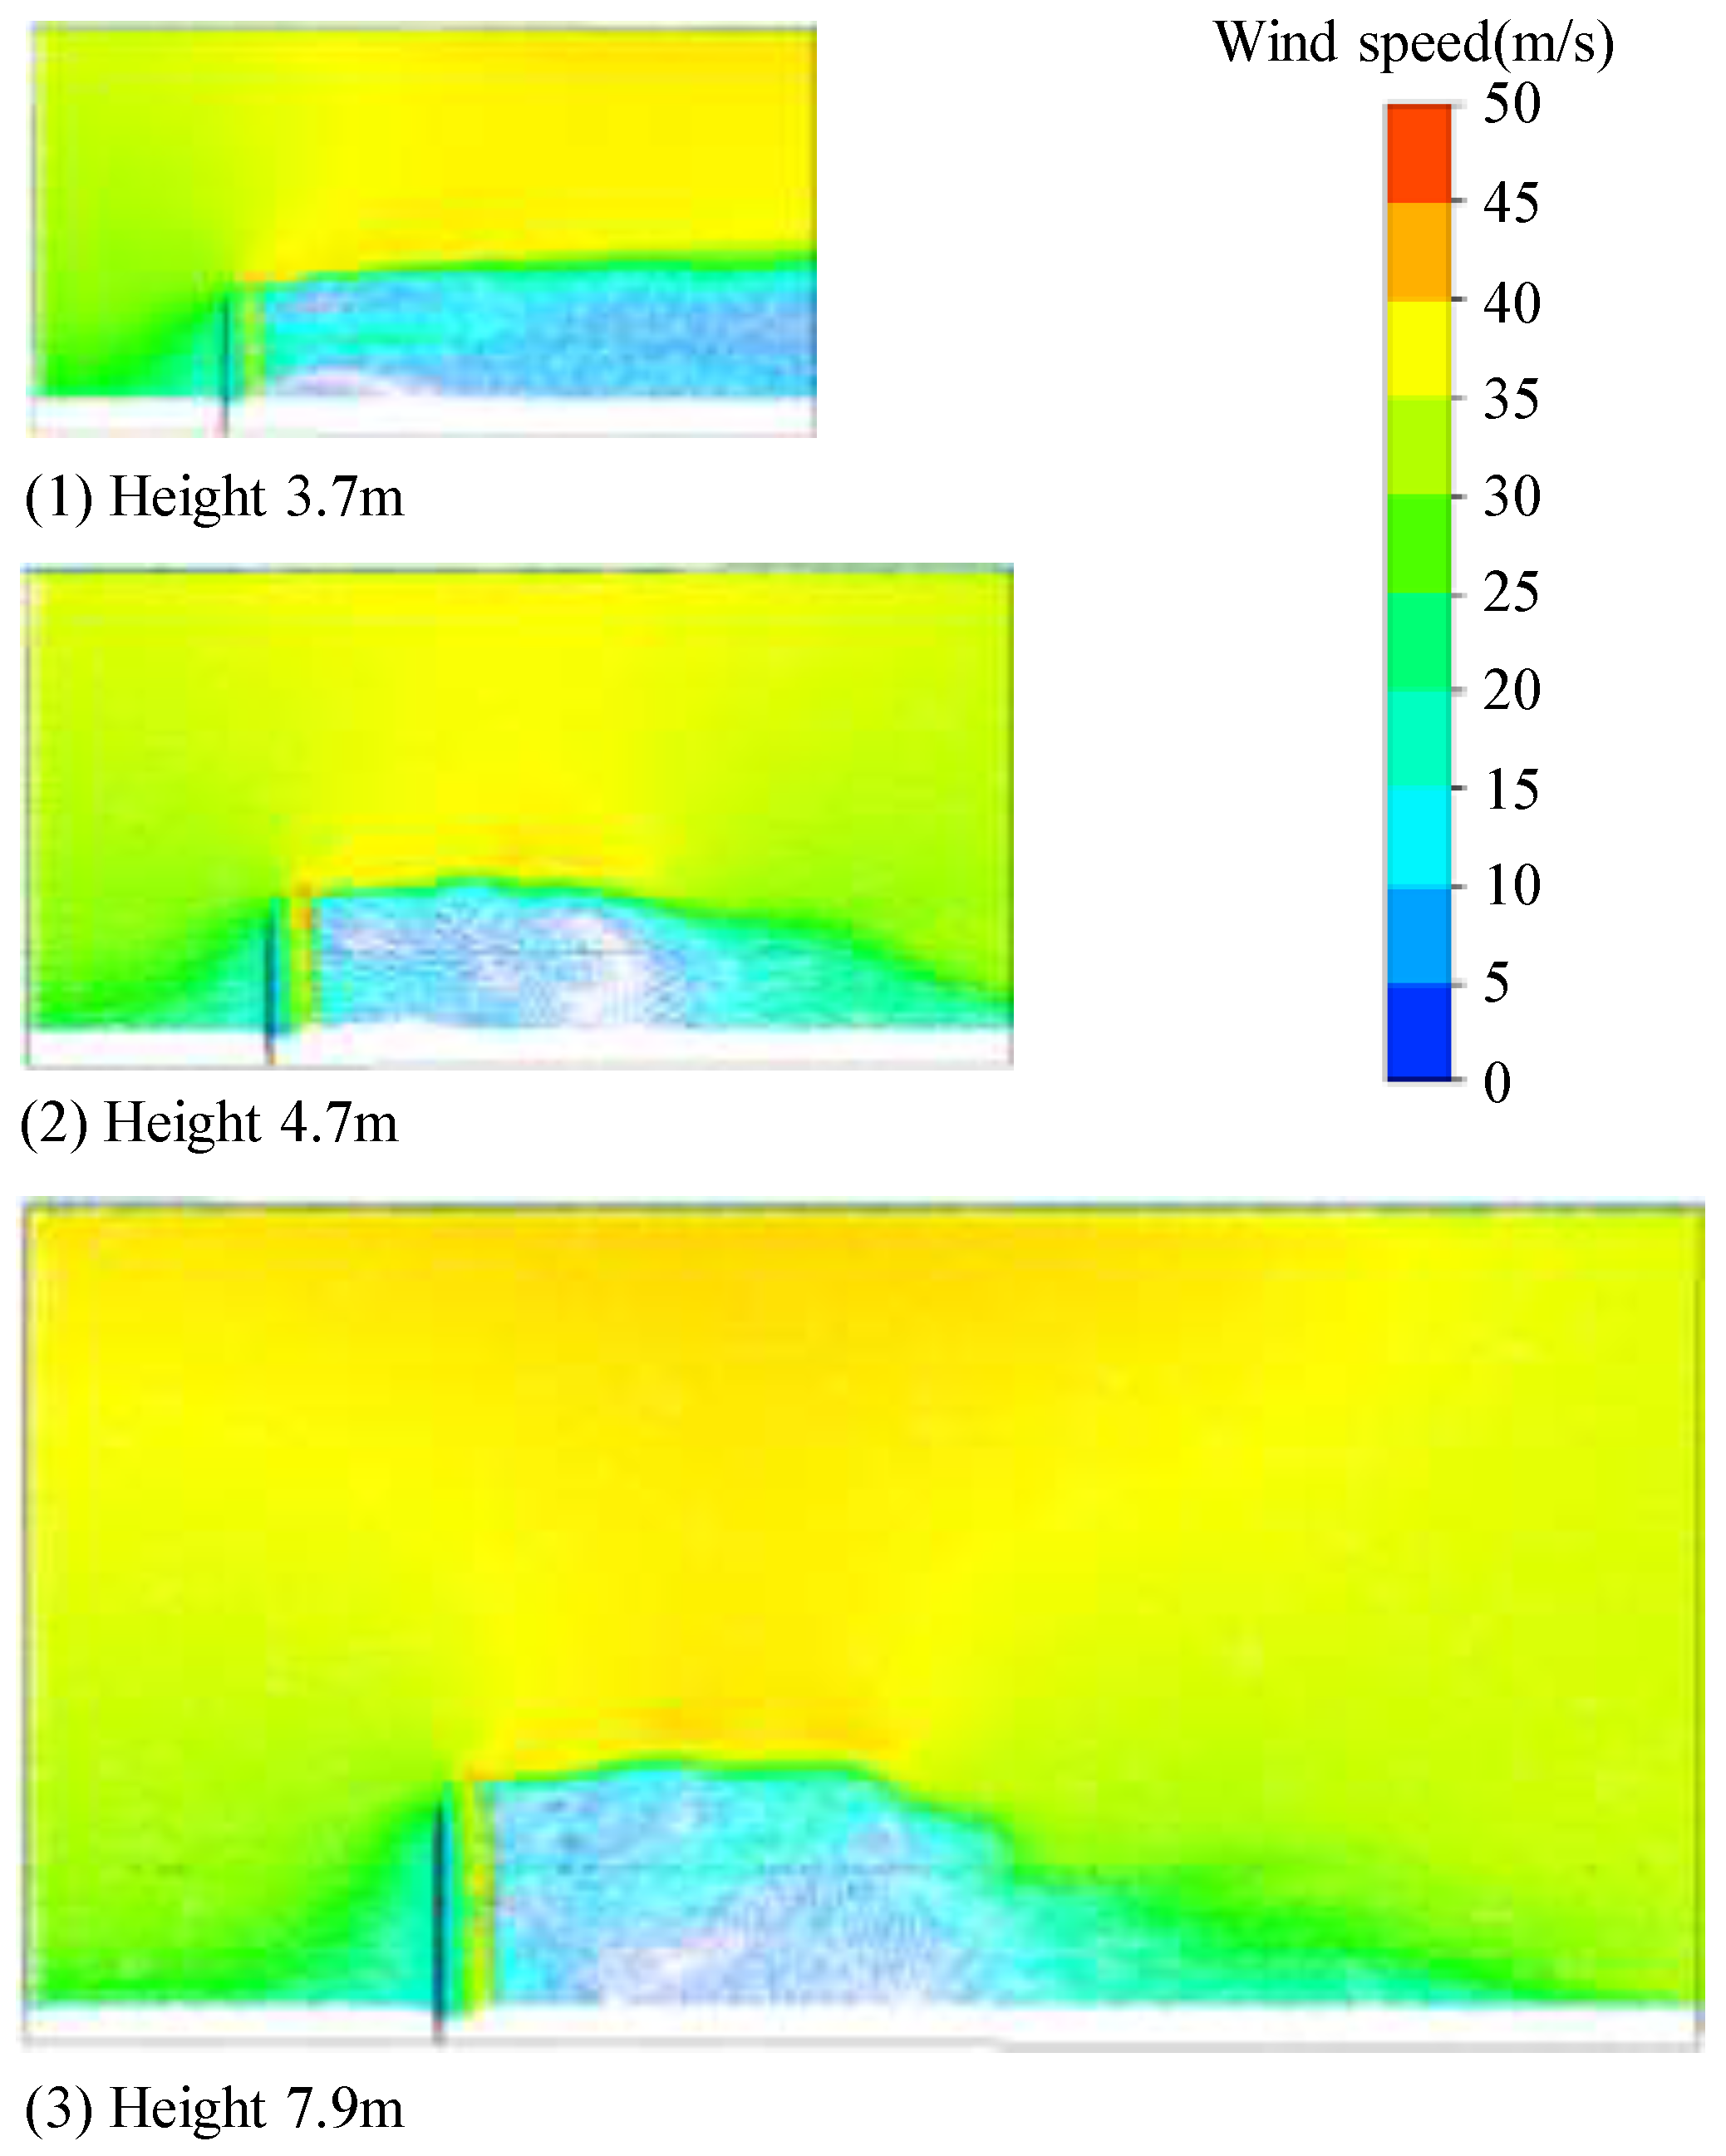
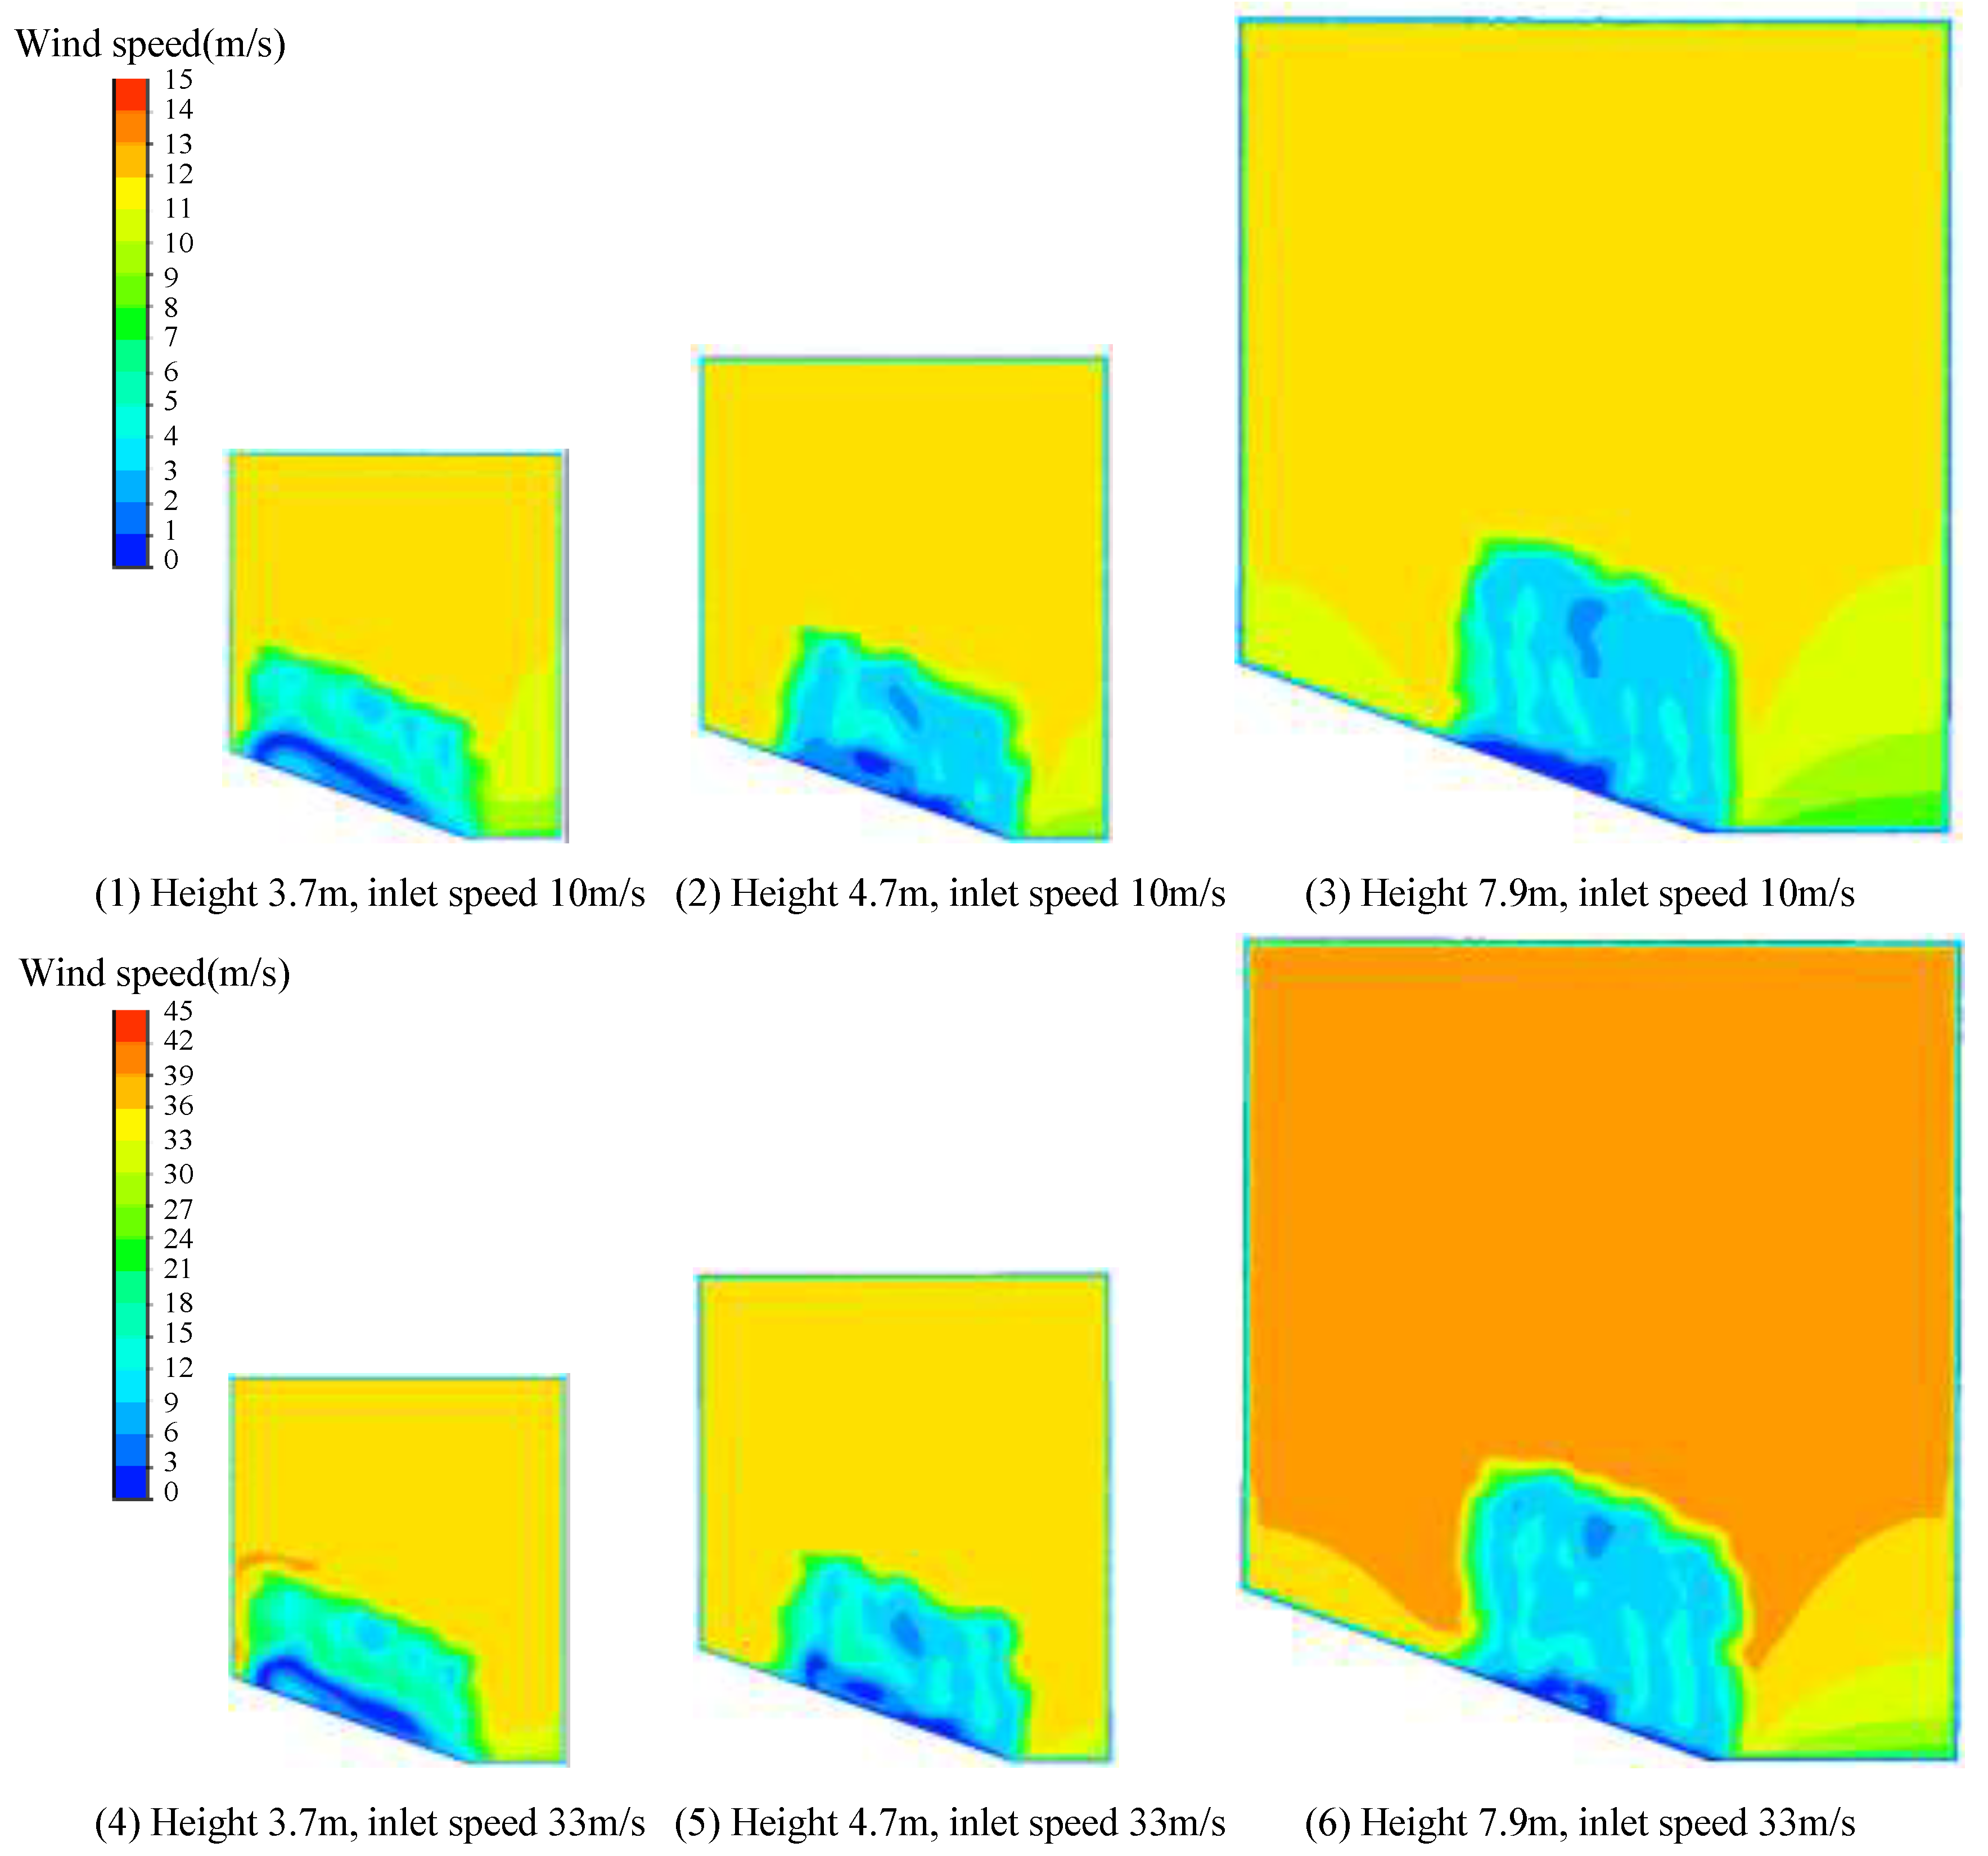
The simulation calculations considered the distribution of the flow field at a wind speed of 10 or 33 m/s at its inlet height of 10 m for windbreak fences with heights of 3.7, 4.7 and 7.9 m, respectively, and the simulation results are shown in Figure 6 and Figure 7. It can be seen that when the wind speed at the inlet height of 10 m is 10 or 33 m/s, the maximum wind speed at the opening of the fences can reach over 15 or 50 m/s. The ambient wind speed is at a maximum near the opening through the windbreak fence. A low wind speed area is formed at the bottom of the fence. When the wind speed is 10 and 33 m/s at the inlet height of 10 m, the wind speed in this area is less than 3 and 10 m/s, respectively.

Figure 6.
Flow field distribution in windbreak grid—inlet wind speed 10 m/s.
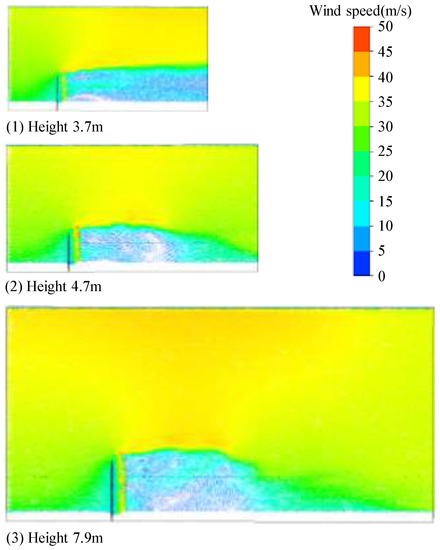
Figure 7.
Flow field distribution in windbreak grid—inlet wind speed 33 m/s.
The distribution of flow lines near the windbreak at different heights is basically the same. The ambient wind passes through the windbreak and forms an obvious bypass and infiltration flow. The ambient wind blowing from outside is blocked by the windbreak, and the airflow moves in the free space at the top of the windbreak, forming an acceleration effect. The ambient wind blowing to the top of the windbreak fence forms a high velocity zone above the fence. The wind speed at the upper part of the barrier exceeds 12 and 40 m/s when the wind speed is 10 and 33 m/s at the inlet height of 10 m. The middle of the barrier is the resistance space, and the ambient wind is blocked by the fence. Except for a small portion of wind dissipated through the openings of the windbreak, most of the wind is shielded by the windbreak, which makes the wind speed after the windbreak significantly reduced. When the wind speed is 10 and 33 m/s at the inlet height of 10 m, the wind speed in most of the areas behind the windbreak is below 5 and 15 m/s, respectively, which is obviously lower than the incoming wind speed, indicating that the windbreak effectively shields the ambient wind, and the wind prevention effect is obvious.
There is no international standard for wind speed control in ski sports because there is less research on ski sports climate protection. The “Green Building Evaluation Standard” in Beijing [29] specifies the outdoor comfortable wind speed as 5 m/s, so we used 5 m/s as the wind speed threshold of the ski course [30]. The results show that the windbreak can effectively reduce the wind speed of the ski courses to 50% of the ambient wind. Under the effect of average wind speed, the installation of a windbreak fence next to the ski courses can effectively reduce the wind speed to a threshold value.
3.2. Influence of the Height of the Storm Fence on the Effect of the Storm
The distribution of the flow field at 5 m after the 3.7, 4.7 and 7.9 m windbreaks is shown in Figure 8. When the ambient wind crosses the windbreak, the wind speed at the inlet height of 10 m is 10 and 33 m/s, respectively, and the wind speed after the windbreak drops to 4 and 12 m/s, respectively, which is significantly lower than the incoming wind speed. When the height of the windbreak is lower, the static wind area at the bottom of 5 m after the windbreak is larger, while when the height of the windbreak is higher, the low wind speed area at the top of the windbreak accounts for a larger proportion.
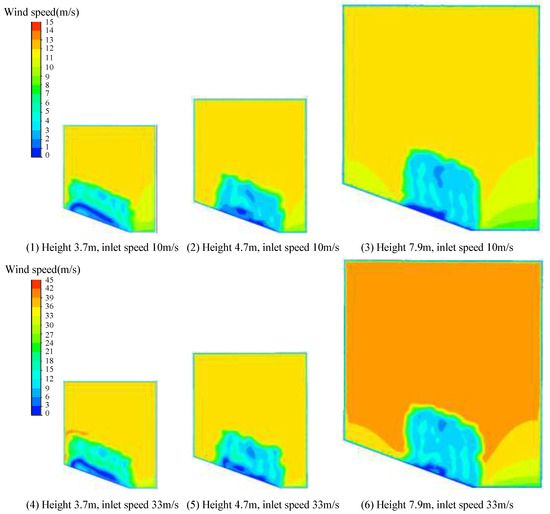
Figure 8.
Flow field distribution at 5 m behind the storm barrier.
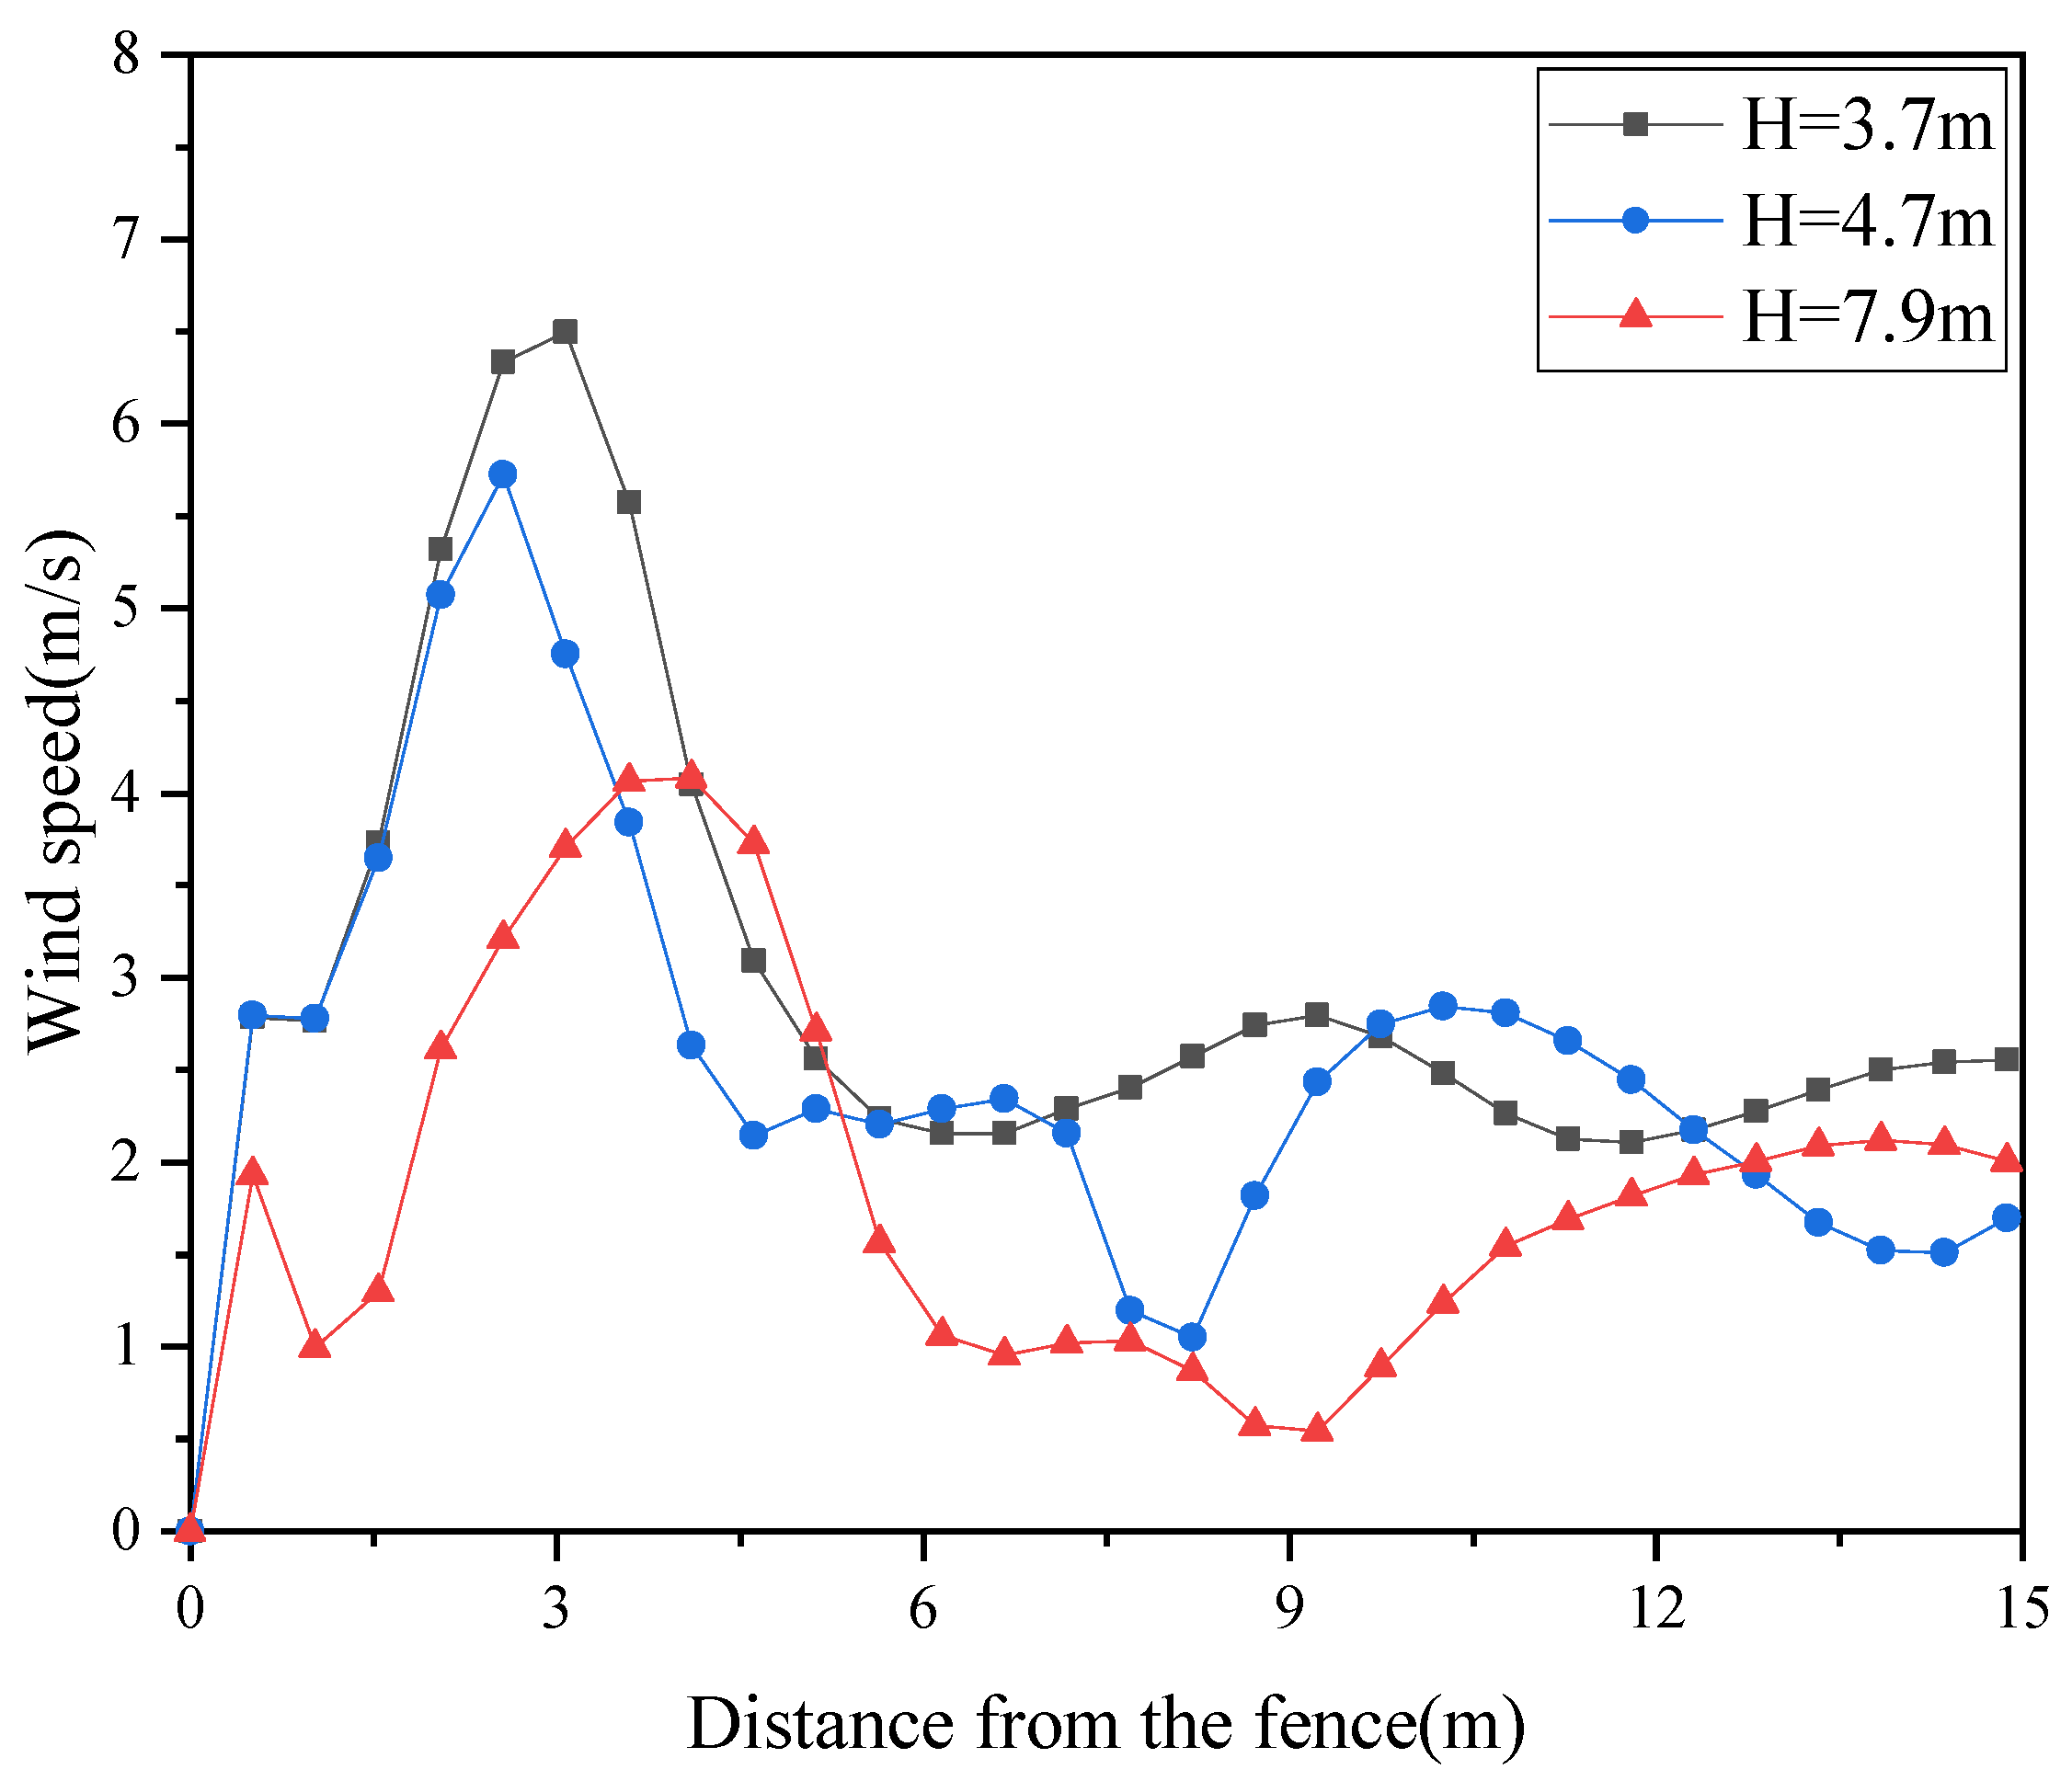
Figure 9 and Figure 10 show the wind speed behind windbreaks of different heights with respect to the distance behind the windbreaks. The wind protection effect of the windbreak increases with the increase of the height of the fence. A high wind speed zone is formed at 2–4 m behind the windbreak. When the inlet wind speed is 10 m/s, the 3.7, 4.7 and 7.9 m high windbreak can reduce the wind speed by 40%, 51% and 63%, respectively. When the inlet wind speed is 33 m/s, the 3.7, 4.7 and 7.9 m high windbreak can reduce the wind speed by 44%, 56% and 65%, respectively. A low wind speed zone is formed at 7–15 m behind the windbreak, and the wind speed is reduced by more than 70% for different heights of windbreak; thus, the windbreak is most effective when the ski course is located here. Overall, the wind protection effect of the 7.9 m high windbreak is better than that of the 3.7 and 4.7 m high windbreaks.
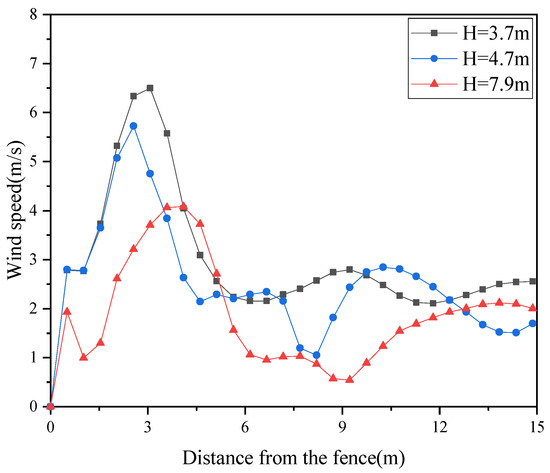
Figure 9.
Influence of storm barrier height on wind speed—inlet wind speed 10 m/s.
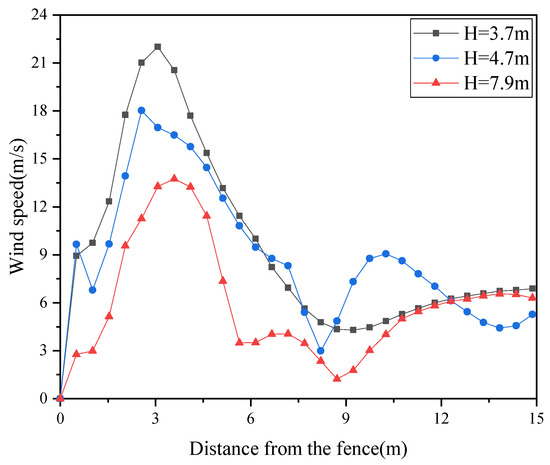
Figure 10.
Influence of the height of the storm barrier on the wind speed—the inlet wind speed is 33 m/s.
3.3. Distribution Characteristics of Wind Pressure in Windbreak Grid
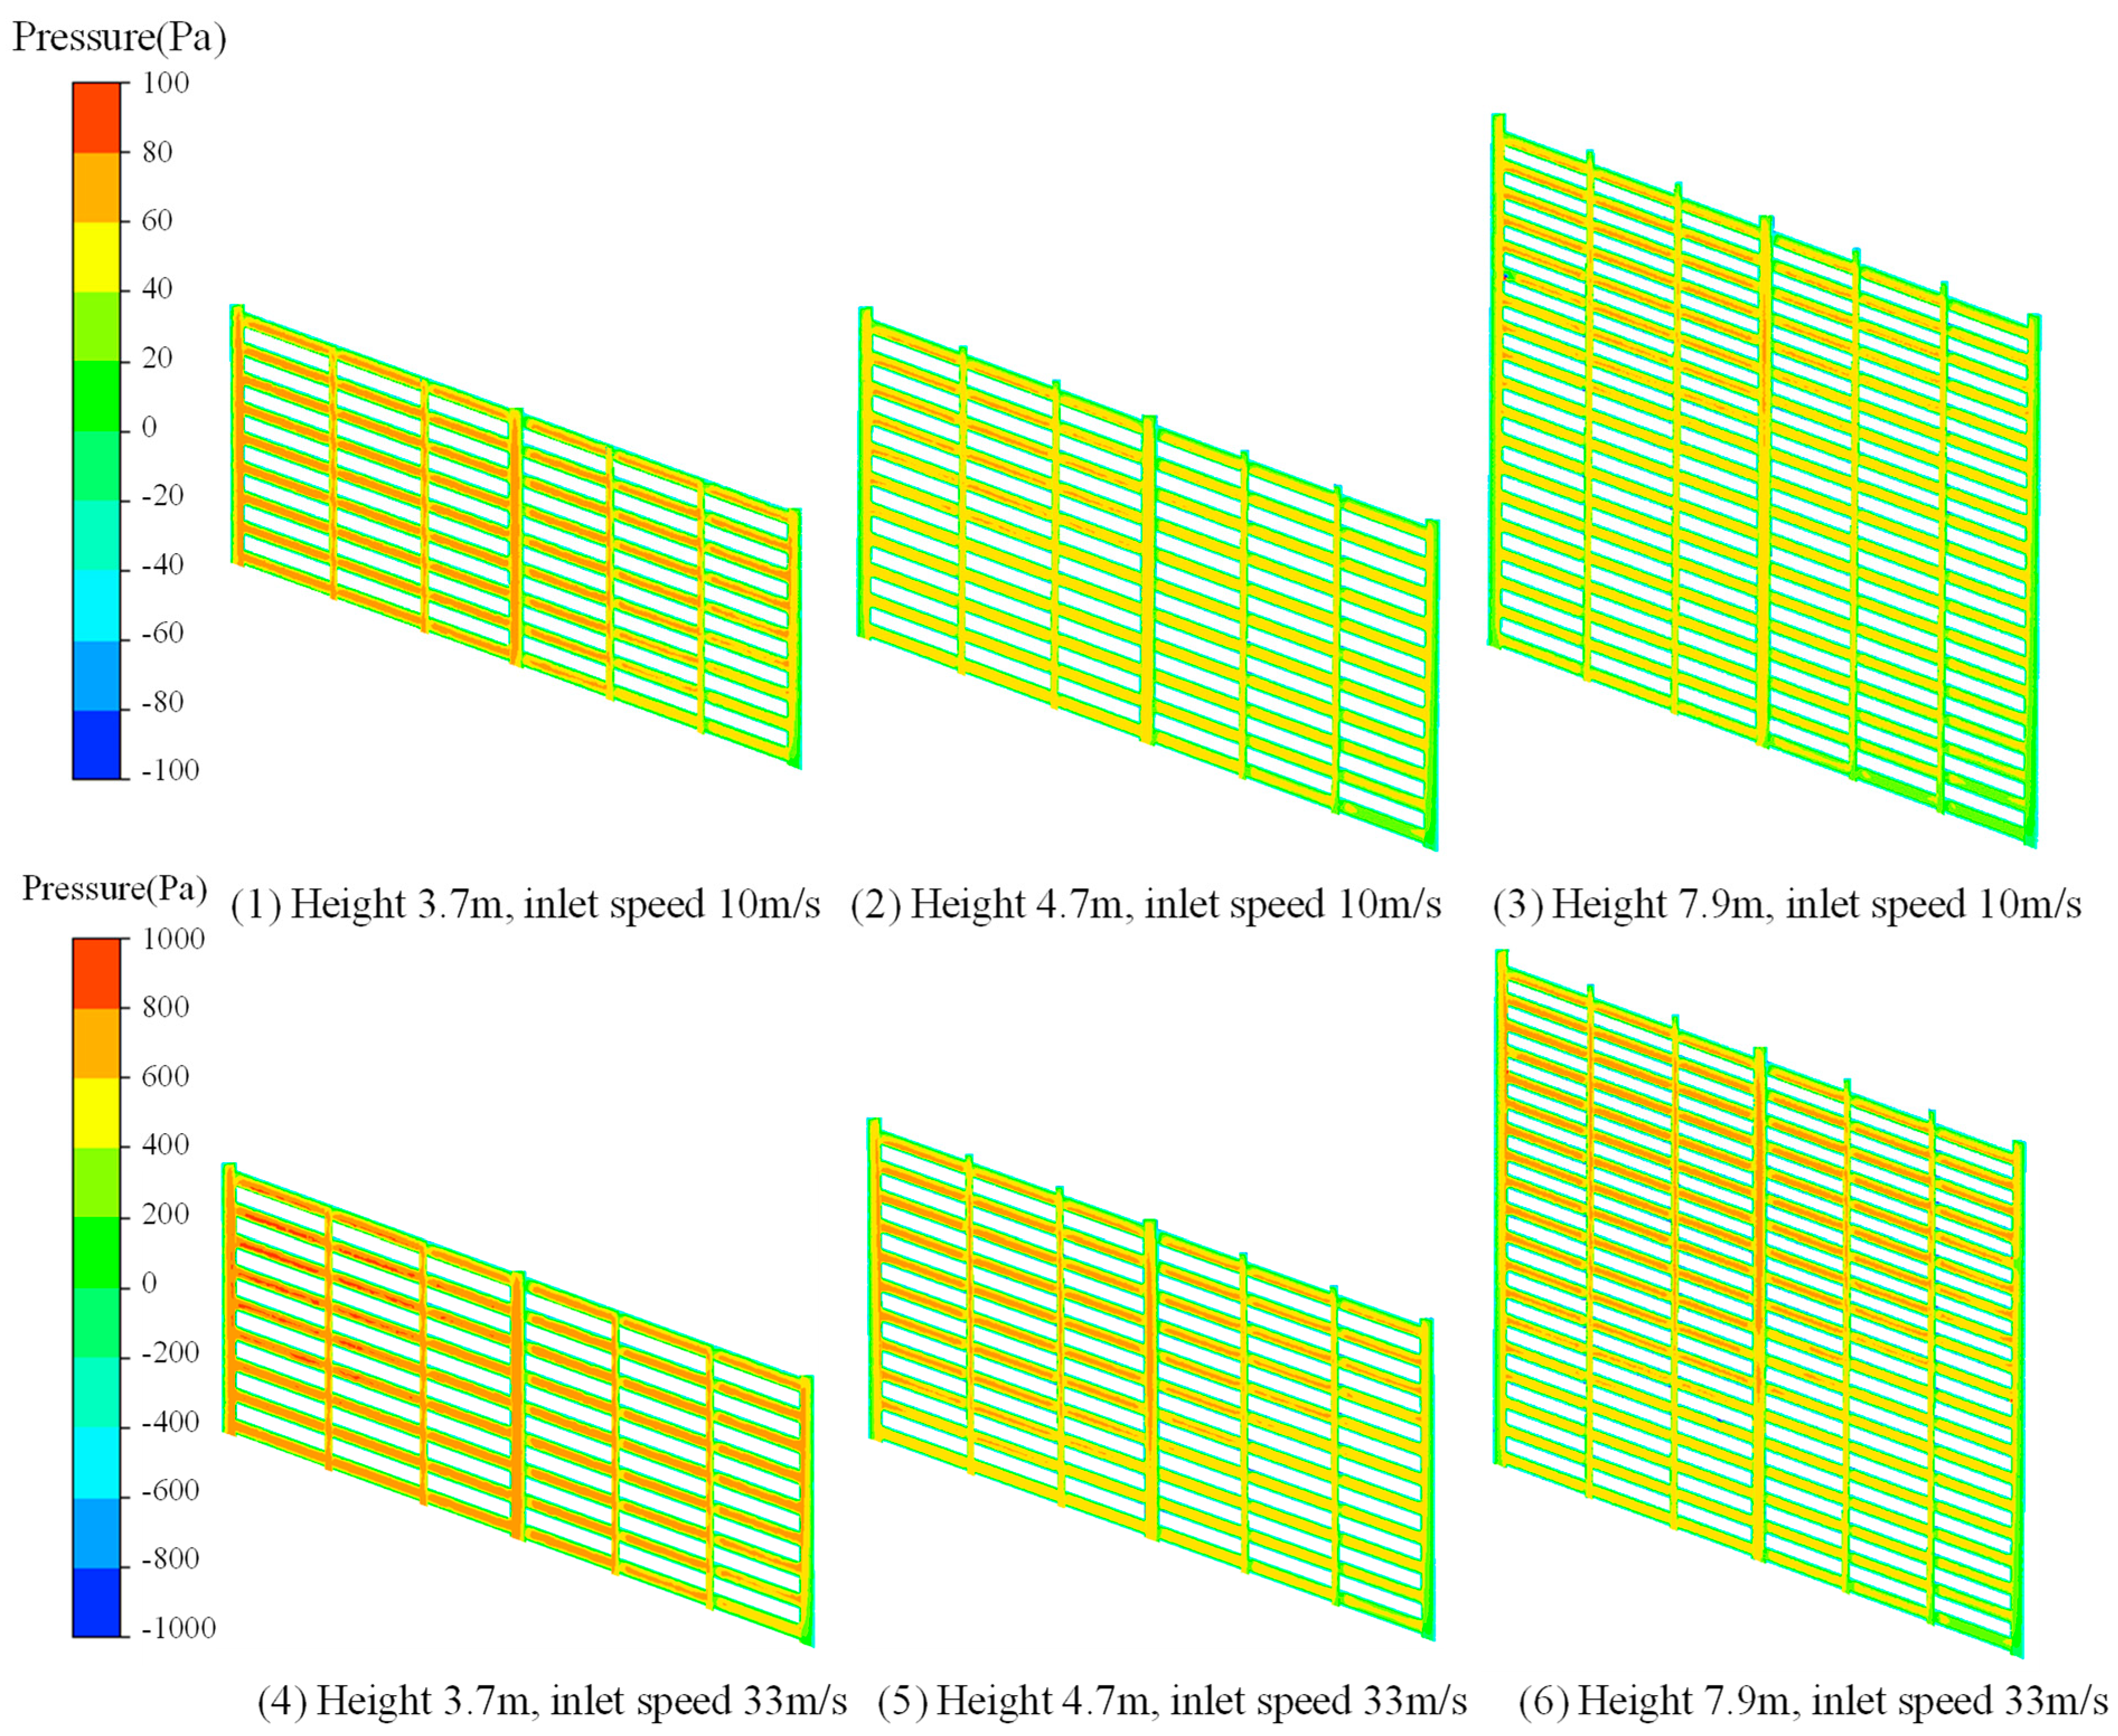
The main load on the windbreak is the wind load, so the magnitude of the incoming wind speed directly affects the load on the windbreak, and the wind load is an important parameter to be considered in the construction of the windbreak. According to the CFD simulation, the wind pressure at the inlet height of 3.7, 4.7 and 7.9 m high windbreak is 10 and 33 m/s, respectively, and the wind pressure distribution on the windward side of the windbreak is shown in Figure 11. The incoming wind is blocked by the windbreak, and some of the airflow acts directly on the windbreak, forming a positive pressure. Some of the air flow from the top around the windbreak, due to the circulation generated by the shear layer around the windbreak, forms a back wind vortex area. The wind direction of the airflow in the vortex region is opposite to the direction of the incoming wind, creating a suction force on the back side of the windbreak. The wind pressure gradually increases from low to high, and the wind pressure at the top of the fence is the largest. The greater the incoming wind speed, the greater the wind pressure on the windbreak; the maximum wind pressure on the windbreak is 80 and 850 Pa when the wind speed is 10 and 33 m/s, respectively.
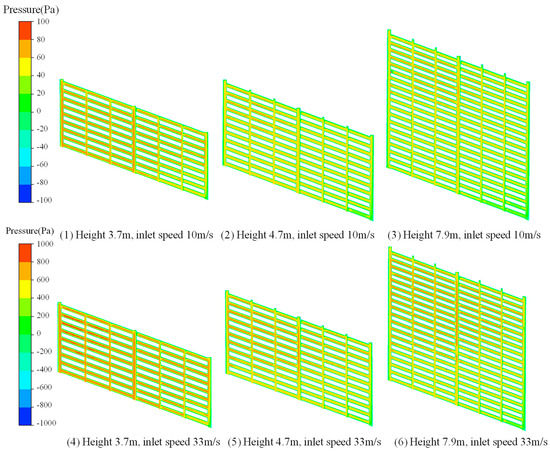
Figure 11.
Pressure cloud diagram of storm barrier.
3.4. Distribution of Equivalent Stress and Displacement of Windbreak Grid
Under the wind load, the stress at the bottom of the fence column is the highest, the stress on the upper part of the fence is higher, and the stress on the other areas is low. The higher the incoming wind speed, the higher the equivalent stress on the windbreak, and the higher the windbreak, the higher the equivalent stress on the windbreak. The maximum equivalent stress of 3.7, 4.7 and 7.9 m high windbreak is 5.58, 10.24 and 29.60 MPa, respectively, when the wind speed is 10 m/s at the inlet height of 10 m. The maximum equivalent stress of 3.7, 4.7 and 7.9 m high windbreak is 53.44, 100.78 and 302.96 MPa, respectively, when the wind speed is 33 m/s at the inlet height of 10 m. The steel used in the column is Q345 steel, whose yield strength is 345 MPa, and the equivalent stress on the windbreak does not exceed the yield strength of the steel column.
Under the wind load, the windbreak displacement distribution is shown in Figure 12. It can be seen that the displacement of the upper part of the windbreak is larger, and the displacement of the middle part is the largest. The displacement of the windbreak at different wind speeds varies for different heights. The maximum displacements of 3.7, 4.7 and 7.9 m high windbreak are 0.73, 1.63 and 9.50 mm, respectively, when the inlet wind speed is 10 m/s. The maximum displacements of 3.7, 4.7 and 7.9 m high windbreak are 7.78, 17.70 and 103.15 mm, respectively, when the inlet wind speed is 33 m/s. Under the action of average wind speed, the displacement of different height windbreak is small, while the displacement of the top of 7.9 m high windbreak under the action of maximum wind speed is as high as 103.15 mm, which indicates that the stability of 7.9 m high windbreak is lower under the action of maximum wind speed.
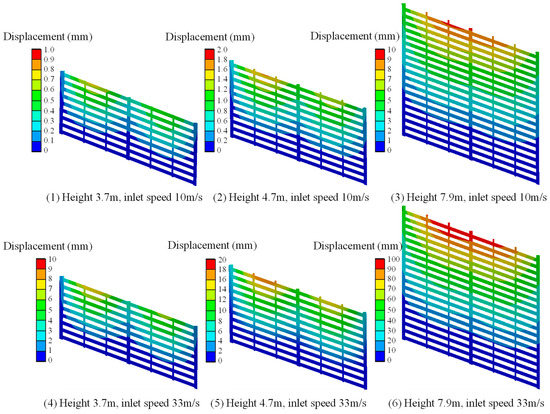
Figure 12.
Cloud diagram of storm fence displacement.
4. Conclusions
In this paper, numerical simulations of 3.7, 4.7 and 7.9 m high windbreaks are carried out. The flow field distribution characteristics, wind pressure and resulting stresses and displacements of the windbreak next to the alpine ski center snow track are determined. The specific conclusions are as follows:
- (1)
- It can be seen that when the wind speed at the entrance height of 10 m is 10 and 33 m/s, the maximum wind speed near the opening of the windbreak fence is as high as 15 and 50 m/s, respectively. The wind speed in most of the watershed after the fence is below 5 and 15 m/s, respectively, which is obviously lower than the incoming wind speed, and the wind protection effect is obvious;
- (2)
- The wind protection effect of the wind fence varies with different heights, and the wind protection effect of the 7.9 m high wind fence is better than the 3.7 m and 4.7 m high wind fences;
- (3)
- The wind pressure at the top of the fence is the highest, and the maximum wind pressure at the inlet height of 10 m is 80 and 850 Pa when the wind speed is 10 and 33 m/s, respectively;
- (4)
- The greater the incoming wind speed, the greater the equivalent force and displacement on the windbreak, and the higher the windbreak, the greater the equivalent force and displacement on the windbreak. Under the action of maximum wind speed, the stability of 7.9 m high windbreak is relatively low.
Author Contributions
Conceptualization, Q.L.; Methodology, Z.F.; Software, Z.F.; Validation, Z.F.; Formal analysis, Z.F.; Investigation, Z.F.; Resources, Q.L.; Data curation, Q.L.; Writing—original draft, Z.F.; Writing—review & editing, Q.L.; Supervision, Q.L.; Project administration, Q.L.; Funding acquisition, Q.L. All authors have read and agreed to the published version of the manuscript.
Funding
This research was funded by the National Natural Science Foundation of China, grant number 52274107 and the Interdisciplinary Research Project for Young Teachers of University of Science and Technology Beijing, grant number [FRF-IDRY-GD21-001]. The APC was funded by [FRF-IDRY-GD21-001].
Institutional Review Board Statement
Not applicable.
Informed Consent Statement
Not applicable.
Data Availability Statement
The data presented in this study are available on request from the corresponding author.
Conflicts of Interest
The authors declare no conflict of interest.
References
- Liu, Y.M.; Gui, L. Beijing 2022 Olympic and Paralympic Winter Games venue planning and layout. Beijing Plan. Rev. 2021, 197, 160–168. [Google Scholar]
- Liang, X.; Lu, J.Q.; Tan, Z.Y.; Li, H.; Gao, W.; Li, X.G. Leaning along mountains, painting Haituo swallows—On the design of National Alpine Skiing Center. Archit. J. 2021, 633, 83–91. [Google Scholar]
- Gillies, J.A.; Etyemezian, V.; Nikolich, G.; Glick, R.; Rowland, P.; Pesce, T.; Skinner, M. Effectiveness of an array of porous fences to reduce sand flux: Oceano Dunes, Oceano CA. J. Wind Eng. Ind. Aerodyn. 2017, 168, 247–259. [Google Scholar] [CrossRef]
- Park, C.W.; Lee, S.J. Experimental study on surface pressure and flow structure around a triangular prism located behind a porous fence. J. Wind Eng. Ind. Aerodyn. 2003, 91, 165–184. [Google Scholar] [CrossRef]
- Cong, X.C.; Cao, S.Q.; Chen, Z.L.; Peng, S.T.; Yang, S.L. Impact of the installation scenario of porous fences on wind-blown particle emission in open coal yards. Atmos. Environ. 2011, 45, 5247–5253. [Google Scholar] [CrossRef]
- Alhajraf, S. Computational fluid dynamic modeling of drifting particles at porous fences. Environ. Model. Softw. 2004, 19, 163–170. [Google Scholar] [CrossRef]
- Packwood, A.R. Flow through porous fences in thick boundary. J. Wind Eng. Ind. Aerodyn. 2000, 88, 75–90. [Google Scholar] [CrossRef]
- Nieto, P.G.; del Coz Díaz, J.J.; Castro-Fresno, D.; Muñoz, F.B. Numerical simulation of the performance of a snow fence with airfoil snow plates by FVM. J. Comput. Appl. Math. 2010, 234, 1200–1210. [Google Scholar] [CrossRef]
- Jiang, X.T.; Yin, Z.X.; Cui, H.B. Wind Tunnel Tests of Wind-Induced Snow Distribution for Cubes with Holes. Adv. Civ. Eng. 2019. [Google Scholar] [CrossRef]
- Bai, L.; Shen, A.Q.; Wei, Z.X. Comparison of in-situ observation effect of highway windbreak structures and simulation of installation optimization. J. Highw. Transp. Res. Dev. 2016, 33, 39–53. [Google Scholar]
- Xue, W.X. Research on the effect of the new windbreak engineering in the strong cross-wind section of the Baili wind area in Xinjiang. Highway 2014, 59, 202–206. [Google Scholar]
- Zhang, K.; Zhao, P.; Zhao, J.; Zhang, X. Protective effect of multi-row HDPE board sand fences: A wind tunnel study. Int. Soil Water Conserv. Res. 2021, 9, 103–115. [Google Scholar] [CrossRef]
- Alonso-Estébanez, A.; Díaz, J.D.C.; Rabanal, F.Á.; Pascual-Muñoz, P. Performance analysis of wind fence models when used for truck protection under crosswind through numerical modeling. J. Wind Eng. Ind. Aerodyn. 2017, 168, 20–31. [Google Scholar] [CrossRef]
- Mohebbi, M.; Rezvani, M.A. Analysis of the effects of lateral wind on a high-speed train on a double routed railway track with porous shelters. J. Wind Eng. Ind. Aerodyn. 2019, 184, 116–127. [Google Scholar] [CrossRef]
- Telenta, M.; Duhovnik, J.; Kosel, F.; Šajn, V. Numerical and experimental study of the flow through a geometrically accurate porous wind barrier model. J. Wind Eng. Ind. Aerodyn. 2014, 124, 99–108. [Google Scholar] [CrossRef]
- Dong, G.N.; Chen, T.G.; Ren, C.J.; Wang, K. Wind tunnel investigation of wind reduction effect under porous fences protection. J. Wind Eng. Ind. Aerodyn. 2023, 232, 105250. [Google Scholar] [CrossRef]
- Wu, X.; Guo, Z.; Wang, R.; Fan, P.; Xiang, H.; Zou, X.; Yin, J.; Fang, H. Optimal design for wind fence based on 3D numerical simulation. Agric. For. Meteorol. 2022, 323, 109072. [Google Scholar] [CrossRef]
- Li, K.; Liang, X.F.; Yang, M.Z. Anti-wind aerodynamic performance of high-speed train and wind-break wall optimization. J. Cent. South Univ. Sci. Technol. 2018, 49, 1297–1305. [Google Scholar]
- Zhang, J.; Zhang, M.; Huang, B.; Li, Y.; Yu, J.; Jiang, F. Wind Tunnel Test on Local Wind Field around the Bridge Tower of a Truss Girder. Adv. Civ. Eng. 2021, 2021, 1–13. [Google Scholar] [CrossRef]
- Dong, Z.; Luo, W.; Qian, G.; Wang, H. A wind tunnel simulation of the mean velocity fields behind upright porous fences. Agric. For. Meteorol. 2007, 146, 82–93. [Google Scholar] [CrossRef]
- Li, B.; Yang, Q.S.; Feng, S.H. Windbreak performance of wind fence on high speed train based on numerical simulation. Eng. Mech. 2015, 32, 249–256. [Google Scholar]
- Chen, T.G.; Ma, S.M. Three-dimensional numerical simulation of flow field behind porous fence with different section. Comput. Simul. 2014, 31, 258–263. [Google Scholar]
- Chen, G.; Wang, W.; Sun, C.; Li, J. 3D numerical simulation of wind flow behind a new porous fence. Powder Technol. 2012, 230, 118–126. [Google Scholar] [CrossRef]
- Chen, G.H.; Duan, J.H.; Li, J.L. Numerical simulation of influence of the porosity on the dust suppression of deflector-porous fence. J. Chem. Eng. Chin. Univ. 2013, 27, 773–778. [Google Scholar]
- Chen, G.H.; Bai, X.H.; Li, J.L. Mechanical characteristics analysis of deflector-porous fence. CIESC J. 2015, 66, 3685–3691. [Google Scholar]
- Zang, Z.G.; Guo, W.; Bai, X.T. Winter ground wind field characteristic in the Haituo Mountain division for the 24th Winter Olympic Games. J. Arid Meteorol. 2017, 35, 433–438. [Google Scholar]
- Wu, R.; Wang, J.; Sun, J.; Huang, L.; Sun, J. An observational investigation of fine features of near surface winds in winter over Beijing area. Acta Meteorol. Sin. 2019, 77, 1107–1123. [Google Scholar]
- GB50009-2012[S]; Building Structure Load Specification. Ministry of Housing and Urban-Rural Development of the People’s Republic of China. China Architecture and Building Press: Beijing, China, 2012.
- DB11T 825-2021[S]; Assessment Standard for Green Building. Beijing Housing and Urban-Rural Construction Committee: Beijing, China, 2021.
- Li, Z.W.; Zhang, M.Q.; Chen, H.Z.; Cheng, P.F.; Lin, B.R.; Cao, B. CFD-based design method of airflow prevention device in core area of ski jumping event in Winter Olympics. Heat. Vent. Air Cond. 2021, 51, 47–57. [Google Scholar]


Disclaimer/Publisher’s Note: The statements, opinions and data contained in all publications are solely those of the individual author(s) and contributor(s) and not of MDPI and/or the editor(s). MDPI and/or the editor(s) disclaim responsibility for any injury to people or property resulting from any ideas, methods, instructions or products referred to in the content. |
© 2023 by the authors. Licensee MDPI, Basel, Switzerland. This article is an open access article distributed under the terms and conditions of the Creative Commons Attribution (CC BY) license (https://creativecommons.org/licenses/by/4.0/).