Article

Cost and Heat Integration Analysis for CO2 Removal Using Imidazolium-Based Ionic Liquid-ASPEN PLUS Modelling Study

Department of Chemical Engineering, College of Engineering, Qatar University, Doha P.O. Box 2713, Qatar
*
Author to whom correspondence should be addressed.
Sustainability 2023, 15(4), 3370; https://doi.org/10.3390/su15043370
Submission received: 25 November 2022 / Revised: 31 January 2023 / Accepted: 9 February 2023 / Published: 12 February 2023

Abstract

:
The recent advancement in efficient and recoverable CO2 capture solvents has been stimulated by the environmental harm resulting from the accumulation of greenhouse gases. Ionic liquids (ILs) and IL-based solvents have given rise to a novel method of CO2 collection that is highly efficient, economical, and environmentally benign. However, there is a lack of knowledge about the implementation of this process on a wider scale, and it has limitations, including high solvent costs. This simulated study shows that [EMIM][NTF2] can remove up to 99.4% of the CO2 from industrial waste effluents using three distinct compositions. Following an economic study using a 20-year plant life estimate, with a plant capacity of 4000 kg/h (206.165 kmol/h) for the raw mixed stream flow (inlet) and a maximum CO2 capacity of 38.1 kmol/h, it was determined that the process’s overall annualized cost was USD 2.1 million with operating expenses being USD 1.8 million. The Aspen Activated Energy Analysis’s recommendation of adding a heat exchanger, with a payback year of 0.0586 years, a 23.34 m2 area, and potential energy cost savings of USD 340,182/Year was also implemented successfully. These findings propose a conceptual framework for the development of novel ionic liquids for CO2 capture. It also demonstrates that sustainable [EMIM][Tf2N]-based absorption techniques for CO2 capture have the potential to be an industrial technology.

1. Introduction

Emissions of carbon dioxide are progressively a major matter of concern all around the world [1,2,3]. According to S. Wang, Li et al. [4], global emissions from the combustion of fossil fuels reached nearly 33 billion tons in 2011, with economic development, urbanization, and energy usage as the major factors influencing the rise in emissions in both high and low-income countries. A study undertaken in Europe reported that global warming would lead to a significant increase in cold weather moisture levels of up to 15% by the mid-2030s and 25% by the middle of this century [5]. As the dominant greenhouse gas, carbon dioxide levels in the atmosphere rise, it leads to elevated air pollution and global warming all around the world. The top six nations in terms of CO2 emissions in 2014 are depicted in Figure 1 below [6]. It demonstrates that the largest CO2 emitters—China, USA, India, Russia, Japan, and Germany—were responsible for a significant portion of the global warming rise. These nations were directly responsible for almost 60% of the world’s CO2 emissions, with China leading the pack and the United States coming in second. Additionally, it demonstrates that the established nations of Japan and Germany produced fewer carbon emissions than the emerging nations of India and Russia; however, they were still quite high when compared with the rest of the countries around the globe, and that placed them in the top six. The Paris Agreement (PA), which established strategies for combating climate change after 2020, was approved at the Paris Conference on Climate Change in December 2015. The PA’s long-term mission is to keep the growth in the world’s mean temperature to less than 2 °C rise, preferably less than 1.5 degrees Celsius [7]. To fulfill this 1.5 °C target, carbon emissions must decrease by 7.6% each year between 2020 and 2030; in order to achieve the specific 2 °C benchmark, carbon emissions must drop by 2.7% per year between 2020 and 2030 [8]. As a result, finding a suitable technology to manage and reduce CO2 emissions from anthropogenic sources is critical from both an environmental and economic standpoint [9]. Hence, renewable power sources that can mitigate CO2 emissions, such as solar, wind, and hydropower, are some long-term alternatives to fossil fuels. Another useful possibility is to recycle and produce valuable products from the captured carbon dioxide, such as the manufacture of polymers, fertilizers, cosmetics, and different chemicals [10,11]. The complex and interconnected issues of the modern era can be resolved by converting good quality CO2, the primary greenhouse gas, into value-added goods. With its conversion, we may lessen our reliance on old-fashioned fossil fuels and more effectively combat global warming. The scientific community and technologists are now under an obligation to investigate and create innovative solutions that may be effective for regulating and lowering the atmospheric level of CO2 due to the necessity to minimize CO2 emissions from the environment. Different uses for this captured CO2 emerge, including using it as a carbon source in industrial operations or burying it in coal beds, oil wells, and other geological formations [12]. Since present capture methods are not particularly efficient in removing highly pure CO2 from significant sources of combustion, it is obvious that new technologies must be created or that current ones must be improved [13].
To date, many technologies have been introduced and various studies have been conducted to improve the separation and mitigation of CO2 emissions from the industries expounded above to preserve and keep climate change stable [14]. These technologies include physical and chemical absorption, adsorption, membrane separation, hydrates separation, and cryogenic distillation techniques [15,16]. Table 1 below demonstrates these different methods with their benefits and drawbacks. The most common technologies used for acid gas removal, such as CO2 in the case of this study, are adsorption and absorption, verified by Dalane, Dai et al. [17]. However, the adsorption technologies currently available may not be satisfactory for use as a large-scale treatment for gases. The limited adsorption efficiency of most available adsorbents may play a prominent part in the challenges and problems that arise at this level. Furthermore, due to the low selectivity of the most available adsorbents, the gas streams to be treated should have high CO2 quantities [18]. Furthermore, it is also concluded that since CO2 is a corrosive and acidic gas and can easily cause hydrates upon decreasing the temperature, it can cause excessive damage to the distillation columns and membranes. The absorption process, even with low compositions, provides high selectivity with high efficiency that is greater than 90%, as reported by Mansourizadeh, Ismail et al. [19].
Ionic liquids (ILs), one of the emerging CO2 capture technologies, have drawn a lot of interest lately due to their extraordinary potential for extracting CO2 from emissions produced by industry [46,47,48,49]. There are already various manufactured ionic liquids with a wide range of attributes that emerge from anion–cation pair variations. Thermal stability, low vapor pressure, and strong polarity are just a few of the qualities that make ionic liquids appealing for CO2 removal [50]. The non-volatile and environment-friendly nature of ILs has been revealed to be one of the basic properties required to successfully capture CO2 with less energy usage than typical amine scrubbing absorbent materials [51].
[TF2N]--containing ILs tend to show a significant CO2 solubility. The immense size of the [TF2N] anion may explain the high CO2 solubility. [TF2N]--containing ILs have also shown reduced viscosity relative to other ILs and are capable of dissolving large CO2 concentrations [52,53]. Considering the current literature survey, ILs have emerged as potential absorption solvents for CO2 capture in recent years. Combining statistical approaches to approximate the properties of ILs and their related mixtures with process simulation software is an economical approach at the current state of the art [54,55]. Various process simulations have been conducted for CO2 capture to interpret the lab-scale experiments done before and to make comprehensive remarks on the performance of the system [56], and abundant process simulations have been reported to capture CO2 using ionic liquids in the literature. Shiflett, Drew et al. [57] performed an Aspen Plus simulation using the absorption of 1-butyl-3-methylimidazolium acetate [bmim][Ac] and MEA(Monoethanolamine) from flue gas. It was reported that both of these cases gave a high CO2 purity (>95%); however, using this ionic liquid reduced the energy utilization by 16%. Khonkaen, Siemanond et al. [58] used ([emim][Ac]) to separate 90% CO2 from flue gas with −38 kJ/mol heat of CO2 absorption. Amiri, Lounis et al. [59] used [hmim][TCB] and reported that the energy requirements for this solvent are almost 16% less compared with the DEPG process and that it is an excellent absorbent because of its environmentally friendly properties. According to another simulation, CO2 capture using the [bmim][Ac] process may minimize the loss in energy, IL operational expenditures, and equipment footprints by 16%, 11%, and 12%, respectively, when compared with a frequently used MEA (monoethanolamine) approach [57]. Similarly, Xie, Björkmalm et al. [60] assessed three prospective ILs and performed a techno-economic study on them. The ionic liquid used was [bmim][TF2N], aq. ChCl/Urea and aq. [Amim][HCOO]. According to the economic analysis of [Amim][HCOO], the yearly maintenance and operational cost was USD 260,000, whereas the annual capital cost was found to be around USD 116,000. Despite the high CO2 capture capacity, several obstacles and shortcomings must still be tackled for ionic liquids. For example, ionic liquids have a high viscosity and solvent price that consequently affect energy consumption and manufacturing costs [61].
Regardless of the high affinity of ILs for CO2, there are significant restrictions to resolve before this approach can be used on a broad scale. For example, ILs have significant solvent rates and viscosity, which raises pump manufacturing costs and energy consumption. To the fullest extent possible, researchers and technical staff must pay close attention to these technological and economic issues [61,62]. Consequently, despite being one of the prominent absorbents in the market currently, energy and cost-related issues necessitate a specific focus on the part of researchers and specialists in order to effectively and efficiently utilize their capabilities and strengths in order to commercialize them. To select the most reliable and promising IL, several studies were reviewed from the literature. Shaahmadi et al. (2020) [63] used ionic liquids [Bmim][Ac] and [Bmim][BF4] to check CO2/CH4 combination solubilities in these ions, and it was concluded that [Bmim][Ac] performed better for the absorption of this mixture compared with [Bmim][BF4]. Ramdin de Loos et al. (2012) [64] discussed different experimental data available for CO2 capture from flue gas and its solubility in different ionic liquids. Ten different ionic liquids were compared, and it was concluded that the EMIM (TF2N) alkyl chain had the highest CO2 solubility compared with BMIM (BF4, TFO, methide, PF6, TF2N), OMIM (TF2N), and HMIM (TF2N). The authors conducted a comprehensive comparison between ionic liquids and other physical absorption commercially available methods and concluded that ionic liquids have a CO2 solubility greater than 2.5, and they can be used in the areas where physical solvents cannot be used in. Furthermore, it was demonstrated that since ionic liquids are still an emerging technology, a lot of physical and chemical properties of ionic liquids are lacking in the literature. Additionally, it was stated that this subject needs to be studied since it lacks recyclability, lab-pilot plant, cost, energy, and safety studies. A study by Kortenbruck et al. (2012) [65] concluded that EMIMNTF2 could be efficiently used for absorption processes for CO2 capture, and this claim was further supported by Giammancoet al. (2016) [66], who explained that this absorbent is a widely studied ionic liquid that has high CO2 solubility and is thermally stable. So conclusively, EMIMNTF2 was selected as the final absorbent to be used in this simulation study.
The aforementioned analysis reveals that although the IL EMIMNTF2 has a promising potential to uptake CO2 from gas streams, the developed affinity, cost, and energy demand under a wide range of operational conditions should be confirmed. Therefore, the present study aims at investigating the capability of CO2 capture from industrial waste streams (with high CH4 content) using the IL EMIMNTF2 [1-ethyl-3-methyl-imidizolium bis[(trifluoromethyl)sulfonyl] amide]. The potential of EMIMNTF2 to uptake CO2 from streams with high CH4 content and corresponding stream purities is established. The techno-economic aspects of such technology in terms of cost and energy savings and required unit operations are explored and discussed. Additionally, optimal design, waste heat recovery, process optimization, and energy saving are included to achieve high profitability.

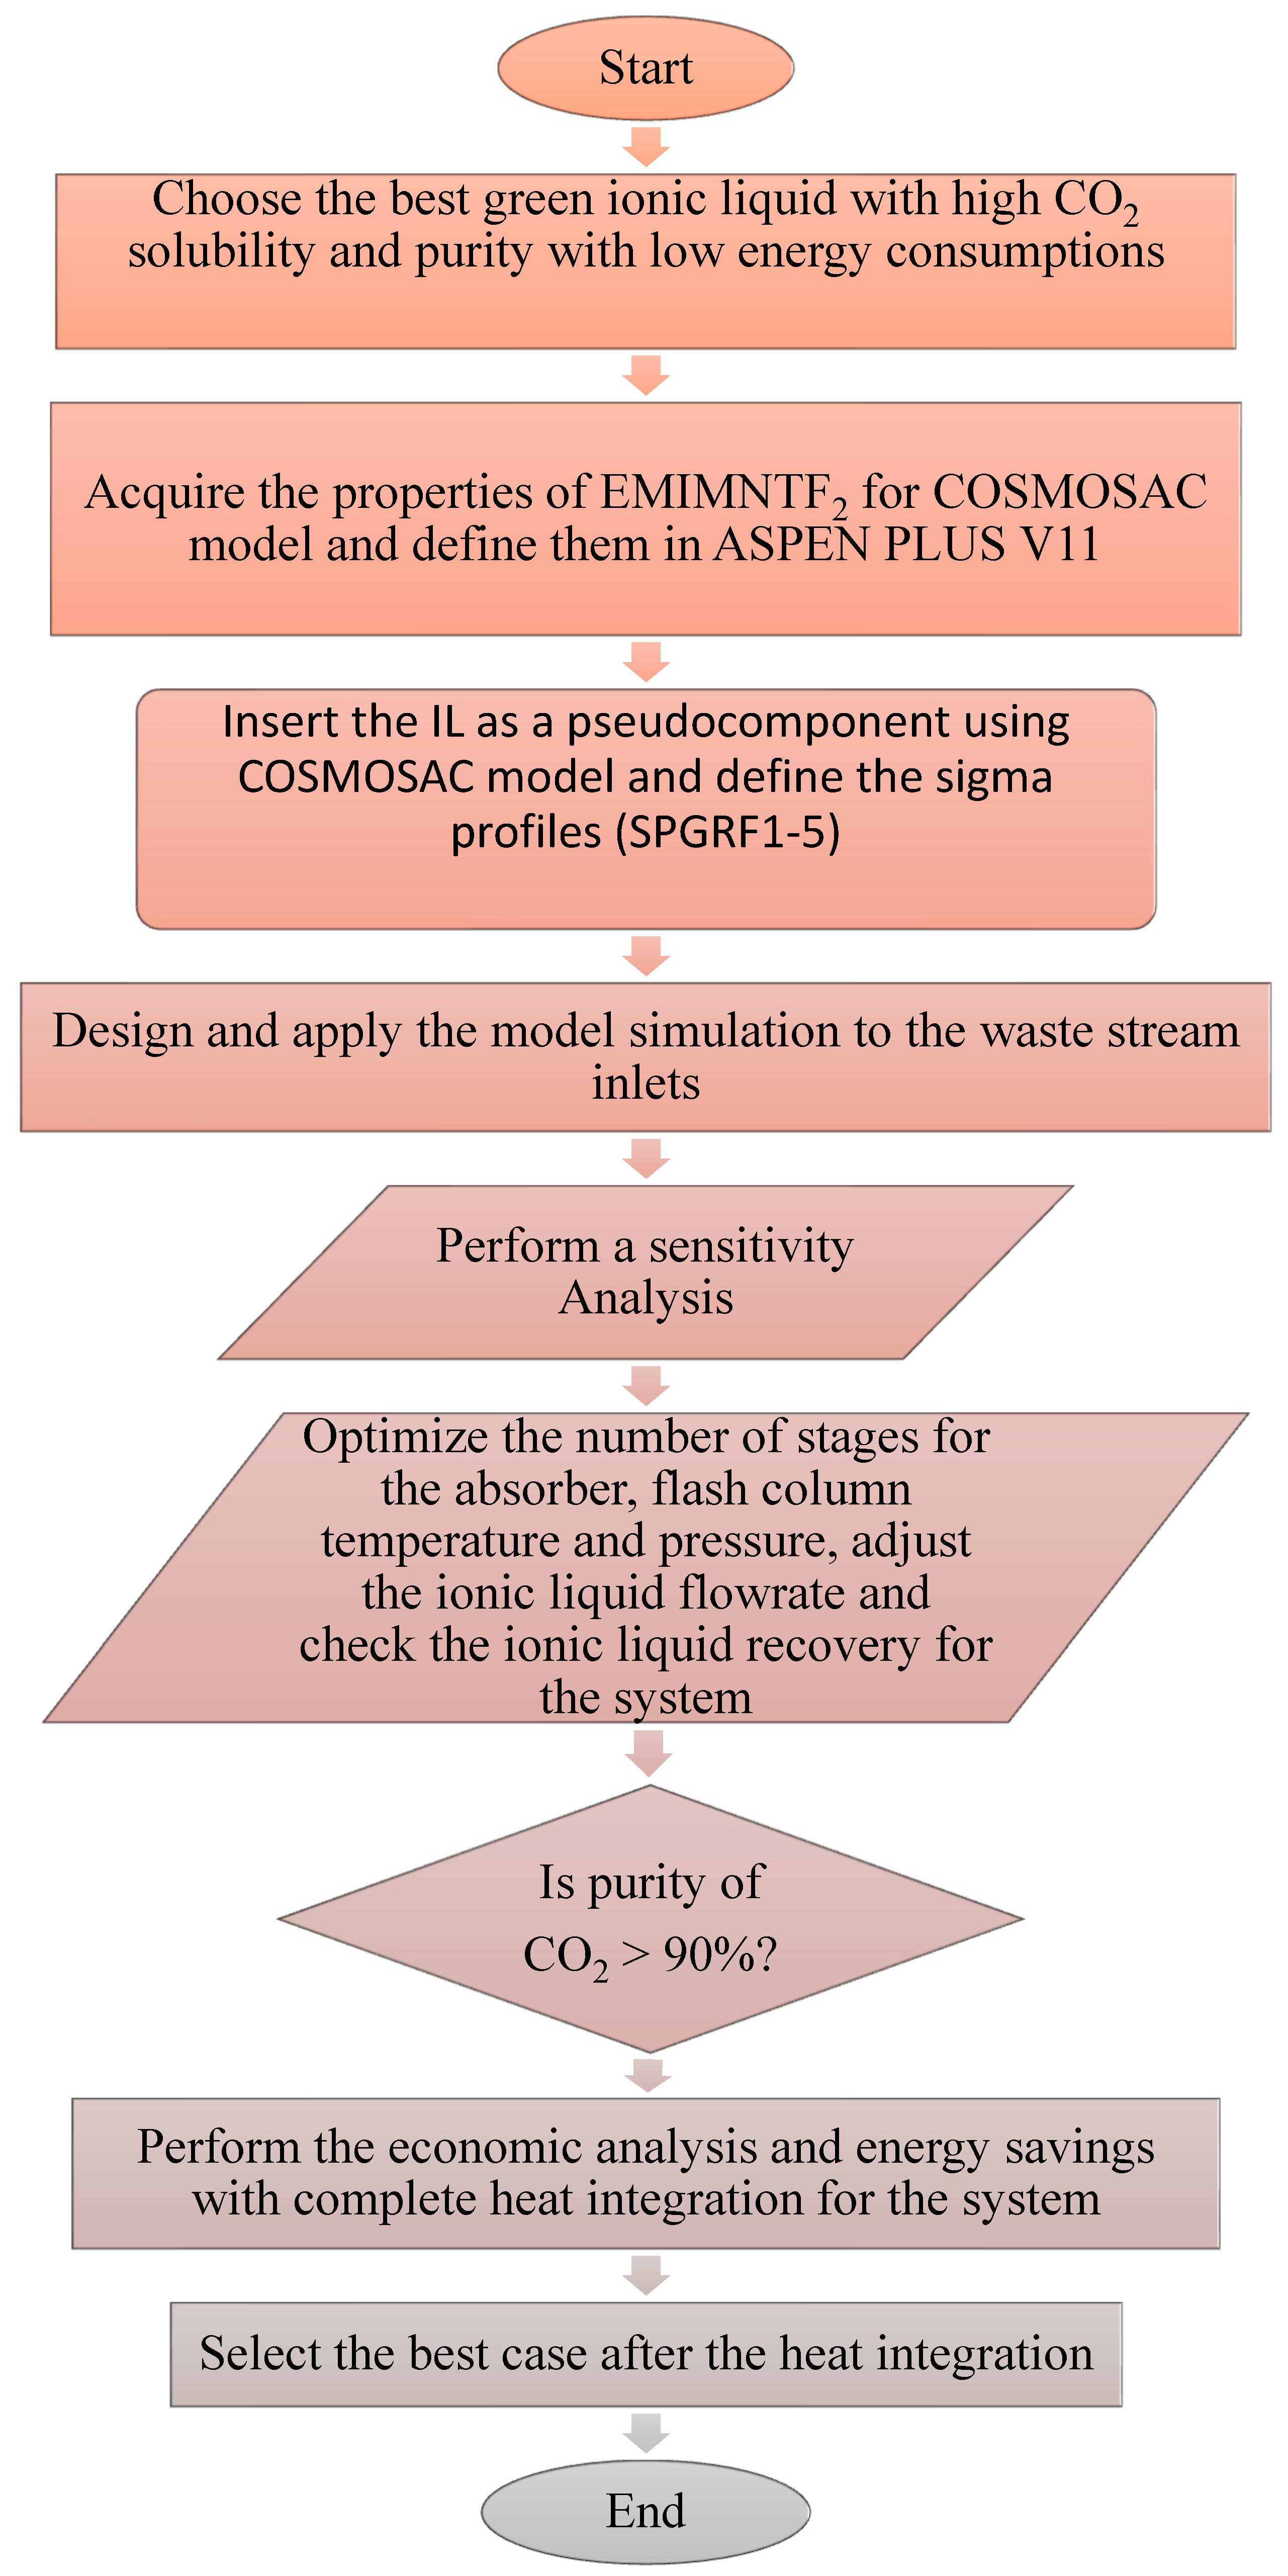
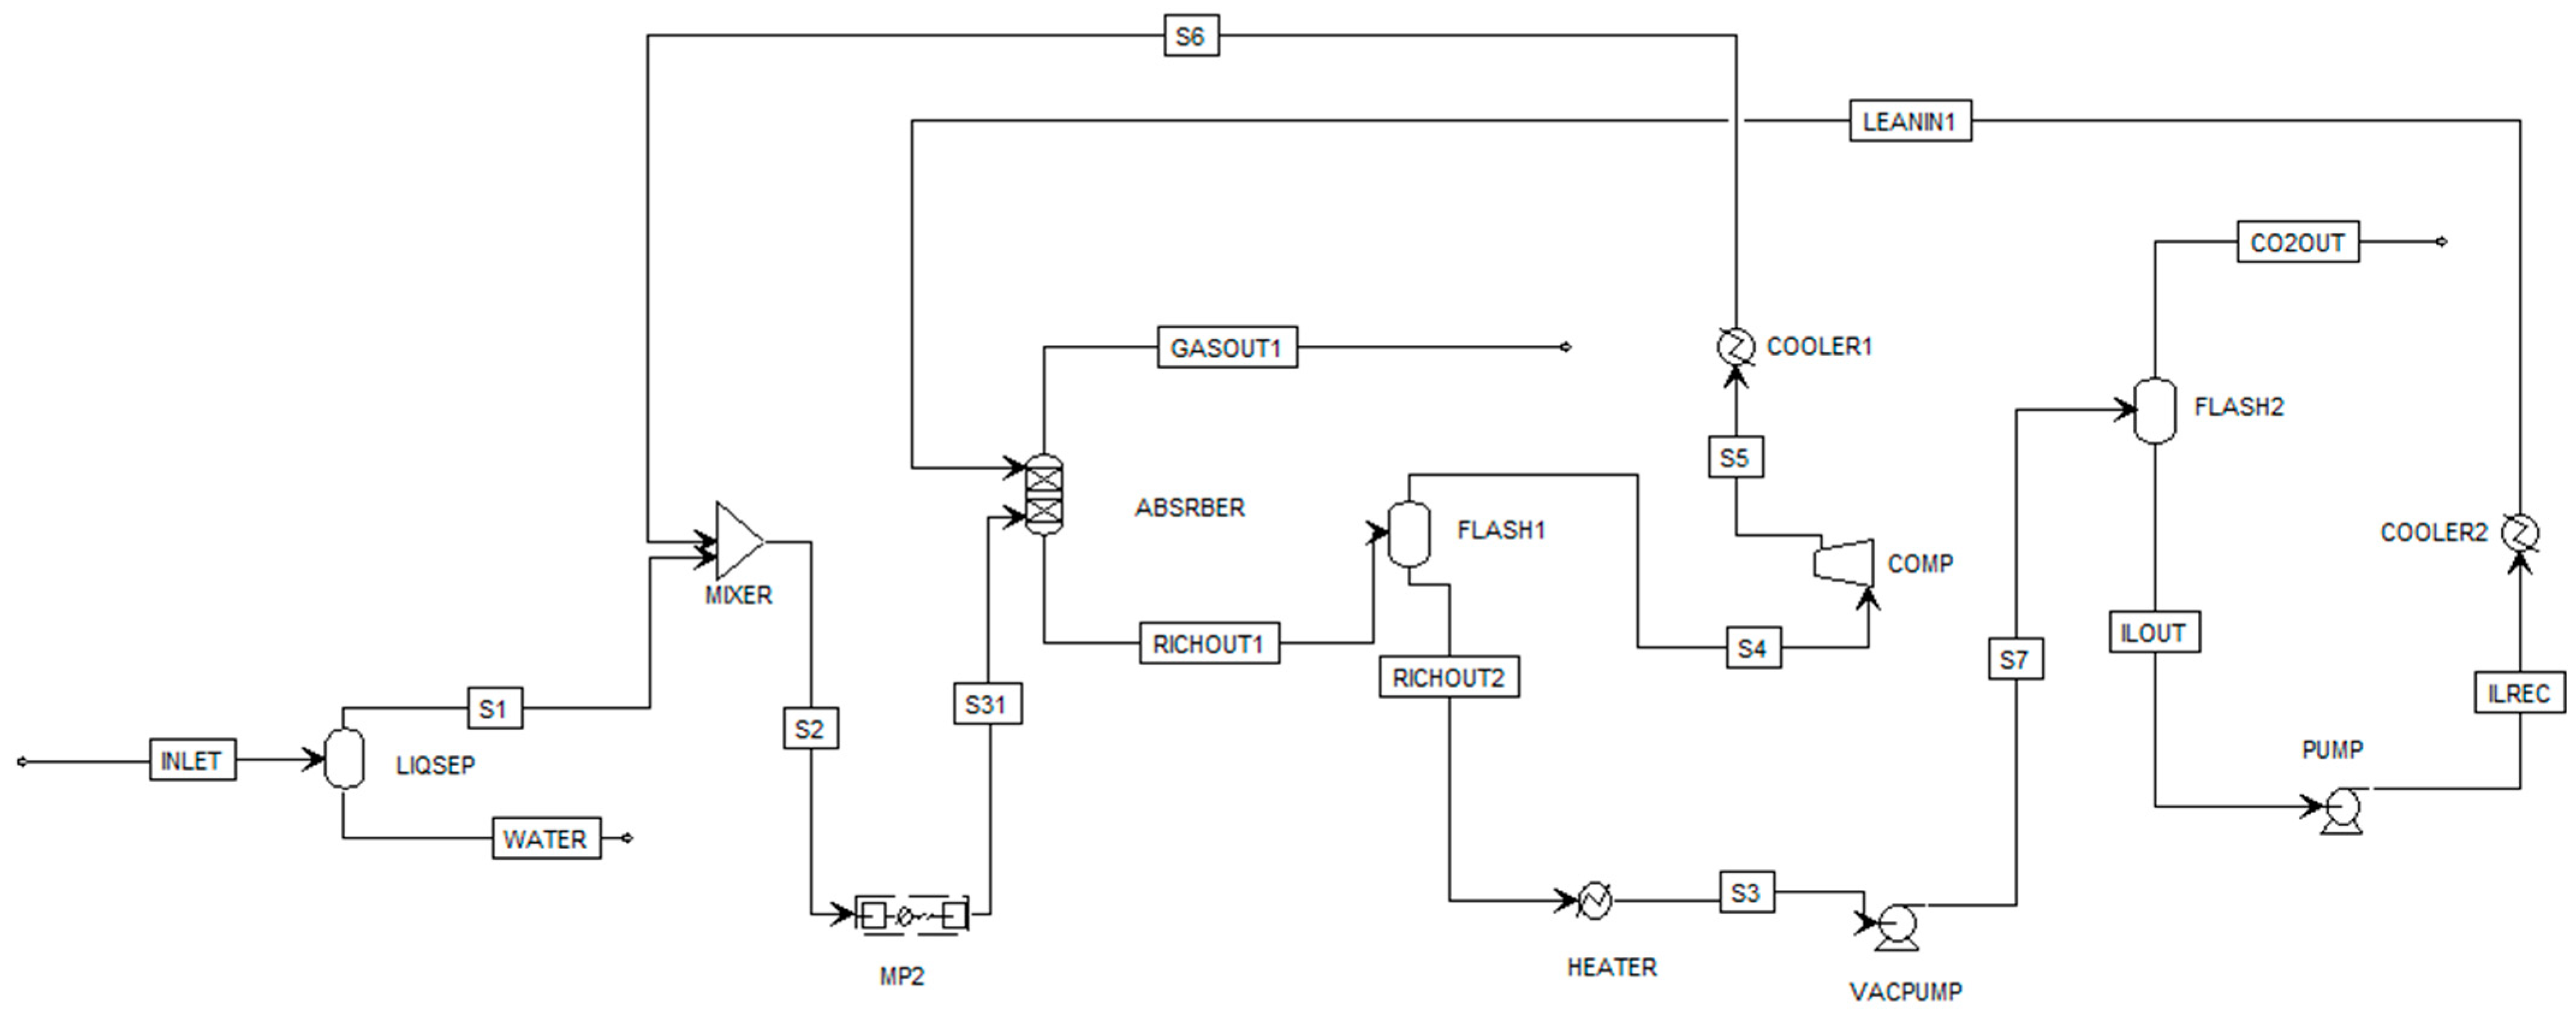
2. Modelling and Validation of CO2 Capture on Aspen Plus

This simulation employs an advanced CO2 capture process, which includes a gas-liquid separator, absorber, two flash tanks, a dryer, a mixer, pumps, compressors, and coolers. IL EMIMNTF2 with a molecular weight (MW) of 391.31 g/mol was used as the absorbent in the absorption tower for CO2 absorption [67]. EMIMNTF2 is stated to be an excellent absorbent for capturing CO2, as stated by Li et al., who used this absorbent to separate CO2 from power plants using the NRTL model in Aspen Plus [68]. Figure 2 shows the overall optimization approach applied in this study. The study started by exploring different ILs and selecting the best green ionic liquid with high CO2 solubility and low energy requirements. Then, the properties of the selected IL (EMIMNTF2 in this study) were identified, and then the appropriate IL was used to study the CO2 uptake. Optimized conditions were identified based on cost, energy, and uptake capacity.
Figure 3 depicts the ASPEN Plus model used to simulate the physical absorption of CO2 by utilizing IL. ASPEN Plus has been used by experts in the field to study the CO2 absorption and desorption processes in several feasibility studies [69,70]. The property model used for this study was COSMOSAC. This model rapidly gives pertinent information on gas–liquid interactions without having to rely on binary interaction parameters or experimental data, making it a reliable provisional tool for quick screening and configuration of ILs for CO2 extraction [71,72]. In contrast to other activity coefficient models, such as UNIFAC or UNIQUAC, the key components for phase equilibria are individual atoms rather than functional groups. As a result, the COSMOSAC model is more adaptable since it can be used to simulate a larger variety of systems, including complex molecules, such as the ILs that were the subject of this investigation and are not included in the Aspen Plus database. More particulars regarding the model and how the input parameters are found in a study done by García-Gutiérrez, Jacquemin et al. [73] and are given in the Supplementary Data (Table S2). First of all, to eliminate any potential water residue, the INLETGAS stream approaches the Flash Separator to remove the water content from the inlet streams; the pressure is the same as the inlet stream (15 bar), and the temperature is specified to be 20 Celsius. The separator is used to eliminate the water content from the bottom. The dry industrial waste gas stream (S1) then passes a mixer, where it is blended with a stream that recirculates through Flash-1 and contains traces of CO2 and CH4 that are not completely absorbed in the absorption column. Following that, a three-stage multistage compressor compresses and cools the mixed stream (S2) to 18 bar and 313.15 K before directing it into an absorber. Stream S6 from the cooler, when mixed using a mixture with stream S1 (15 bar, 20 °C) would cause the mixed stream to be at (20 °C and 15 bar); the three-stage compressor is required here to increase the pressure of the stream to 18 bars and 313.15 K that will be fed to the column. Because of these pressure and temperature differences, in order for the mixture to be at a regulated temperature and pressure, we are using a multistage compressor. Gas temperature can be controlled via multistage compressors. The output gas has a regulated temperature because they cool the gas as it moves between each chamber; hence, the multistage compressor is a good choice to be used, especially when there is a difference in temperature and pressure of the two mixed streams. The main specification entered into the unit was to regulate the temperature to 40 °C with an intercooler because there are two streams being mixed before the compressor, so in order to regulate the temperature before going to the absorber, multistage is preferable in this scenario. Further to this, the flowrate in stream S6 entering the mixer is quite low (9 kg/h), and stream S1 is 3953.95 kg/h so in order to regulate the flowrate and increase them to 4500 kg/h which is our inlet flowrate to the absorber we are using a multi—stage compressor. The main absorption tower is then fed the compressed and dehydrated input stream (S31), where the gas interacts with the IL from the LEANIN1 stream at 30 °C and 20 bar counter-currently and is absorbed in 20 stages at 15 bars which was the optimum value for high purity. The purified gas, primarily CH4 with certain contaminants such (H2S, N2, etc.), exits the absorption tower’s top (GASOUT1). The CO2-enriched solvent is introduced into Flash-1, where the flash’s generated gas is recycled to the mixer, and then it is transferred to Flash-2 to separate CO2 and ILs. Since the operating pressure of Flash-2 is 0.04 bar, we use a vacuum pump (details in the Supplementary Data) [74,75] to reduce the pressure from 2 bars to 0.04 bars. Afterwards, the IL is recirculated at 20 bars and 303.15 K absorption column for continuous absorption.
Table 2 defines the major operating conditions used for each equipment in this process simulation. This process starts with the INLETGAS stream from industrial wastes with composition and conditions described in Table 3. Table 4 demonstrates the Inlet parameters considered for the input streams. These Inlet conditions in Table 4 were predicted precisely according to the temperature and pressure ranges present for major gases exiting in the waste streams, such as CO2 and CH4 according to [76,77,78], with a presumed flowrate of 4000 kg/h since this flowrate was suitable according to the temperature and pressure specified in the simulation. Out of total seven streams tested; three streams gave the best results with high CO2 purity hence those three streams are addressed in this study. The flowrate of ionic liquid is kept at 20,000 kg/h for the streams to achieve high purity content of CO2.

3. Results and Discussion

3.1. CO2 Purity Results

After implementing ionic liquids to absorb CO2 from the previously defined streams, the first step is to figure out the gas purity being emitted. Table 5 below represents compositions of from some industrial waste streams with CO2 and CH4 removal efficiencies and compares them with this study. This work shows some of the utmost purity values using [EMIM][NTF2] as the ionic liquid that signifies that this ionic liquid is one of the most suitable IL to capture CO2 with high purity values for different compositions of waste industrial streams. The compositions varied for CH4, CO2, and N2 with traces of H2S and H2O in all the three streams and the process was tested out for each of them. All the streams successfully separated CO2 from the mixtures with high purity values reaching up to 99.4% CO2 rich stream after the absorption. This demonstrates that the process used in the study is successfully not only capturing CO2 using IL but also CH4 and impurities up to 99% such as H2S, CO and N2 (used in minute quantities for Stream 3) that come out from the top of the absorber can later be used in variety of applications such as fuels. Similar techniques for capturing CO2 using ionic liquids have been attempted by various authors, and much research for different types of industrial waste have disclosed the CO2 purity outcomes upon absorption. Rashid [79] and Shiflett, Drew et al. [57] tested ([Bmim][Ac]) for a coal-fired powerplant waste stream and found out that their process provides a CO2 purity of 98.7%. Kazmi, B. et al. [80] found out that absorption with pyridinium functionalized ionic liquids for natural gas sweetening process yielded a CO2 and CH4 purity ≥ 99%. Hospital-Benito and Lemus et al. [81] utilized [P2228][CNPyr] to remove carbon dioxide from raw synthesis gas to provide an usable H2-rich product stream. Haider, J. et al. [82] compared MEA (monoethanolamine) process with [Bmim][PF6] to study CO2 absorption capacity on both and found out that using IL gives around 99% CH4 purity and 98.5% purity for CO2. Likewise, Ma, Wang et al. [83] used [bmim][PF6] and [bmim][BF4] for their analysis to separate CO2 from flue gas and got the purity as 90% for the CO2 rich stream after separation. [hmim][Tf2N] gave 93.7% pure CO2 in an alternative study [84]. Khonkaen, Siemanond et al. [58] modelled a system for coal industry waste stream and his method gave a CO2 purity of 99.26% for [C2MIm][Tf2N]. Moreover, biogas from anaerobic digestion of sewage sludge was treated by García-Gutiérrez, Jacquemin et al. [73] using three different ionic liquids; [C2MIm][Tf2N], [C6MIm][Tf2N], and [P66614][Tf2N] gave a high purity of 95% for methane rich stream removing off CO2 completely from the system. Even though there has been a fast rise in attention in ILs over the past 20 years and a lot of research studies are being performed, only a small number of procedures have been commercialized for the treatment of industrial gas effluent as of yet. The demanding benchmark requirements established by the U.S. Department of Energy (DOE) for CO2 collection technology are as follows: At 90% CO2 processing efficiency, a 95% CO2 stream must be achieved [85]. Therefore, the technology presented in this study can effectively and efficiently extract CO2 with a high level of purity from a variety of industrial effluents.

3.2. Cost Evaluation

The cost of machinery plays a key role in any plant’s capital spending. The most accurate way for estimating equipment costs is to get prices from manufacturers, but this includes comprehensive engineering drawings and documentation. Using cost analysis software is a more accurate way to measure the cost of facilities. Aspen Tech created the Aspen Process Economic Analyzer, which works in tandem with Aspen Plus is one such tool to easily perform economic analysis [69]. Owing to various existing operations involved with the industrial sector, multiple process pollutants are regular. These reserved emissions from industrial processes in the United States alone approach almost 5800 MtCO2 as per 2018 country-level emission data [88]. Hence it is essential to implement a proper cost analysis for the waste streams coming out from these industries.
Figure 4 demonstrates the factors considered for the economic analysis as per the US APEA template, which was in correspondence to the studies done by [89,90]. Moreover, Figure 5 shows the calculated costs for each of the three streams extracted from the ASPEN software. Other details for the capital and operational costs split up are discussed in Table S3 of the Supplementary Datasheet. Cost analysis for this study to get the total initial costs is performed using the built-in Aspen Economic Analyzer option available in Aspen Plus V11. The built-in approximation is modified by the Aspen Economic Analyzer to fit the capacity required in the flow sheet. Nevertheless, since that database does not contain all types and sizes of equipment, it is often important to use a mapping to equipment option for similar but not equivalent functions [91].
An initial study for 20 years of the operating life of the plant was conducted with mapping for each stream composition and data such as total initial investment of the project was calculated by summing up the total capital, equipment and installed costs. The total operational hours for this scenario are calculated to be 8766 h/year and 52 weeks/year. Moreover, the interest rate is calculated to be 20%, and the tax rate is calculated to be 40% for all three streams. It is summarized that the initial cost of the project maximum around USD 1.08 million for each composition (Stream 1, Stream 2, Stream 3) selected for this study. In Table 6 below, the expenses of the utilities taken into consideration for this study are displayed, together with the inlet and outlet temperatures of the utilities, which are by default accessible in Aspen. Additionally, the total utilities cost, which includes both heating and cooling utilities (for example electricity, water, and stream), is calculated to be around a maximum value of USD 0.11 million. The desired rate of return is around 20% per annum. Moreover, TAC (total annualized costs) has been widely used in many process design studies to produce the best results for economic analysis [73,90,92,93,94,95,96]. The equation for calculating TAC for this study is taken from Wang, Ma et al. (2018) [97] that is shown in equation [1] below where the plant lifetime is taken to be 20 years and the capital and operating costs are extracted from the economic analysis of ASPEN PLUS software. The plant capacity of the model is 4000 kg/h (206.165 kmol/h)-0.035Mt/Year for the mixed stream flow (inlet), and a maximum CO2 capacity of 38.1 kmol/h.
    T A C = T o t a l   C a p i t a l   C o s t P l a n t   l i f e t i m e + T o t a l   O p e r a t i n g   C o s t  
TAC is found to be approximately 2.1 M$/Year for all of the three different streams, which is considerably lesser than Haider, Qyyum et al. [98] in which [Bmim][PF6] to purify biogas with a TAC value of USD 31.1 M/year with a plant capacity of 0.4 MTPA. Similarly, Zhang, Song et al. [78] reported a comparative economic analysis for CO2 separation and stated that physical absorption of DEPG solvent gives a TAC value of USD 22.8–25.1 M/year with 1.255 MTPA plant capacity when CO2 molar composition in feed gas varies from 15% to 65%, it was also reported that Monoethanolamine (MEA)-based chemical absorption results for TAC from USD 11.3 M/year to USD 48.5 M/year for same CO2 inlet compositions with a plant capacity of 2.4MTPA. Kazmi, Raza et al. [80] compared MEA with TAC with a value of USD 9.8 M/year and dimethyl ether (DME) with a value of USD 6.16 M/year CO2 capture processes to imidazolium ionic liquid 3MEPYNTF2 with TAC value of USD 1.64 M/year and stated that using ionic liquid relatively decreased the costs of the process in comparison with conventional processes with a plant capacity of around 0.175 MTPA. Moreover, it was also reported that the total capital cost of MEA is USD 9.028 M and DMEA is USD 14.2026 M, while the total operating cost of MEA is found to be USD 8.022 × 10⁶ year−1, and for DME it is USD 3.3205 M/year. Furthermore, De Riva, Suarez-Reyes et al. [99] indicated that using imidazolium-based IL to capture CO2, with an operating cost for optimum scenario was around 3.07 M€/year (3.64 M USD/Year) which corresponded to EURO 73.3/ton of captured CO2. This study accounts for the operating cost to be around USD 1.8 M/year that is almost half of what was reported. The reported values for capital cost in this study is USD 6 M, which is substantially less than the total capital costs of MEA and DME; moreover, the TAC result (USD 2.1 M/year) is also similar to the ones stated by Kazmi, Raza et al. [80]. The operating costs and TAC results for other studies previously reported are considerably less than the compared studies, which verifies that using [Emim][NTf2] to capture CO2 in the process reported in this study is comparatively a better option than employing other conventional techniques. Additionally, [Emim][NTf2] is found to be a cheap ionic liquid that can be used to capture CO2 according to various studies. The variable operating cost of [Emim][NTf2] was predicted by de Riva, Suarez-Reyes et al. [99] as USD 83/tCO2 for capturing CO2. Likewise, as reported from experimental studies done by Li, Wu et al. [100], [Emim][NTf2] cost around 1500 (JPY/kg) for 0.12–0.69 molar fraction of CO2, which was the lowest amongst the compared ionic liquids; hence, it can be proven that [Emim][NTf2] is an extremely low-cost option to produce highly pure CO2 from industrial waste streams. According to prior research, these ensuing expenses may be reduced by enhancing the working conditions, such as decreasing vacuum, which would lower operational and capital expenses [101].

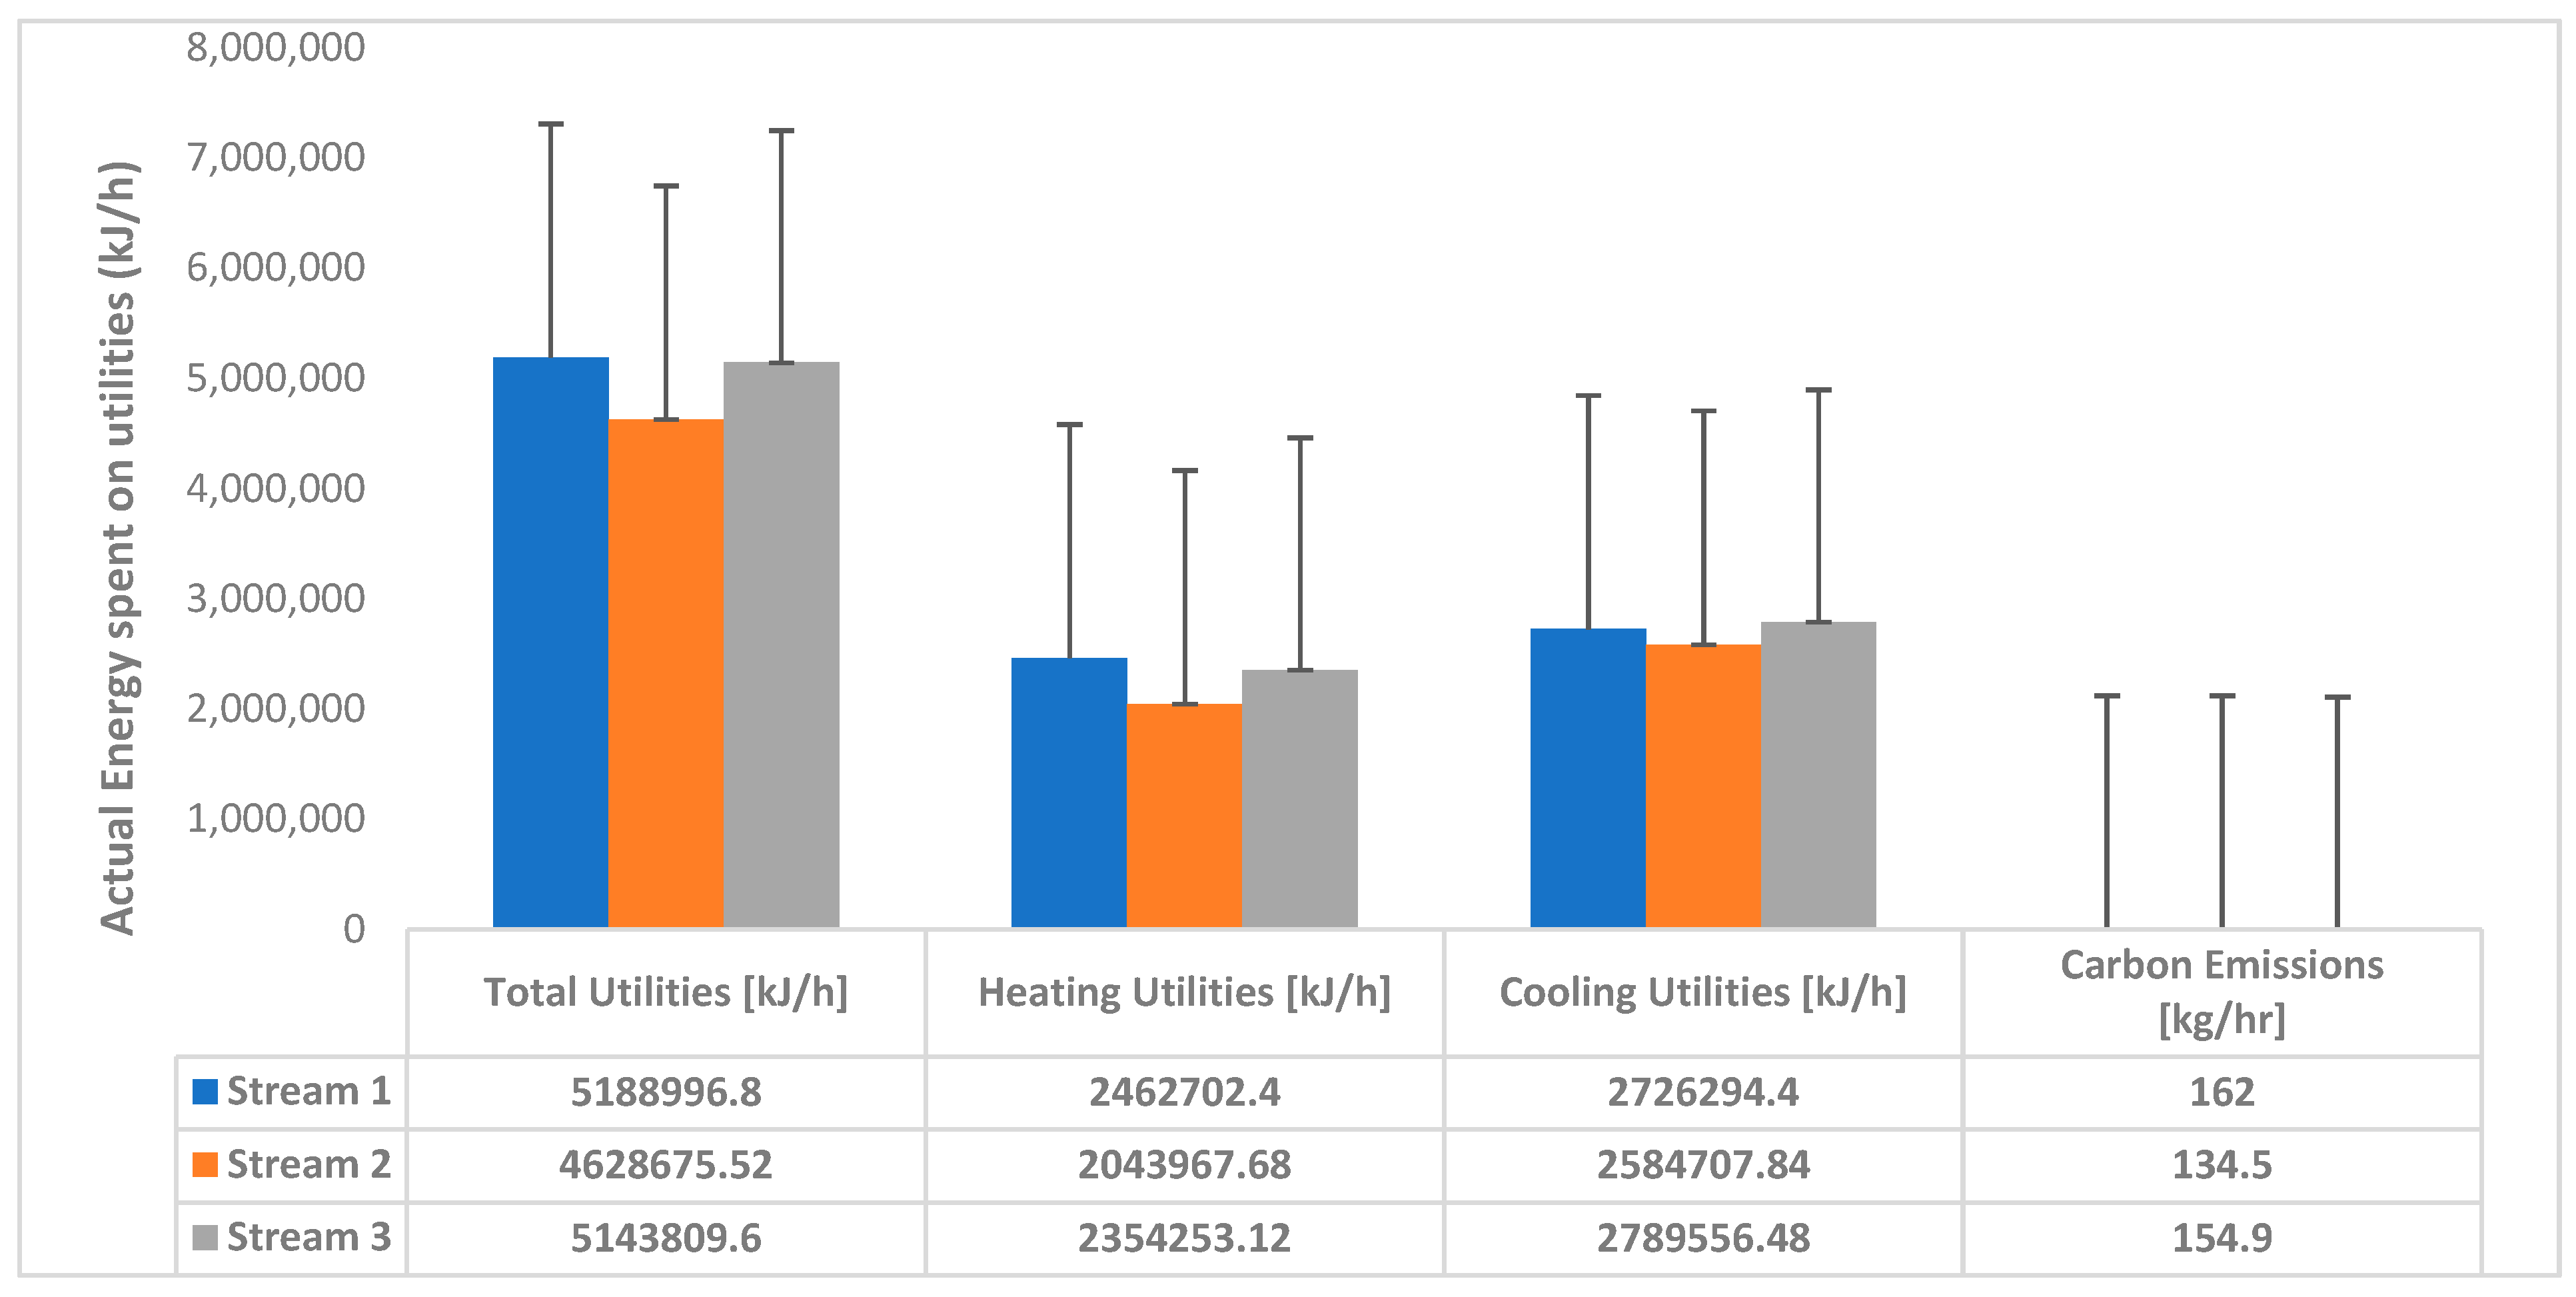
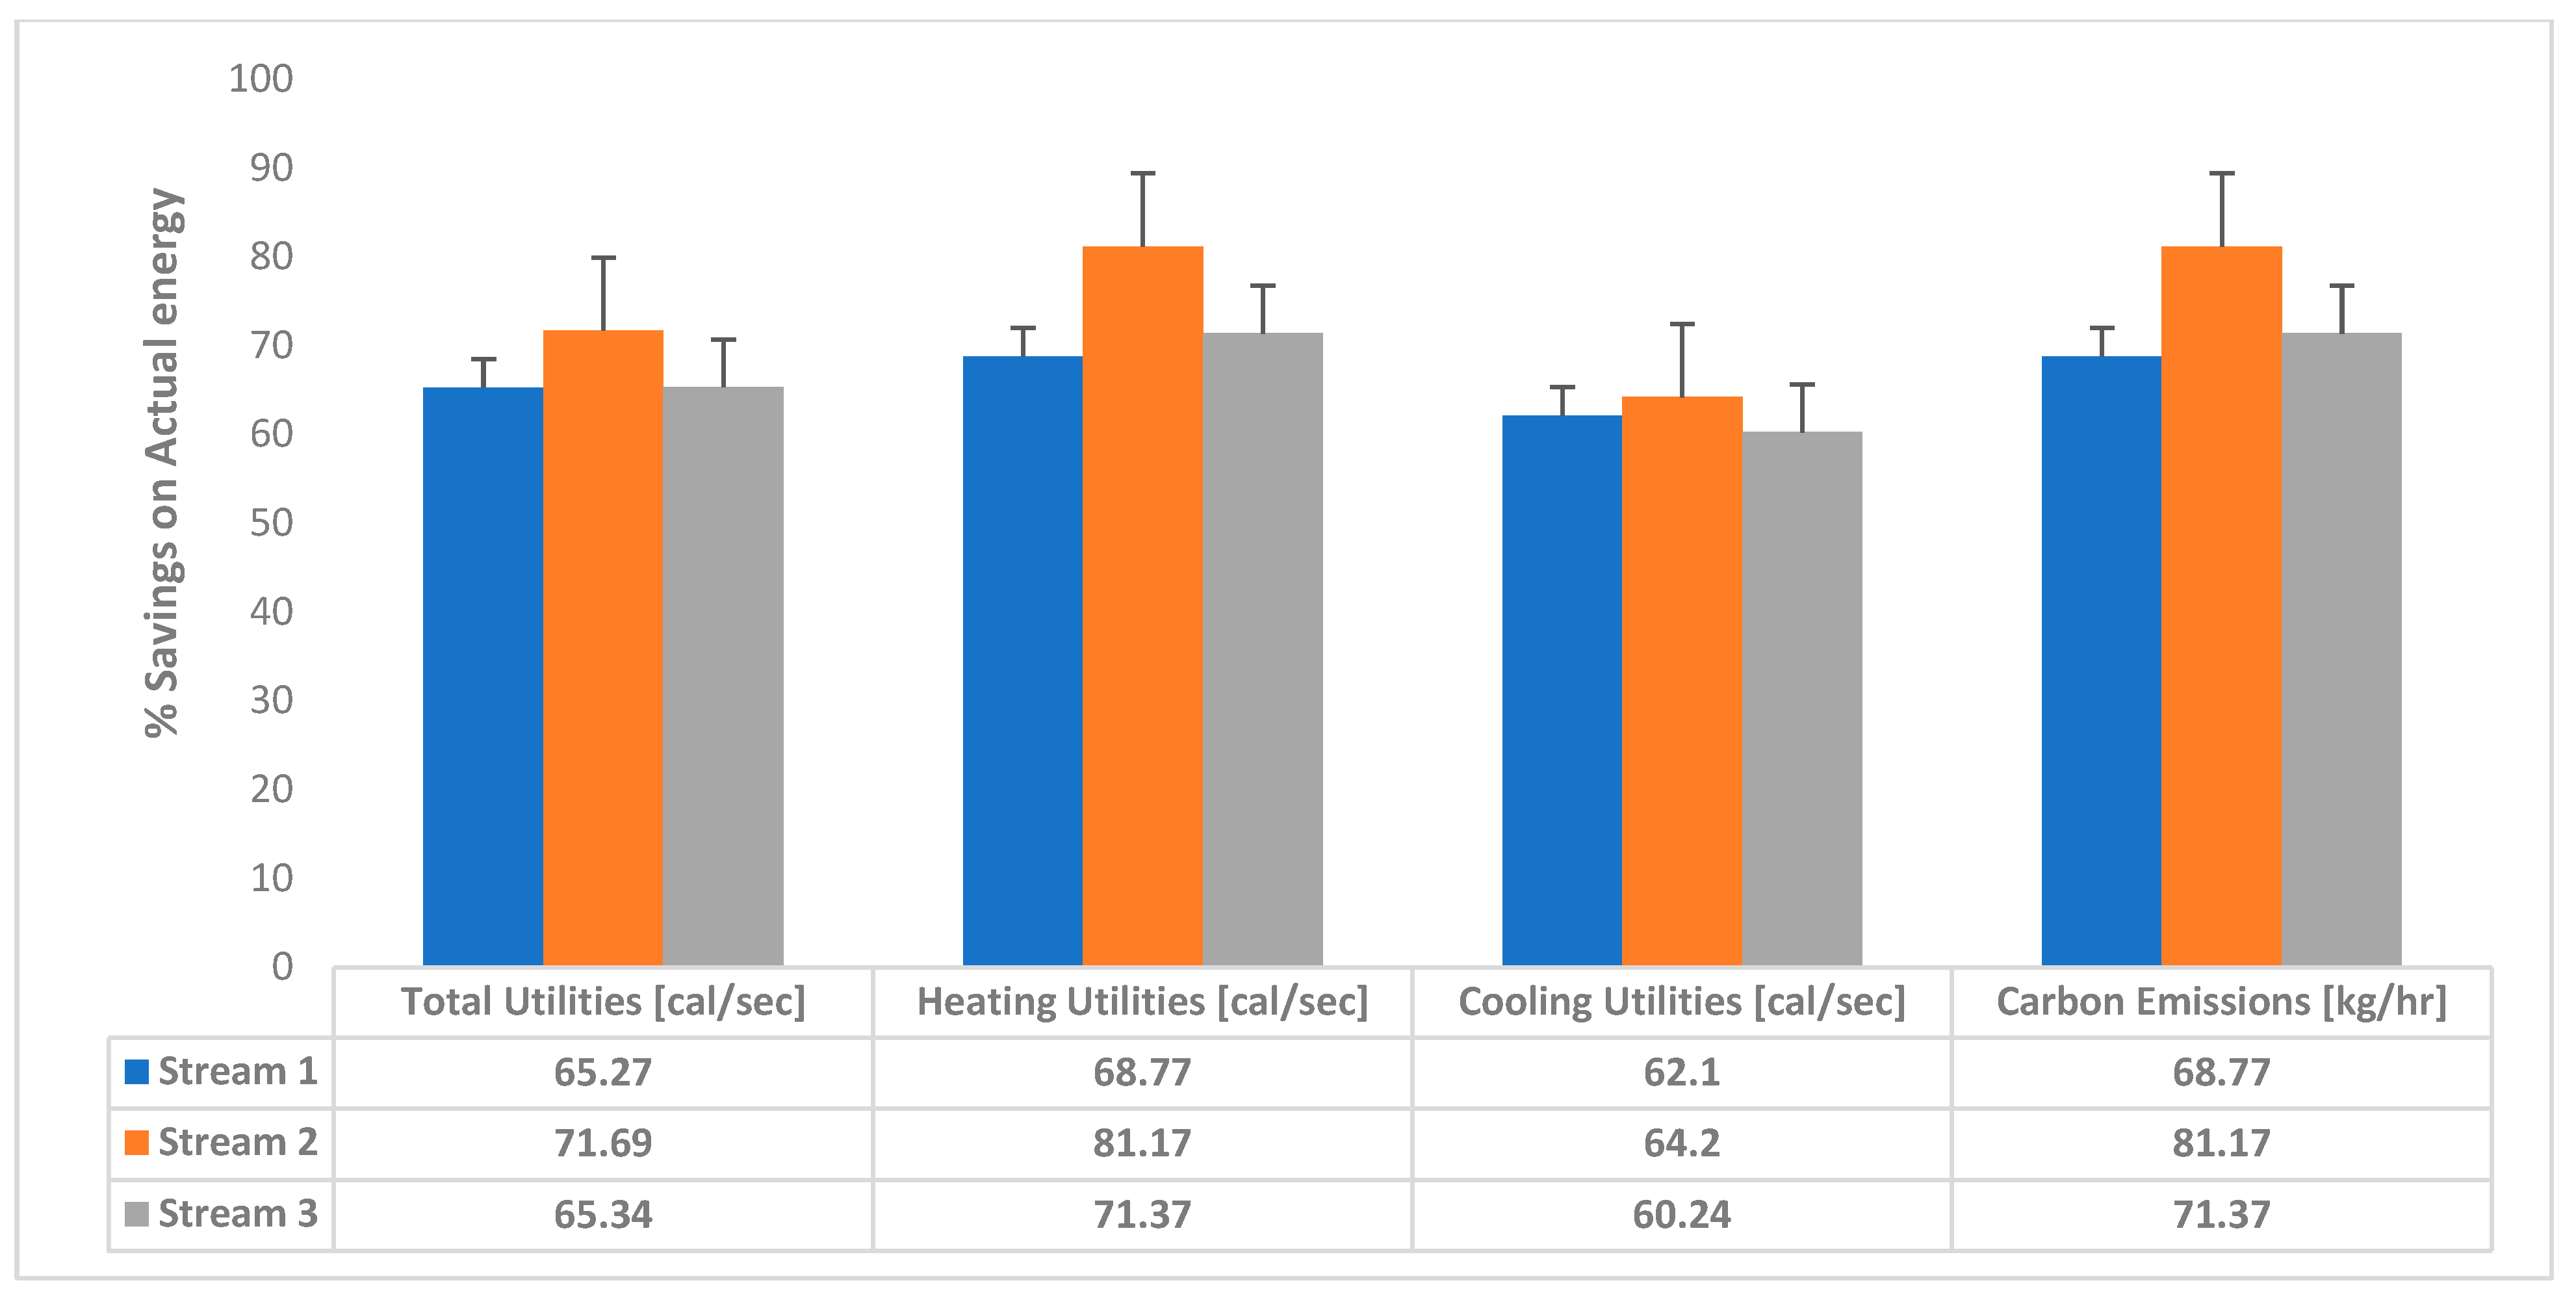
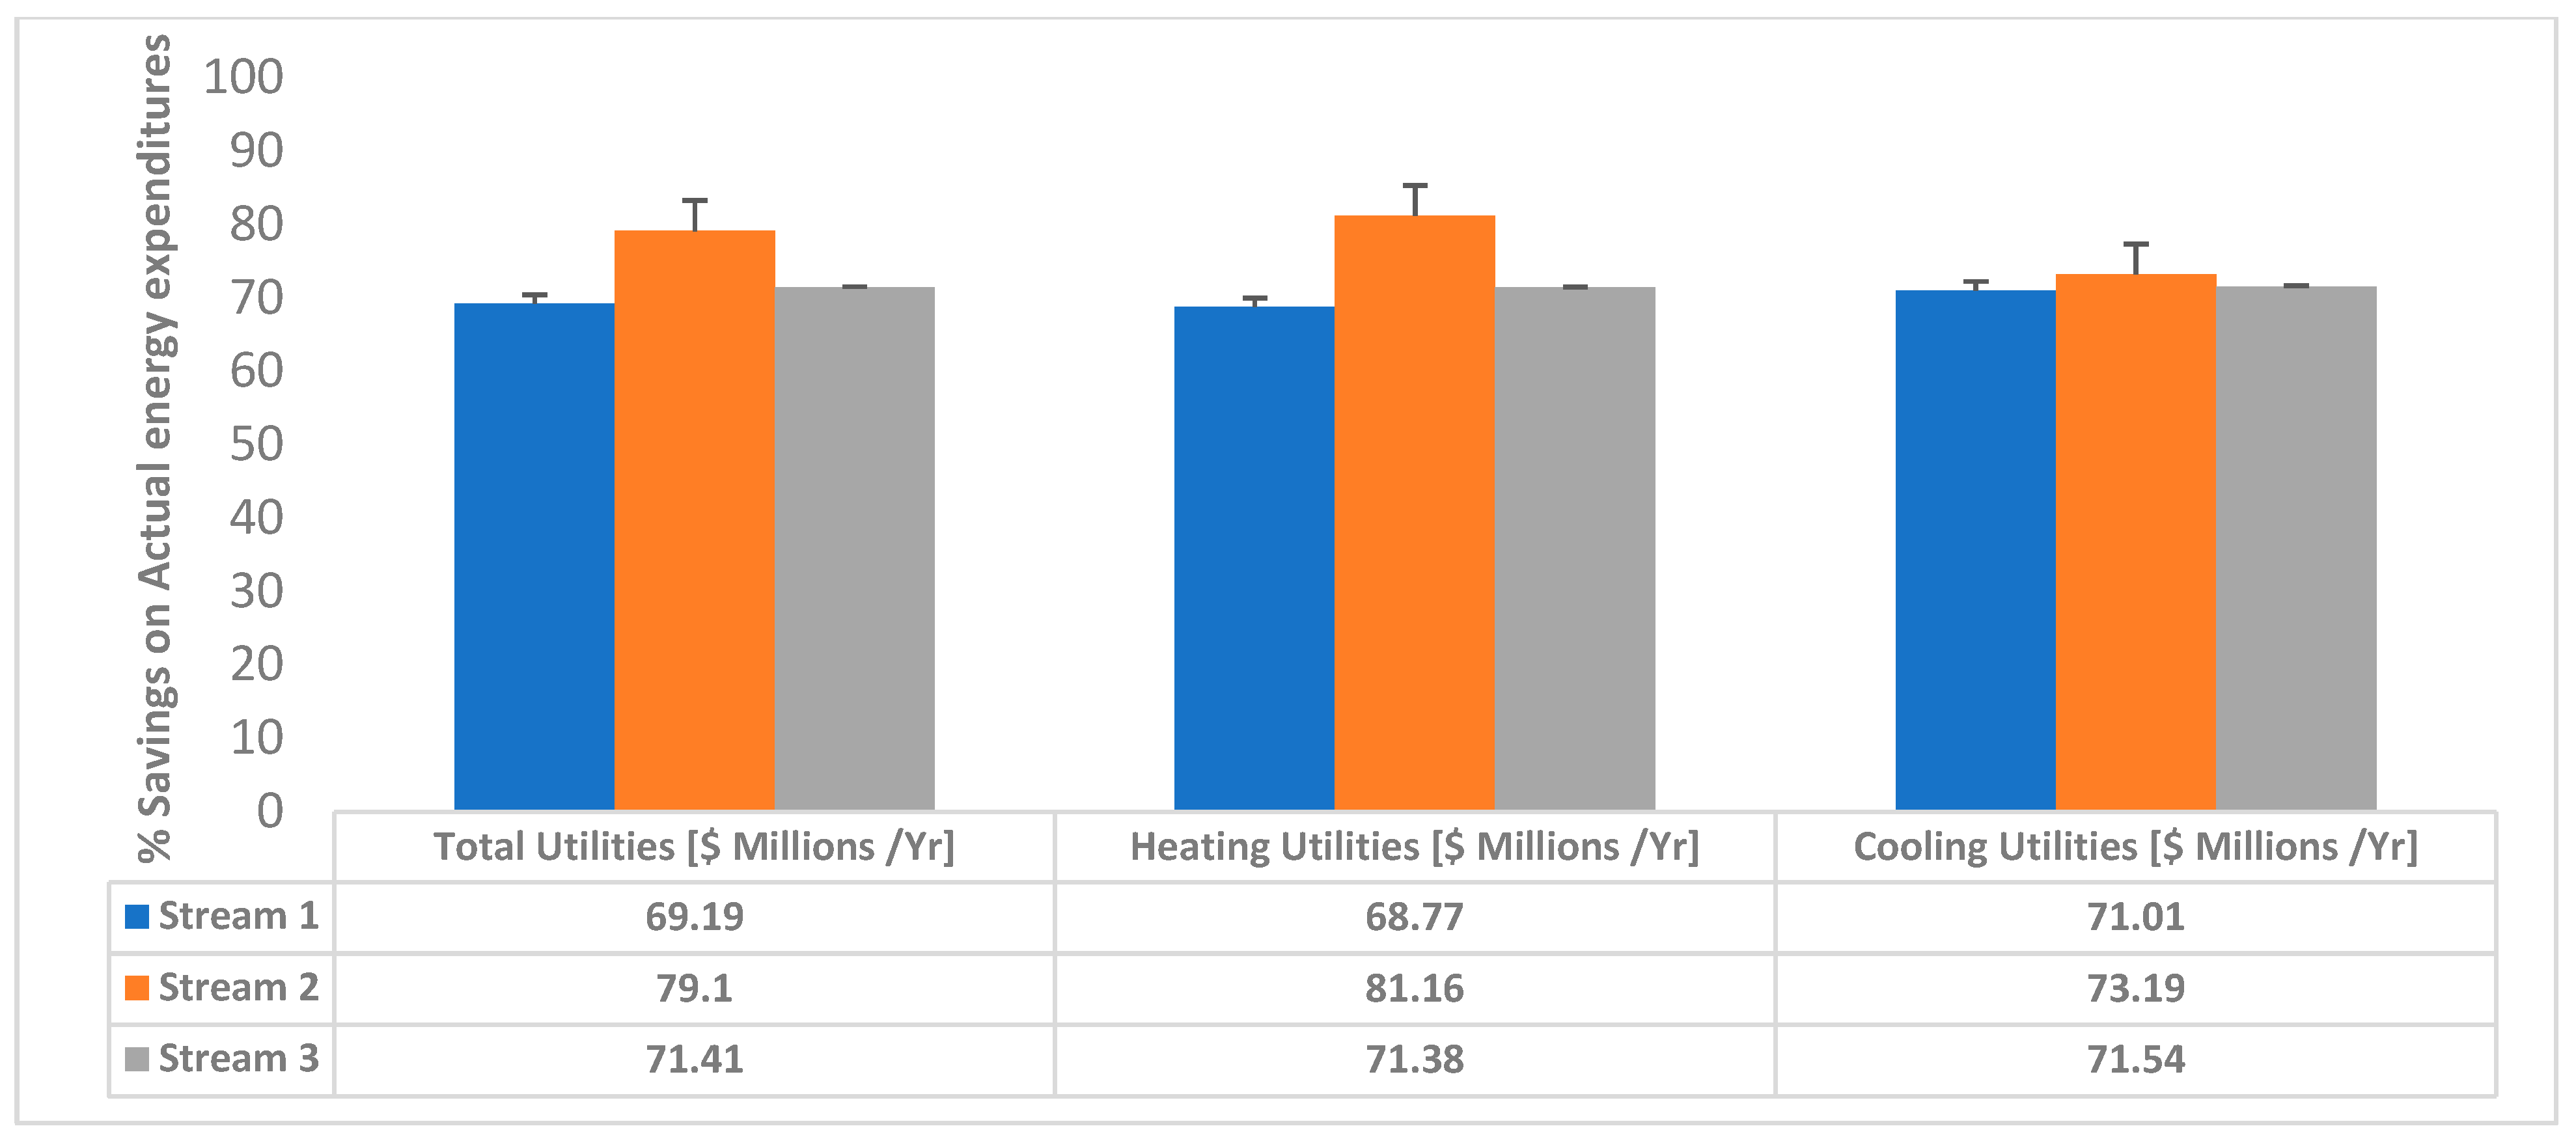
3.3. Energy Savings Analysis

Due to various benefits, such as non-volatility, reliability, high carbon dioxide solubility, and reduced energy requirements for recovery, ionic liquids (ILs) have demonstrated tremendous potential to be used as liquid absorbents for CO2 separation [102,103]. Additionally, even though several ILs have been produced and formulated as possible liquid absorbents for CO2 removal, the energy consumption of a CO2 separation system utilizing multiple ILs is not yet thoroughly investigated, making it challenging for users to choose the right IL for a given operation; hence, it is essential to perform an energy analysis in order to give the users the option to compare and chose the best ionic liquid to apply in their tasks and applications [104]. Using Aspen Energy Analysis was the first step leading to developing the heat integration for this study. Table S4 in the Supplementary Data sheet evaluates the actual energy being spent on the utilities, energy savings potentials and possibilities for this process and identifies the targets in detail. Figure 6 and Figure 7 present the actual energy values and the percentages of how much energy can be saved if this system achieves the targets given from ASPEN PLUS automatically. It is shown that Stream 1 has an estimated total energy savings of almost 3.39·106 kJ/h, which, in other words, means that almost 65.27% of the actual energy expenditures can be saved after achieving the identified targets. Similarly, the total energy savings for Stream 2 are given as 3.314·106 kJ/h, and for Stream 3 are calculated as 3.359·106 kJ/h. Furthermore, a detailed description of these energy savings is given for the heating and cooling utilities and carbon emissions that are found to be 162 kg/h for Stream 1, with that the calculated target carbon emissions are 50.6 kg/h which can save almost 68.77% of actual energy expenditures. Likewise, Stream 2 and Stream 3 give actual carbon emissions of 134.5 kg/h and 154.9 kg/h and targets of 25.33 kg/h and 44.25 kg/h that can save up to 81.17% and 71.37% for both streams. Additionally, for each stream, an actual and targeted cost analysis is provided (shown in Figure 8 and Figure 9), indicating the total utilities, current cost, and percentage of savings that can be achieved in order to reduce energy expenses. For Stream 1, the total utilities are found to be USD 0.066 M/year, and the targets aim at USD 0.02 M/year, which can save around 69.19% of costs. Equivalently, for Stream 2 the actual costs are found to be 0.06 $M/year with targets of USD 0.012M/year, which can save 79.1% of the spending on energy. Stream 3 contributes to USD 0.067 M/year again with targets of USD 0.019 M/year, which can save around 71.41% of energy expenses. Similar techniques of using Aspen Energy Analyzer were used by Shankar, Sivasubramanian et al. [105] and Lei, Zhou et al. Lei, Zhou et al. [106] to get savings on their proposed processes.

3.4. Process Integration of the Proposed Model

Composite curves are amongst the most well-known process integration tools [107,108]. The composite curves display the overall cooling and heating demands of a process in a single graph. The overlap of the curves gives a target for heat recovery potential, whilst the remaining heating and cooling of the composite curves give targets for additional heating and cooling specifications [109]. The curves are segregated by a point with the smallest temperature difference, DTmin, which is selected from before as 10 °C for this process. This Tmin is the level of temperature in the device that can be defined as the “pinch”. In the HEN study, the minimum approach temperature is very critical. It is the energy that elevates heat recovery and identifies the amount of heat recovered in the system. Lower DTmin means lower energy costs, but it also means higher heat exchanger capital costs. As a result, the DTmin can be selected in such a way that the net running expense for resources and area is as low as possible [110]. This network is divided into two halves: one with a heat excess that must be removed by cooling, and the other with an energy deficit that must be overcome by additional heating. Some more details on this are provided in the Supplementary Data [111,112,113,114].
Figure 10 below displays the composite curve for the process. These curves represent the minimum energy targets for the heating and cooling utilities as explained before. Table 7 represents these minimum energy targets that are found to be 1.404 × 10⁶ kJ/h (390 kW) of minimum heating load and 1.596 × 10⁶ kJ/h (433.3 kW) for the cooling load after heat integration. These values are significantly less than the base case (without heat integration) that were 4.401 × 10⁷ kJ/h (12,225 kW) of heating load and 4.420 × 10⁷ kJ/h (12,277.7 kW), which signifies heat integration was applied successfully to this process. Moreover, the temperatures of cross pinch for the study are 403.2 and 113.29 °C for the hot side and 393.2 and 103.29 °C for the cold side. Moreover, the process pinch temperature is at 113.3 Celsius. Gatti, Martelli et al. [115] developed a simulation on CO2 capture using the Rectisol process and demonstrated a GCC curve similar to what we have in this study with heat duty values for the cold utility of 60 MW of cold utilities. Another study by Harkin, Hoadley et al. [116] was published to reduce the energy penalty for capturing CO2 using pinch analysis, where related composite and grand composite (GCC) curves were reported after heat integration with heat load for the reboiler, 125 MW and 233 MW for Plants A and B with DTmin of 3 °C and reported that these values were comparably less than the ones without heat integration heat loads of 226 MW and 416 MW. Perevertaylenko, Gariev et al. [117] established a study on amine absorption units for capturing CO2 and with the help of composite curves demonstrated that after heat integration had a Qmin cooling of 13,307 kW and a Qmin heating of 8517 kW.
The delta Tmin value of 10 °C was selected based on the previous studies mentioned before by Momeni, Soltani et al. [118] and Brunner, Slawitsch et al. [119]. However, the range target feature of the Aspen Energy Analyzer is another approach that can be used to get the optimal approach temperature (DTmin) for the scenario selected (see Supplementary Data Figure S2). The HEN model of the method is founded on the principle of process pinch analysis. The optimum heat regeneration is produced from heat exchangers with pinch point technology; hence, a HEN model is a useful technique for process cost and energy savings [118]. The HEN design constructed the heat exchanger streams is demonstrated in Figure 11 below. The red lines indicate the hot streams, and the blue lines validate the cold streams. It has a highlighted section that shows the addition of the additional heat exchanger (with green spheres) to perform this heat integration with a load of 2182.12 kW (7,855,653.2 kJ/h). It shows that the hot side fluid with higher temperature is upstream cool2 (with blue spheres) with a duty of 10,029.1 kW (36,104,913.6 kJ/h), whereas the colder side fluid from the heat exchanger is upstream of the heater placed on the left side with 1.01 kW (3665 kJ/h) of duty. The HEN design network also shows the pinch and cross pinch lines specified where the vertical dotted lines are the cross-pinch temperatures (Supplementary Datasheet Figure S3). Moreover, cross pinch duties are demonstrated in Table 8. It shows that for a cross-pinch temperature of 403.2/393.2 °C the total cross-pinch load is 3.45·107 kJ/h, and for 113.3/103.3 °C, the cross-pinch load is 4.19·106 kJ/h. Similar kinds of HEN diagrams were demonstrated by Shemfe, Fidalgo et al., Momeni, Soltani et al., and Dagde and Piagbo [110,118,120] that modified and enhanced the energy savings of the processes presented with the help of heat integration.

4. Conclusions

An inclusive simulation study using EMIMNTF2 [1-ethyl-3-methyl-imidizolium bis[(trifluoromethyl)sulfonyl] amide] as a promising ionic liquid to absorb CO2 and CH4 from three different compositions of waste industrial streams with the highest purity up to 99.4% for carbon dioxide and 98.8% for methane was successfully applied in this study. With the recycling ability of EMIMNTF2 introduced in the process design, this system can potentially be used on a commercial scale in the near future. Furthermore, using the Economic Analyzer feature in Aspen Plus, it is reported that with 20 years of a plant’s life the total annualized cost (TAC) for the process is found to be USD 2.1 M/year with total operating cost (TOC) of USD 1.8 M/year, which is comparatively less than some reported studies for conventional absorption technologies and a few ionic liquids are also specified in the paper. In addition to costs, a thorough analysis of energy savings and heat integration was performed on this system to lower energy usage. Therefore, it was suggested by the Aspen Activated Energy Analysis that installing a heat exchanger in the system would possibly save about USD 340,182 per year and have the lowest payback period of 0.0586 years. To conclude, this study initiates the future possibility of using [EMIM][NTF2] on a potentially large scale to absorb not only CO2 but also CH4 with other impurities generated from the waste streams of various industries.

Supplementary Materials

The following supporting information can be downloaded at: https://www.mdpi.com/article/10.3390/su15043370/s1, Figure S1: Grand Composite Curve for targeting Utilities and Pinch temperatures; Figure S2: Total Cost Index Vs Delta Tmin; Figure S3: Detailed Heat Exchange Network (HEN) design selected with the least payback amount; Table S1: Ionic Liquid evaluated in this work; Table S2: Information included to specify [emim][Ntf2] and its reaction product into the Aspen Properties. The CO2, N2 and H2O SGPRF and CSACVL parameters are also needed, as they are not incorporated in the Aspen Properties database; Table S3: Details of the estimated total Capital and Operating costs in Aspen Process Energy Analyzer; Table S4: Energy and Cost analysis for the Utilities in the system using Energy Analysis for each stream; Table S5: Alternative solutions to the design evaluated by ASPEN ENERGY ANALYZER; Table S6: Heat Duties of the components with inlet and outlet temperatures used for Heat Integration; Table S7: The details of the selected solution of Heat Exchanger (E—100) added to the process; References [74,75,111,112,113,114] are cited in the supplementary materials.

Author Contributions

Writing—review & editing, T.Q; Supervision, M.K. and F.A.; writing—review and editing, M.K. and F.A.; visualization, T.Q. and F.A.; project administration, M.K.; funding acquisition M.K. and F.A. All authors have read and agreed to the published version of the manuscript.

Funding

The authors are grateful for the Qatar University internal grant number: QUCG-CENG-21/22-4.

Conflicts of Interest

The authors declare no conflict of interest.

References

  1. Aghel, B.; Behaein, S.; Wongwises, S.; Shadloo, M.S. A review of recent progress in biogas upgrading: With emphasis on carbon capture. Biomass Bioenergy 2022, 160, 106422. [Google Scholar] [CrossRef]
  2. Aghel, B.; Janati, S.; Wongwises, S.; Shadloo, M.S. Review on CO2 capture by blended amine solutions. Int. J. Greenh. Gas Control. 2022, 119, 103715. [Google Scholar] [CrossRef]
  3. Safarov, J.; El-Awady, W.A.; Shahverdiyev, A.; Hassel, E. Thermodynamic Properties of 1-Ethyl-3-methylimidazolium Bis(trifluoromethylsulfonyl)imide. J. Chem. Eng. Data 2011, 56, 106–112. [Google Scholar] [CrossRef]
  4. Wang, S.; Li, G.; Fang, C. Urbanization, economic growth, energy consumption, and CO2 emissions: Empirical evidence from countries with different income levels. Renew. Sustain. Energy Rev. 2018, 81, 2144–2159. [Google Scholar] [CrossRef]
  5. Nejat, P.; Jomehzadeh, F.; Taheri, M.M.; Gohari, M.; Majid, M.Z.A. A global review of energy consumption, CO2 emissions and policy in the residential sector (with an overview of the top ten CO2 emitting countries). Renew. Sustain. Energy Rev. 2015, 43, 843–862. [Google Scholar] [CrossRef]
  6. Li, R.; Jiang, R. Investigating effect of R&D investment on decoupling environmental pressure from economic growth in the global top six carbon dioxide emitters. Sci. Total Environ. 2020, 740, 140053. [Google Scholar]
  7. Salvia, M.; Reckien, D.; Pietrapertosa, F.; Eckersley, P.; Spyridaki, N.-A.; Krook-Riekkola, A.; Olazabal, M.; Hurtado, S.D.G.; Simoes, S.G.; Geneletti, D. Will climate mitigation ambitions lead to carbon neutrality? An analysis of the local-level plans of 327 cities in the EU. Renew. Sustain. Energy Rev. 2021, 135, 110253. [Google Scholar] [CrossRef]
  8. Zhao, X.; Ma, X.; Chen, B.; Shang, Y.; Song, M. Challenges toward carbon neutrality in China: Strategies and countermeasures. Resour. Conserv. Recycl. 2022, 176, 105959. [Google Scholar] [CrossRef]
  9. Karami, B.; Ghaemi, A.; Shahhosseini, S. Eco-Friendly Deep Eutectic Solvents Blended with Diethanolamine Solution for Postcombustion CO2 Capture. Energy Fuels 2022, 36, 945–957. [Google Scholar] [CrossRef]
  10. Abdi-Khanghah, M.; Bemani, A.; Naserzadeh, Z.; Zhang, Z. Prediction of solubility of N-alkanes in supercritical CO2 using RBF-ANN and MLP-ANN. J. CO2 Util. 2018, 25, 108–119. [Google Scholar] [CrossRef]
  11. Muthuraj, R.; Mekonnen, T. Recent progress in carbon dioxide (CO2) as feedstock for sustainable materials development: Co-polymers and polymer blends. Polymer 2018, 145, 348–373. [Google Scholar] [CrossRef]
  12. Mustafa, A.; Lougou, B.G.; Shuai, Y.; Wang, Z.; Tan, H. Current technology development for CO2 utilization into solar fuels and chemicals: A review. J. Energy Chem. 2020, 49, 96–123. [Google Scholar] [CrossRef]
  13. Last, G.V.; Schmick, M.T. Identification and Selection of Major Carbon Dioxide Stream Compositions; Pacific Northwest National Lab. (PNNL): Richland, WA, USA, 2011.
  14. Ghanbari, T.; Abnisa, F.; Daud, W.M.A.W. A review on production of metal organic frameworks (MOF) for CO2 adsorption. Sci. Total Environ. 2020, 707, 135090. [Google Scholar] [CrossRef] [PubMed]
  15. Yu, C.-H.; Huang, C.-H.; Tan, C.-S. A review of CO2 capture by absorption and adsorption. Aerosol Air Qual. Res. 2012, 12, 745–769. [Google Scholar] [CrossRef]
  16. Wang, B.; Sheng, M.; Xu, J.; Zhao, S.; Wang, J.; Wang, Z. Recent Advances of Gas Transport Channels Constructed with Different Dimensional Nanomaterials in Mixed-Matrix Membranes for CO2 Separation. Small Methods 2020, 4, 1900749. [Google Scholar] [CrossRef]
  17. Dalane, K.; Dai, Z.; Mogseth, G.; Hillestad, M.; Deng, L. Potential applications of membrane separation for subsea natural gas processing: A review. J. Nat. Gas Sci. Eng. 2017, 39, 101–117. [Google Scholar] [CrossRef]
  18. Wang, M.; Lawal, A.; Stephenson, P.; Sidders, J.; Ramshaw, C. Post-combustion CO2 capture with chemical absorption: A state-of-the-art review. Chem. Eng. Res. Des. 2011, 89, 1609–1624. [Google Scholar] [CrossRef]
  19. Mansourizadeh, A.; Ismail, A.; Matsuura, T. Effect of operating conditions on the physical and chemical CO2 absorption through the PVDF hollow fiber membrane contactor. J. Membr. Sci. 2010, 353, 192–200. [Google Scholar] [CrossRef]
  20. Zhang, N.; Pan, Z.; Zhang, Z.; Zhang, W.; Zhang, L.; Baena-Moreno, F.M.; Lichtfouse, E. CO2 capture from coalbed methane using membranes: A review. Environ. Chem. Lett. 2020, 18, 79–96. [Google Scholar] [CrossRef]
  21. Chowdhury, F.A.; Okabe, H.; Yamada, H.; Onoda, M.; Fujioka, Y. Synthesis and selection of hindered new amine absorbents for CO2 capture. Energy Procedia 2011, 4, 201–208. [Google Scholar] [CrossRef]
  22. Rufford, T.E.; Smart, S.; Watson, G.C.; Graham, B.; Boxall, J.; Da Costa, J.D.; May, E. The removal of CO2 and N2 from natural gas: A review of conventional and emerging process technologies. J. Pet. Sci. Eng. 2012, 94, 123–154. [Google Scholar] [CrossRef]
  23. Mondal, M.K.; Balsora, H.K.; Varshney, P. Progress and trends in CO2 capture/separation technologies: A review. Energy 2012, 46, 431–441. [Google Scholar] [CrossRef]
  24. Ebner, A.D.; Ritter, J.A. State-of-the-art adsorption and membrane separation processes for carbon dioxide production from carbon dioxide emitting industries. Sep. Sci. Technol. 2009, 44, 1273–1421. [Google Scholar] [CrossRef]
  25. Gharagheizi, F.; Tang, D.; Sholl, D.S. Selecting adsorbents to separate diverse near-azeotropic chemicals. J. Phys. Chem. C 2020, 124, 3664–3670. [Google Scholar] [CrossRef]
  26. Jiang, N.; Shang, R.; Heijman, S.G.; Rietveld, L.C. High-silica zeolites for adsorption of organic micro-pollutants in water treatment: A review. Water Res. 2018, 144, 145–161. [Google Scholar] [CrossRef]
  27. Awual, M.R.; Khraisheh, M.; Alharthi, N.H.; Luqman, M.; Islam, A.; Karim, M.R.; Rahman, M.M.; Khaleque, M.A. Efficient detection and adsorption of cadmium (II) ions using innovative nano-composite materials. Chem. Eng. J. 2018, 343, 118–127. [Google Scholar] [CrossRef]
  28. Norahim, N.; Yaisanga, P.; Faungnawakij, K.; Charinpanitkul, T.; Klaysom, C. Recent membrane developments for CO2 separation and capture. Chem. Eng. Technol. 2018, 41, 211–223. [Google Scholar] [CrossRef]
  29. Sarfraz, M.; Ba-Shammakh, M. Synergistic effect of adding graphene oxide and ZIF-301 to polysulfone to develop high performance mixed matrix membranes for selective carbon dioxide separation from post combustion flue gas. J. Membr. Sci. 2016, 514, 35–43. [Google Scholar] [CrossRef]
  30. Wang, Y.; Zhao, L.; Otto, A.; Robinius, M.; Stolten, D. A review of post-combustion CO2 capture technologies from coal-fired power plants. Energy Procedia 2017, 114, 650–665. [Google Scholar] [CrossRef]
  31. Rezakazemi, M.; Amooghin, A.E.; Montazer-Rahmati, M.M.; Ismail, A.F.; Matsuura, T. State-of-the-art membrane based CO2 separation using mixed matrix membranes (MMMs): An overview on current status and future directions. Prog. Polym. Sci. 2014, 39, 817–861. [Google Scholar] [CrossRef]
  32. Rafiq, S.; Maulud, A.; Man, Z.; Mutalib, M.I.A.; Ahmad, F.; Khan, A.U.; Khan, A.L.; Ghauri, M.; Muhammad, N. Modelling in mixed matrix membranes for gas separation. Can. J. Chem. Eng. 2015, 93, 88–95. [Google Scholar] [CrossRef]
  33. Tierling, S.; Jindal, S.; Abascal, R. Considerations for the use of carbon dioxide removal membranes in an offshore environment. In Proceedings of the OTC Brasil, Rio de Janeiro, Brazil, 4–6 October 2011. [Google Scholar]
  34. Jahn, J.; Van Den Bos, P.; Van Den Broeke, L.J. Evaluation of membrane processes for acid gas treatment. In Proceedings of the SPE International Production and Operations Conference & Exhibition, Doha, Qatar, 14–16 May 2012. [Google Scholar]
  35. Yang, H.; Xu, Z.; Fan, M.; Gupta, R.; Slimane, R.B.; Bland, A.E.; Wright, I. Progress in carbon dioxide separation and capture: A review. J. Environ. Sci. 2008, 20, 14–27. [Google Scholar] [CrossRef] [PubMed]
  36. Pires, J.; Martins, F.; Alvim-Ferraz, M.; Simões, M. Recent developments on carbon capture and storage: An overview. Chem. Eng. Res. Des. 2011, 89, 1446–1460. [Google Scholar] [CrossRef]
  37. Zhou, X.; Rong, Y.; Fang, S.; Wang, K.; Zhi, X.; Qiu, L.; Chi, X. Thermodynamic analysis of an organic Rankine–vapor compression cycle (ORVC) assisted air compression system for cryogenic air separation units. Appl. Therm. Eng. 2021, 189, 116678. [Google Scholar] [CrossRef]
  38. Xu, G.; Liang, F.; Yang, Y.; Hu, Y.; Zhang, K.; Liu, W. An Improved CO2 Separation and Purification System Based on Cryogenic Separation and Distillation Theory. Energies 2014, 7, 3484–3502. [Google Scholar] [CrossRef]
  39. Song, C.F.; Kitamura, Y.; Li, S.H. Evaluation of Stirling cooler system for cryogenic CO2 capture. Appl. Energy 2012, 98, 491–501. [Google Scholar] [CrossRef]
  40. Liu, Z.; Pan, Z.; Zhang, Z.; Liu, P.; Shang, L.; Li, B. Effect of porous media and sodium dodecyl sulphate complex system on methane hydrate formation. Energy Fuels 2018, 32, 5736–5749. [Google Scholar] [CrossRef]
  41. Di Profio, P.; Canale, V.; D’Alessandro, N.; Germani, R.; Di Crescenzo, A.; Fontana, A. Separation of CO2 and CH4 from biogas by formation of clathrate hydrates: Importance of the driving force and kinetic promoters. ACS Sustain. Chem. Eng. 2017, 5, 1990–1997. [Google Scholar] [CrossRef]
  42. Prah, B.; Yun, R. CO2 hydrate slurry transportation in carbon capture and storage. Appl. Therm. Eng. 2018, 128, 653–661. [Google Scholar] [CrossRef]
  43. Smirnov, V.G.; Manakov, A.Y.; Dyrdin, V.V.; Ismagilov, Z.R.; Mikhailova, E.S.; Rodionova, T.V.; Villevald, G.V.; Malysheva, V.Y. The formation of carbon dioxide hydrate from water sorbed by coals. Fuel 2018, 228, 123–131. [Google Scholar] [CrossRef]
  44. Tajima, H.; Yamasaki, A.; Kiyono, F. Energy consumption estimation for greenhouse gas separation processes by clathrate hydrate formation. Energy 2004, 29, 1713–1729. [Google Scholar] [CrossRef]
  45. Li, A.; Wang, J.; Bao, B. High-efficiency CO2 capture and separation based on hydrate technology: A review. Greenh. Gases Sci. Technol. 2019, 9, 175–193. [Google Scholar] [CrossRef]
  46. Nath, D.; Henni, A. Solubility of carbon dioxide (CO2) in four bis (trifluoromethyl-sulfonyl) imide ([Tf2N]) based ionic liquids. Fluid Phase Equilibria 2020, 524, 112757. [Google Scholar] [CrossRef]
  47. Hasib-ur-Rahman, M.; Siaj, M.; Larachi, F. CO2 capture in alkanolamine/room-temperature ionic liquid emulsions: A viable approach with carbamate crystallization and curbed corrosion behavior. Int. J. Greenh. Gas Control. 2012, 6, 246–252. [Google Scholar] [CrossRef]
  48. Zheng, S.; Zeng, S.; Li, Y.; Bai, L.; Bai, Y.; Zhang, X.; Liang, X.; Zhang, S. State of the art of ionic liquid—Modified adsorbents for CO2 capture and separation. AIChE J. 2022, 68, e17500. [Google Scholar] [CrossRef]
  49. Wang, Z.; Wang, Z.; Huang, X.; Yang, D.; Wu, C.; Chen, J. Deep eutectic solvents composed of bio-phenol-derived superbase ionic liquids and ethylene glycol for CO2 capture. Chem. Commun. 2022, 58, 2160–2163. [Google Scholar] [CrossRef]
  50. Isaacs-Páez, E.; García-Pérez, A.; Nieto-Delgado, C.; Chazaro-Ruiz, L.F.; Rangel-Mendez, J. Enhanced CO2 capture kinetics by using macroporous carbonized natural fibers impregnated with an ionic liquid. J. Mol. Liq. 2022, 350, 118602. [Google Scholar] [CrossRef]
  51. Lian, S.; Song, C.; Liu, Q.; Duan, E.; Ren, H.; Kitamura, Y. Recent advances in ionic liquids-based hybrid processes for CO2 capture and utilization. J. Environ. Sci. 2021, 99, 281–295. [Google Scholar] [CrossRef]
  52. Zheng, W.; Jiang, W.; Zhang, R.; Luo, X.; Liang, Z. Study of Equilibrium Solubility, NMR Analysis, and Reaction Kinetics of CO2 Absorption into Aqueous N-1, N-2-Dimethylethane-1, 2-diamine Solutions. Energy Fuels 2020, 34, 672–682. [Google Scholar] [CrossRef]
  53. Golzar, K.; Amjad-Iranagh, S.; Modarress, H. Prediction of density, surface tension, and viscosity of quaternary ammonium-based ionic liquids ([N222 (n)] Tf2N) by means of artificial intelligence techniques. J. Dispers. Sci. Technol. 2014, 35, 1809–1829. [Google Scholar] [CrossRef]
  54. Izgorodina, E.I.; Seeger, Z.L.; Scarborough, D.L.; Tan, S.Y. Quantum chemical methods for the prediction of energetic, physical, and spectroscopic properties of ionic liquids. Chem. Rev. 2017, 117, 6696–6754. [Google Scholar] [CrossRef] [PubMed]
  55. Dong, K.; Liu, X.; Dong, H.; Zhang, X.; Zhang, S. Multiscale studies on ionic liquids. Chem. Rev. 2017, 117, 6636–6695. [Google Scholar] [CrossRef] [PubMed]
  56. Niu, Z.; Guo, Y.; Zeng, Q.; Lin, W. Experimental Studies and Rate-Based Process Simulations of CO2 Absorption with Aqueous Ammonia Solutions. Ind. Eng. Chem. Res. 2012, 51, 5309–5319. [Google Scholar] [CrossRef]
  57. Shiflett, M.B.; Drew, D.W.; Cantini, R.A.; Yokozeki, A. Carbon dioxide capture using ionic liquid 1-butyl-3-methylimidazolium acetate. Energy Fuels 2010, 24, 5781–5789. [Google Scholar] [CrossRef]
  58. Khonkaen, K.; Siemanond, K.; Henni, A. Simulation of carbon dioxide capture using ionic liquid 1-Ethyl-3-methylimidazolium acetate. In Computer Aided Chemical Engineering; Elsevier: Amsterdam, The Netherlands, 2014; Volume 33, pp. 1045–1050. [Google Scholar]
  59. Amiri, N.; Lounis, Z.; Benyounes, H. CO2 Capture from Natural Gas with Ionic Liquid. In ICREEC 2019; Springer: Berlin/Heidelberg, Germany, 2020; pp. 647–652. [Google Scholar]
  60. Xie, Y.; Björkmalm, J.; Ma, C.; Willquist, K.; Yngvesson, J.; Wallberg, O.; Ji, X. Techno-economic evaluation of biogas upgrading using ionic liquids in comparison with industrially used technology in Scandinavian anaerobic digestion plants. Appl. Energy 2018, 227, 742–750. [Google Scholar] [CrossRef]
  61. Ma, C.; Liu, C.; Lu, X.; Ji, X. Techno-economic analysis and performance comparison of aqueous deep eutectic solvent and other physical absorbents for biogas upgrading. Appl. Energy 2018, 225, 437–447. [Google Scholar] [CrossRef]
  62. Haider, J.; Qyyum, M.A.; Riaz, A.; Naquash, A.; Kazmi, B.; Yasin, M.; Nizami, A.-S.; Byun, M.; Lee, M.; Lim, H. State-of-the-art process simulations and techno-economic assessments of ionic liquid-based biogas upgrading techniques: Challenges and prospects. Fuel 2022, 314, 123064. [Google Scholar] [CrossRef]
  63. Shaahmadi, F.; Shahraki, B.H.; Farhadi, A. The CO2/CH4 gas mixture solubility in ionic liquids [Bmim][Ac],[Bmim][BF4] and their binary mixtures. J. Chem. Thermodyn. 2020, 141, 105922. [Google Scholar] [CrossRef]
  64. Ramdin, M.; de Loos, T.W.; Vlugt, T.J. State-of-the-art of CO2 capture with ionic liquids. Ind. Eng. Chem. Res. 2012, 51, 8149–8177. [Google Scholar] [CrossRef]
  65. Kortenbruck, K.; Pohrer, B.; Schluecker, E.; Friedel, F.; Ivanovic-Burmazovic, I. Determination of the diffusion coefficient of CO2 in the ionic liquid EMIM NTf2 using online FTIR measurements. J. Chem. Thermodyn. 2012, 47, 76–80. [Google Scholar] [CrossRef]
  66. Giammanco, C.H.; Kramer, P.L.; Yamada, S.A.; Nishida, J.; Tamimi, A.; Fayer, M.D. Carbon dioxide in an ionic liquid: Structural and rotational dynamics. J. Chem. Phys. 2016, 144, 104506. [Google Scholar] [CrossRef] [PubMed]
  67. Shiflett, M.B.; Elliott, B.A.; Yokozeki, A. Phase behavior of vinyl fluoride in room-temperature ionic liquids [emim][Tf2N],[bmim][N (CN) 2],[bmpy][BF4],[bmim][HFPS] and [omim][TFES]. Fluid Phase Equilibria 2012, 316, 147–155. [Google Scholar] [CrossRef]
  68. Li, L.; Huang, X.; Jiang, Q.; Xia, L.; Wang, J.; Ai, N. New process development and process evaluation for capturing CO2 in flue gas from power plants using ionic liquid [emim][Tf2N]. Chin. J. Chem. Eng. 2020, 28, 721–732. [Google Scholar] [CrossRef]
  69. Sultan, H.; Bhatti, U.H.; Muhammad, H.A.; Nam, S.C.; Baek, I.H. Modification of postcombustion CO2 capture process: A techno-economic analysis. Greenh. Gases Sci. Technol. 2021, 11, 165–182. [Google Scholar] [CrossRef]
  70. Li, Y.; Wang, N.; Guan, H.; Jia, Z.; Zhang, Y.; Zhao, G.; Gao, M. Optimization study of CO2 capture unit for subcritical coal-fired power generation unit based on Ebsilon and Aspen plus. Energy Convers. Manag. 2022, 269, 116111. [Google Scholar] [CrossRef]
  71. Lee, B.-S.; Lin, S.-T. Screening of ionic liquids for CO2 capture using the COSMO-SAC model. Chem. Eng. Sci. 2015, 121, 157–168. [Google Scholar] [CrossRef]
  72. Palomar, J.; Gonzalez-Miquel, M.; Polo, A.; Rodriguez, F. Understanding the physical absorption of CO2 in ionic liquids using the COSMO-RS method. Ind. Eng. Chem. Res. 2011, 50, 3452–3463. [Google Scholar] [CrossRef]
  73. García-Gutiérrez, P.; Jacquemin, J.; McCrellis, C.; Dimitriou, I.; Taylor, S.R.; Hardacre, C.; Allen, R.W. Techno-economic feasibility of selective CO2 capture processes from biogas streams using ionic liquids as physical absorbents. Energy Fuels 2016, 30, 5052–5064. [Google Scholar] [CrossRef]
  74. Micari, M.; Dakhchoune, M.; Agrawal, K. Techno-economic assessment of postcombustion carbon capture using high-performance nanoporous single-layer graphene membranes. J. Membr. Sci. 2021, 624, 119103. [Google Scholar] [CrossRef]
  75. Miladi, R.; Frikha, N.; Gabsi, S. Modeling and energy analysis of a solar thermal vacuum membrane distillation coupled with a liquid ring vacuum pump. Renew. Energy 2021, 164, 1395–1407. [Google Scholar] [CrossRef]
  76. Ottiger, S.; Pini, R.; Storti, G.; Mazzotti, M. Competitive adsorption equilibria of CO2 and CH4 on a dry coal. Adsorption 2008, 14, 539–556. [Google Scholar] [CrossRef]
  77. Von Storch, H.; Becker-Hardt, S.; Sattler, C. (Solar) Mixed Reforming of Methane: Potential and Limits in Utilizing CO2 as Feedstock for Syngas Production—A Thermodynamic Analysis. Energies 2018, 11, 2537. [Google Scholar] [CrossRef]
  78. Zhang, X.; Song, Z.; Gani, R.; Zhou, T. Comparative economic analysis of physical, chemical, and hybrid absorption processes for carbon capture. Ind. Eng. Chem. Res. 2020, 59, 2005–2012. [Google Scholar] [CrossRef]
  79. Rashid, T.U. Ionic liquids: Innovative fluids for sustainable gas separation from industrial waste stream. J. Mol. Liq. 2021, 321, 114916. [Google Scholar] [CrossRef]
  80. Kazmi, B.; Raza, F.; Taqvi, S.A.A.; Ali, S.I.; Suleman, H. Energy, exergy and economic (3E) evaluation of CO2 capture from natural gas using pyridinium functionalized ionic liquids: A simulation study. J. Nat. Gas Sci. Eng. 2021, 90, 103951. [Google Scholar] [CrossRef]
  81. Hospital-Benito, D.; Lemus, J.; Moya, C.; Santiago, R.; Paramio, C.; Palomar, J. Aspen plus supported design of pre-combustion CO2 capture processes based on ionic liquids. Sep. Purif. Technol. 2022, 290, 120841. [Google Scholar] [CrossRef]
  82. Haider, J.; Qyyum, M.A.; Kazmi, B.; Ali, I.; Nizami, A.-S.; Lee, M. Simulation study of deep eutectic solvent-based biogas upgrading process integrated with single mixed refrigerant biomethane liquefaction. Biofuel Res. J. 2020, 7, 1245. [Google Scholar] [CrossRef]
  83. Ma, T.; Wang, J.; Du, Z.; Abdeltawab, A.A.; Al-Enizi, A.M.; Chen, X.; Yu, G. A process simulation study of CO2 capture by ionic liquids. Int. J. Greenh. Gas Control. 2017, 58, 223–231. [Google Scholar] [CrossRef]
  84. Leonzio, G.; Zondervan, E. Surface-Response Analysis for the Optimization of a Carbon Dioxide Absorption Process Using [hmim][Tf2N]. Processes 2020, 8, 1063. [Google Scholar] [CrossRef]
  85. Tomé, L.C.; Marrucho, I.M. Ionic liquid-based materials: A platform to design engineered CO2 separation membranes. Chem. Soc. Rev. 2016, 45, 2785–2824. [Google Scholar] [CrossRef]
  86. Wang, J.; Song, Z.; Cheng, H.; Chen, L.; Deng, L.; Qi, Z. Multilevel screening of ionic liquid absorbents for simultaneous removal of CO2 and H2S from natural gas. Sep. Purif. Technol. 2020, 248, 117053. [Google Scholar] [CrossRef]
  87. Ma, Y.; Gao, J.; Wang, Y.; Hu, J.; Cui, P. Ionic liquid-based CO2 capture in power plants for low carbon emissions. Int. J. Greenh. Gas Control. 2018, 75, 134–139. [Google Scholar] [CrossRef]
  88. Pilorgé, H.; McQueen, N.; Maynard, D.; Psarras, P.; He, J.; Rufael, T.; Wilcox, J. Cost Analysis of Carbon Capture and Sequestration of Process Emissions from the U.S. Industrial Sector. Environ. Sci. Technol. 2020, 54, 7524–7532. [Google Scholar] [CrossRef] [PubMed]
  89. AlNouss, A.; McKay, G.; Al-Ansari, T. A techno-economic-environmental study evaluating the potential of oxygen-steam biomass gasification for the generation of value-added products. Energy Convers. Manag. 2019, 196, 664–676. [Google Scholar] [CrossRef]
  90. Hospital-Benito, D.; Lemus, J.; Moya, C.; Santiago, R.; Ferro, V.; Palomar, J. Techno-economic feasibility of ionic liquids-based CO2 chemical capture processes. Chem. Eng. J. 2021, 407, 127196. [Google Scholar] [CrossRef]
  91. Hu, H.; Westover, T.L.; Cherry, R.; Aston, J.E.; Lacey, J.A.; Thompson, D.N. Process simulation and cost analysis for removing inorganics from wood chips using combined mechanical and chemical preprocessing. BioEnergy Res. 2017, 10, 237–247. [Google Scholar] [CrossRef]
  92. Zhu, Z.; Xu, D.; Liu, X.; Zhang, Z.; Wang, Y. Separation of acetonitrile/methanol/benzene ternary azeotrope via triple column pressure-swing distillation. Sep. Purif. Technol. 2016, 169, 66–77. [Google Scholar] [CrossRef]
  93. Mota-Martinez, M.T.; Hallett, J.P.; Mac Dowell, N. Solvent selection and design for CO2 capture–how we might have been missing the point. Sustain. Energy Fuels 2017, 1, 2078–2090. [Google Scholar] [CrossRef]
  94. Mota-Martinez, M.T.; Brandl, P.; Hallett, J.P.; Mac Dowell, N. Challenges and opportunities for the utilisation of ionic liquids as solvents for CO2 capture. Mol. Syst. Des. Eng. 2018, 3, 560–571. [Google Scholar] [CrossRef]
  95. Akinola, T.E.; Oko, E.; Wang, M. Study of CO2 removal in natural gas process using mixture of ionic liquid and MEA through process simulation. Fuel 2019, 236, 135–146. [Google Scholar] [CrossRef]
  96. Seo, K.; Tsay, C.; Edgar, T.F.; Stadtherr, M.A.; Baldea, M. Economic Optimization of Carbon Capture Processes Using Ionic Liquids: Toward Flexibility in Capture Rate and Feed Composition. ACS Sustain. Chem. Eng. 2021, 9, 4823–4839. [Google Scholar] [CrossRef]
  97. Wang, Y.; Ma, K.; Yu, M.; Dai, Y.; Yuan, R.; Zhu, Z.; Gao, J. An improvement scheme for pressure-swing distillation with and without heat integration through an intermediate connection to achieve energy savings. Comput. Chem. Eng. 2018, 119, 439–449. [Google Scholar] [CrossRef]
  98. Haider, J.; Qyyum, M.A.; Kazmi, B.; Zahoor, M.; Lee, M. Simulation study of biomethane liquefaction followed by biogas upgrading using an imidazolium-based cationic ionic liquid. J. Clean. Prod. 2019, 231, 953–962. [Google Scholar] [CrossRef]
  99. De Riva, J.; Suarez-Reyes, J.; Moreno, D.; Díaz, I.; Ferro, V.; Palomar, J. Ionic liquids for post-combustion CO2 capture by physical absorption: Thermodynamic, kinetic and process analysis. Int. J. Greenh. Gas Control. 2017, 61, 61–70. [Google Scholar] [CrossRef]
  100. Li, K.; Wu, W.; Wu, J.; Liang, H.; Zhang, H. Experiments on vapour-liquid equilibrium of CO2-ionic liquid under flow conditions and influence on its refrigeration cycle. Appl. Therm. Eng. 2020, 180, 115865. [Google Scholar] [CrossRef]
  101. Hospital-Benito, D.; Lemus, J.; Moya, C.; Santiago, R.; Palomar, J. Improvement of CO2 capture processes by tailoring the reaction enthalpy of Aprotic N-Heterocyclic anion-based ionic liquids. Chem. Eng. J. Adv. 2022, 10, 100291. [Google Scholar] [CrossRef]
  102. Blanchard, L.A.; Hancu, D.; Beckman, E.J.; Brennecke, J.F. Green processing using ionic liquids and CO2. Nature 1999, 399, 28–29. [Google Scholar] [CrossRef]
  103. Kumar, S.; Cho, J.H.; Moon, I. Ionic liquid-amine blends and CO2BOLs: Prospective solvents for natural gas sweetening and CO2 capture technology—A review. Int. J. Greenh. Gas Control. 2014, 20, 87–116. [Google Scholar] [CrossRef]
  104. Xie, Y.; Zhang, Y.; Lu, X.; Ji, X. Energy consumption analysis for CO2 separation using imidazolium-based ionic liquids. Appl. Energy 2014, 136, 325–335. [Google Scholar] [CrossRef]
  105. Shankar, N.; Sivasubramanian, V.; Arunachalam, K. Steady state optimization and characterization of crude oil using Aspen HYSYS. Pet. Sci. Technol. 2016, 34, 1187–1194. [Google Scholar] [CrossRef]
  106. Lei, Y.; Zhou, Y.; Wei, Z.; Chen, Y.; Guo, F.; Yan, W. Optimal Design of an Ionic Liquid (IL)-Based Aromatic Extractive Distillation Process Involving Energy and Economic Evaluation. Ind. Eng. Chem. Res. 2021, 60, 3605–3616. [Google Scholar] [CrossRef]
  107. Linnhoff, B.; Mason, D.R.; Wardle, I. Understanding heat exchanger networks. Comput. Chem. Eng. 1979, 3, 295–302. [Google Scholar] [CrossRef]
  108. Zoughaib, A. Energy Integration of Continuous Processes: From Pinch Analysis to Hybrid Exergy/Pinch Analysis; Elsevier: Amsterdam, The Netherlands, 2017; pp. 1–53. [Google Scholar] [CrossRef]
  109. Smith, R. State of the art in process integration. Appl. Therm. Eng. 2000, 20, 1337–1345. [Google Scholar] [CrossRef]
  110. Dagde, K.K.; Piagbo, B.K. Using Simulation Modelling to Improve the Performance of Chemical Engineering Processes: Part 1-Industrial Heat Exchanger Network Analysis. Int. J. Pure Appl. Sci. Technol. 2012, 12, 39. [Google Scholar]
  111. El-Halwagi, M.M. Pollution Prevention through Process Integration: Systematic Design Tools; Elsevier: Amsterdam, The Netherlands, 1997. [Google Scholar]
  112. Furman, K.C.; Sahinidis, N.V. A critical review and annotated bibliography for heat exchanger network synthesis in the 20th century. Ind. Eng. Chem. Res. 2002, 41, 2335–2370. [Google Scholar]
  113. Jezowski, J. Heat Exchanger Network Grass Root and Retrofit Design. The Review of The State-of-The Art: Part I. Heat Exchanger Network Targeting and Insight Based Methods of Synthesis. Hung. J. Ind. Chem. 1994, 22, 279–294. [Google Scholar]
  114. Mardini, N.; Bicer, Y. Formic acid synthesis and utilization for solar energy storage through solar-driven chloralkali process and fuel cells. Energy Storage 2021, 3, e235. [Google Scholar] [CrossRef]
  115. Gatti, M.; Martelli, E.; Marechal, F.; Consonni, S. Review, modeling, Heat Integration, and improved schemes of Rectisol®-based processes for CO2 capture. Appl. Therm. Eng. 2014, 70, 1123–1140. [Google Scholar] [CrossRef]
  116. Harkin, T.; Hoadley, A.; Hooper, B. Reducing the energy penalty of CO2 capture and compression using pinch analysis. J. Clean. Prod. 2010, 18, 857–866. [Google Scholar] [CrossRef]
  117. Perevertaylenko, O.Y.; Gariev, A.O.; Damartzis, T.; Tovazhnyanskyy, L.L.; Kapustenko, P.O.; Arsenyeva, O.P. Searches of cost effective ways for amine absorption unit design in CO2 post-combustion capture process. Energy 2015, 90, 105–112. [Google Scholar] [CrossRef]
  118. Momeni, M.; Soltani, M.; Hosseinpour, M.; Nathwani, J. A comprehensive analysis of a power-to-gas energy storage unit utilizing captured carbon dioxide as a raw material in a large-scale power plant. Energy Convers. Manag. 2021, 227, 113613. [Google Scholar] [CrossRef]
  119. Brunner, C.; Slawitsch, B.; Giannakopoulou, K.; Schnitzer, H. Industrial Process Indicators and Heat Integration in Industries; Booklet IEA SHC Task; Joanneum Research: Graz, Austria, 2008. [Google Scholar]
  120. Shemfe, M.B.; Fidalgo, B.; Gu, S. Heat integration for bio-oil hydroprocessing coupled with aqueous phase steam reforming. Chem. Eng. Res. Des. 2016, 107, 73–80. [Google Scholar] [CrossRef]
Figure 1. Top six nations with the greatest CO2 emissions in 2014 (data extracted from [6]).
Sustainability 15 03370 g001
Figure 2. Schematic approach applied for this study.
Sustainability 15 03370 g002
Figure 3. Process model for the simulation.
Sustainability 15 03370 g003
Figure 4. Basis of the cost analysis for all three streams.
Sustainability 15 03370 g004
Figure 5. Cost analysis for an operating life of 20 years for a plant.
Sustainability 15 03370 g005
Figure 6. Actual energy spent (kJ/h) for each stream on utilities.
Sustainability 15 03370 g006
Figure 7. Energy savings (%) for the utilities suggested by Aspen Plus V.11 software.
Sustainability 15 03370 g007
Figure 8. Cost analysis for the utilities for each stream.
Sustainability 15 03370 g008
Figure 9. Cost savings (%) for the utilities suggested by Aspen Plus V.11 software.
Sustainability 15 03370 g009
Figure 10. Composite curve of temperature vs. enthalpy.
Sustainability 15 03370 g010
Figure 11. Detailed heat exchange network (HEN) design selected for least payback amount with pinch lines and cross pinch lines specified.
Sustainability 15 03370 g011
Table 1. Conventional and emerging CO2 capture technologies.
CO2 Separation TechniquesDescriptionExamplesBenefitsDrawbacksCO2 RecoveryEnergy RequirementRef.
AbsorptionA process in which a gas is separated by an absorbent in which it is soluble; hence, solubility is the main factor defining absorption
  • Amine chemical absorption:2-amino-2-methyl-1-propanol (AMP), diethanolamine (DEA), MDEA
  • Alkali–salt systems, also known as hot carbonate
  • Ionic liquids
High purity
Low costs for MEA solvents are reported
Simple design
Less toxic
Easy regeneration
Chemical absorption holds good results in terms of removal efficiency
Methods used to get the equilibrium data for absorption through experiments are typically time-consuming
Amine absorbents are corrosive
MEA absorbent requires high energy during high-temperature absorbent regeneration
Requires waste treatment
Solvent degradation
90–98%4–6 MJ/kgCO2[20,21,22,23]
AdsorptionUsing adsorbents to separate the gas mixtures under variable pressures of temperatures
  • MOFs
    Zeolites and Activated Carbon
Design flexibility
Easy operation
The available adsorbent for CO2 has low selectivity and capacity.
Lower removal efficiency compared to other technologies (absorption and cryogenic)
Temperature Swing Adsorption requires more energy because of additional heat demand compared to other processes.
80–95%2–3 MJ/kgCO2[20,23,24,25,26,27]
Membrane separationMembranes split gases by allowing a mixture of gases to pass through a membrane from one side of the membrane to the other. The concentration gradient created by a high partial pressure on one side of the membrane and a low partial pressure on the other induces this transportation.
  • Polymeric membranes such as polysulfone/cellulose acetate
  • Ceramic membranes
  • Mixed matrix membranes (MMM),
Environmentally friendly technology
Requires less energy
Low cost for operation
Extreme temperatures or harsh chemicals may destroy the membrane
Low removal efficiency and low CO2 purity
Membranes are delicate to residues of sulfur compounds, such as H2S
80–90%0.5–6 MJ/kgCO2[1,23,28,29,30,31,32,33,34,35,36]
Distillation (cryogenic)A separation technique that liquefies the gases and then uses boiling points to achieve high-purity separation
  • Cryogenic air separation units (ASU)
Feasible operation
Design that is environmentally friendly
Due to the low temperature of the gases during liquefaction, the frosting of gases can occur, which can damage the equipment
Corrosion and fouling can occur due to acidic gases
High maintenance costs
>95%6–10 MJ/kgCO2[20,23,37,38,39]
Hydrates separationUtilizes the differential pressure in between gas components to generate hydrates and accomplish segregation in the mixture
  • Clathrate hydrates
Clean process
Free of impurities
Easy to transport
Not good for industrial use in terms of costs
Slow process
Very low temperatures are required to conduct the process
Requires high pressure to operate
99%-[40,41,42,43,44,45]
Table 2. Operating parameters used for each equipment in this study.
EquipmentOperating Input Parameters
LIQSEP (Flash Separator)Temperature: 20 °C, Pressure:15 bar
Mixer-
MP2 (Multistage Compressor)Isentropic, 3 Stages, Discharge Pressure 18 bar
Absorber20 Stages, Column Pressure:15 bar, Packing Type: Flexiring, Material: Metal, Size: 0.625 In, Vendor: KOCH
Flash1 (Flash Column)Temperature: 38.85 °C, Pressure: 2 bar
COMP (Compressor)Isentropic, Discharge Pressure: 30 bar
Cooler1Temperature: 37.5 °C, Pressure: 30 bar
HeaterTemperature: 126.85 °C, Pressure: 2 bar
Flash2 (Flash Column)Temperature: 131.85 °C, Pressure: 0.04 bar
PumpDischarge Pressure: 20 bar
Vaccum PumpDischarge Pressure: 0.04 bar
Cooler2Temperature: 30 °C, Pressure: 20 bar
Total Electric Power Demand13.15 kW
Net Duty364,744.59 kJ/h
Table 3. Compositions for the streams for major gases before IL absorption.
Inlet Stream No.CH4 Composition (%)CO2 Composition (%)H2S Composition (%)H2O Composition (%)N2 Composition (%)H2 Composition (%)CO Composition (%)
Stream 1564211---
Stream 2831412---
Stream 3583512112
Table 4. Inlet parameters for waste streams.
Stream VariableValue
Pressure, bar15
Temperature, K326
Total Mass Flow kg/h4000
Table 5. CO2 purity (%) using various compositions from industrial waste streams.
Type of IndustryComposition of Feed (%)IL UsedCO2 Purity
(%)
CH4 Purity (%)Ref.
Coal-fired Power Plant N2→78
CO2→13
H2O→1
1-butyl-3-methylimidazolium acetate ([Bmim][Ac])98.7-[57,79]
Natural-Gas (Sweetening Process)CH4→80
CO2→20
3MEPYNTF2≥99≥99[80]
Biomethane LiquefactionCH4→60
CO2→39
H2S→1
[Bmim][PF6]98.599[82]
Model Flue gasO2→3.81
CO2→13.30
N2→71.64
H2O→11.25
[bmim][PF6]
[bmim][BF4]
90
90
-[83]
Coal IndustryN2→84
CO2→12
H2O (vapor)→4
([emim][Ac])99.26-[58]
Flue Gas Ar→0.48
CH4→0.24
H2→37.5
N2→0.33
CO→6.27
CO2→23.87
H2O→30.68
NH3→0.16
H2S→0.47
[hmim][Tf2N]93.7%,-[84]
Natural GasCH4→-
CO2→-
H2S→-
[DePYO] [H2PO4]
[BeMPYO][H2PO4]
[PMMIM] [H2PO4]
[EMIM] [H2PO4]
[BMIM] [MeSO4]
[BMIM] [PF6]
[BMIM] [TCM]
90.73
89.96
88.26
91.42
84.11
85.18
86.64
97.47
97.36
97.21
97.52
97.01
96.86
97.26
[86]
Biogas from sewage sludgeCH4→40–75 vol%
CO2→15–60 vol%
H2O (vapor)→5–10 vol%
Trace→H2S
[C2MIm][Tf2N]
[C6MIm][Tf2N]
[P66614][Tf2N]
Complete removal of CO2 95% CH4 mol frac rich stream[73]
Power PlantN2→78
CO2→12.5
H2O→5
[bmim][Tf2N]94.5-[87]
Mixed Waste Industrial Stream
(Stream 1)
CH4→56
CO2→42
H2O→1
H2S→1
[EMIM][NTF2]99.498.36This Work
Mixed Waste Industrial Stream
(Stream 2)
CH4→83
CO2→14
H2O→2
H2S→1
[EMIM][NTF2]97.998.8This Work
Mixed Waste Industrial Stream
(Stream 3)
CH4→58
CO2→35
H2O→1
H2S→1
N2→1
H2→1
CO→2
[EMIM][NTF2]99.292.1This Work
Table 6. The prices implemented in Aspen Plus.
Utility TypeCosting Rate Inlet Temperature (°C)Outlet Temperature (°C)Pressure (Bar)
Electricity 0.0775 $/kWh---
HP Steam 2.5·10−6 $/kJ25024939.7
Cooling Water 2.12·10−7 $/kJ20251.01
Table 7. Detailed heat exchange network (HEN) design with operating savings and cost index.
DesignBase Case TargetNew Area Cost Index (Cost)Payback (Years)Operating Savings (Cost/s)DTmin (°C)Pinch Temperatures (°C)
Heating Cost Index (Cost/s)0.042670.047470.00165419,95058,6700.0107810HOTCOLD
Heating Load (kJ/h)36,150,00044,010,0001,404,000403.2393.2
Cooling Cost Index (Cost/s)0.027660.033640.001215113.29103.29
Cooling Load (kJ/h)36,350,00044,200,0001,596,000
Area (m2)516.8585.23734
New Area (m2)23.34
Shell8738
New Shell1
Table 8. The Cross-pinch table for HEN design.
HEN Design Cross Pinch403.2/393.2 °C 113.3/103.3 °C
Flash2_Heat_Exchanger (kJ/h)34,556,431.60
B-10_Heat_Exchanger (kJ/h)00
Heater (kJ/h)00
Flash1_Heatexchanger (kJ/h)00
Cooler2 (kJ/h)030,488,804.7
Cooler1 (kJ/h)070,389.4058
E-100(kJ/h)04,190,871.3
Total Network Cross Pinch Load (kJ/h)34,556,431.634,750,065.4
Disclaimer/Publisher’s Note: The statements, opinions and data contained in all publications are solely those of the individual author(s) and contributor(s) and not of MDPI and/or the editor(s). MDPI and/or the editor(s) disclaim responsibility for any injury to people or property resulting from any ideas, methods, instructions or products referred to in the content.

