Abstract
The regional ecological security and sustainable development are impacted by the changing terrain pattern. It is important to investigate the temporal and spatial shifts in coastal city landscape patterns As they have significant directing implications for coastal city landscape pattern improvement. The analytical results of the landscape pattern index of the coastal zone in the Nansha District of Guangzhou are investigated at three levels: patch level scale, type scale, and overall landscape scale, utilizing the method for calculating the LPI, which is based on site type data and land use data for the years 1987 to 2020. The findings indicate that: (1) From 1987 to 2012, Nansha made the landscape patches uniform and continuous, the water patches remained intact, the city expanded more quickly from 2013 to 2020, and the landscape fragmentation increased year by year. As human beings surround coastal zones with various productive activities. The heterogeneity of the center urban landscape is particularly significant, and the spatial pattern of different landscape types and their composition on land tends to be intricate. (2) The shift in arable land, water, and building land is shown by the type-scale landscape index. The development of urbanization causes patches of arable land to lose their dominating status quickly, while water bodies continue to hold the third-place position, and construction land takes its place as the most complex patch. (3) The overall landscape scale index shows that in the Nansha District the patch size of different landscape types increased from 1995 to 2002 before tending to stabilize. This finding suggests that as urbanization accelerated, leading to an overall patch fragmentation increase, composition tended to become more complex. In addition to providing a theoretical framework for investigating the relationship between changes in landscape pattern and ecological processes in the coastal zone, this study identifies a landscape pattern index that can quantify the complexity of the distribution of landscape types in the coastal zone of the Nansha District. We also offer a land use optimization strategy for Nansha’s ecological space and land use, which will serve as methodological guidance and a point of reference for the long-term sustainable development of the urban cluster’s ecological environment based on the fusion of land and water. These recommendations are derived from the study’s results.
1. Introduction
The coastal zone is a unique area for the interplay of land and marine ecosystems, as well as a typical ecologically fragile zone. It also possesses better resource, environmental, and geographical circumstances [1]. The study of landscape pattern and ecological process is known as landscape ecology, and the quantitative analysis of landscape pattern is the cornerstone and key to understanding how pattern and process interact. For this reason, the landscape index used in landscape ecology is a quantitative index that reflects the composition, structure, and spatial configuration of the landscape and allows for multi-scale and multi-spatial comparison [2]. Thus, analyzing the landscape pattern index of the Nansha coastal zone is a way to determine the ecological risk and assess the ecological vulnerability of the Nansha coastal zone, which is very important for the advancement of the theory of spatial planning and the ecological development of spatial planning in the Nansha area.
A landscape pattern is a collection of variously sized and shaped landscape components, as well as spatial patterns structured in various ways, including the quantity, kind, location, and arrangement of the component units [3]. It can visually reflect changes in land use structure, which can be quantified using the landscape pattern index, and has a significant impact on regional ecological services [3,4]. Research on landscape pattern at home and abroad began in the 1950s, represented by European and American countries, focusing on the spatial and temporal evolution characteristics and functional mechanisms of landscape patterns, the relationship between landscape diversity and landscape patterns, and the connection between landscape patterns and urban dynamics, the prediction of landscape pattern and the effect of landscape pattern transformation on ecosystem construction [3,4,5,6]. The main methods include logistic regression model, land change model. For instance (1) Landscape pattern evolution and simulation, using land use state transfer simulation; (2) Building a buffer zone, employing an analytical hierarchy approach, or the scale-effect of a landscape pattern; (3) Creating a library of driving factors, researching dynamic changes in the landscape, and making simulation predictions; (4) Landscape pattern optimization research, constructing a multi-level ecological network with the help of the minimum cumulative resistance model; (5) Landscape pattern and ecological risk combination, using the landscape ecological risk index model. The ecological risk assessment model is an analysis of the vulnerability of the ecological environment exhibited by natural or human activities driven in a certain spatial region, which can better identify the ecological vulnerability in a certain region [3]. Many scholars in China have used gradient circles and sample bands to analyze landscape patterns and explore the gradient differentiation of landscape patterns, as the gradient analysis can better express the spatial distribution pattern of landscape patterns [4]. In this research, the gradient of the Nansha landscape pattern change caused by urbanization is studied by combining the two and tracing its mechanism upward or extending its effect downward, which effectively reveals the gradient characteristics of the Nansha landscape pattern change and its social, economic and ecological effects. For example, Wang Qi used the “stress–sensitivity–resilience” evaluation model to analyze the spatial and temporal changes of landscape patterns and ecological risks in the study area [7,8]. In summary, although scholars at home and abroad have produced fruitful research results, the current research mainly focuses on regional units, such as drylands, cities, forests, wetlands, and agro-pastoral areas, and reveals less about the evolution and characteristics of the landscape pattern of the land–sea interaction zone, and selects a single type of sample zone [9]. This paper selects a different zone, taking the Nansha area as an example, to reveal its landscape pattern characteristics, which is of great significance for the ecological protection of the coastal zone landscape and the optimization of the landscape pattern, and also provides a theoretical basis for the optimization of the territorial spatial pattern of similar areas.
In recent years, the degree of environmental disturbance and the intensity of land exploitation by human activities have rapidly increased [8], changing the regional landscape pattern, affecting the components and structure of the ecosystem, and thus, its functional integrity, while affecting the sustainable development of cities to a certain extent. Coastal cities are located near the sea, and their ecological environment is relatively fragile. The study of the spatial and temporal evolution characteristics of the landscape pattern of coastal cities is important to guide the planning and construction of the city, to achieve the harmonious development of coastal cities, and to understand the natural landscape [8]. The Nansha District as a typical coastal city that is influenced by topography and geomorphology, natural climate and anthropogenic activities; the spatially differentiated configuration of the landscape pattern is obvious. Studying the overall characteristics and differentiation pattern of its landscape pattern, combined with quantifying the landscape pattern index, is conducive to recognizing the ecological landscape succession and mechanism, assessing the ecological vulnerability, and then predicting its future change trend, which has important guiding significance for landscape ecological planning of coastal cities.
1.1. Study Area Overview and Data Sources
Study Area Overview
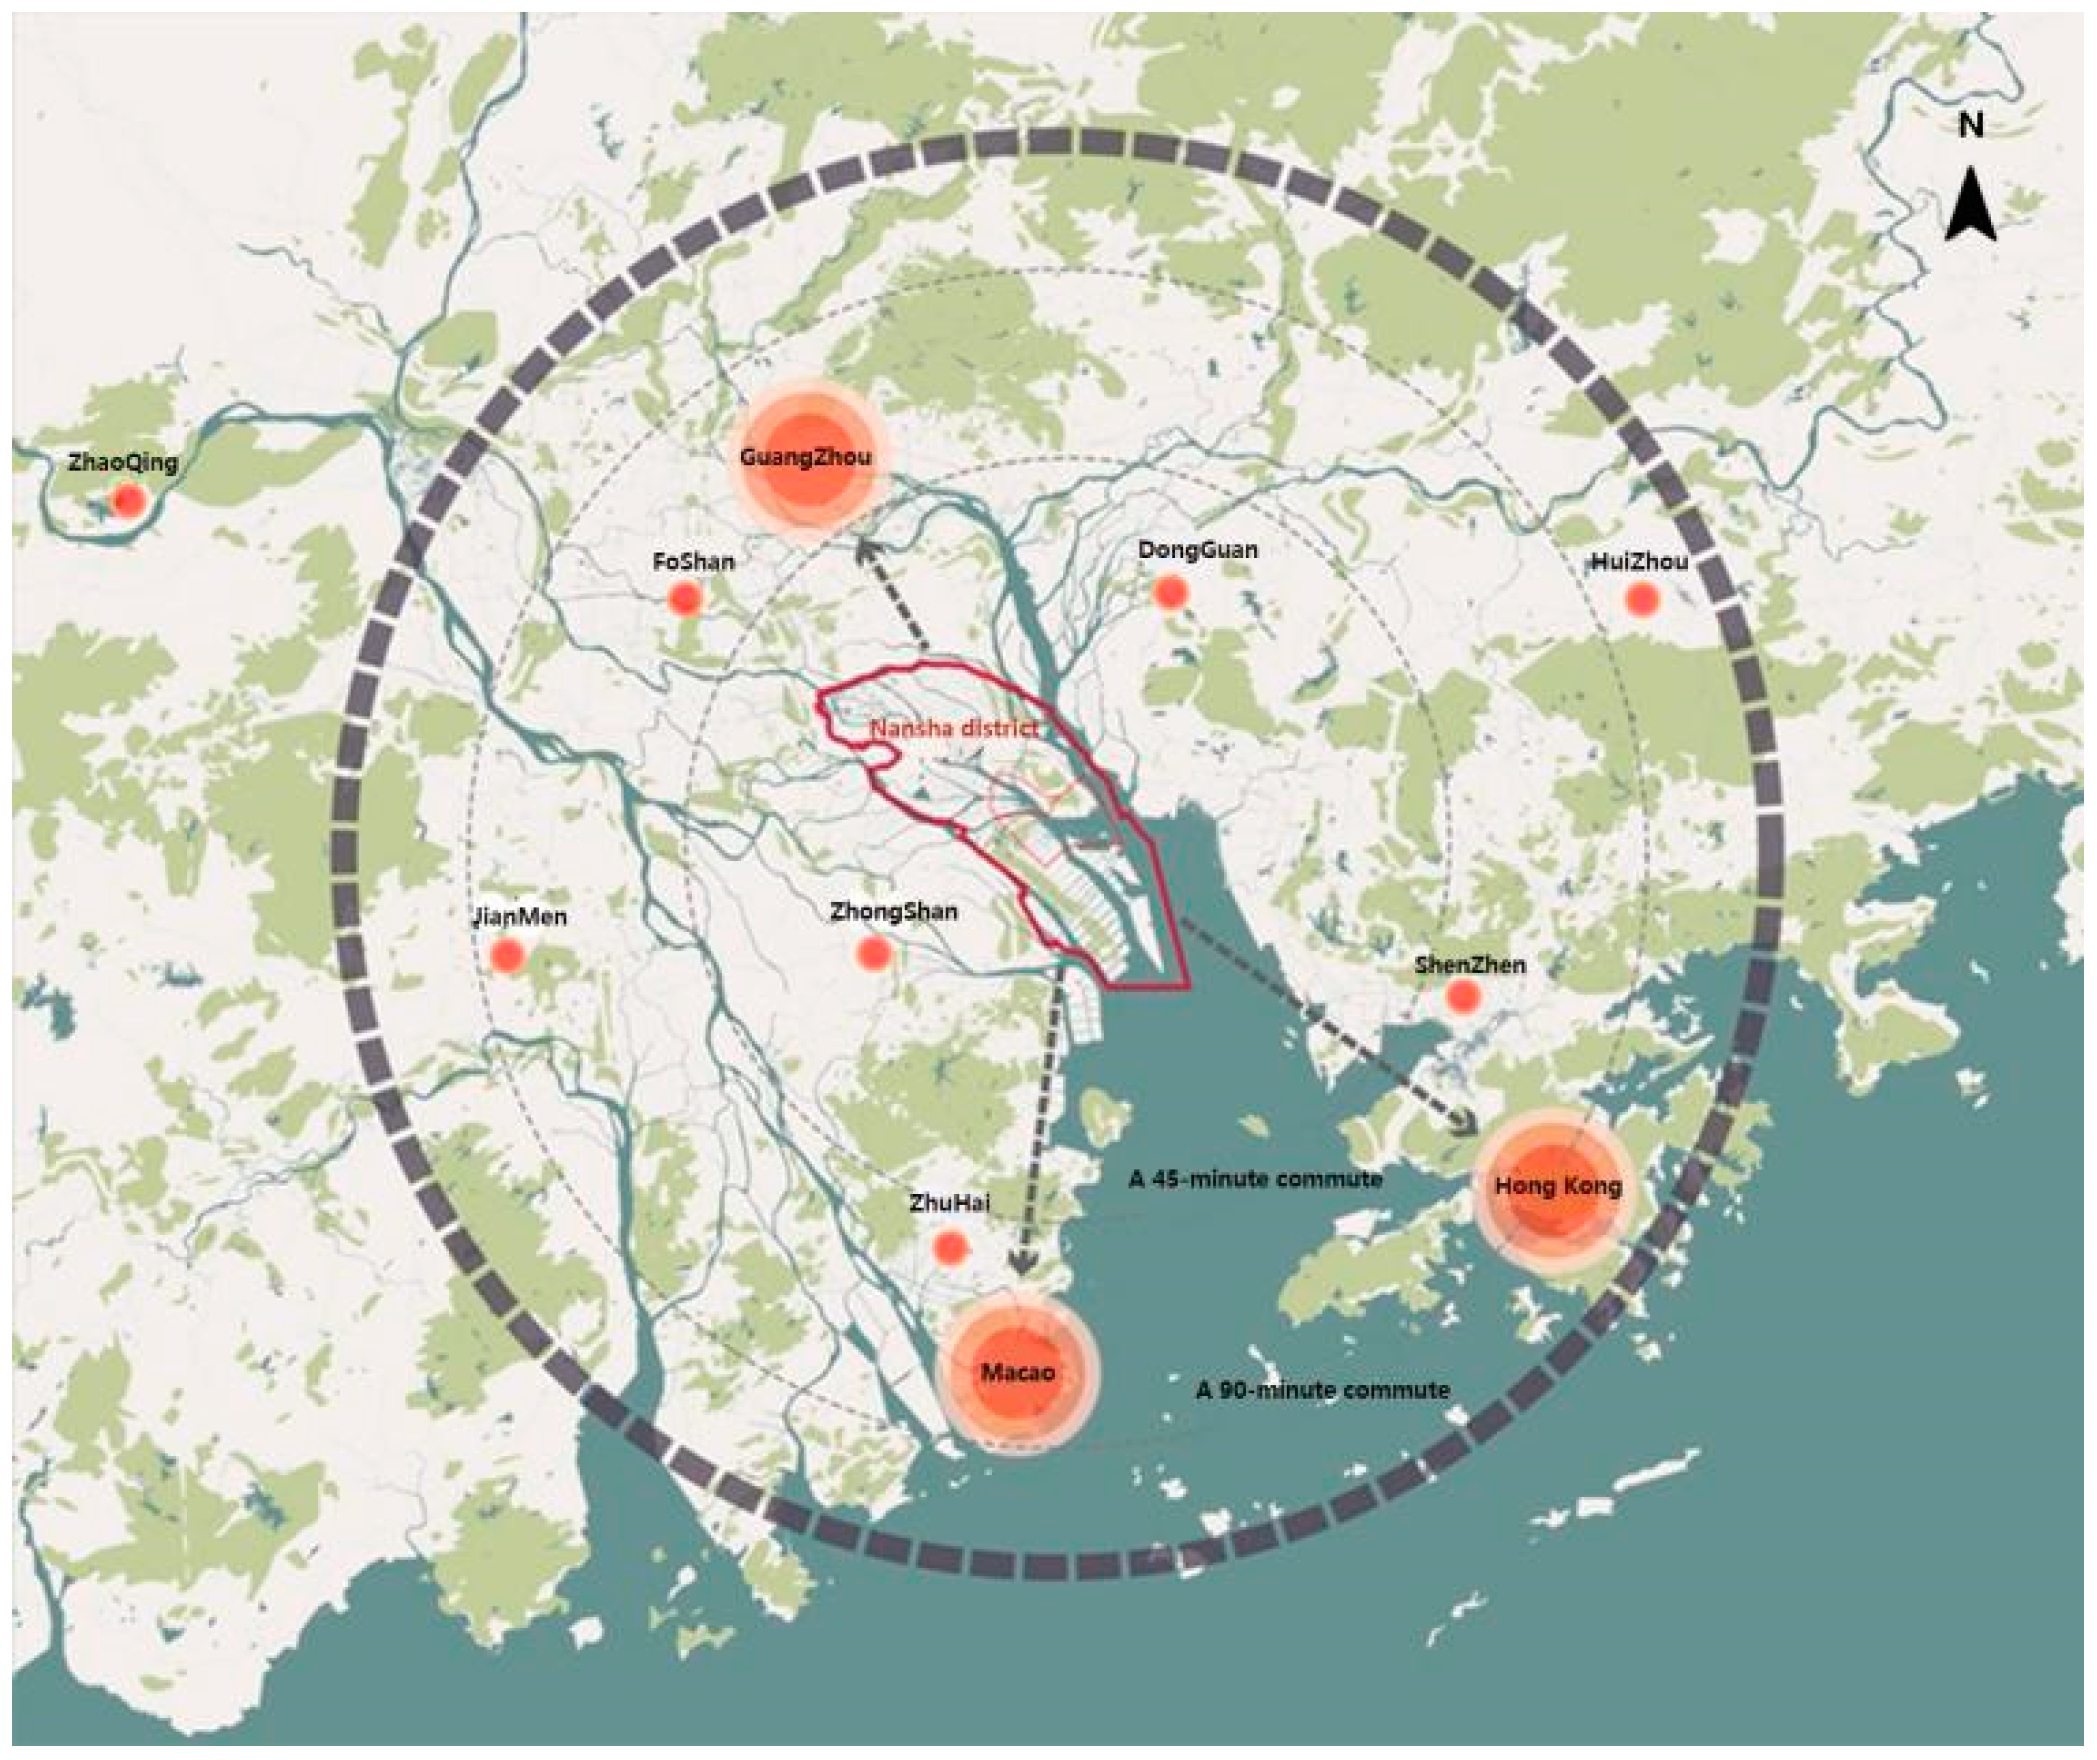
The Nansha District is the geographic center of the Guangdong–Hong Kong–Macao Greater Bay Area and the urban sub-center of Guangzhou. It is located at the southernmost tip of Guangzhou City and on the west bank of the Humen Waterway of the Pearl River, where the Xijiang, Beijiang and Dongjiang rivers converge. Nansha is also an important platform for the implementation of the Belt and Road Strategy, an important gateway for Guangdong, Hong Kong, and Macao to participate in the development of the mainland, and an important platform to help Guangdong, Hong Kong, and Macao solve their problems [8]. Therefore, Nansha District has assumed an important role in the Guangdong–Hong Kong–Macao Greater Bay Area as a high-level external gateway to the Guangdong–Hong Kong–Macao Greater Bay Area, a demonstration area for innovation and development in the Guangdong–Hong Kong–Macao Greater Bay Area, and a platform for financial services in the Guangdong–Hong Kong–Macao Greater Bay Area (Figure 1).
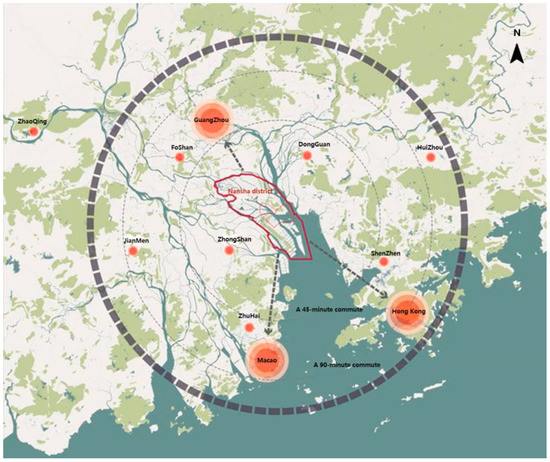
Figure 1.
Research Area Location (self-drawn; introduces regional architecture in the study area, clear research value).
1.2. Data sources and Processing
1.2.1. Data Sources
To meet the criteria of the study period covering 1987–2020, the two data sources of land use we used were satellite remote sensing data and UAV orthophoto data. The geospatial data cloud and open source Landsat satellite imagery offered by the Glovis website for the time periods 1987–2002 and 2003–2020, respectively, were used to analyze the land use data.
1.2.2. Data Processing
By trimming and supplementing the satellite pictures’ and land use data’s edges, the entire administrative region of Nansha was created.
The Third National Land Use Survey data from 2002, which had the closest temporal distribution, were combined with the satellite images to determine the land use types, using supervised classification provided by ENVI (environment for visualizing images), pre-processing such as geometric correction, and accuracy determination to ensure the correct classification rate of over 70%.
Unreasonable parcels are logically inferred from the site type data under various slices that were collected from the decoding and then updated in accordance with their site attributes in the prior and subsequent time periods.
Additionally, because the land use data projection is GUANGZHOU2000 and the land use data projection derived from the interpretation of open-source satellite images is UTM 49N, there is a geographical location offset between them. To account for this, spatial alignment is used in the operation. According to the geographical boundaries of the Nansha District, defined using the artificial division of the coastal zone boundary, data on land use types inside the coastal zone were retrieved. All land use types were then cropped.
2. Research method
2.1. Generating the Sample Band Gradient
This study mainly uses the literature research, summarized method, field survey method, data methods such as spatial analysis, comprehensive research and evaluation, and through the same kind of landscape at home and abroad for reference, the policy practice of the advanced region, the Nansha coastal zone landscape ecological strategy is put forward. Comprehensive consideration is given to the impact of topography and geomorphology, as well as urban and economic growth on the landscape pattern of the research region, and this serves as the foundation for the sample zone division [10]. Setting the sample zone gradient zone can help us analyze the sample zone gradient change pattern of the coastal urban landscape pattern and extend the coastal zone toward the central city of the Nansha District; that is, according to the various topographic and geomorphological characteristics of the region, combined with the features of the marine—coastal zone—urban landscape of the Nansha District, the maximum extent of coverage of the land use types is classified. Considering the research scale and purpose, the activity range of the coastal zone transect studied in this paper is shown in Figure 2. It is divided into land use and land type data, and using the Fragstats software, it is analyzed to reflect the landscape differentiation characteristics of the coastal zone in the Nansha District and its impact on the city, as well as to research the influence of the sea on human activities. This provides a better quantitative analysis of the change of landscape pattern index in different areas.
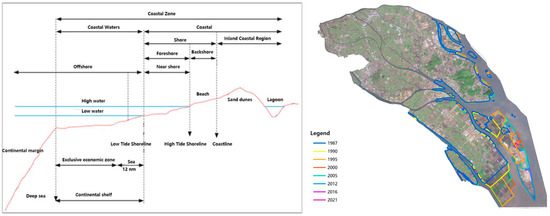
Figure 2.
Scope of the research (drawn according to research data).
2.2. Coastal Zone Landscape Deconstruction
By combining the landscape characteristics of the Nansha District, this study identifies the following six landscape types based on the categorization system of landscape types in the landscape pattern developed by domestic and international experts. Additionally, this study mainly focuses on the research and analysis of these six types (Table 1). As shown below: (1) Corpland and and garden land; (2) Forestland; (3) Grassland and green land; (4) Waters; (5) Building land; (6) Other land.

Table 1.
Classification of coastal landscape in Nansha District (redrawn according to research data; clearly summarizes what is involved in the landscape type studied).
2.3. Landscape Pattern Index Selection
The three levels of analysis for landscape pattern indices are: (i) Patch-level scale (Patch); (ii) Type scale (Class); (iii) Overall landscape scale. Combined with the preference for the use of landscape indices in the existing literature, the landscape index was selected, as well as the classification framework and ecological significance of the landscape indices provided by the Fragstats landscape pattern index calculation software developed by the Department of Forest Science at Oregon State University, USA [11]. See the Supplementary Materials for details.
3. Research Results
3.1. Landscape Category Area Change
Through research, it was established that in the Nansha District, there has only been a positive increase in construction land and green land between 1987 and 2020, whereas there has been a significant negative growth in crops, forestland, and waterways.
This shows that during urbanization, building land encroached greatly on agriculture and forestland; grassland and green land were planned for and planted to construct an urban green land system, and waters were significantly developed (Table 2). Therefore, the follow six types of area change characteristics, lay the foundation for the research on ecological protection strategies in the Nansha District.
Table 2.
Area change of landscape types in Nansha District 1987–2020 (drawn from land survey data).
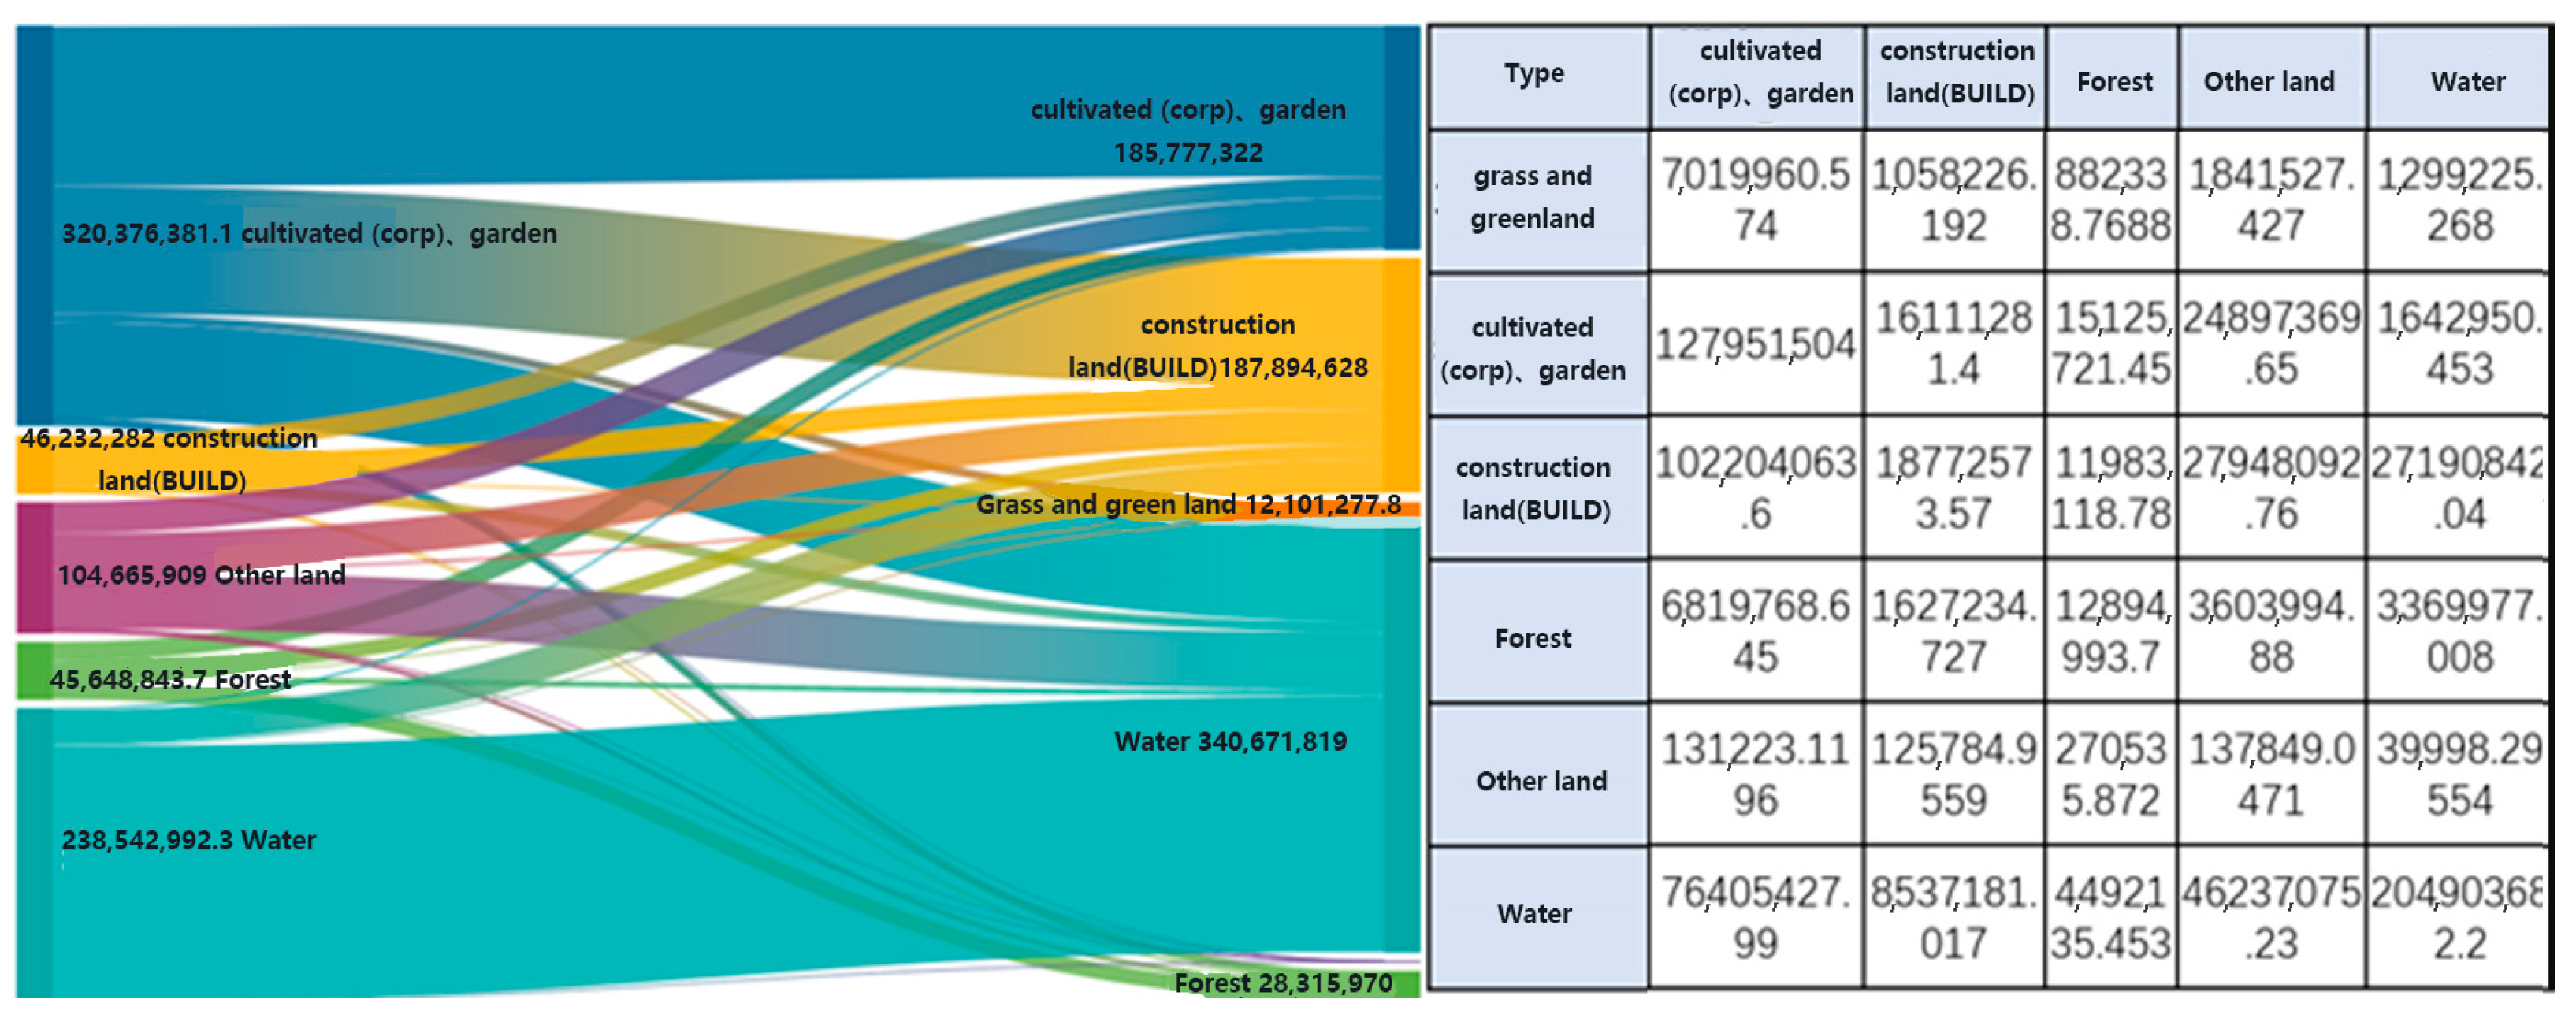
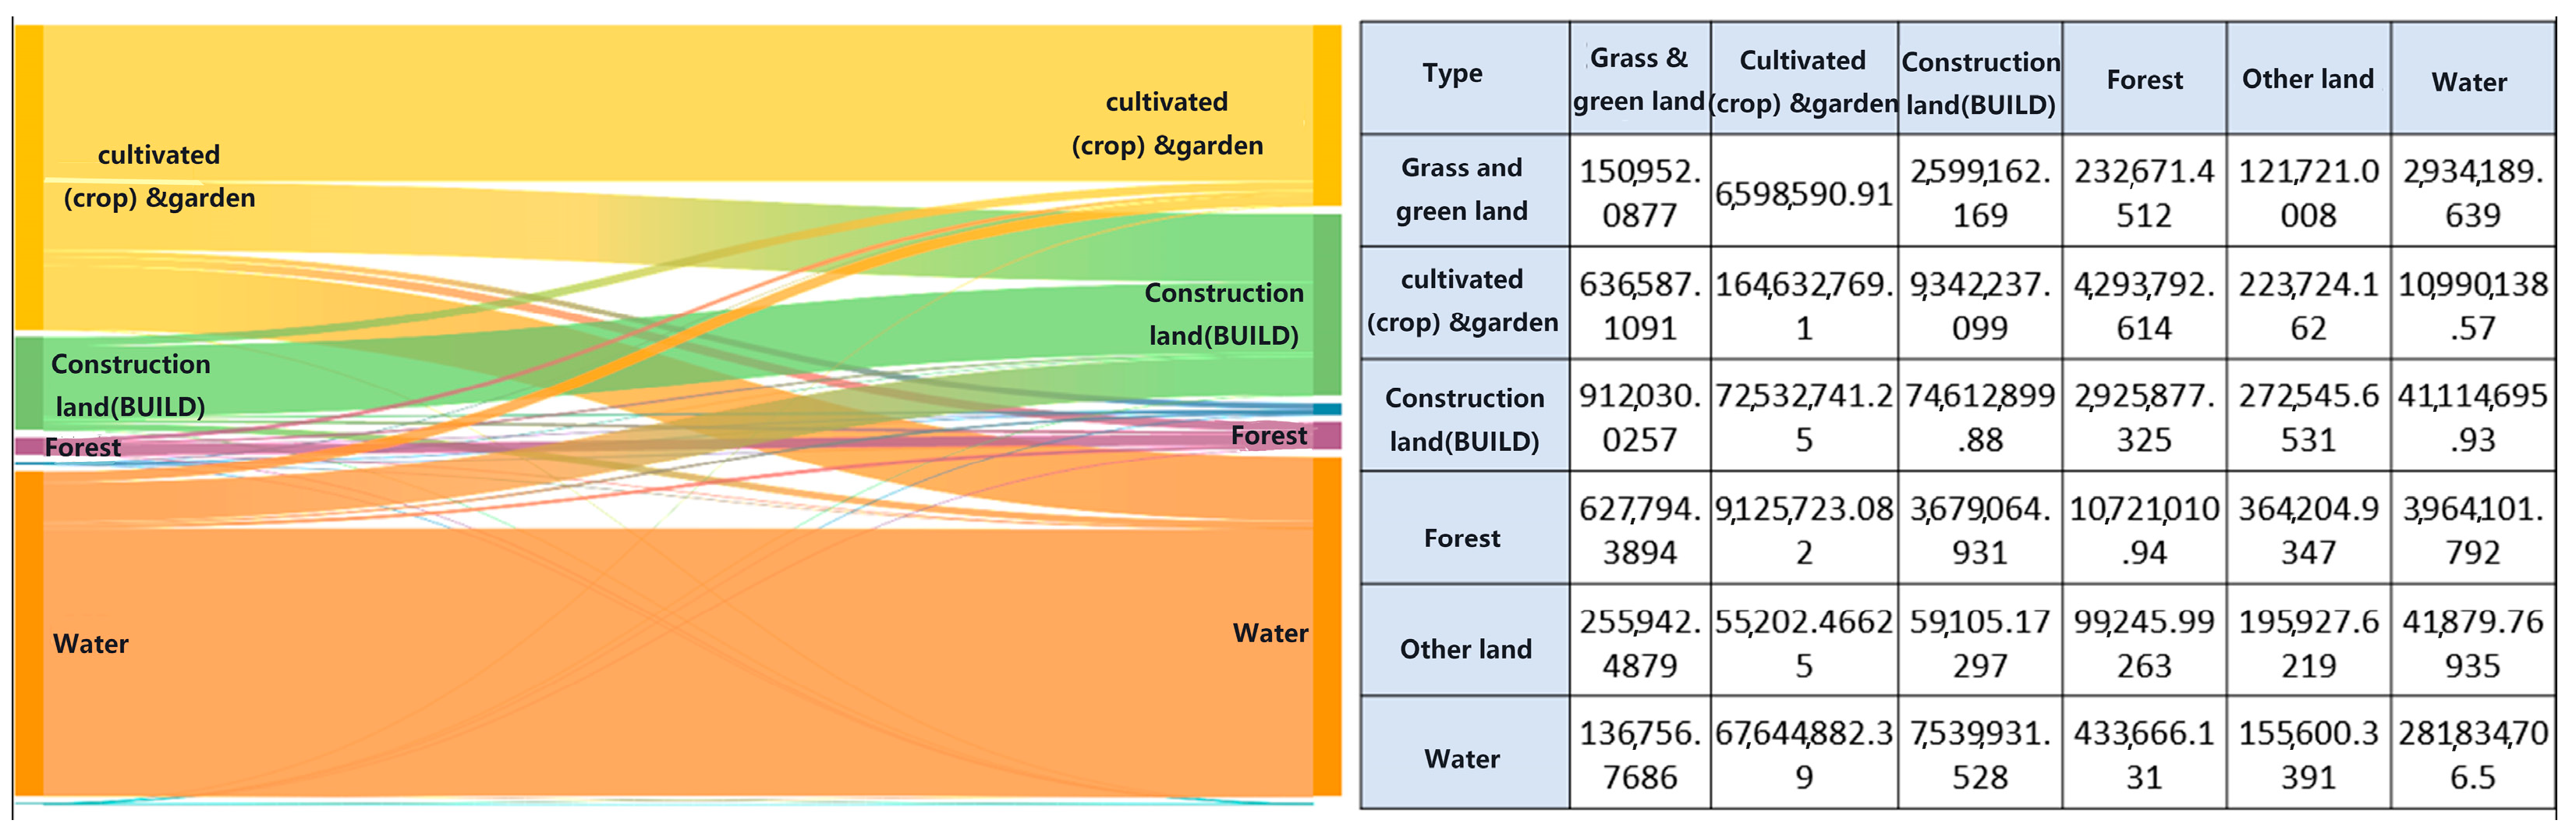
It is difficult to capture the flow direction and intermediate process of landscape type transformation from the first to the last changes in land area. Figure 3 shows the land use transfer matrix of the Nansha District, which shows that a large amount of cropland has been transferred to building land, urban green land, and waters since 1987, and only a small amount of cropland has been supplemented by building land and other land. A large amount of foresland has been transferred to cropland and building land. Only a small amount of water area has been transferred to building land, grassland and green land. The waters are well preserved. If we take 2002 as the starting point of observation, the conversion of land use types is mainly reflected in the large number of cropland and gardens being developed into building land, and thus, a significant reduction in area or a return to waters. The large increase in building land comes mainly from the development of and encroachment on waters, cropland, and forestland. The area of waters has not changed much, with some waters being converted to building land, but some gardens becoming waters as a supplement.
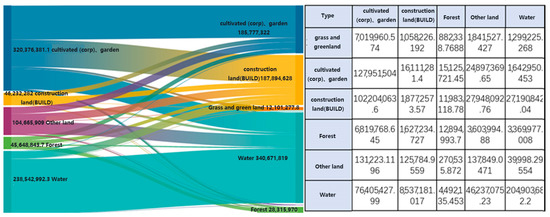
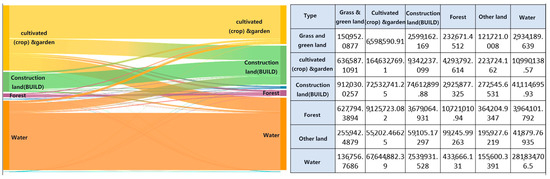
Figure 3.
Landscape type shift (1987–2020 and 2002–2020).
3.2. Spatial Characteristics of Landscape Categories
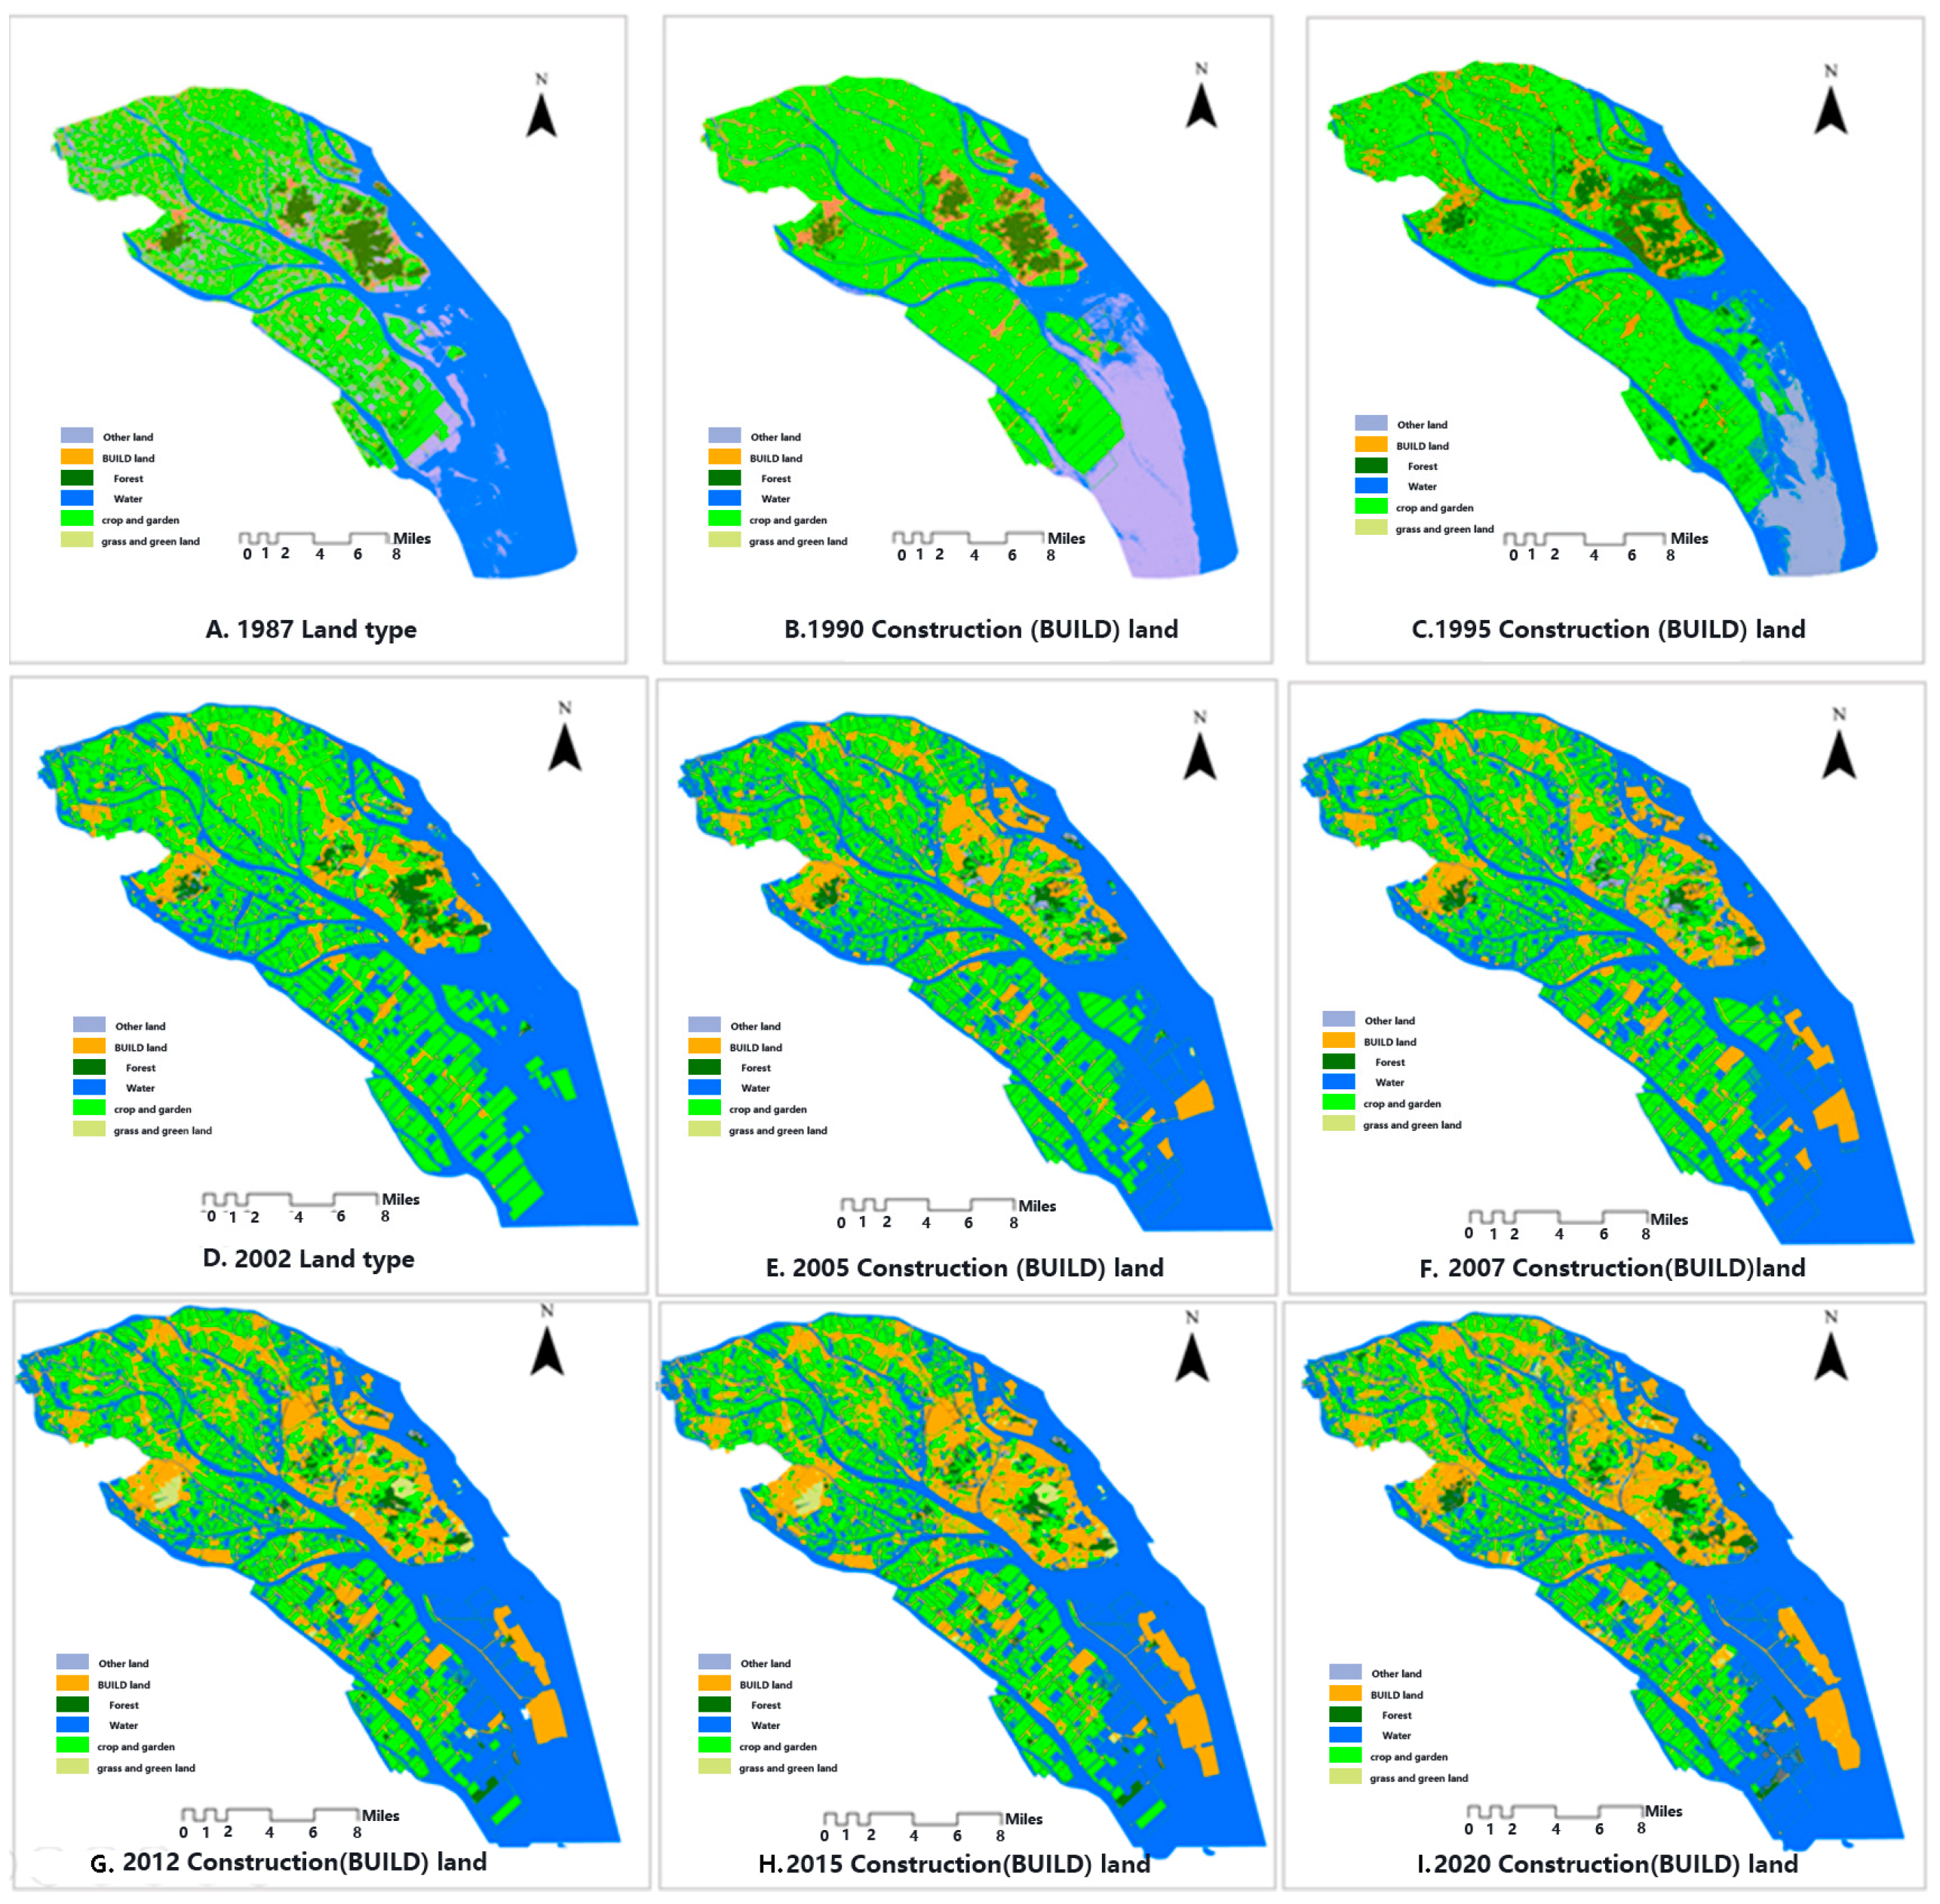
The spatial distribution of landscape categories reflects the changes of the whole landscape pattern [12]. Figure 4 shows: (A) Types of land use in 1987; (B) Types of land use in 1990; (C) Types of land use in 1995; (D) Types of land use in 2002; (E) Types of land use in 2005; (F) Types of land use in 2007; (G) Types of land use in 2012; (H) Types of land use in 2015; (I) Types of land use in 2020. The main evolution characteristics are as follows:Before the year 2000,which is A to C, the Nansha District showed the characteristics of two main types: water area and cropland. Only the mountains around the Huangshanlu Forest Park and Eighteen Luohan Forest Park had forest land distribution, and the building land was built by the mountains. After the year 2000,which is D to I, the construction land began to expand rapidly, especially around Huangshanlu; the central city of Nansha expanded rapidly in all directions, spreading all the way to Huangge Town; at the same time, Dongchong and Dagang in the north also underwent obvious expansion, and the road network skeleton between the groups was gradually formed.
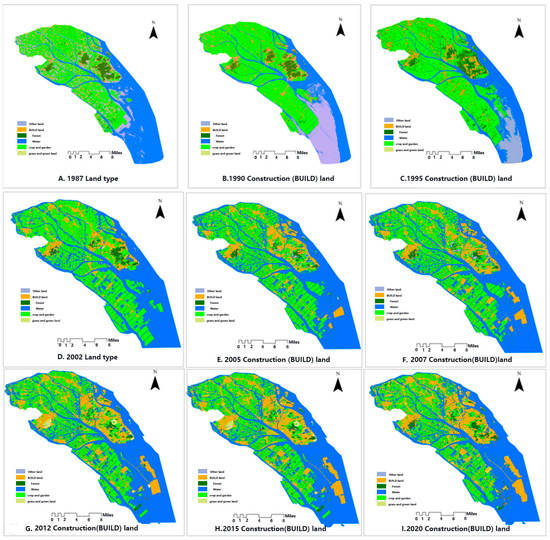
Figure 4.
Evolution of landscape types in Nansha District (self-drawn from satellite remote sensing data).
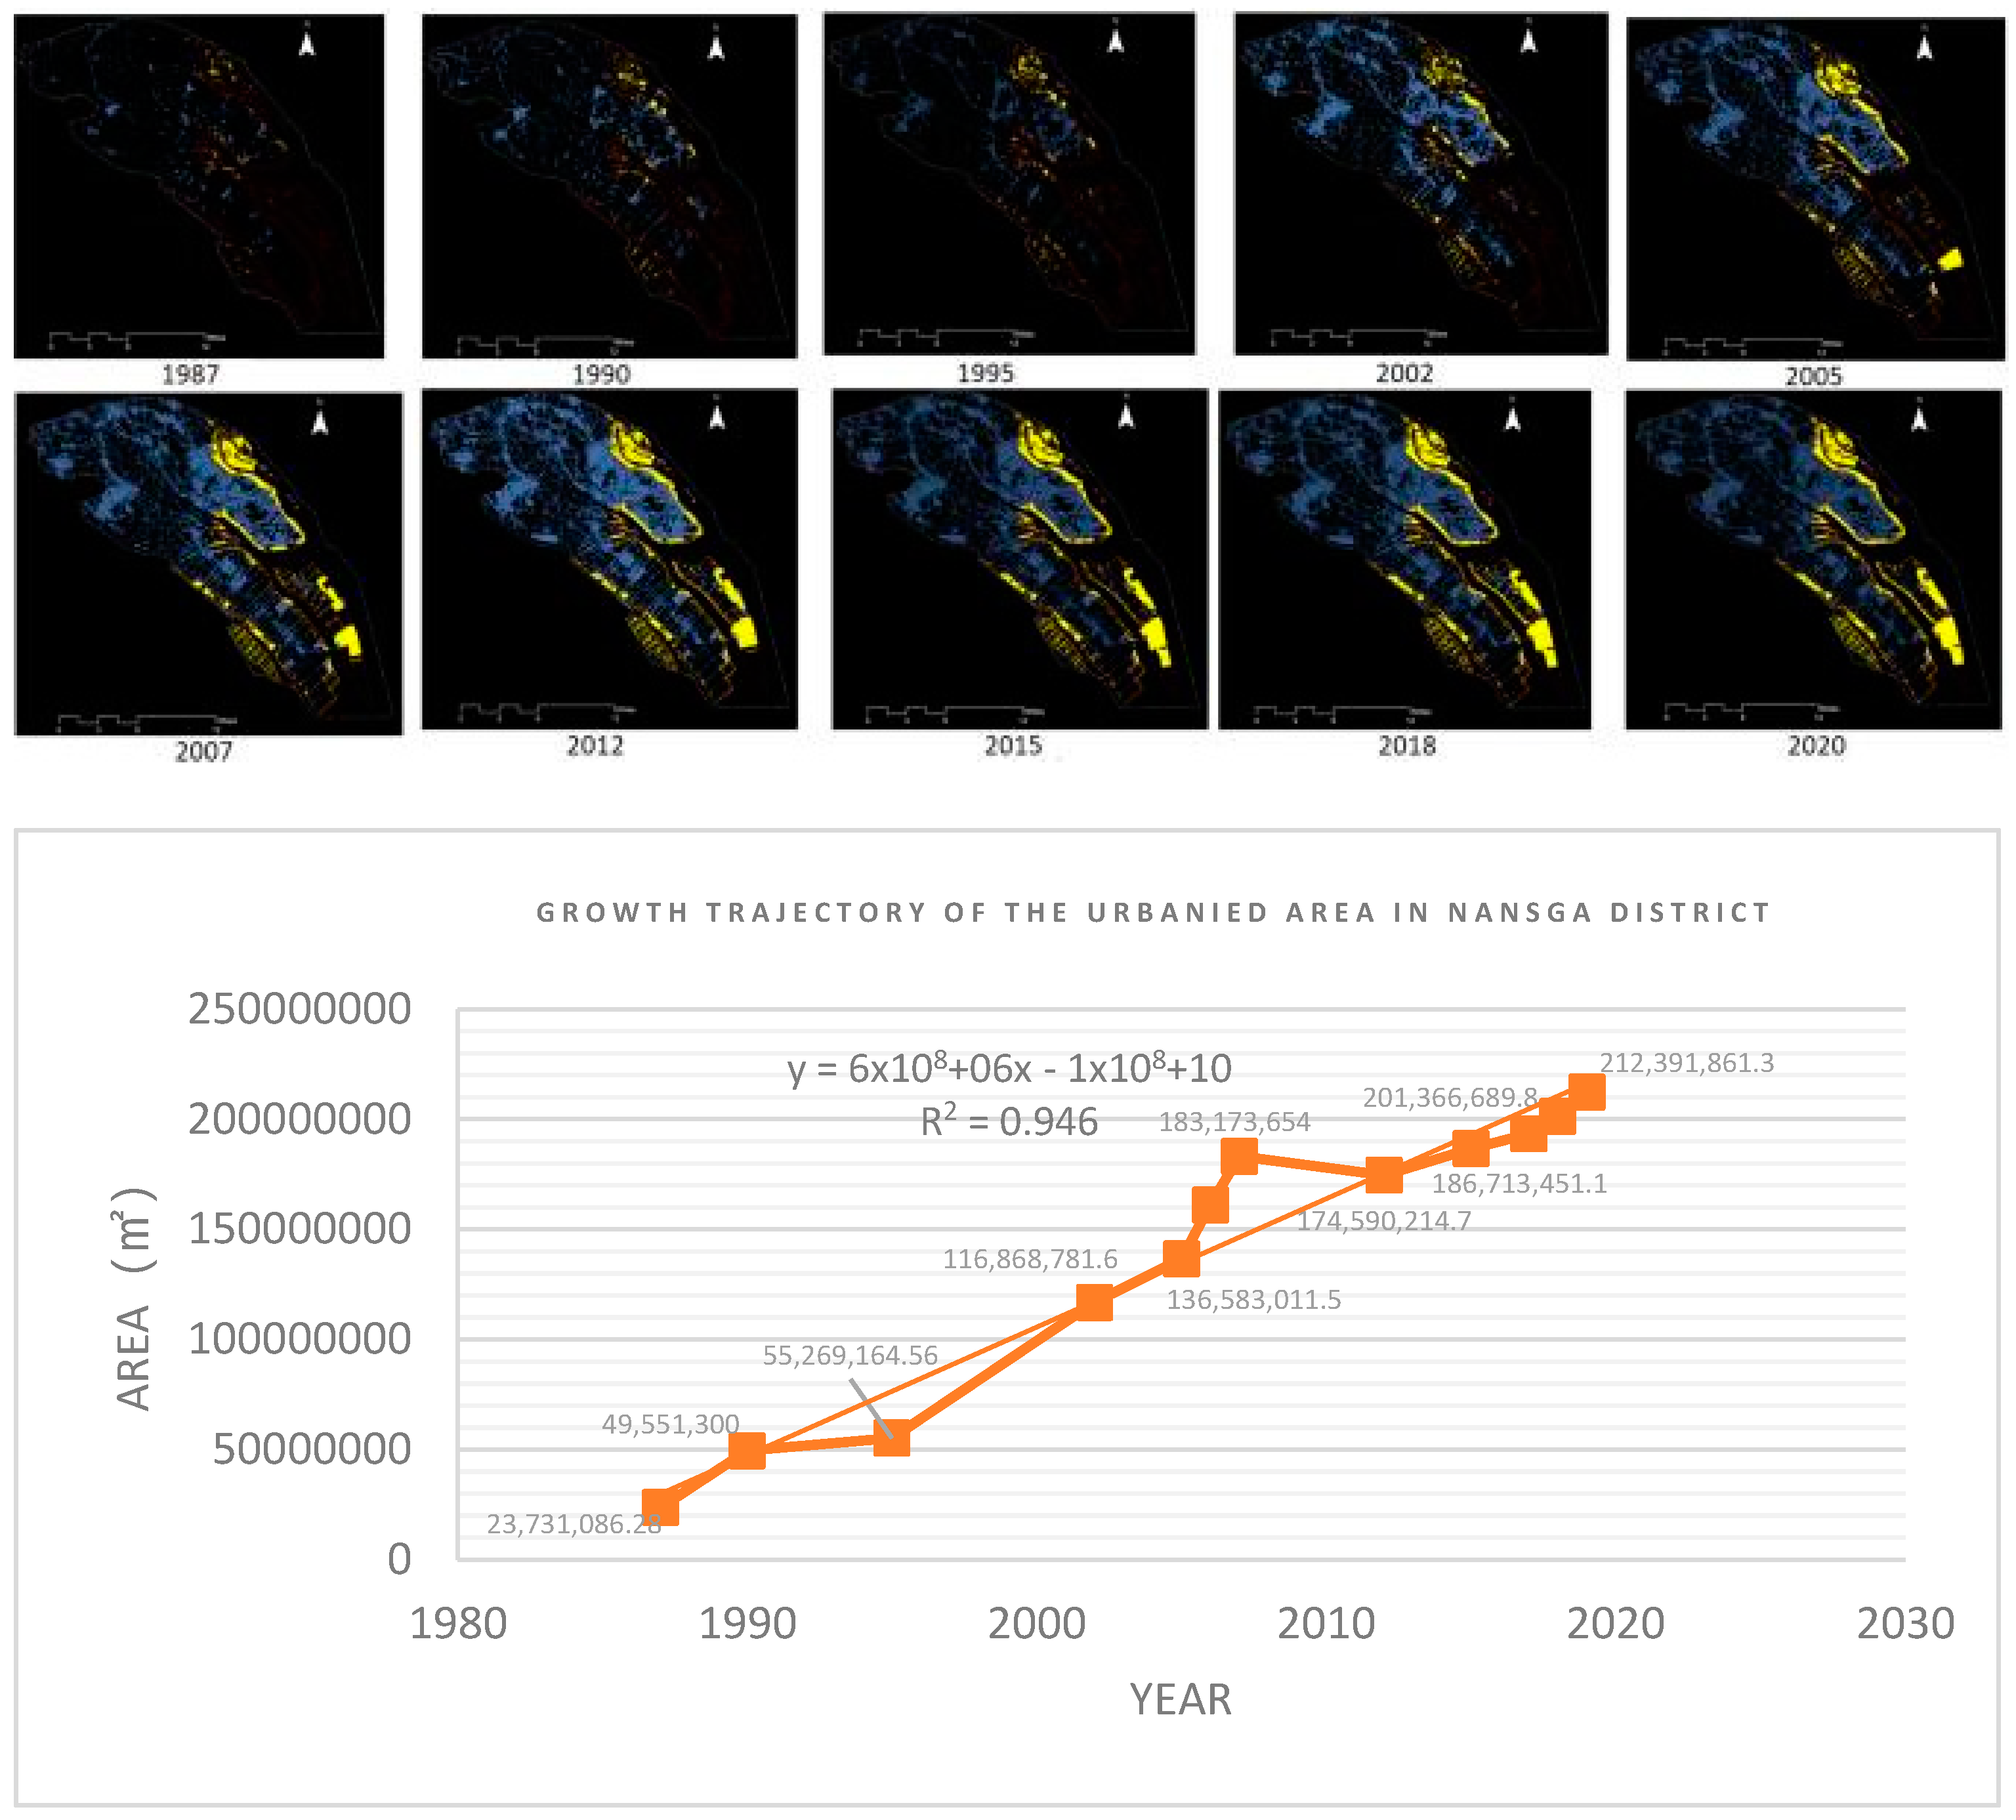
The growth of building land area visually reflects the whole process of Nansha’s development. Figure 5 shows the area under construction in 1987, 1990, 1995, 2002, 2005, 2007, 2012, 2015, 2018, 2020; Before the year 2000, the building land area was small and grew slowly, and from 2000 to 2010, the building land area grew rapidly, especially from 2005 to 2008, which was a period of rapid expansion. It reached the peak of construction land area around 2008. Before 2008, the expansion of building land in the Nansha District entered a stable period, and the growth rate slowed down, and after 2019 there has been a trend of growth rate development again.
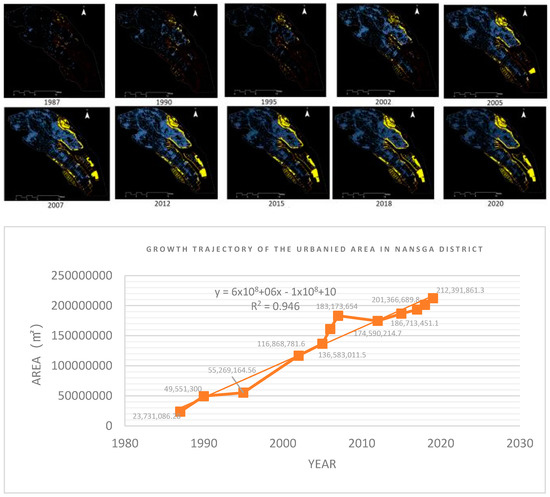
Figure 5.
Growth trajectory of the urbanized area in Nansha District (drawn from data).
3.3. Landscape Pattern Index Analysis
3.3.1. Calculation Results of the Patch-Scale Landscape Index
Based on the calculation of the patch scale landscape index of Nansha, it can be concluded that (Figure 6): (1) The patch area reveals that from 1987 to 2005, the patch area was large and complete, and from 2012 to 2020, except for the water patch, all other patches decreased in the area and gradually tended to fragmentation. (2) The radius of gyration reveals that from 1987 to 2012, the patches were homogeneous and continuous throughout the area, and from 2013 to 2020, due to anthropogenic development. (3) The patch continuity contiguity index reveals that there was no obvious spatial difference between the patches in 1987–2011, and they were all at large values, which proves that the continuity of the image elements under the same patch is good. (4) During 2012–2020, the areas of Nansha’s central cities, Huangge and Wanha Sha on the north and south shores obtain the core area, revealing that the core area decreasing from 1987 to 2020, and is more susceptible to edge effects and increased fragmentation. (5) The edge contrast index (ECON) reveals that the adjacent patches have large contrast. The proximity index (PROX) and similarity index (SIMI) reveal that the proximity index of the patches located on land in the Nansha District continues to change. (6) The proximity index (PROX) revealed that the proximity index of each patch located on land in the Nansha area decreased, while the proximity of water patches increased. (7) The similarity index (SIMI) is the same as the proximity index (PROX). Therefore, urbanization construction and ecological protection of water landscape are the research topics of sustainable development in the Nansha District.
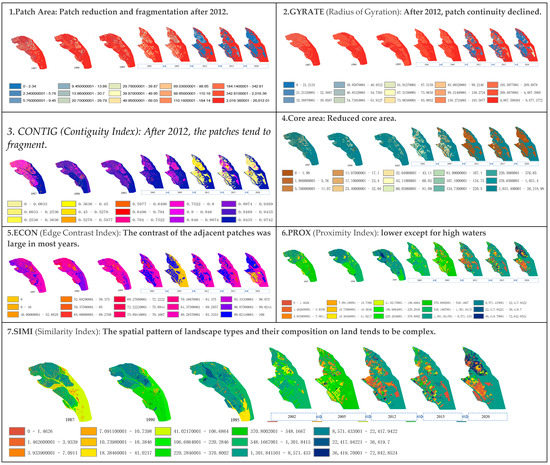
Figure 6.
Table of calculation results of patch-scale landscape index (self-drawn).
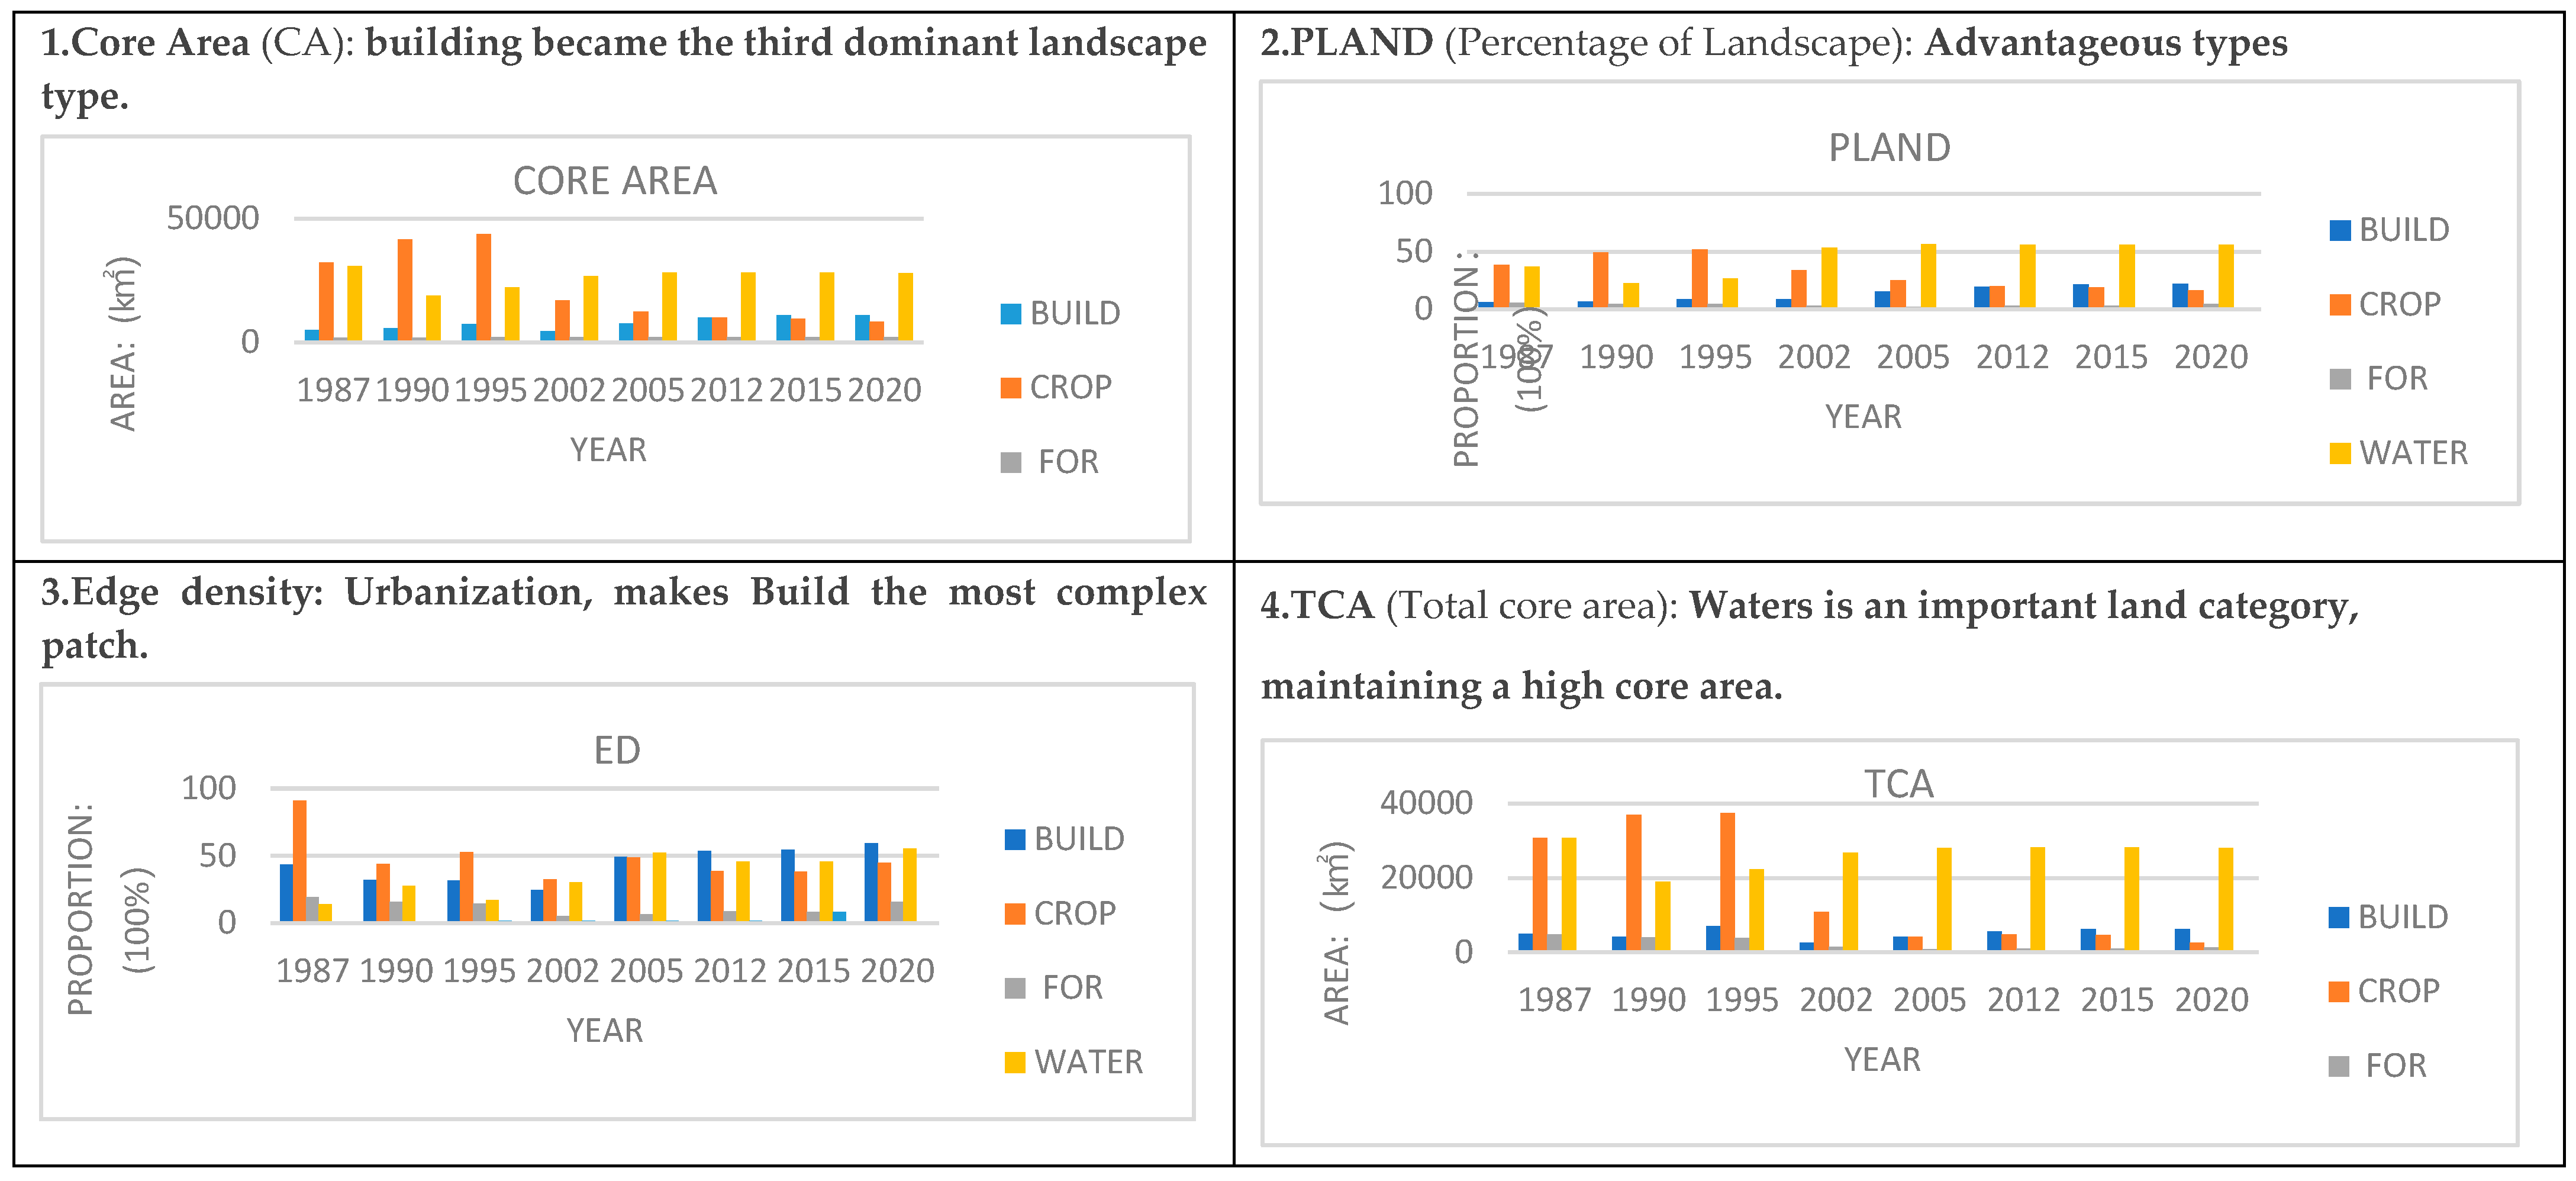
3.3.2. Class-Scale Landscape Index Calculation Results
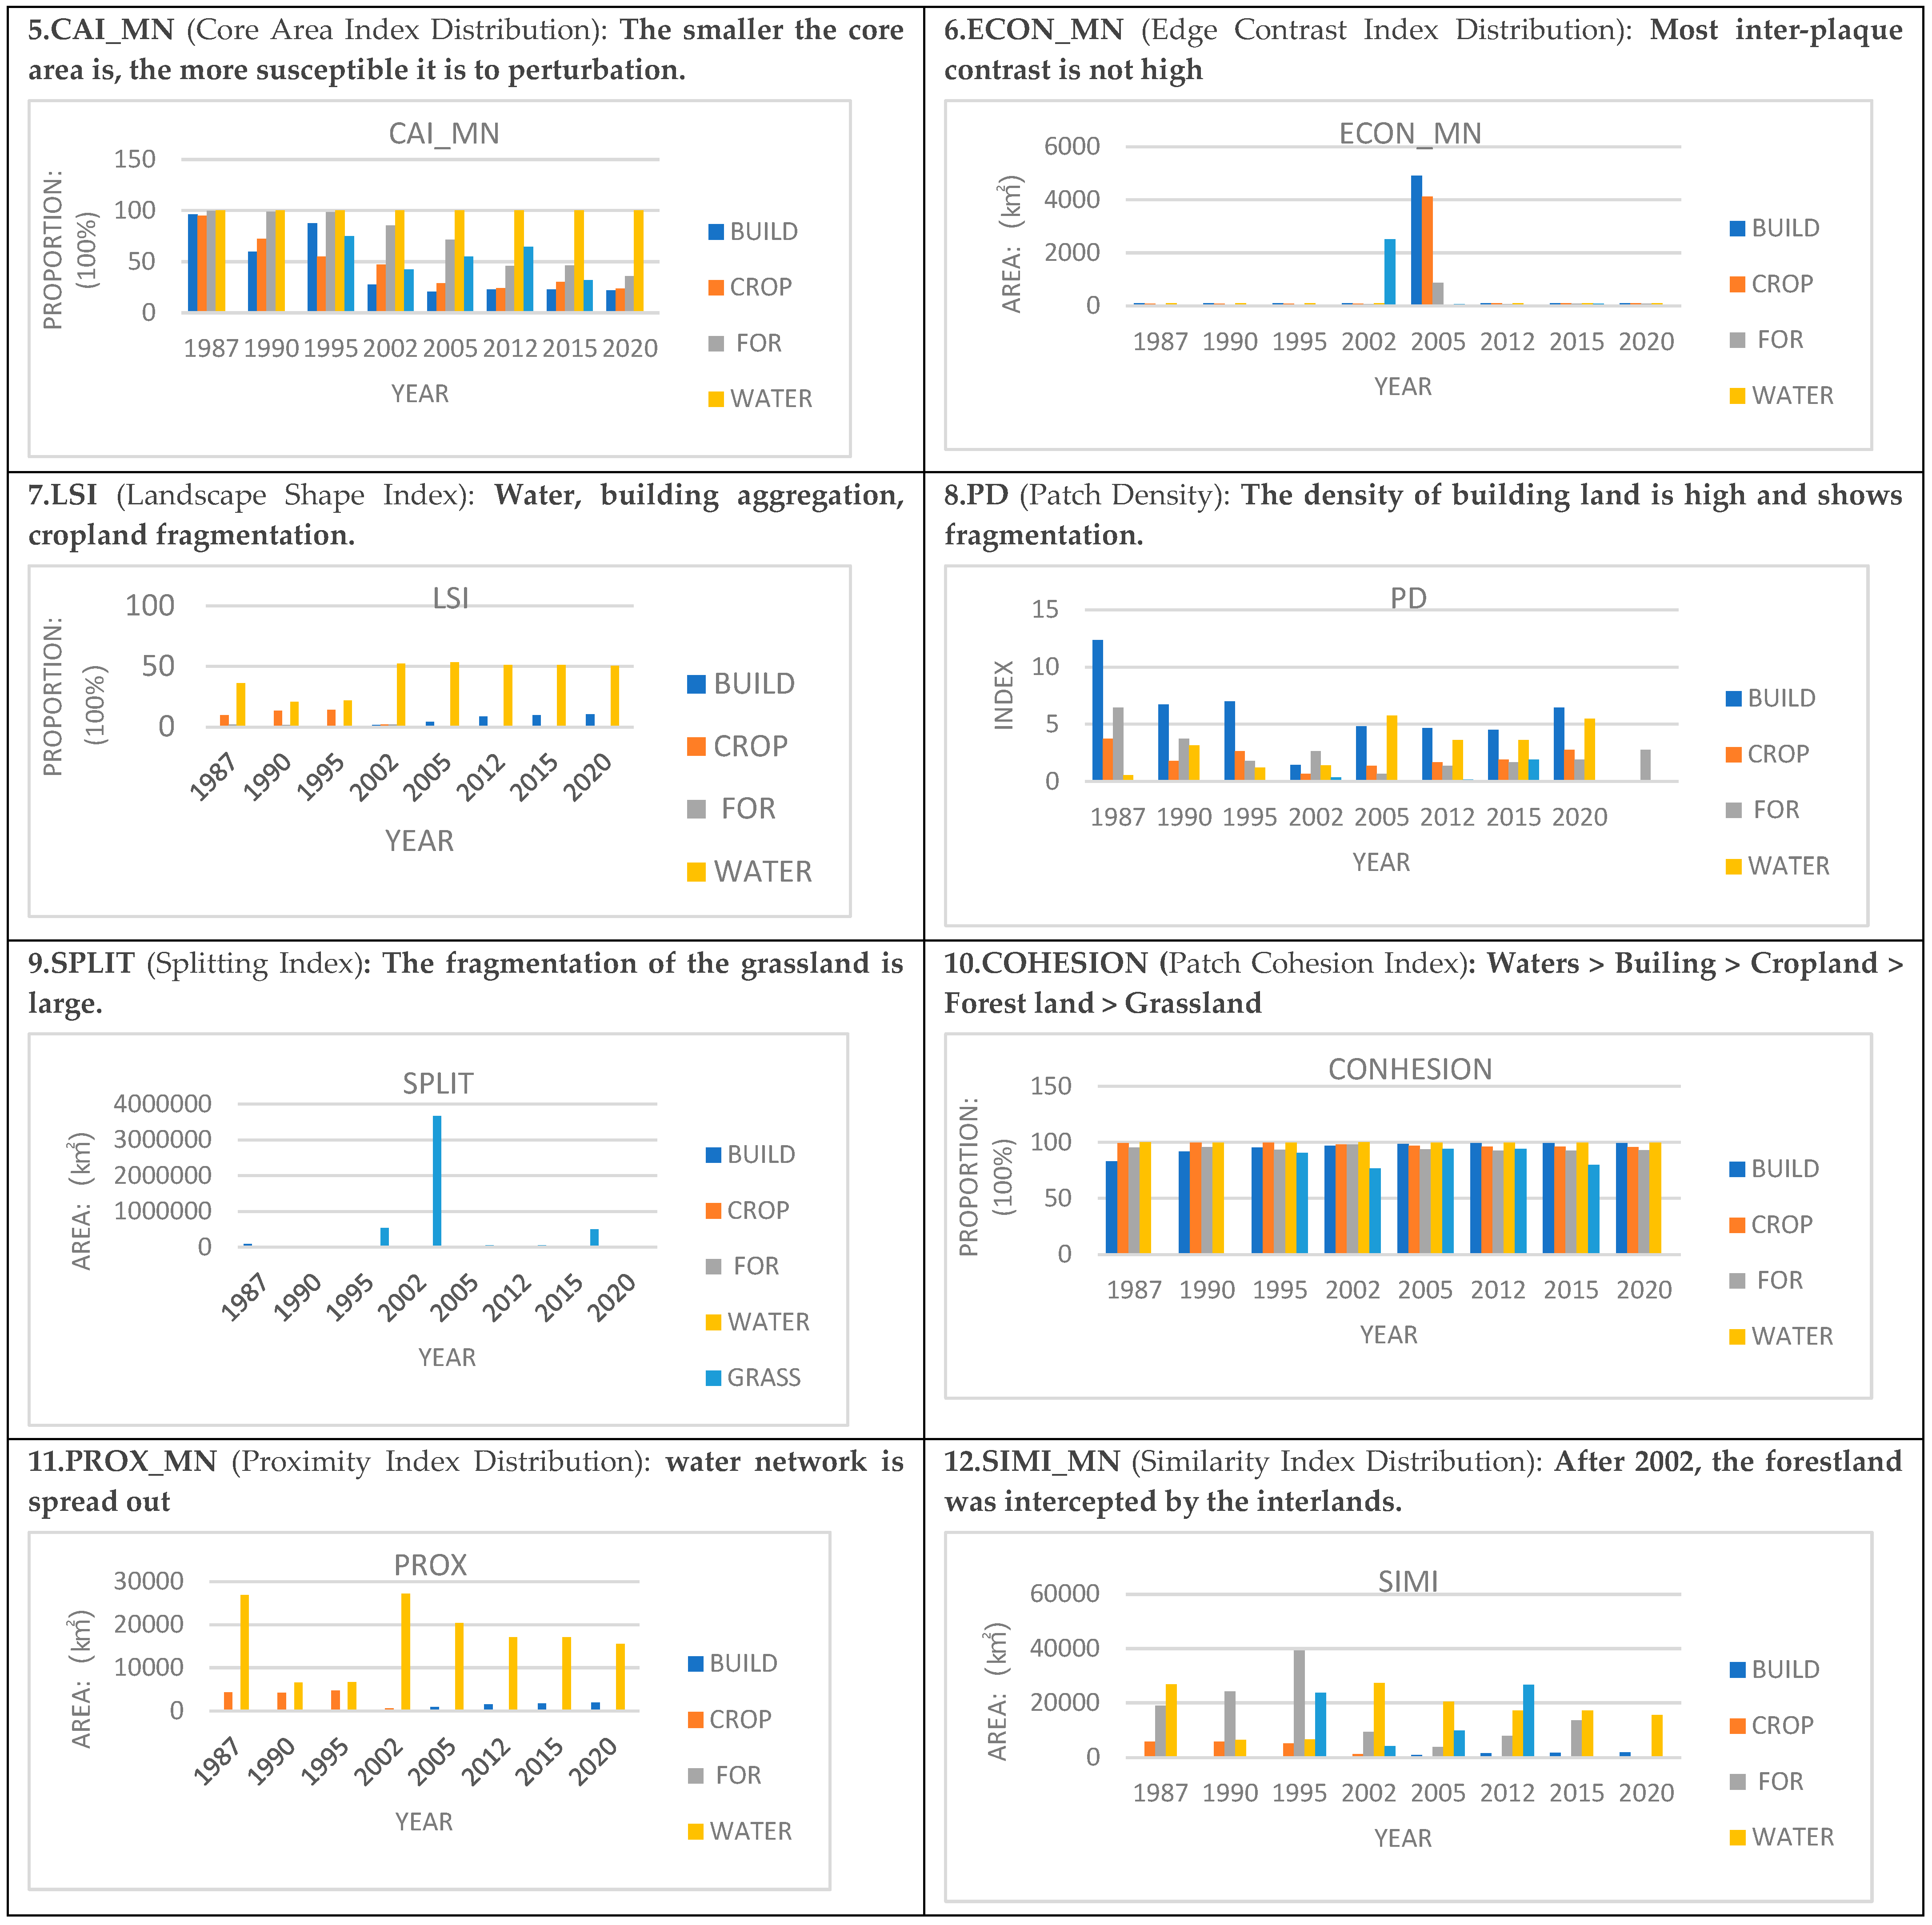
During the study period, it was concluded by calculating the class-scale landscape index that(Figure 7); (1) core area (CA) and (2) percentage of landscape (PLAND), both of which, due to urbanization construction, caused the dominant role of arable land to decline rapidly, while the status of water bodies remained unchanged, and construction land will replace arable land as the third dominant landscape type. (3) The Nansha District edge density reveals that before the acceleration of urbanization construction, arable land was the most complex patch with a kind of boundary; afterwards, construction land became the most complex patch. (4) Total core area (TCA) shows that water is an important land type in the Nansha District, which has been has remained high in the core, because of the possibility of the infiltration effect among land use types; therefore, it is assumed in the weight designation of this study that water bodies have an infiltration effect on other land types. (5) The core area index distribution (CAI_MN) reveals that as the fragmentation of terrestrial patches increases, the core area percentage becomes smaller and more vulnerable to disturbance, i.e., it indicates the complexity of terrestrial patches. (6) Edge contrast index distribution (ECON_MN) indicates the average contrast between patches. It reveals that the contrast between patches was not high most of the time in the Nansha District, and suddenly shows high contrast in 2002 for grassland, and high contrast in 2005 for construction land and cultivated land, indicating that the land type of anthropogenic activities tends to be complex. (7) Landscape shape index (LSI) measures the degree of regularity of patches by the degree of near-squareness, reflecting the degree of aggregation of patches under this type. (8) Patch density (PD) reveals that the density of built-up land far exceeds that of other landscape types and shows fragmentation. The same trend is observed for woodlands, as the Nansha District unified the woodlands and built them into forest parks serving tourists, etc., and then fragmentation decreased. (9) Splitting index (SPLIT) reveals a greater spreading trend for all land types except grassland, but the fragmentation of grassland is greater, peaking in 2002. (10) The patch cohesion index also reveals that grassland patches have poor cohesion, water bodies maintain high cohesion, built-up areas increase cohesion, woodland cohesion fluctuates, and arable land cohesion decreases slightly. (11) Proximity Index Distribution (PROX_MN) reveals that water patches are always close to each other, and water networks are spread throughout. (12) Similarity index distribution (SIMI_MN), which considers the distance between all types of patches, reveals that forested land was a mosaic with all other patches until 2002, but after 2002, with the acceleration of urbanization, forested land was separated from other patches. Overall, watershed is the dominant landscape type in the study area, with the highest maximum patch index and patch aggregation, leading to a single landscape type and an unstable ecosystem; due to urbanization development, the density of construction land is the highest and becomes the third most dominant landscape type. It also reveals a large degree of grassland fragmentation and a weak biodiversity function, which has a greater impact on ecosystem function.
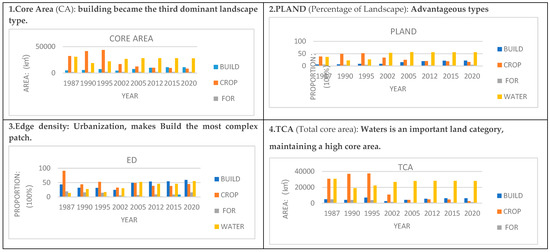
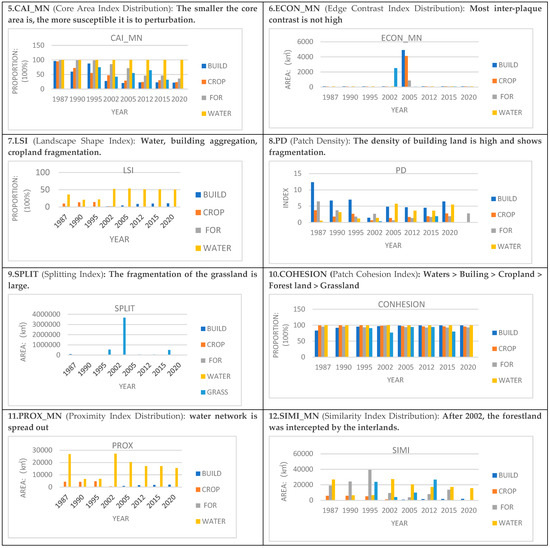
Figure 7.
Type-scale landscape index calculation results (self-drawn).
3.3.3. Integral Landscape Scale Landscape Index Calculation Results
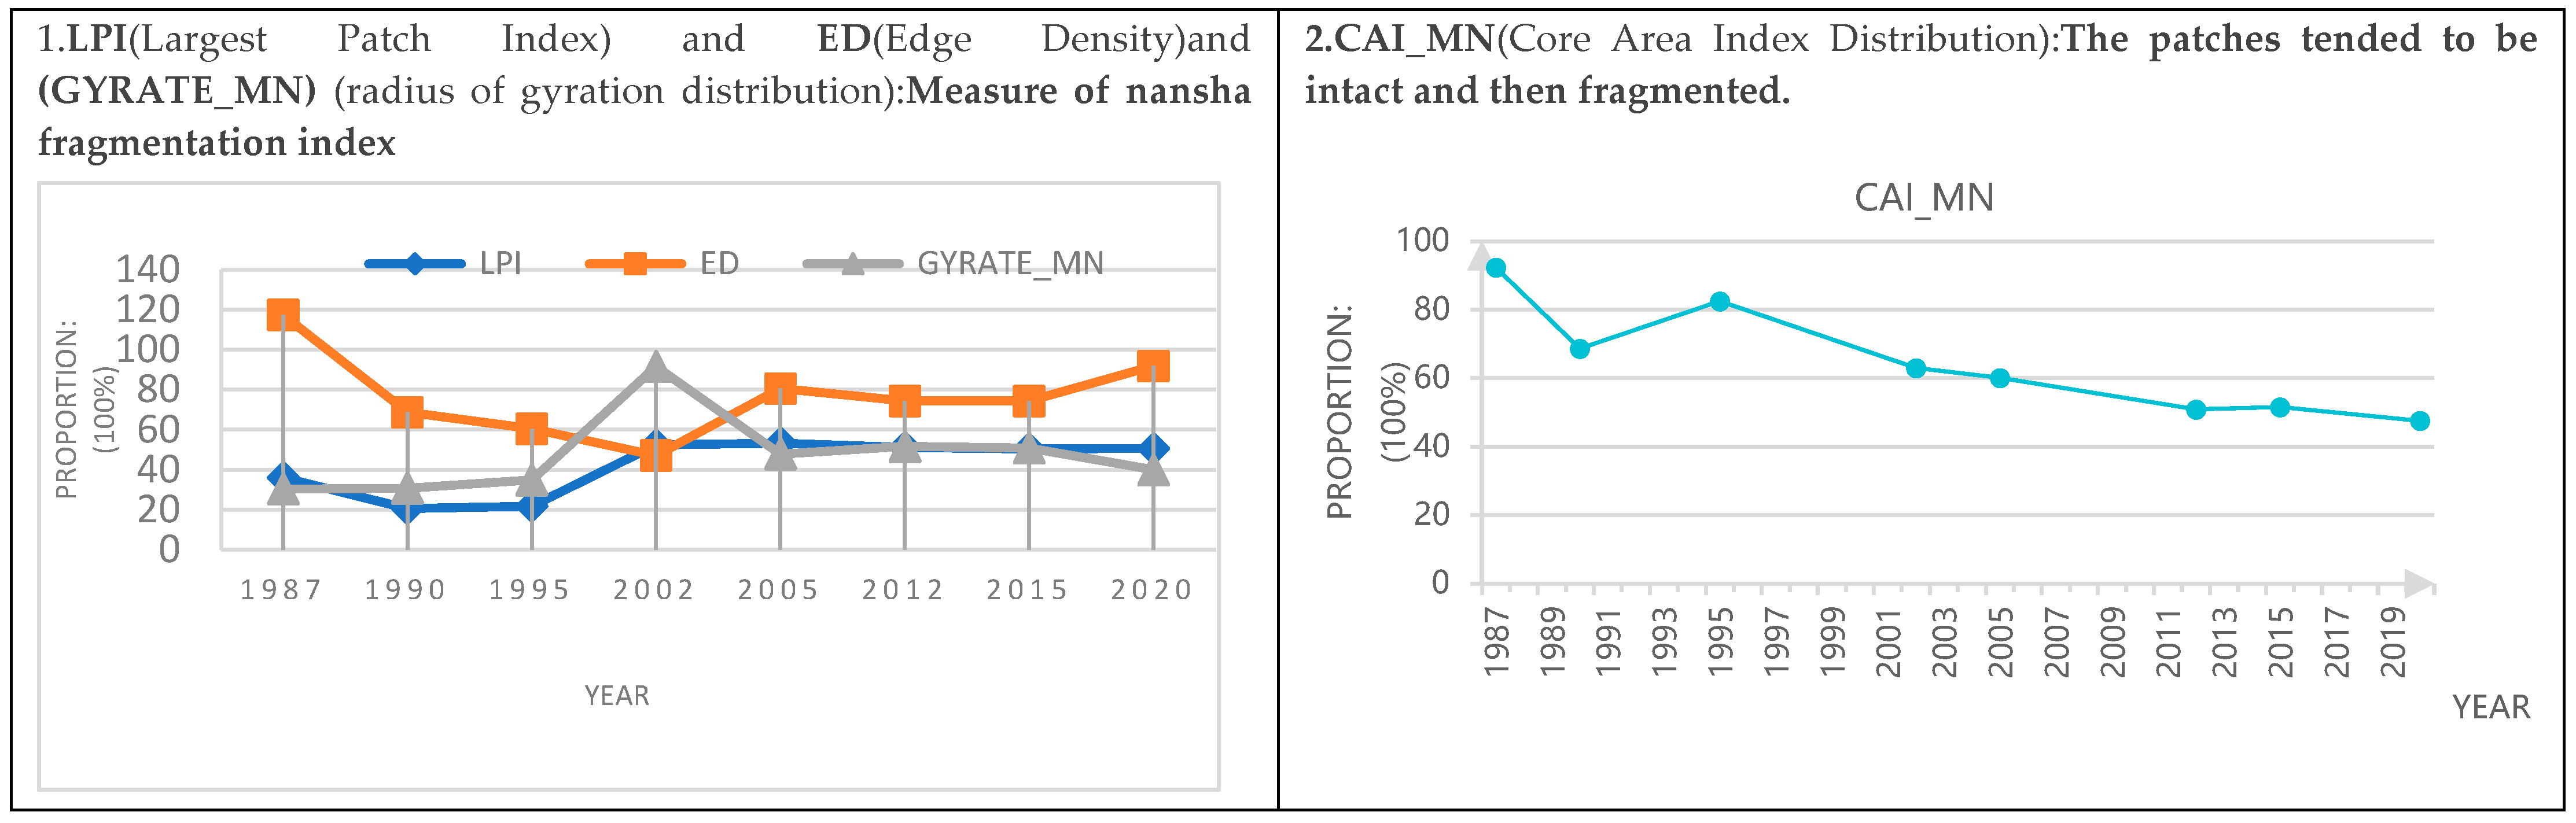
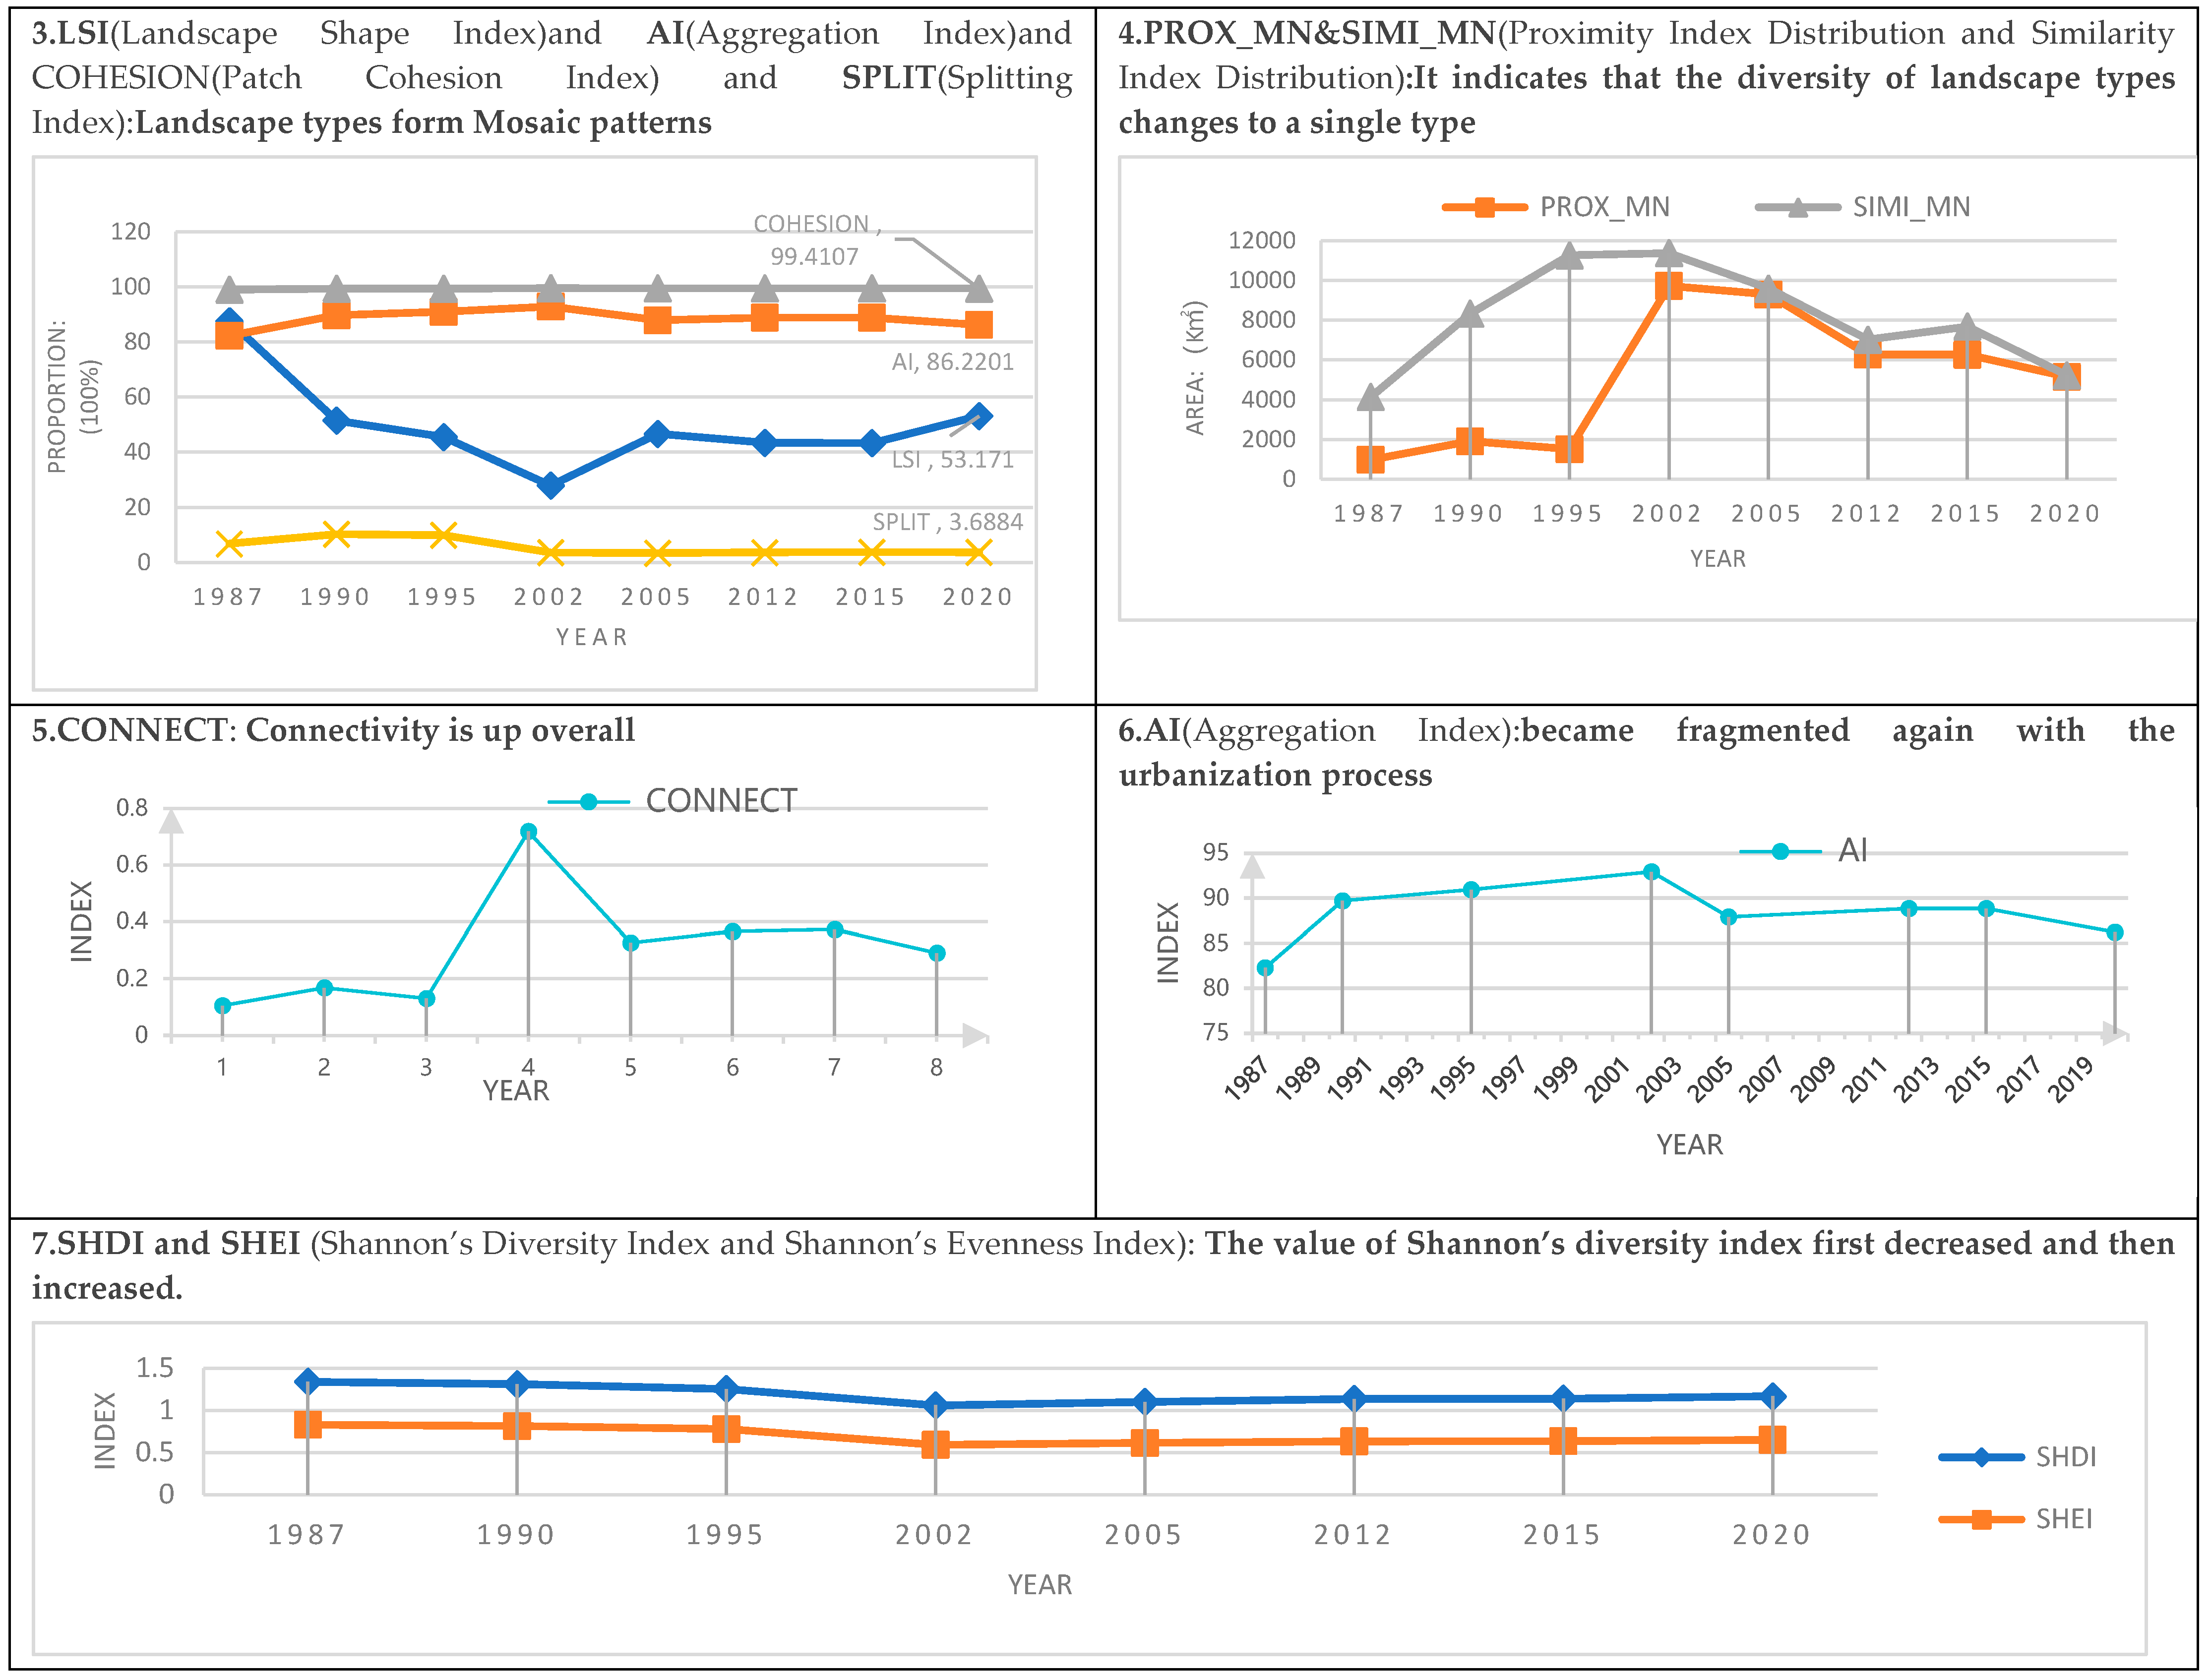
During the study, landscape indices that measured the same property and had a similar range of values were combined and plotted to present the landscape index results. The following conclusions were drawn from the overall landscape scale index calculations(Figure 8): (1) The largest patch index (LPI) reveals the size of dominant patches in the landscape type, which increased between 1995 and 2002 but then remained stable, and edge density (ED) reveals the fragmentation of the entire landscape in Nansha. The radius of gyration distribution (GYRATE_MN) is a measure of the fragmentation of the Nansha area, and it shows an opposite trend to the largest patch index (LPI). The radius of gyration distribution revealed that it was more stable except in 2002, and the overall extent of the patches under the entire landscape became larger in the later period than in the earlier period. The shape of the CONTIG index in the landscape shape index (LSI) is the same as the radius of gyration, so it is not shown again. (2) Core area index distribution (CAI_MN) reveals that the area of the core area in the Nansha District first shows an increasing trend and then a decreasing trend, indicating that there are patches under the whole landscape. (3) The landscape shape index (LSI) mainly shows a decreasing and then increasing trend. It reveals that the decrease may be due to the consolidation of the site increasing the regularity of the patches, and the increase may be caused by the growth of the patches resulting in larger edge lengths.The Splitting index (SPLIT) reveals that the separation of the patches of the same type in the whole landscape of the Nansha District first increases and then tends to form a pattern of mutual mosaic; the separation decreases and the connectivity is more stable. For CONNECT and AI, respectively, see Nos. 5 and 6 in the Figure. (4) Proximity index distribution (PROX_MN) and similarity index distribution (SIMI_MN): the proximity index and similarity index first increased and then decreased significantly. (5) CONNECT reveals that the indices reflect an overall increase in the connectivity of all patches in the landscape, as each type of patch formed a mosaic pattern and increased connectivity. (6) The aggregation index (AI) results reflect that the overall landscape pattern in the Nansha District changed from many small and finely fragmented patches to more homogeneous and compact patches, but became fragmented again with the urbanization process. (7) The Shannon evenness index (SHEI) values of Shannon’s diversity index (SHDI) first declined and then increased, indicating that in the beginning of the consolidation, the patches were homogenized and the dominant patches became more dominant. Later, the complex composition returned, but the complexity was still weaker than before.
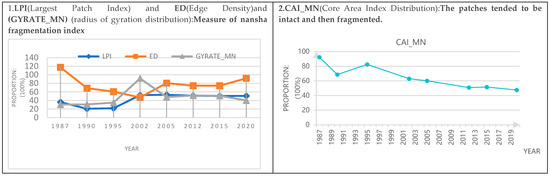
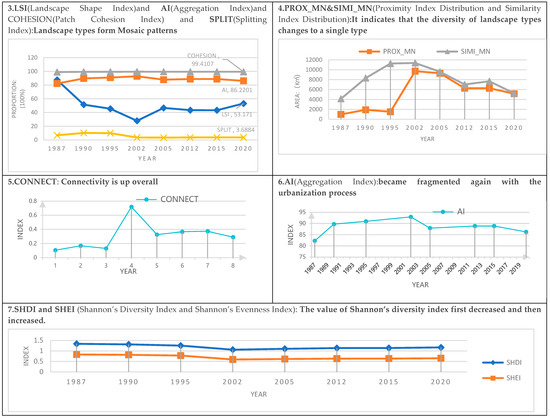
Figure 8.
Overall landscape scale landscape index(self-drawn).
In conclusion, with the expansion of the urbanization process, the core area, aggregation index, patch separation, proximity index and similarity index show an overall trend of first increasing and then decreasing; that is, they shows that due to the urbanization process, the landscape pattern of the Nansha District tends to fragment from integrated and continuous development, and the ecological environment suffers certain damage and needs to strengthen ecological restoration; At the same time, they also reveal the distance between patches of the same type. On the other hand, the study shows that the size of the dominant landscape patches in the Nansha District tends to be stable, and the overall range of the all landscape patches in the Nansha District has become larger in the later stage. The landscape pattern transformed from many small and fragmented patches to more homogeneous and compact patches, indicating that the patches had become homogeneous in the beginning of the integration and the dominant patches became larger in proportion, and then returned to a complex composition due to urbanization expansion. However, the complexity was still weakened compared to the previous one, indicating the destruction of ecological diversity and the weakening of the complexity of landscape types with human activities.
4. Discussion
Through the index research of landscape ecological pattern, we identified landscape ecological risks in Nansha’s coastal zone by assessing the ecological vulnerability of coastal zones [13]. In other words, the indexes of landscape pattern at patch level, type level and overall landscape level were used for quantitative evaluation and justification. Based on the results of this study, we propose remediation strategies and planning suggestions, and summarize special solutions for the landscape pattern of the Nansha coastal zone in the face of “urbanization” to achieve “sustainable development”. This study also lays the foundation for the next step of marine ecological protection and utilization. Nansha City is a typical coastal city, with outstanding features of coastal zone landscape patterns and relatively obvious patterns of landscape pattern evolution through which the calculation results reflect the features of landscape pattern evolution, as well as the patterns, in order to provide a scientific basis for the practice in Nansha District, and provide precedent for related research in different regions.
Different from related studies, this paper is based on the Nansha coastal zone as its base. Based on the characteristics of Nansha, the landscape pattern changes from 1987 to 2020. To classifying the landscape types of Nansha precisely, we assumed that water bodies have penetration effects on other land types in the weight designation of this study, which can better reflect the changes of other landscape types based on the benchmark of coastal cities. The results of this study show that in recent years, due to the construction of “urbanization” in Nansha City, forestland has been converted to arable land, and grass, water and arable land types have been transformed to construction land, and the fragmentation of the landscape has increased year by year. Under the dual action of human factors and natural factors, woodlands and grasslands have been planned as parks for tourists, indicating that the human use of land is deepening, or that ecological restoration has been effective; water resources are an important basic condition for the sustainable development of Nansha. Therefore, ecological restoration and environmental protection are still challenges for the future development of the Nansha District. The policy formulation combines the basic attributes of Nansha with the protection of the coastal zone landscape pattern as the bottom line to formulate the corresponding development strategy [14].
This paper only analyzes the characteristics of the evolution index of the coastal zone landscape pattern in the Nansha District. Future researchers should focus on the following aspects: (1) Based on Nansha’s own sea and land resource endowment, combined with the current problems of the Nansha coastal zone, propose global systematic comprehensive remediation measures, and take the spatial unit of land and sea as the object of remediation, and propose “one unit, one strategy”. The project will ultimately achieve “blue–green coexistence, land–sea integration, and vitality sharing” of the Nansha coastline, and provide a technical basis for Guangzhou to build a provincial-level coastal zone comprehensive protection and utilization demonstration area in the Nansha District. (2) Systems understanding nature are at the heart of the solution (e.g., flood control, sustainable port development, and ecosystem restoration) that harnesses the power of nature for economic, social, and environmental benefits. They are a key issues in current water resource management, which is also facing new challenges and opportunities for development, presenting new topics and innovative spaces for research.
The first should strengthen the exploration of driving factors, assess ecological risks, optimize landscape patterns, and propose targeted countermeasures for the sustainable development of coastal cities [15]. The main features include the following: (1) Cooperation with nature rather than confrontation; (2) Systematic understanding of natural processes as the core of solutions; (3) Context-specific, multifunctional, innovative and dynamic solutions. The focus should be on the overall remediation strategy in terms of ecological protection and restoration strategy, flexible development strategy, spatial control planning, delineation of sea and land integration units, control rules and requirements, phased construction, and policy guarantee.
Second, a comprehensive research theoretical system should be built based on a multidisciplinary platform. Different disciplines have different focuses in the study of coastal zones, and should, on the basis of the current research results, strengthen the communication and dialogue between disciplines, form systematic research ideas and research paradigms, and explore their own characteristic development directions under the integration of the multidisciplinary platform system.
Third, the third innovative research perspective combined with applied development theory.
Finally, innovative research methods. Qualitative and quantitative research are common methods of coastal zone research; qualitative research is realized through field research, archival review, and other methods, quantitative research mainly contains ENVI, Fragstats, spatial syntax, etc., and modern digital technology such as AI/GIS/VR. The integrated use of qualitative and quantitative research methods will provide more possibilities and innovations for future coastal zone research [16,17,18].
5. Conclusions
In this paper, we studied the landscape pattern index of Nansha’s coastal zone from 1987 to 2020 on three levels: patch, class and landscape, and analyzed its spatial and temporal evolution and development characteristics.
- (1)
- Patch horizontal scale (Patch) index study mainly reflects that: (i) Due to urbanization construction, the area of the Nansha District plate changed significantly after 2012, and the patch tended to be fragmented from the whole; (ii) Also with 2012 as the turning point, the spatial pattern of landscape type and composition becomes complicated after 2012, especially the part of the central city; (iii) Waters are still the dominant landscape type.
- (2)
- Type scale (Class) landscape index research results are mainly: (i) Arable land and forest land are gradually replaced by construction land, less change in waters, waters are the dominant landscape type in the study area, with the highest maximum patch index and patch aggregation, resulting in a single landscape type and unstable ecosystem; (ii) With urbanization, there are mainly water bodies and arable land, and construction land becomes the third major alternative to forest land of the Nansha District landscape type. It also revealed a large degree of grassland fragmentation and weak biodiversity function, which has a greater impact on ecosystem function; (iii) Construction areas are complicated but weakened compared to the previous ones; (iv) Nansha woodlands are gradually protected and regularized in the form of visitor forest parks.
- (3)
- The results of the overall scale landscape index calculation mainly include: (i) With the expansion of urbanization process, the core area, aggregation index, patch separation, proximity index and similarity index show an overall trend of first increasing and then decreasing; that is, they show that the landscape pattern of the Nansha District tends to be fragmented from integrated and continuous development due to the urbanization process; (ii) It reveals that the distance between patches of the same type or different types of patches tend to increase and then decrease—to mosaic integration pattern; (iii) The study shows that except for the leap between 1995 and 2002, the size of the dominant landscape patches in the Nansha District tends to be stable—to mosaic integration pattern; (iv) The study reveals that the overall landscape pattern transformed from many small and fine patches to more single and compact patches, and the Shannon diversity index indicates that in the beginning of the integration the patches used to move towards homogenization and the dominant patches became larger in proportion. Later, due to urbanization expansion, the complex composition returned, but the complexity was still weakened compared to the previous one.
Therefore, this paper increases the amount of information carried by the landscape index and reduces the subjective weight judgment in the study based on the optimized coastal zone landscape index research basis. The precision value of carrying the landscape type is based on over 70%, the explicit expression of landscape type index is increased, and the main component factors are combined according to the weight relationship determined by the pure mathematical and statistical relationship of ENVI, and the subjective evaluation is reduced. It makes the coastal zone landscape index study more objective, reasonable and produces a precise coastal zone landscape pattern. Additionally, in the next study we will attempt to optimize the quantitative study of the coastal zone landscape pattern in the Nansha District, to influence the path of the coastal zone landscape pattern index, combined with examples to verify the assessment of ecological risk, optimize the sustainable development of the coastal zone landscape pattern, as the research results in the macro, meso and micro applications need to be further deepened and strengthened. This will be a new exploration of further research on coastal zone landscape index.
Supplementary Materials
The following are available online at https://www.mdpi.com/article/10.3390/su15043378/s1. Table S1: Landscape pattern index selection.
Author Contributions
Conceptualization, X.L., J.H. and W.L.; methodology, X.L. and Y.D.; software, X.L. and Y.D.; validation, X.L., J.H. and L.G.; formal analysis, L.G.; investigation, X.L. and L.G.; resources, X.L. and Y.D.; data curation, X.L., Y.D., and W.L.; writing—original draft preparation, X.L., J.H. and L.G.; writing—review and editing. J.H., X.L., L.G. and W.L.; visualization, Y.D. and X.L.; supervision, J.H.; project administration, J.H.; funding acquisition, J.H. and X.L. All authors have read and agreed to the published version of the manuscript.
Funding
This research received no external funding.
Institutional Review Board Statement
Not applicable.
Informed Consent Statement
Not applicable.
Data Availability Statement
All the data in this paper are available.
Conflicts of Interest
The authors declare no conflict of interest.
References
- Wu, T.; Hou, X. A review of studies on coastline change. Acta Ecol. Sin. 2016, 36, 1170–1182. [Google Scholar]
- Yi, B.; Sheng, M. Exploration on integrated control of land and sea in the coastal zone of Shenzhen Shenzhen-Shan Special Cooperation Zone. Planner 2020, 36, 29–33. [Google Scholar]
- Peng, J.; Dang, W.; Liu, Y.; Zong, M.L.; Hu, X. Landscape ecological risk assessment: Advances and prospects. Acta Geogr. Sin. 2015, 70, 664–677. [Google Scholar]
- Hainesyoung, R.; Chopping, M. Quantifying landscape structure: A review of landscape indices and their application to forested landscapes. Prog. Phys. Geogr. 1996, 20, 418–420. [Google Scholar] [CrossRef]
- Wang, Y.; Zhao, Y.; Han, D. Spatial structure of landscape ecosystems: Concepts, indicators and cases. Earth Sci. Adv. 1999, 14, 235–241. [Google Scholar]
- Xu, H.; Wang, J. Theory and Application of Landscape Ecology; China Environmental Science Press: Beijing, China, 1993. [Google Scholar]
- Lei, Y.; Zhang, X.; Luo, J.; Li, Y.; Wang, Z.; Yao, L.; Li, X. Spatial and temporal evolution characteristics of urban landscape patterns in arid zones based on different zones--Zhangye City as an example. J. Ecol. 2022, 43, 1–15. [Google Scholar]
- Wang, Q.; Li, W.; Kou, X.; Kou, W.; Fu, C. Temporal and spatial evolution characteristics of landscape pattern and ecological vulnerability in Yongtai-Wenzhou coastal zone. J. Soil Water Conserv. 2020, 40, 297–303. [Google Scholar]
- Zhang, J.; Gao, P.; Dong, X.; Li, T.; Xu, J. Ecological vulnerability assessment of coastal zone in Qingdao based on landscape pattern analysis. J. Ecol. Rural Environ. 2021, 37, 1022–1030. [Google Scholar]
- Smith, H.D.; Stojanovic, T.A. The spatial developmentment basis of marine spatial planning in the United Kingdom. J. Environ. Policy Plan. 2012, 14, 29–47. [Google Scholar] [CrossRef]
- Chen, P.; Fu, S.; Wen, C.; Lin, R. Human disturbance impact assessment and landscape response of coastal wetlands in Xiamen Bay from 1989 to 2010. J. Appl. Oceanogr. 2014, 33, 167–174. [Google Scholar]
- Japelaghi, M.; Gholamalifard, M.; Shayesteh, K. Spatio-temporalanalysis and prediction of landscape patterns and chang processes in the central Zagros region, Iran. Remote Sens. Appl. Soc. Environ. 2019, 15, 100244. [Google Scholar]
- Shehab, Z.N.; Jamil, N.R.; Aris, A.Z.; Shafie, N.S. Spatial variation impact of landscape patterns and land use on water quality across an urbanized watershed in Bentong, Malaysia. Ecol. Indic. 2021, 122, 107254. [Google Scholar] [CrossRef]
- Rafaa, N.H.; Abdullah, S.H.; Reza, M.I.H. Identifying factors and predicting the future land -use change of protected area in the agricultural landcsape of Malaysian peninsula for conservation planning. Remote Sens. Appl. Soc. Environ. 2020, 18, 100298. [Google Scholar]
- Remm, K. Correlations between forest stand diversity and landscape pattern inotepää Natura Park, Estonia. J. Nat. Conserv. 2005, 13, 137–145. [Google Scholar] [CrossRef]
- Getu, K.; Bhat, H.G. Analysis of spation-temporal dynamics of urban sprawl and growth patter using geospatial technologies and landscape metrics in Bahir Dar, Northwest Ethiopia. Land Use Policy 2021, 109, 105676. [Google Scholar] [CrossRef]
- Yohannes, H.; Soromessa, T.; Argaw, M.; Dewan, A. Impact of land scape pattern changes on hydroological ecosystem services in the Beressa watershed of the Blue Nile Basin in Ethiopia. Sci. Total Environ. 2021, 793, 148559. [Google Scholar] [CrossRef] [PubMed]
- Baus, P.; Ková, I.; Komorik, J. Identification of interconnections between landscape pattern and urban dybamics-case study Bratislava, Slovakia. Ecol. Indic. 2014, 42, 104–111. [Google Scholar] [CrossRef]


Disclaimer/Publisher’s Note: The statements, opinions and data contained in all publications are solely those of the individual author(s) and contributor(s) and not of MDPI and/or the editor(s). MDPI and/or the editor(s) disclaim responsibility for any injury to people or property resulting from any ideas, methods, instructions or products referred to in the content. |
© 2023 by the authors. Licensee MDPI, Basel, Switzerland. This article is an open access article distributed under the terms and conditions of the Creative Commons Attribution (CC BY) license (https://creativecommons.org/licenses/by/4.0/).