Article

Assessing Carbon Reduction Potential of Rooftop PV in China through Remote Sensing Data-Driven Simulations

1
State Key Laboratory of Resources and Environmental Information System, Institute of Geographic Sciences and Natural Resources Research, Chinese Academy of Sciences, Beijing 100101, China
2
School of Geography and Planning, Nanning Normal University, Nanning 530001, China
*
Author to whom correspondence should be addressed.
Sustainability 2023, 15(4), 3380; https://doi.org/10.3390/su15043380
Submission received: 9 January 2023 / Revised: 8 February 2023 / Accepted: 9 February 2023 / Published: 13 February 2023
(This article belongs to the Special Issue Regional Climate Change and Application of Remote Sensing)

Abstract

:
Developing rooftop photovoltaic (PV) has become an important initiative for achieving carbon neutrality in China, but the carbon reduction potential assessment has not properly considered the spatial and temporal variability of PV generation and the curtailment in electricity dispatch. In this study, we propose a technical framework to fill the gap in assessing carbon reduction potential through remote sensing data-driven simulations. The spatio-temporal variations in rooftop PV generations were simulated on an hourly basis, and a dispatch analysis was then performed in combination with hourly load profiles to quantify the PV curtailment in different scenarios. Our results showed that the total rooftop PV potential in China reached 6.5 PWh yr−1, mainly concentrated in the eastern region where PV generation showed high variability. The carbon reduction from 100% flexible grids with 12 h of storage capacity is close to the theoretical maximum, while without storage, the potential may be halved. To maximize the carbon reduction potential, rooftop PV development should consider grid characteristics and regional differences. This study has important implications for the development of rooftop PV and the design of carbon-neutral pathways based on it.

1. Introduction

Solar photovoltaics (PV) has become an important pathway for achieving carbon emission reduction around the world [1,2]. Globally installed PV capacity has grown more than eightfold in the last 10 years, providing about 3.6% of the world’s total electricity consumption in 2021 [3]. Various forms of PVs are proposed for extensive and widespread development, such as floating PV [4], agricultural PV [5], building-integrated PV [6], rooftop PV [7], etc. Compared to ground-mounted PVs, rooftop PV has unique advantages, such as proximity to consumers [8] and no need for additional land [9], making it highly favored in recent years. In China, the government is implementing a county-based strategy to promote rooftop PV development to reduce carbon emissions [10].
Several studies have proposed methods to assess rooftop PV potential, which can be broadly classified into geographic information system (GIS)-based methods and remote sensing (RS)-based methods [11]. GIS-based methods are used for energy planning at city scales that involve building structures (e.g., roof slope and façade orientation) [12] and building interrelationships (e.g., shading and lighting) [13]. They are typically based on a series of spatial or non-spatial data on available solar radiation and building features, and combine GIS technology with machine learning, physical modeling, geostatistics, and sampling methods for analysis [14,15,16]. GIS technology plays the role in capturing, storing, manipulating, analyzing, managing, and presenting all types of data. For example, Bergamasco and Asinari [17] proposed a method integrating GIS and solar radiation maps to estimate the power generation of rooftop PV in Piedmont, northwestern Italy. Assouline et al. [18] combined support vector regression and GIS to estimate the electricity generation potential of rooftop PV in Switzerland. GIS-based methods are usually suitable for fine-scale spatio-temporal assessments, and the results can be employed to design effective policies for rooftop PV development in built environments [11]. However, the intensive computational demand is a main obstacle to their application on a large scale [13,16].
The typical RS-based approach integrates multi-source remote sensing data to assess the regional potential of rooftop PV, and the main work usually consists of two aspects, namely, building footprint extraction and solar resource estimation [7,19]. Mapping the building footprints from very high-resolution images has attracted a lot of attention because high-resolution images contain more spatial-detailed contexts on ground objects [20]. For example, Guo et al. [21] proposed a coarse-to-fine boundary refinement network to extract building footprints from aerial imagery and addressed the challenge of extracting sharp building boundaries caused by obstructions from nearby shadows or trees, diversity of roof shapes, and variation in building scales. Guo et al. [22] further developed a model for automatic building footprint updates using bi-temporal remote sensing images. Regarding solar resource estimation, geostationary meteorological satellites are widely used to retrieve the total solar radiation and the direct/diffuse fraction at high spatial and temporal resolutions [23,24,25]. For example, Jiang et al. [24] introduced a convolutional neural network to extract spatial patterns from satellite imagery to deal with the spatial proximity effects in solar radiation inversion. Li et al. [26] applied transfer learning for global estimates of surface solar radiation, which combines the advantage of radiative transfer simulations and ground measurements. Compared to GIS-based methods, remote sensing makes large-scale assessment a reality, and the integration of deep learning significantly improves computational efficiency [7,11]. Therefore, RS-based methods are typically applied to large-scale resource estimation and spatial planning but are not applicable to the design and integration of individual rooftop PV systems [19,27].
In parallel, light detection and ranging (LiDAR) technology has contributed to the accurate simulation of PV electricity generations at urban scales [28,29]. The LiDAR-based method allows for consideration of the shading effects of local topography on PV generation. LiDAR can be combined with GIS tools to enrich the services, such as optimizing the PV installations, balance-of-system costs, return on investment, payback time, and potential carbon reductions [12,14]. For example, Jacques et al. [30] presented a methodology that combines roof segmentation algorithms with LiDAR data to estimate potential PV capacity for buildings in Leeds, UK. Gagnon et al. [31] integrated GIS with a regression statistical approach and LiDAR dataset to determine the potential electricity generation of rooftop PV across the United States. This kind of solution possesses the advantages of both RS-based and GIS-based ones, while the high cost of LiDAR is the main reason why they are not yet widely used [28,31].
In contrast to the refined assessment of PV power generation potential, the estimation of PV carbon reduction capacity is relatively crude [32]. Typically, the estimated potential is regarded as the activity level and multiplied by the grid emission factors published by government departments to calculate carbon reduction potential [32,33]. There are two main problems associated with such an approach. First, the fine-scale spatial and temporal variability of PV power generation is not considered. The variability leads to a mismatch between PV generation and user-side demand, and thus, a portion of PV electricity is to be curtailed during dispatching; that is, not all PV electricity can be delivered to the grid and then consumed by end users [34,35]. Second, the impact of the grid’s own characteristics is ignored. It is known that the grid’s ability to absorb variable generations varies with different system flexibility and energy storage capacity [36,37]. In addition, since clean energy already exists in the grid [2,38], it is unlikely that one unit of rooftop PV electricity will replace an equivalent amount of power in the current grid.
In this study, we attempted to solve the above problems by simulating fine-scale variability in rooftop PV power generation using multi-source remote sensing data and performing dispatch analysis by combining hourly PV generation with the hourly customer-side load. In this way, the portion of rooftop PV generation that was actually consumed was calculated to correct for the overestimation of carbon reduction. The main contributions of this study embody three aspects:
(1)
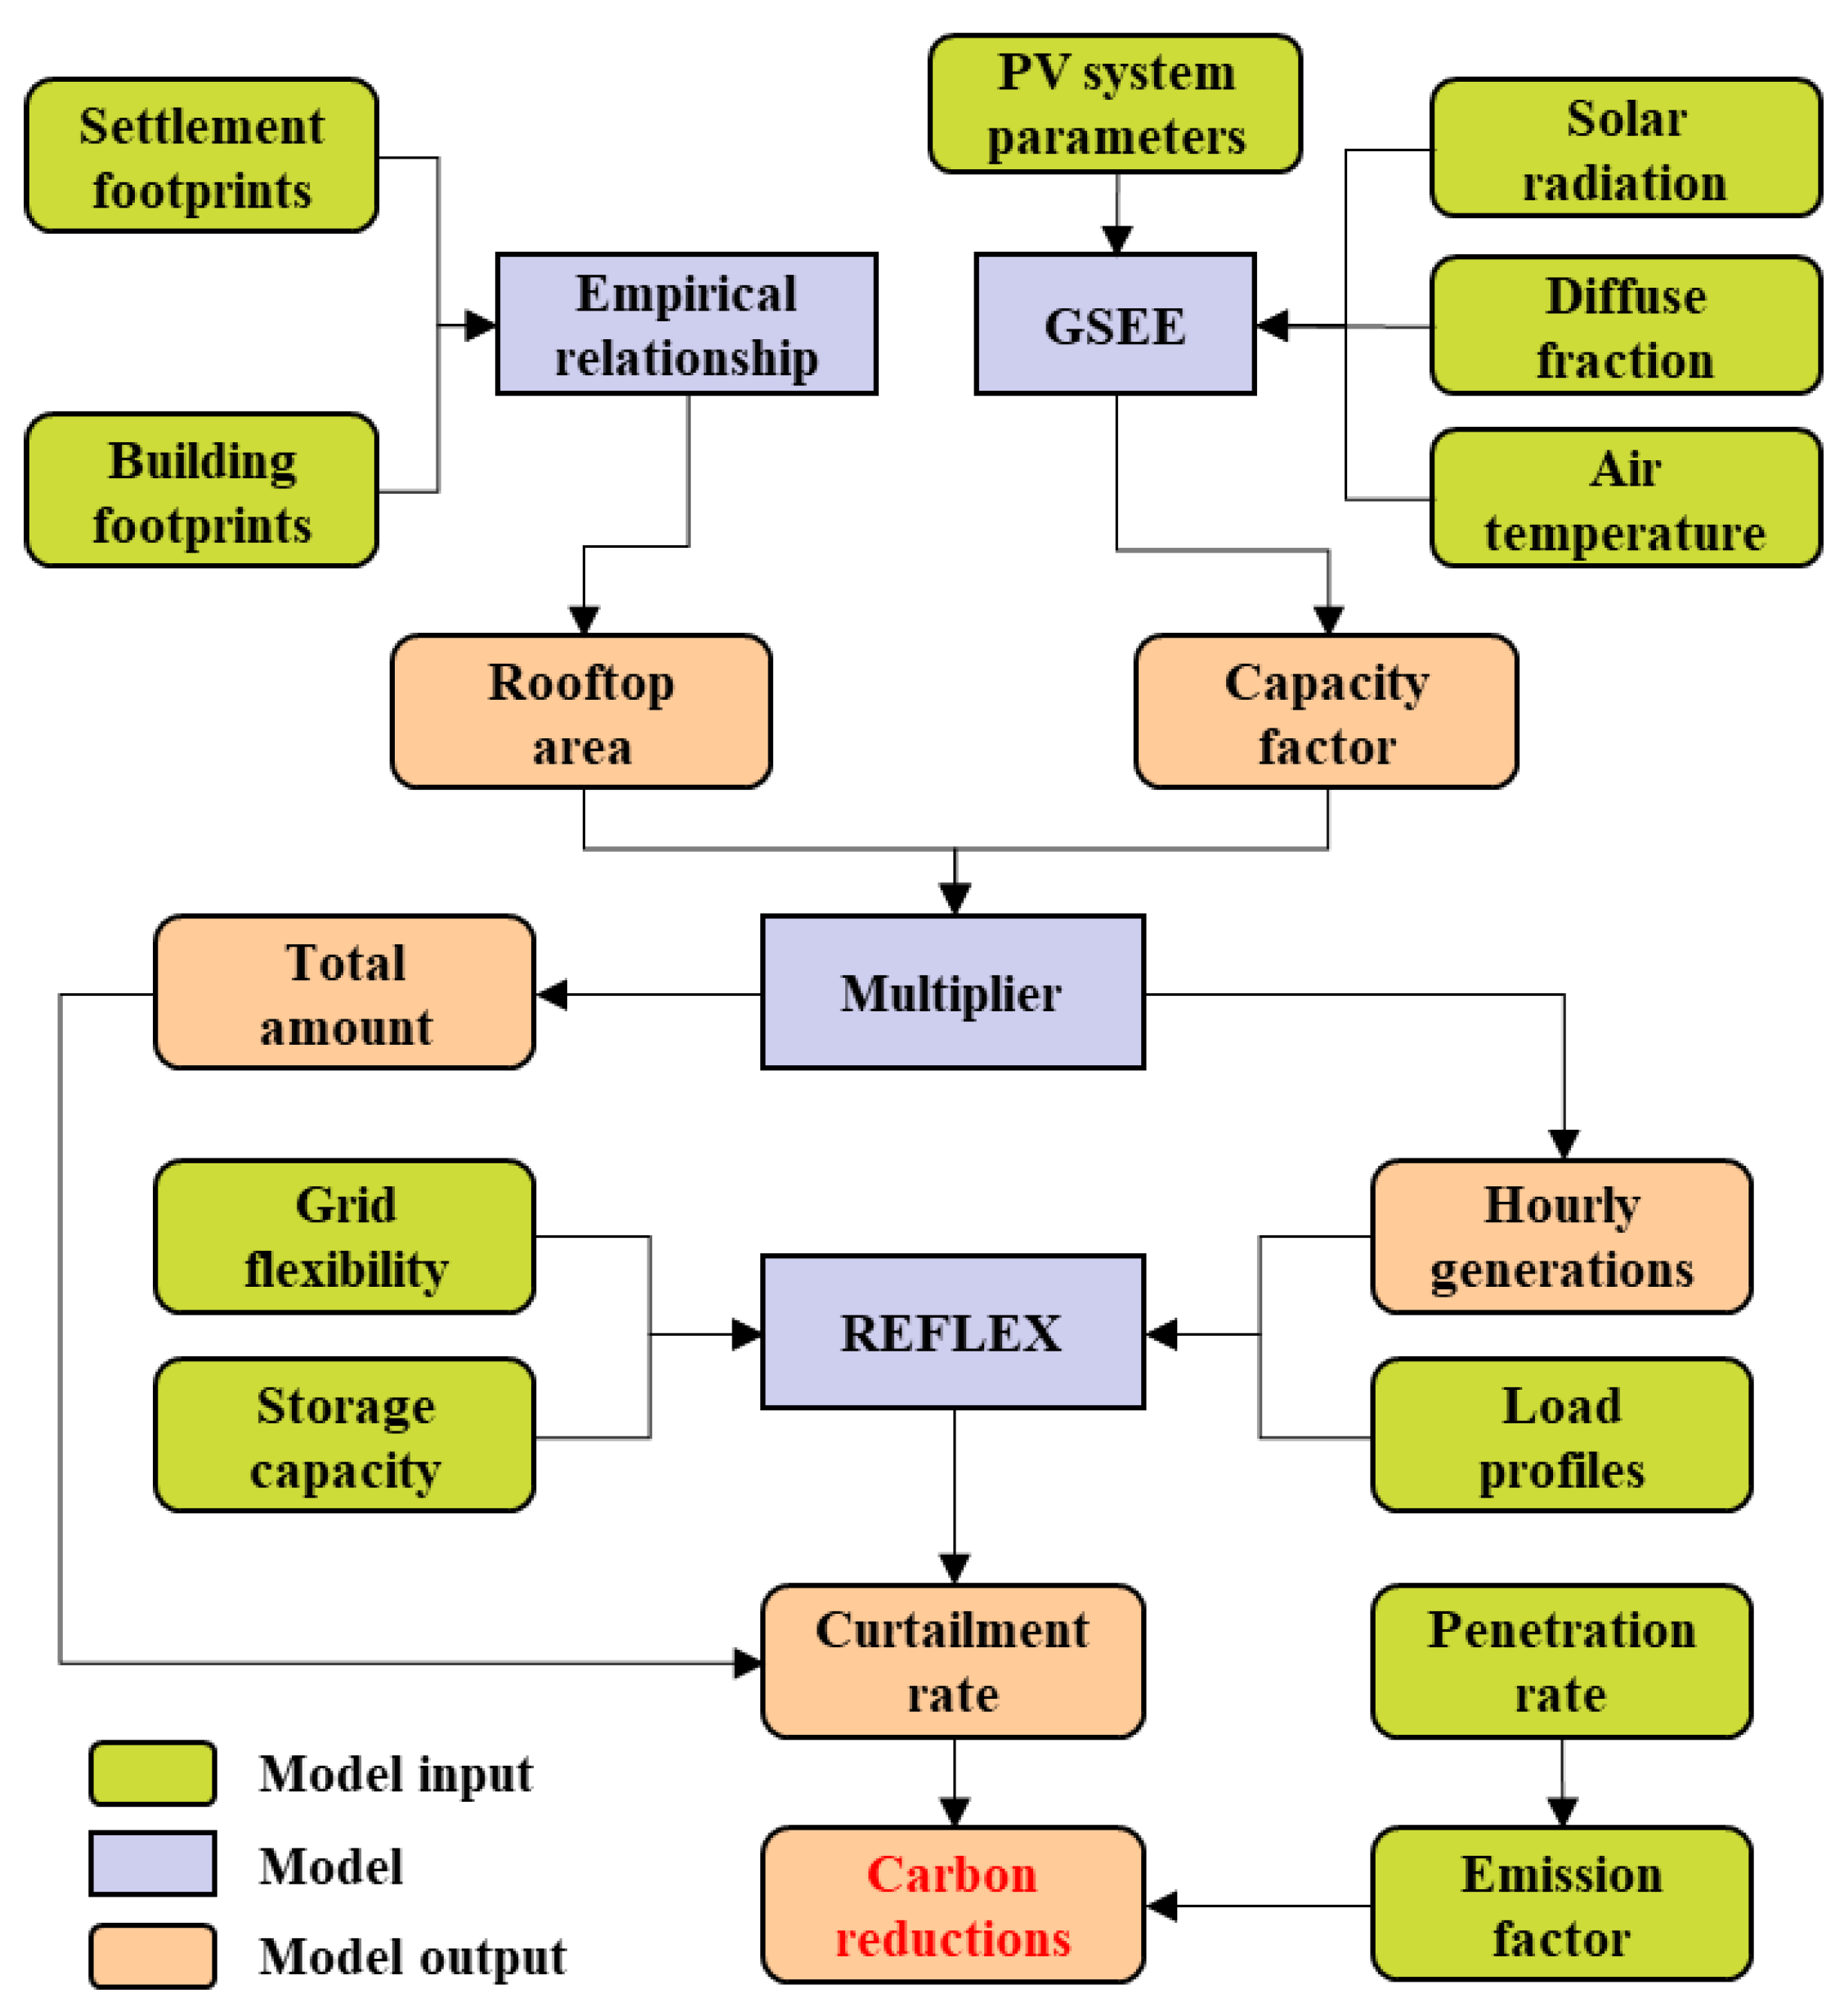
The high-resolution mapping of the distribution of China’s rooftop PV potential. An empirical relationship was established to estimate the rooftop area from the settlement area. Multi-source remote sensing data were integrated to simulate the spatio-temporal variation in rooftop PV electricity generation.
(2)
The technical framework for calibrating the overestimation of carbon emission reduction. Rooftop PV generation curves and customer-side load profiles were combined to obtain the PV curtailment rates during electricity dispatch. Current PV penetration rates were used to calibrate the grid emission factors for PV-specific ones.
(3)
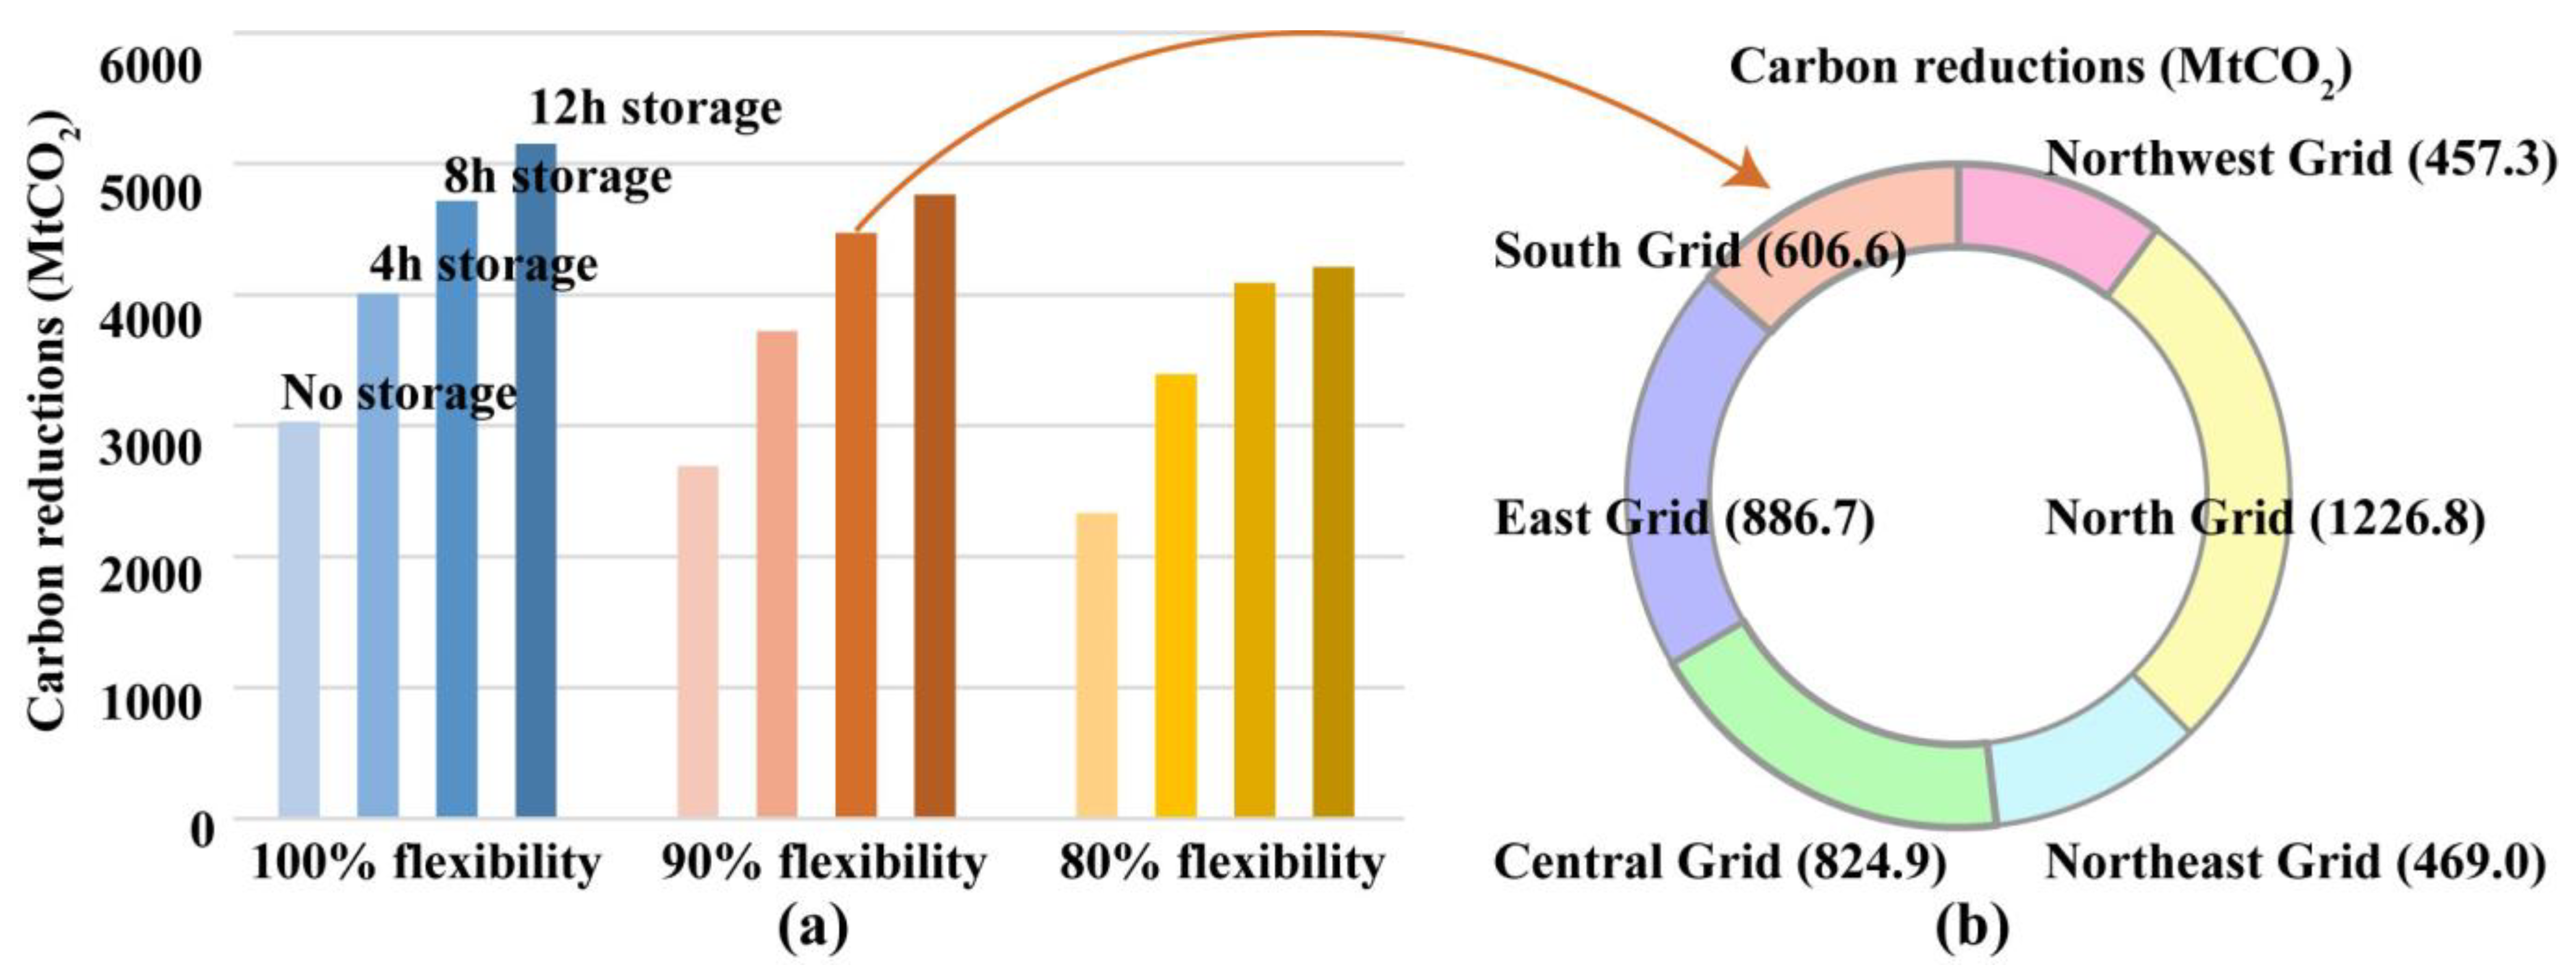
The quantification of carbon reductions in China’s rooftop PV. We designed twelve scenarios with 80%, 90%, and 100% flexibility and 0, 4, 8, and 12 h of storage capacity to reflect the differences in the grid’s ability to absorb intermittent PV electricity.
The paper is organized as follows. Section 2 describes the remote sensing data, including settlement footprints, building footprints, solar radiation, and air temperature, as well as the models used for PV generation simulation and dispatch analysis. Section 3 shows the results for rooftop PV potential and carbon reduction potential. Further discussion is presented in Section 4, and conclusions are drawn in Section 5.

2. Materials and Methods

The workflow for assessing the carbon reduction potential of rooftop PV through remote sensing data-driven simulations is shown in Figure 1.
First, an empirical relationship between settlement footprints and building footprints was built to map the national rooftop area and its distribution. Second, remote sensing data on total solar radiation, diffuse fraction, and air temperature, as well as PV system parameters, were fed into the Global Solar Energy Estimator (GSEE) [39] to simulate the PV system’s electricity generation efficiency, which is measured by the capacity factor (CF) defined as the ratio of a PV system’s actual output over a given period to the maximum output under standard test conditions over that period. Third, the Renewable Energy Flexibility (REFLEX) [40] model was used for dispatch modeling based on hourly PV generations and load profiles, given grid flexibility, storage capacity, and other settings. Finally, potential carbon reductions were calculated according to the simulated curtailment rate, the total amount of rooftop PV generation and known penetration rates, and emission factors.

2.1. Estimation of Rooftop Resources

Accurate surveys of rooftop area rely on very high resolution (e.g., WorldView, GeoEye, and Pleiades satellites) and LiDAR remote sensing [7,20,41]. However, this approach faces challenges of high cost and low efficiency when applied over large areas. Therefore, it is impractical to conduct rooftop surveys over the 9.6 million square kilometers of China’s territory. In contrast, extracting settlement footprints from moderate- or high-resolution remote sensing is more cost-effective, and settlement footprint products with global coverage are already available [42,43]. Figure 2a shows the settlement area in China at 500 m resolution, which is aggregated from the world settlement footprint products [43]. These settlement footprints indicate the extent to which the buildings locate and can be used as a reference for rooftop area estimation.
Regional building footprint extraction has been conducted in many regions [44,45]. Previously, we conducted a rooftop footprint survey in Jiangsu Province by fusing multi-source remote sensing images [7]. Figure 2b shows the rooftop area distribution based on the sub-meter building footprints. We counted the settlement area and rooftop area of each town in Jiangsu Province and found that these two areas had a significant linear correlation with a coefficient of determination of 0.9247 at a 95% confidence level (Figure 3a). Such a correlation was also observed at the global scale [27]. We further validated this correlation at the county level and observed a coefficient of determination of 0.9495 at a 95% confidence level (Figure 3b), implying the stability of the relationship across different scales. Here, we extended this relationship to the entire country to map the rooftop area based on the settlement area at 500 m resolution. In addition, according to the experiences in Europe and China, only about 60% of the rooftop is suitable for PV installations [7,8]. Therefore, the effective rooftop area ( A r )  was calculated from the settlement area ( A s ) as:
A r = 0.6 × 0.3633 × A s

2.2. Simulation of PV Generation

In this study, we used GSEE [39] to simulate the PV system’s performance, pixel by pixel, at a spatial resolution of 500 m, and on an hourly basis. Its inputs consisted of climate data from remote sensing inversion (mainly including solar radiation and air temperature) and PV system parameters (including installed capacity, panel orientation, panel tilt angle, panel material, and inverter efficiency). Hourly solar radiation data were from geostationary meteorological satellite images. Jiang et al. [46] produced hourly solar radiation products in China using an outstanding deep learning algorithm, and the accuracy was proven to be superior over other products [47]. Here, we collected the hourly data from 2007 to 2018 and used multi-year averages for simulation. The distribution of annual total solar radiation and the fraction of diffuse solar radiation are illustrated in Figure 4a,b, respectively. We assumed that all rooftop PV systems were south-facing and tilted at an optimal angle ( θ T ) that varied with the latitude ( φ ) and diffuse fraction ( R d ), as [48]:
θ T = 4.521 + 0.430 × φ + 0.006 × φ 2 + 54.504 × R d 80.712 × R d 2
This empirical relationship was validated at 98 radiation stations in China [48]. Figure 4c shows the calculated distribution of θ T  in China according to the empirical relationship and spatial estimates of the diffuse fraction. Hourly air temperatures (Figure 4d) were retrieved from the ERA5-Land reanalysis data [49]. We simulated the performance of PV modules composed of crystalline silicon material, assuming an inverter loss of 10%. The installed capacity was set to 1 kW; hence, the output of GSEE was equal to CF.
When the CF is known, the PV electricity generation ( E P V ) can be calculated as:
E P V = A r × D P × C F ,
with D P  denoting the PV installation density (here, a density of 74 W/m2 was adopted according to the practices in Jiangsu Province, China [7]). In addition, the coefficient of variation (CV) in daily averaged CF was calculated to provide a comparable understanding of the variability in rooftop PV generations [50]:
C V = δ μ ,
where δ  and μ  denote the standard deviation and mean of CF, respectively.

2.3. Calculation of Carbon Reductions

If the electricity generated by rooftop PV is delivered to the electrical grid to replace the power from other sources, rooftop PV contributes to carbon emission reductions. We calculated CO2 equivalent emission reductions ( C r ) based on the approach provided by the Intergovernmental Panel on Climate Change (IPCC) [51]:
C r = 1 R c × A D × E F 1 R p ,
where A D  represents activity data, equaling the amount of PV electricity consumption ( E P V ) in this study; E F  represents the emission factor that is associated with each unit of electricity supplied by a grid (tCO2e MWh−1); and R c  and R p  denote the curtailment rate and the penetration rate, respectively.
PV generation varies depending on local weather conditions, so they do not always correlate well with customer-side demand. If PV generation exceeds the net demand, the excess generation is at risk of being curtailed. In Equation (5), we introduce ( 1 R c )  to correct for the decline in A D  due to the curtailment; that is, this item indicates the proportion of rooftop PV generation that is delivered to the grid. We used the REFLEX model to simulate the electricity dispatch of each regional grid (Figure 5a) to obtain the R c  value when their respective rooftop PV potential was fully released. The REFLEX model compares the generations from rooftop PV and other plants with the net system load, hour by hour, to calculate the fraction of load met by PV generation. When PV generation exceeds the net load, the excess portion is curtailed or placed into storage, if available. The amount of storage in a grid is characterized by the average hourly load, for example, if the average hourly load is 30 GW, 2 h storage represents 60 GWh of energy capacity. The REFLEX model can evaluate the ability of an entire grid system to accommodate variable generations (e.g., solar PV and wind) according to the minimum generation level across the system. The minimum generation level represents the limit of both baseload generators, as well as generators that must remain online to reliably meet the variability and uncertainty of the net load and can be more generally expressed as the system flexibility, defined as the fraction of the must-run generators below the annual peak [36]. In this study, we designed a set of scenarios with different flexibility (80%, 90%, and 100%) and storage capacity (4 h, 8 h, and 12 h) levels. The typical load profiles of each grid were extracted from the report issued by the National Energy Administration [52]. The example of the Beijing grid is displayed in Figure 5b,c. The hourly loads throughout the year were calculated as [52]:
L i , j = L p e a k , i H m a x H j H m a x H m i n L p e a k , i L b a s e , i ,
where H j  denotes the load at hour j , H m a x  is the maximum load, and H m i n  is the minimum load, whose values vary depending on whether the day belongs to weekdays (blue line in Figure 5b) or weekends (brown line in Figure 5b). L i , j  denotes the load at hour j  of day i , L p e a k , i  is the peak load of day i  (red line in Figure 5c), and L b a s e , i  is the base load of day i  (green line in Figure 5c).
Emission factors are sourced from China’s Regional Grid Emissions Factors 2019 [53]. We used the operating margins (OMs) that represented emission factors from existing power plants in the electric grid, and the values for the northwest, north, northeast, central, east, and south grids were 0.8922, 0.9419, 1.0826, 0.8587, 0.7921, and 0.8042 tCO2/MWh, respectively. Since these values were calculated for a generation mix that already included zero-emission PV electricity and rooftop PV did not displace existing clean energy on the grid, the emission reductions calculated by directly applying these factors were underestimated. Here, we used the current renewable energy penetration rate (Figure 6a, sourced from https://www.bjx.com.cn/, accessed on 30 December 2022) to correct for this underestimation, as E F ( 1 R p ) .
For clear recognition of the magnitude of emission reductions from rooftop PV, we defined a metric called the carbon offset rate ( R o ):
R o = C r C a
This metric compared the emission reductions ( C r ) to the total CO2 emissions in 2019 ( C a ). The emission inventories for each regional grid (Figure 6b) were collected from the China Emission Accounts and Datasets (https://www.ceads.net.cn/, accessed on 30 December 2022) [54]. R o 1  indicated that carbon neutrality could be achieved within the grid by developing rooftop PV.

3. Results

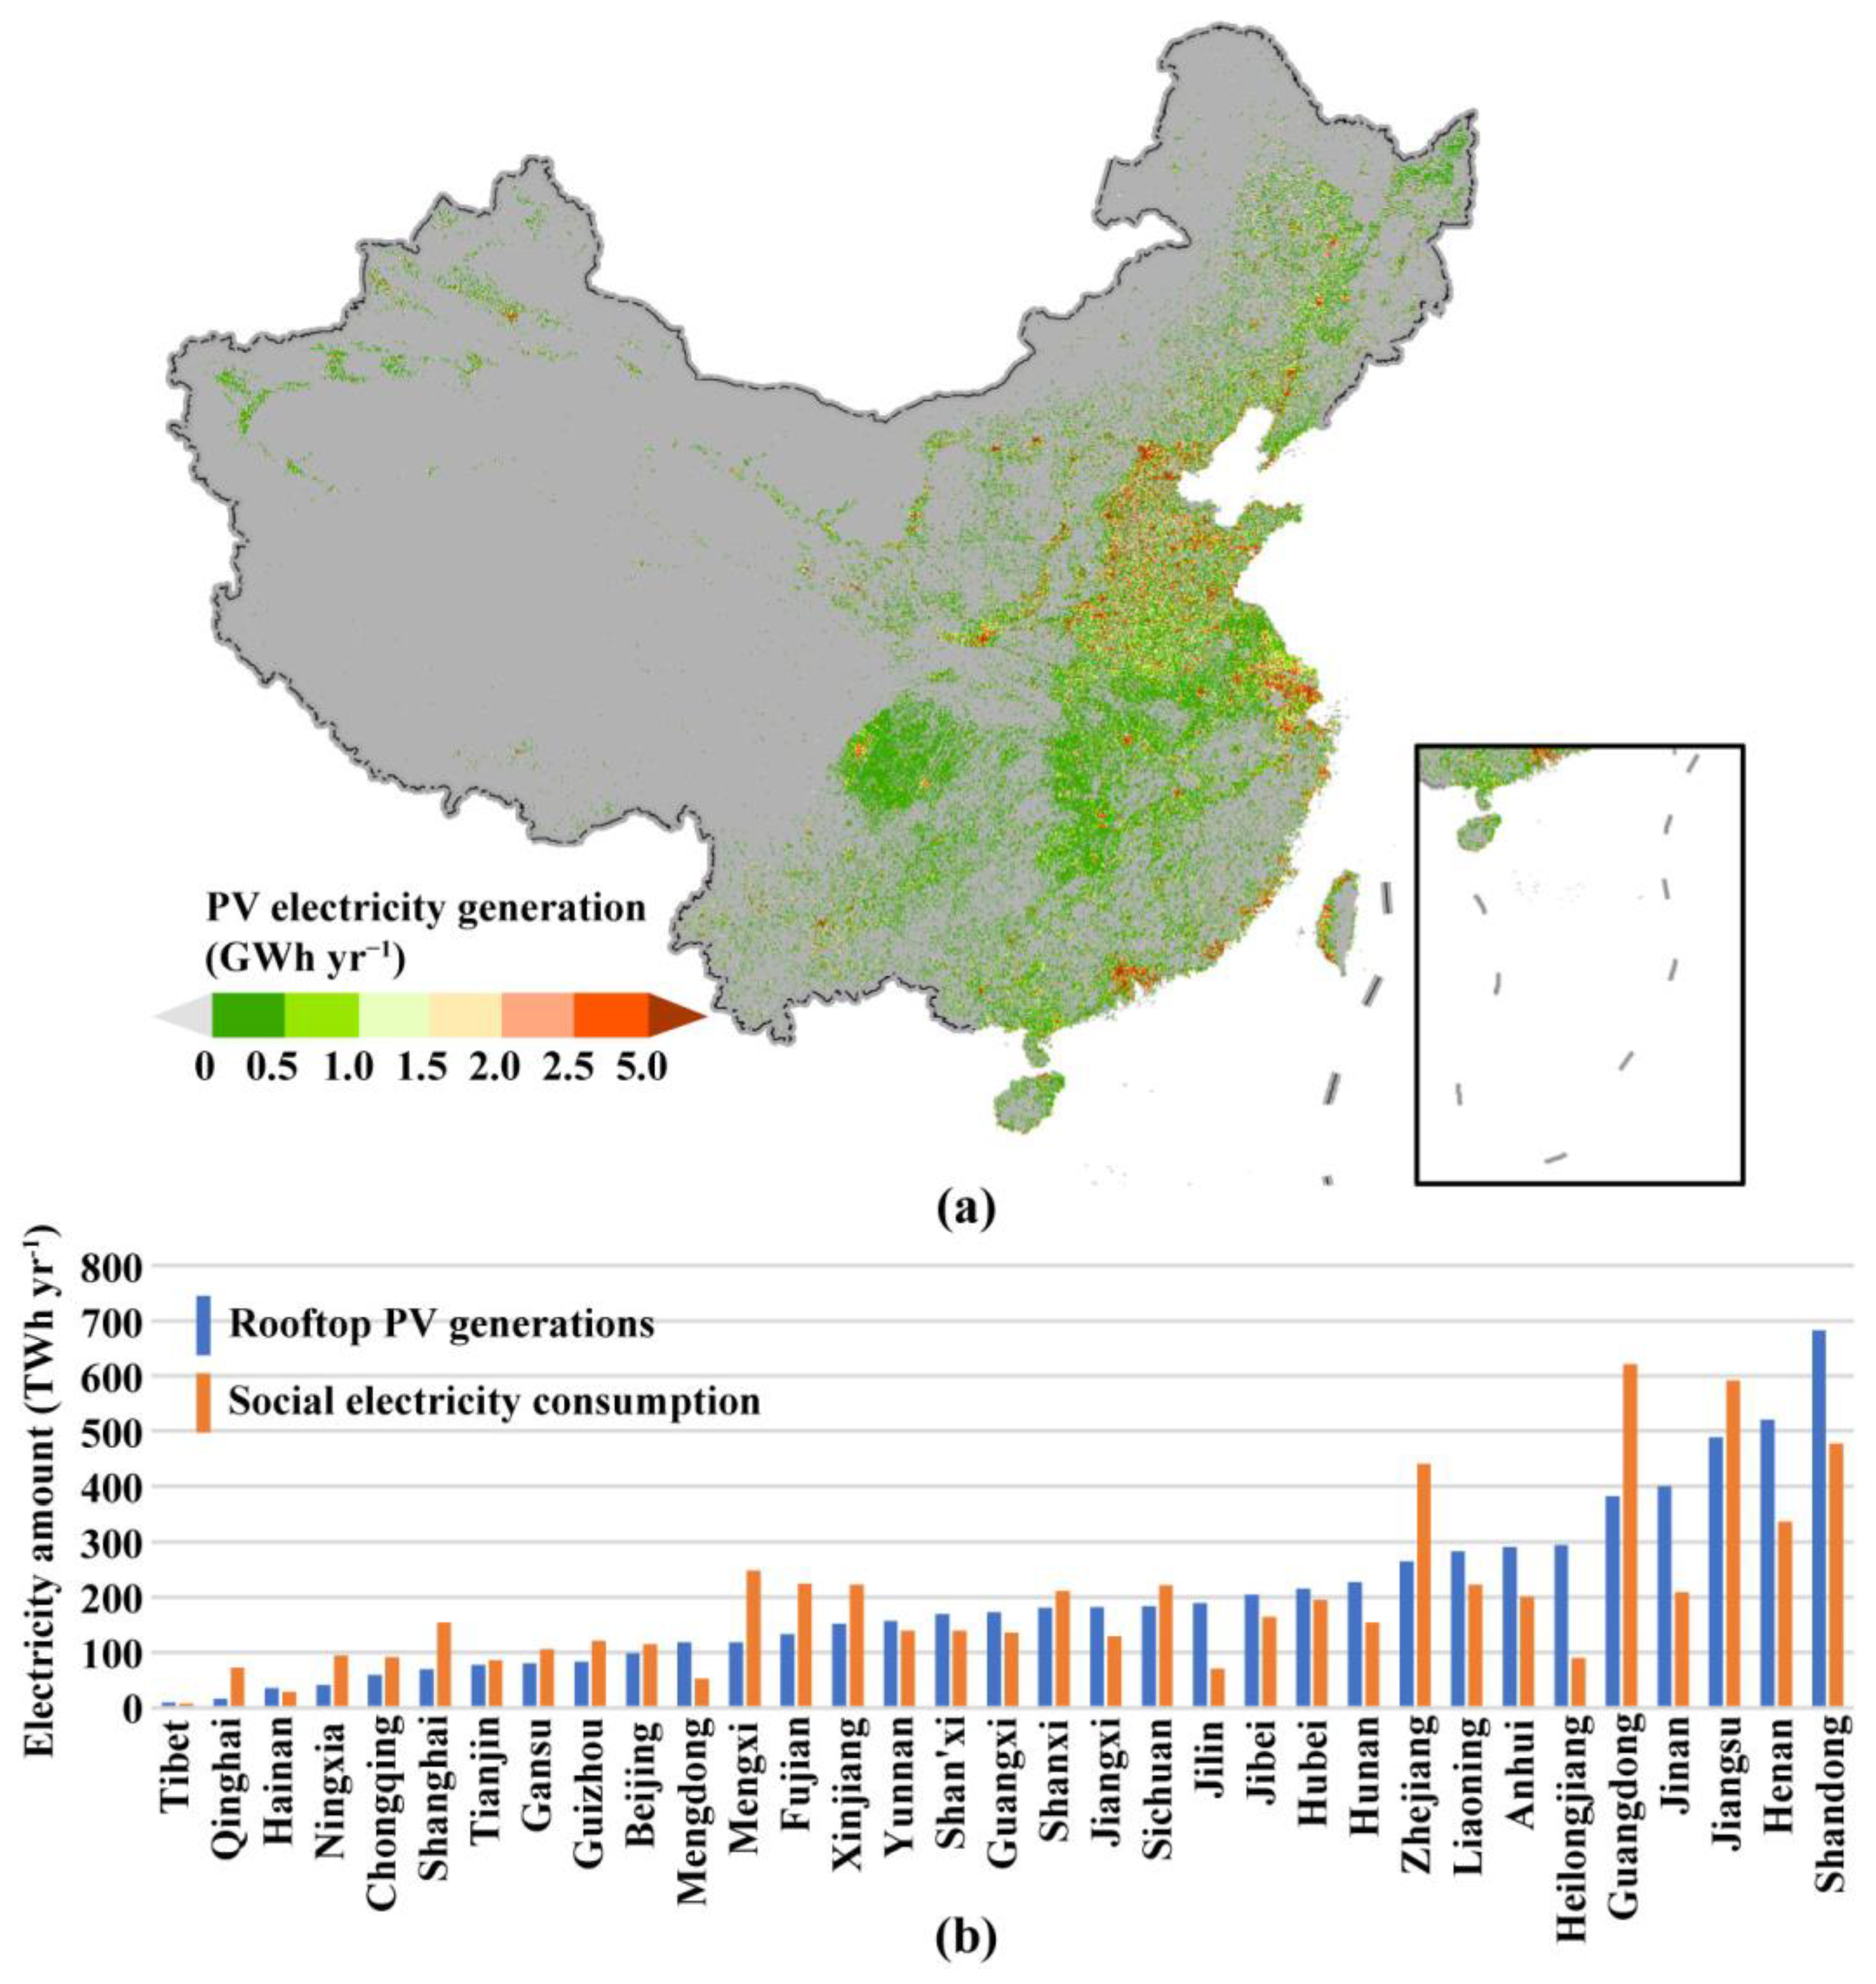
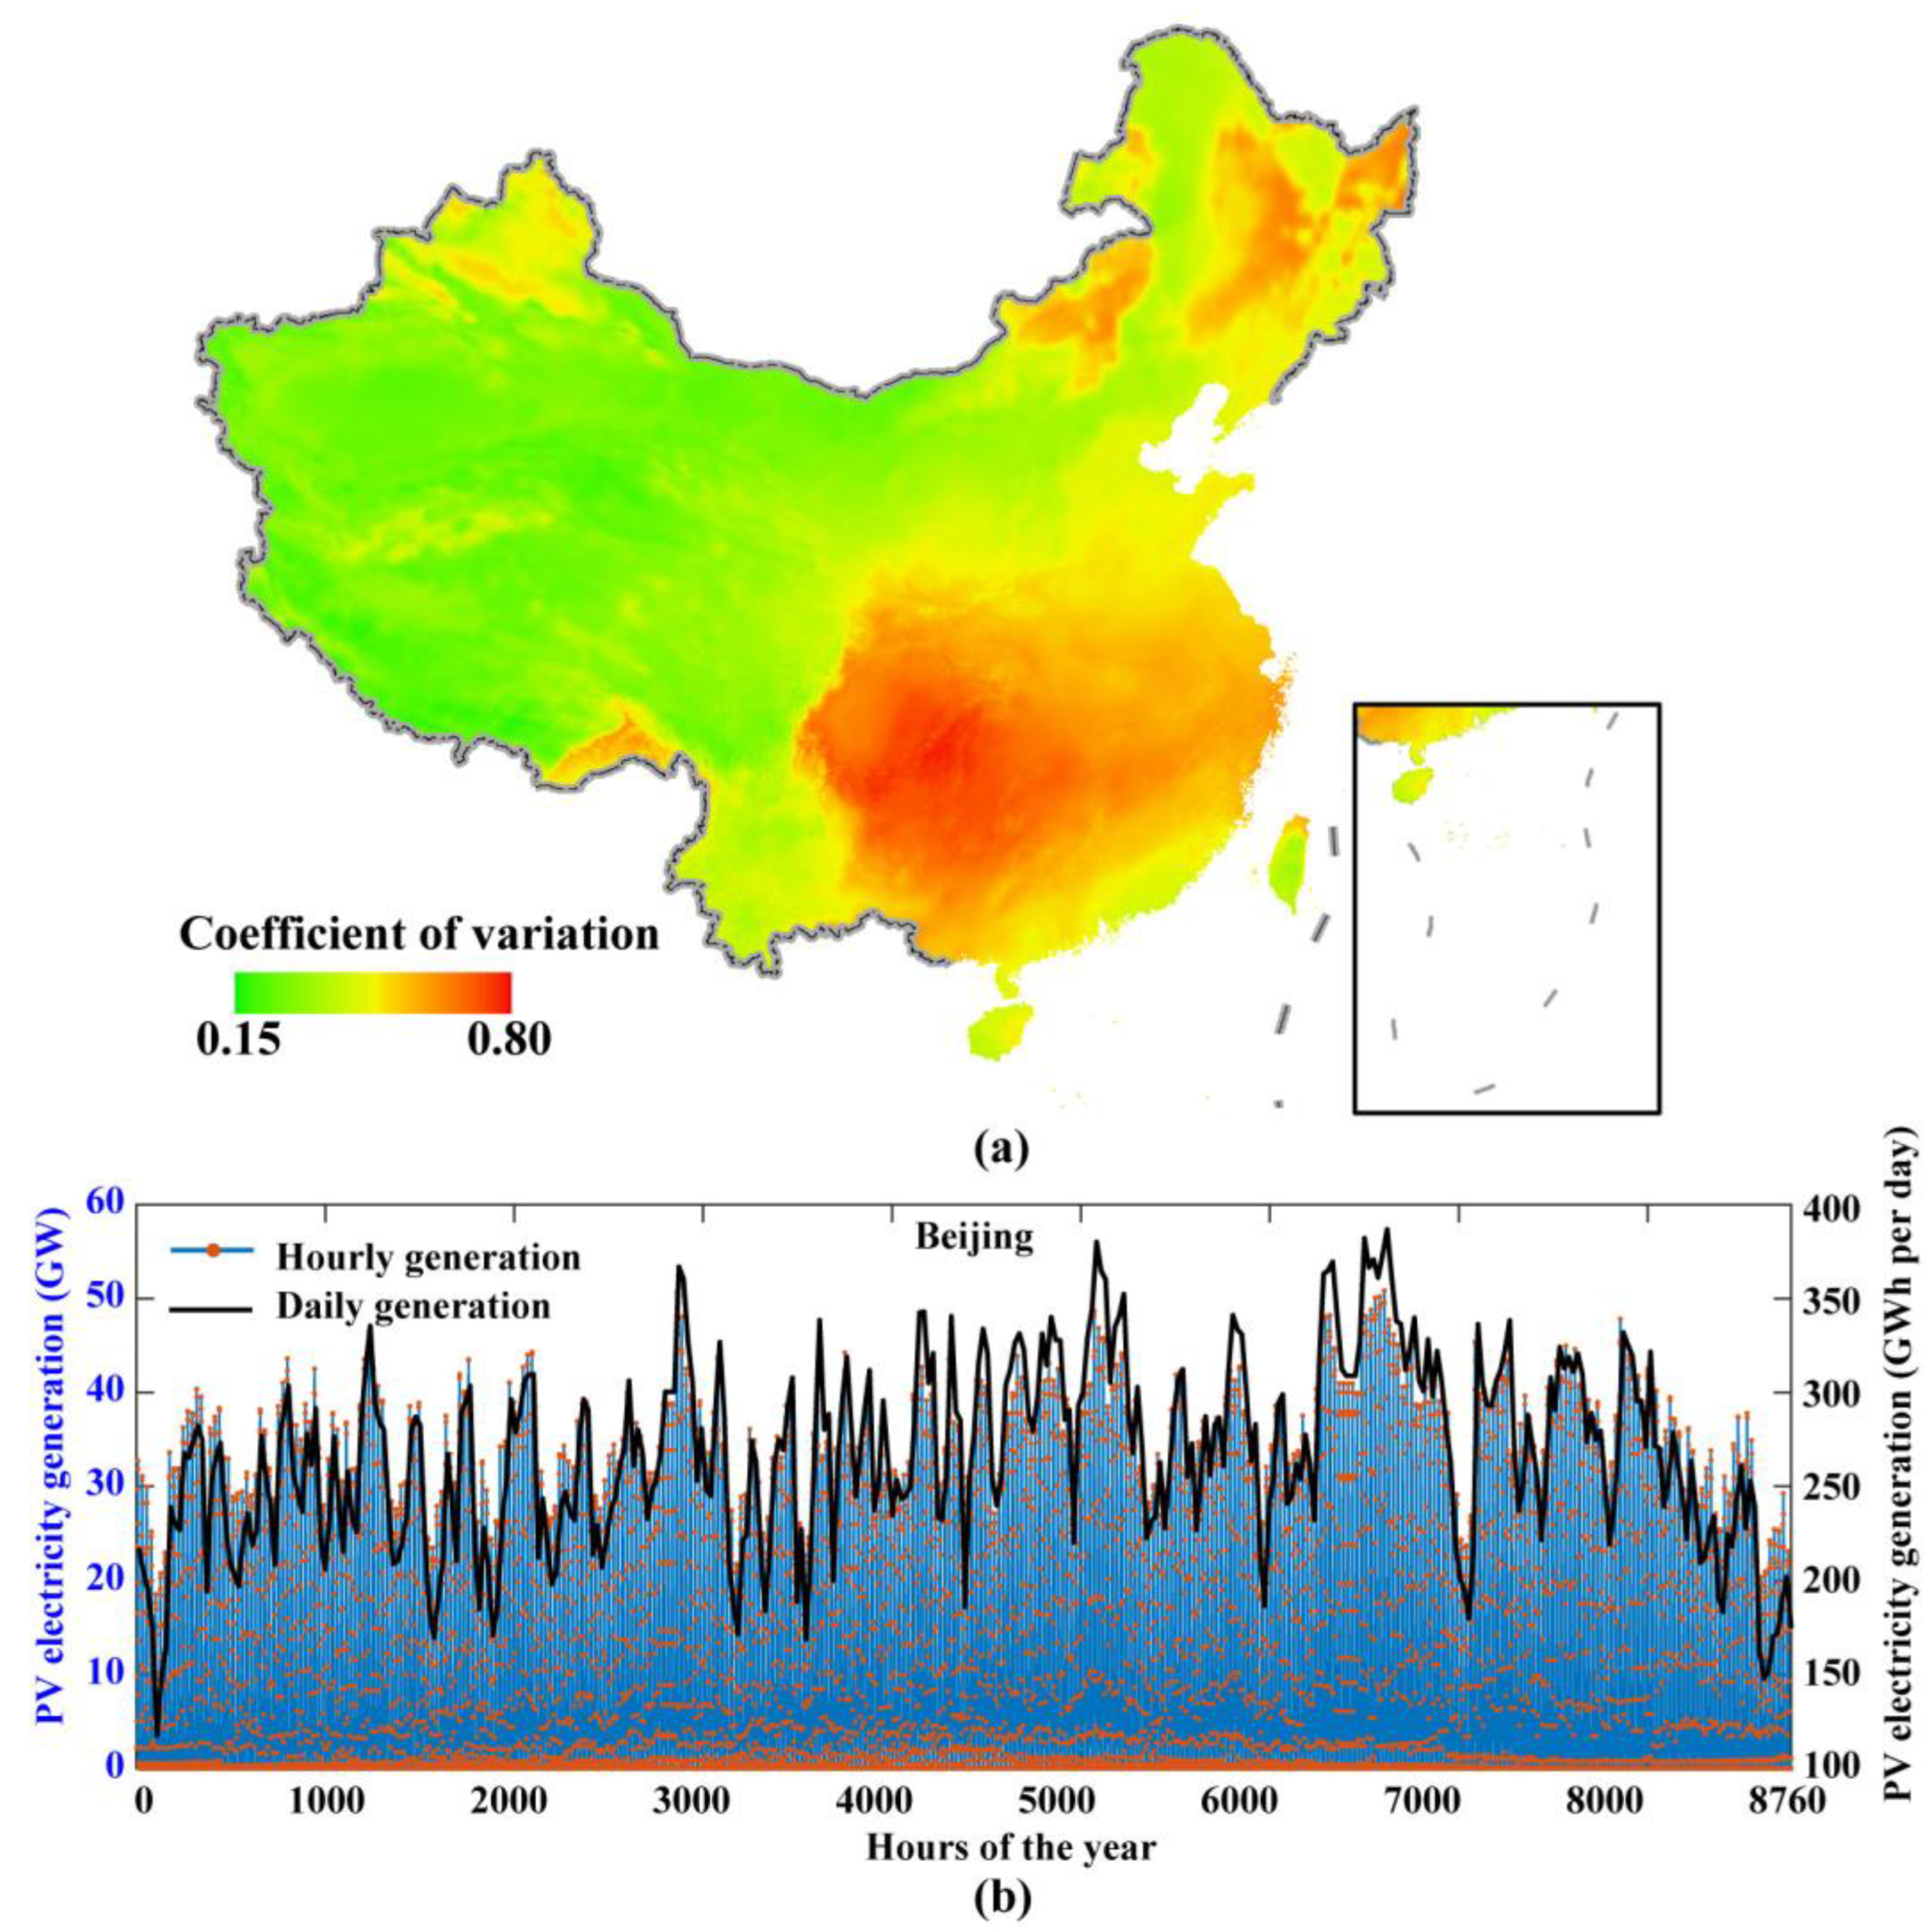
3.1. Electricity Generation Potential

Figure 7 shows the spatial distribution of rooftop PV electricity generation potential, as well as statistics by regional grid. In total, the theoretical maximum potential reached 6.5 PWh yr−1, of which, more than 80% was concentrated in the eastern part of China. The North China Plain, Yangtze River Delta, and Pearl River Delta represented the most notable hotspots. The potential per unit area (500 m × 500 m) in these regions could exceed 5 PWh yr−1. However, the western parts with high-quality solar energy resources accounted for less than 20% of the potential. As for the 33 regional grids, Shandong (681.9 TWh yr−1), Henan (521.0 TWh yr−1), Jiangsu (489.3 TWh yr−1), Jinan (400.3 TWh yr−1), and Guangdong (381.7 TWh yr−1) grids had the greatest potential. According to energy statistics, these grids were in the front ranks of electricity consumption (Figure 7b). Such a coincidence reflects the advantages of rooftop PVs; that is, their electricity generation is close to the energy demand.
Figure 8a illustrates the variability of rooftop PV electricity generation, expressed as the CV of the daily averaged CF. In general, the variability was small in western China while large in eastern China (especially in the south). The variability was extremely high (CV > 0.6) in the Sichuan basin and the middle and lower reaches of the Yangtze River, due to frequently cloudy and rainy weather. The spatial pattern of CV implied that most rooftop PV generations were characterized by significant volatility and uncertainty. Spatial aggregation was an effective way to reduce volatility. As demonstrated by the case of the Beijing grid (Figure 8b), the variability remained high after aggregation. Moreover, the fluctuations were highly stochastic and irregular in nature, making them difficult to forecast [55]. This issue was compounded by the shortened forecasting horizon because the fluctuations were more frequent and drastic at finer time scales (cf. the black and blue lines in Figure 8b). When comparing the hourly rooftop PV generations with the load profiles of the Beijing grid (Figure 5c and Figure 8b), the mismatch between the two was clear. This mismatch magnified the difficulty of electricity dispatch [34]. Meanwhile, the increased variability imposed a more cyclic operating profile on dispatchable generation, with considerable cost implications [56].

3.2. Carbon Reduction Potential

We calculated the ratio of the minimum base load relative to the maximum peak load as a lower bound for grid flexibility in our scenario design. Based on the calculation results, we simulated the potential carbon reductions in the 33-region grid under 80%, 90%, and 100% flexibility and 0, 4, 8, and 13 h of storage capacity (Table 1). As shown in Figure 9a, the carbon reduction potential declined with decreasing flexibility. A less flexible grid had more electricity from must-run units, so the net load to be met by variable PV generations was lower, putting rooftop PV at greater risk of curtailment [36]. The adoption of energy storage technology enhanced the capability of reducing carbon emissions (Figure 9a). Rooftop PV systems generate electricity during the daytime and store the excess to meet the load during the nighttime, ensuring that more electricity can eventually be consumed. Given 100% grid flexibility, 4 h storage capacity increased carbon reductions by 30% compared to the no-storage scenario. In contrast, at the same 100% flexibility, 12 h storage capacity increased the carbon reduction potential by only 9% compared to the 8 h storage case, suggesting that the role of storage diminished with expanding capacity. Because of the diminishing effect, 8–12 h storage capacity hardly worked at 80% flexibility. In the scenario with 90% grid flexibility and 8 h storage capacity, the total carbon reductions reached 4471.2 MtCO2, consisting of 457.3 MtCO2 from the Northwest grid, 1226.8 MtCO2 from the North grid, 469.0 MtCO2 from the Northeast grid, 824.9 MtCO2 from the Central grid, 886.7 MtCO2 from the East grid, and 606.6 MtCO2 from the South grid (Figure 9b).
Using the total CO2 emissions in 2019 as a reference, we calculated the minimum and maximum offset rates for each grid among the twelve scenarios simulated, as shown in Figure 10a,b, respectively. Overall, the North and Central grids were relatively poor, with most grids having minimum offsets of less than 20%; while the East and South grids fared well, with most grids having maximum offsets exceeding 50%. Except for the Qinghai grid, all other grids witnessed varying degrees of improvement in the offset, owing to the increased flexibility and storage capacity. The Qinghai grid itself had little rooftop PV potential, so curtailment rarely occurred, even when the peak output of the rooftop PV came across the lowest base load. Energy storage did not make sense for the Qinghai grid (Table 1). By comparison, the Guizhou, Mengxi, Ningxia, and Chongqing grids were the most worrisome, while the Guangdong, Zhejiang, and Beijing grids were the most exciting in terms of both minimum and maximum offset rates. In addition, we can conclude that carbon neutrality cannot be achieved in China by relying on rooftop PV alone, given that the offset rates of all grids were below 100% in all scenarios.

4. Discussion

Our evaluations revealed that China has a considerable amount of rooftop PV electricity generation. Although rooftop PV potential showed great spatial heterogeneity, it exhibited a good match with energy demand (Figure 7). On the one hand, the major energy-consuming provinces, such as Guangdong, Shandong, Jiangsu, and Zhejiang, were at the forefront in terms of the total potential; on the other hand, the potential was mainly concentrated in urban areas with high intensities of energy consumption. This is precisely the advantage of rooftop PV over large ground-based PV plants: helping not only to reduce energy losses in transmission but also to save on electricity transmission costs [37,57]. In addition, rooftop PV offers the option of bypassing land competition. If the same amounts of rooftop PV electricity were obtained by installing ground-based PVs, a minimum net area of approximately 30,196 square kilometers would be required, which would be equivalent to six Shanghai cities. This is almost unacceptable for the densely populated eastern region, where land resources are inherently competitive [9].
In addition to being directly related to the number of electricity generations, carbon emission reduction is also affected by market consumption [58]. In this study, we quantified this effect through electricity dispatch based on hourly generation simulations and load profiles. The results revealed that fully releasing the potential of rooftop PV could reduce CO2 equivalent emissions by 2.3–5.2 Gt, lower than those (~5.9 Gt) emitted when the generated electricity is completely consumed without curtailment. Nevertheless, the potential reduction is equal to 21%–47% of China’s total emissions in 2019 [54]. Such a scale is sufficient to make a significant contribution to China’s carbon neutrality [59,60]. Our study highlights the importance of increasing grid flexibility and preparing energy storage to obtain a greater amount of carbon reduction. When grid flexibility increased from 80% to 100%, carbon reductions increased by about 25%, and an additional increase of about 60% was attainable if 8–12 h of energy storage were available. It is worth noting that the effect of increased flexibility and energy storage varied from grid to grid (Table 1), suggesting that rooftop PV development planning should be tailored to local conditions.
The amount of both roof resources and energy consumption reflects, to some extent, the level of regional development, and thus, the two coincide spatially. In contrast, carbon emission intensity was higher in the developed eastern regions than in the central and western regions, so the total emissions were not consistent with the rooftop PV potential in space. This leads to significant spatial differences in the process of carbon neutrality that depend on rooftop PV (Figure 10). Based on the twelve scenarios simulated, we presented a plausible range of offset rates. It should be noted that the offset rates can be further enhanced by using larger energy storage or other means, such as load shifting, and may be decreased if the flexibility is lowered. However, the uncertainty will not be great, as 12 h of energy storage and 80% flexibility is close to the limit. In addition, increased flexibility and greater storage capacity are not necessarily better because their effectiveness also depends on the characteristics of customer-side loads and PV generations in the grid. This, once again, emphasizes the importance of differentiated layout and planning when developing rooftop PV, which may also be true for other PV development.

5. Conclusions

In this study, we designed a technical framework for integrating multi-source remote sensing data to assess the carbon reduction potential of rooftop PV. The key point was to obtain the PV curtailment rate through a dispatch model based on the spatio-temporal simulations of hourly PV generation and the load profiles of each grid. The main conclusions include:
(1)
The maximum electricity generation of rooftop PV in China reached 6.5 PWh yr−1, of which more than 80% was concentrated in densely populated areas in the east and characterized by high variability.
(2)
Unlocking China’s full rooftop PV potential could reduce CO2 equivalent emissions by 2.3–5.2 Gt, depending on the grid flexibility and storage capacity.
(3)
The potential carbon reductions could offset 21%–47% of China’s total emissions, using the data in 2019 as a reference; thus, it could make a significant contribution to carbon neutrality.
(4)
Both carbon reductions and their offset rates vary greatly from grid to grid, highlighting the need for rooftop PV development plans tailored to local conditions.

Author Contributions

Conceptualization, H.J. and N.L.; methodology, H.J.; software, N.L.; validation, X.W.; formal analysis, H.J.; investigation, N.L.; resources, H.J. and X.W.; data curation, X.W.; writing—original draft preparation, H.J.; writing—review and editing, N.L.; visualization, H.J.; supervision, N.L.; project administration, N.L.; funding acquisition, H.J. All authors have read and agreed to the published version of the manuscript.

Funding

This research was funded by the Open Fund of the State Key Laboratory of Remote Sensing Science (Grant No. OFSLRSS202204), the China Postdoctoral Science Foundation (Grant No. 2021M703176), and the National Natural Science Foundation of China (Grant No. 42201382).

Institutional Review Board Statement

Not applicable.

Informed Consent Statement

Not applicable.

Data Availability Statement

The settlement footprint datasets are available at https://download.geoservice.dlr.de/WSF2019/files/ (accessed on 30 December 2022). The solar radiation data are freely accessible from the Pangaea at https://doi.org/10.1594/PANGAEA.904136 (accessed on 30 December 2022). The load profiles for the 33 regional grids are from the report at https://www.ndrc.gov.cn/xwdt/tzgg/202012/P020201202546044875868.pdf (accessed on 30 December 2022). Other datasets are available from the authors on reasonable request.

Conflicts of Interest

The authors declare no conflict of interest.

References

  1. Chen, X.; Liu, Y.; Wang, Q.; Lv, J.; Wen, J.; Chen, X.; Kang, C.; Cheng, S.; McElroy, M.B. Pathway toward carbon-neutral electrical systems in China by mid-century with negative CO2 abatement costs informed by high-resolution modeling. Joule 2021, 5, 2715–2741. [Google Scholar] [CrossRef]
  2. Lu, X.; Chen, S.; Nielsen Chris, P.; Zhang, C.; Li, J.; Xu, H.; Wu, Y.; Wang, S.; Song, F.; Wei, C.; et al. Combined solar power and storage as cost-competitive and grid-compatible supply for China’s future carbon-neutral electricity system. Proc. Natl. Acad. Sci. USA 2021, 118, e2103471118. [Google Scholar] [CrossRef] [PubMed]
  3. IEA. Solar PV; International Energy Agency (IEA): Paris, France, 2022. [Google Scholar]
  4. Liu, L.; Sun, Q.; Li, H.; Yin, H.; Ren, X.; Wennersten, R. Evaluating the benefits of integrating floating photovoltaic and pumped storage power system. Energy Convers. Manag. 2019, 194, 173–185. [Google Scholar] [CrossRef]
  5. Xue, J. Photovoltaic agriculture—New opportunity for photovoltaic applications in China. Renew. Sustain. Energy Rev. 2017, 73, 1–9. [Google Scholar] [CrossRef]
  6. Cheng, C.L.; Sanchez Jimenez, C.S.; Lee, M.-C. Research of BIPV optimal tilted angle, use of latitude concept for south orientated plans. Renew. Energy 2009, 34, 1644–1650. [Google Scholar] [CrossRef]
  7. Jiang, H.; Yao, L.; Lu, N.; Qin, J.; Liu, T.; Liu, Y.; Zhou, C. Geospatial assessment of rooftop solar photovoltaic potential using multi-source remote sensing data. Energy AI 2022, 10, 100185. [Google Scholar] [CrossRef]
  8. Bódis, K.; Kougias, I.; Jäger-Waldau, A.; Taylor, N.; Szabó, S. A high-resolution geospatial assessment of the rooftop solar photovoltaic potential in the European Union. Renew. Sustain. Energy Rev. 2019, 114, 109309. [Google Scholar] [CrossRef]
  9. Sacchelli, S.; Garegnani, G.; Geri, F.; Grilli, G.; Paletto, A.; Zambelli, P.; Ciolli, M.; Vettorato, D. Trade-off between photovoltaic systems installation and agricultural practices on arable lands: An environmental and socio-economic impact analysis for Italy. Land Use Policy 2016, 56, 90–99. [Google Scholar] [CrossRef]
  10. NEA. Notice of Publishing the List of Pilot Projects for Distributed Rooftop Photovoltaic Development in the Whole County (City or District). Available online: http://zfxxgk.nea.gov.cn/2021-09/08/c_1310186582.htm (accessed on 30 December 2022).
  11. Gassar, A.A.A.; Cha, S.H. Review of geographic information systems-based rooftop solar photovoltaic potential estimation approaches at urban scales. Appl. Energy 2021, 291, 116817. [Google Scholar] [CrossRef]
  12. Mohajeri, N.; Assouline, D.; Guiboud, B.; Bill, A.; Gudmundsson, A.; Scartezzini, J.-L. A city-scale roof shape classification using machine learning for solar energy applications. Renew. Energy 2018, 121, 81–93. [Google Scholar] [CrossRef]
  13. Machete, R.; Falcão, A.P.; Gomes, M.G.; Moret Rodrigues, A. The use of 3d GIS to analyse the influence of urban context on buildings’ solar energy potential. Energy Build. 2018, 177, 290–302. [Google Scholar] [CrossRef]
  14. Wu, A.N.; Biljecki, F. Roofpedia: Automatic mapping of green and solar roofs for an open roofscape registry and evaluation of urban sustainability. Landsc. Urban Plan. 2021, 214, 104167. [Google Scholar] [CrossRef]
  15. Debbarma, M.; Sudhakar, K.; Baredar, P. Thermal modeling, exergy analysis, performance of BIPV and BIPVT: A review. Renew. Sustain. Energy Rev. 2017, 73, 1276–1288. [Google Scholar] [CrossRef]
  16. Hong, T.; Koo, C.; Park, J.; Park, H.S. A GIS (geographic information system)-based optimization model for estimating the electricity generation of the rooftop PV (photovoltaic) system. Energy 2014, 65, 190–199. [Google Scholar] [CrossRef]
  17. Bergamasco, L.; Asinari, P. Scalable methodology for the photovoltaic solar energy potential assessment based on available roof surface area: Application to piedmont region (Italy). Sol. Energy 2011, 85, 1041–1055. [Google Scholar] [CrossRef]
  18. Assouline, D.; Mohajeri, N.; Scartezzini, J.-L. Quantifying rooftop photovoltaic solar energy potential: A machine learning approach. Sol. Energy 2017, 141, 278–296. [Google Scholar] [CrossRef]
  19. Zhong, T.; Zhang, Z.; Chen, M.; Zhang, K.; Zhou, Z.; Zhu, R.; Wang, Y.; Lü, G.; Yan, J. A city-scale estimation of rooftop solar photovoltaic potential based on deep learning. Appl. Energy 2021, 298, 117132. [Google Scholar] [CrossRef]
  20. Huang, J.; Zhang, X.; Xin, Q.; Sun, Y.; Zhang, P. Automatic building extraction from high-resolution aerial images and LiDAR data using gated residual refinement network. ISPRS J. Photogramm. Remote Sens. 2019, 151, 91–105. [Google Scholar] [CrossRef]
  21. Guo, H.; Du, B.; Zhang, L.; Su, X. A coarse-to-fine boundary refinement network for building footprint extraction from remote sensing imagery. ISPRS J. Photogramm. Remote Sens. 2022, 183, 240–252. [Google Scholar] [CrossRef]
  22. Guo, H.; Shi, Q.; Marinoni, A.; Du, B.; Zhang, L. Deep building footprint update network: A semi-supervised method for updating existing building footprint from bi-temporal remote sensing images. Remote Sens. Env. 2021, 264, 112589. [Google Scholar] [CrossRef]
  23. Peng, Z.; Letu, H.; Wang, T.; Shi, C.; Zhao, C.; Tana, G.; Zhao, N.; Dai, T.; Tang, R.; Shang, H.; et al. Estimation of shortwave solar radiation using the artificial neural network from Himawari-8 satellite imagery over China. J. Quant. Spectrosc. Radiat. Transf. 2020, 240, 106672. [Google Scholar] [CrossRef]
  24. Jiang, H.; Lu, N.; Qin, J.; Tang, W.J.; Yao, L. A deep learning algorithm to estimate hourly global solar radiation from geostationary satellite data. Renew. Sustain. Energy Rev. 2019, 114, 109327. [Google Scholar] [CrossRef]
  25. Huang, G.H.; Li, Z.Q.; Li, X.; Liang, S.L.; Yang, K.; Wang, D.D.; Zhang, Y. Estimating surface solar irradiance from satellites: Past, present, and future perspectives. Remote Sens. Environ. 2019, 233, 111371. [Google Scholar] [CrossRef]
  26. Li, R.; Wang, D.; Liang, S.; Jia, A.; Wang, Z. Estimating global downward shortwave radiation from VIIRS data using a transfer-learning neural network. Remote Sens. Env. 2022, 274, 112999. [Google Scholar] [CrossRef]
  27. Joshi, S.; Mittal, S.; Holloway, P.; Shukla, P.R.; Ó Gallachóir, B.; Glynn, J. High resolution global spatiotemporal assessment of rooftop solar photovoltaics potential for renewable electricity generation. Nat. Commun. 2021, 12, 5738. [Google Scholar] [CrossRef]
  28. Abd Latif, Z.; Mohd Zaki, N.; Salleh, S. GIS-based estimation of rooftop solar photovoltaic potential using LiDAR. In Proceedings of the 2012 IEEE 8th International Colloquium on Signal Processing and Its Applications, Mahkota, Malaysia, 23–25 March 2012; pp. 388–392. [Google Scholar]
  29. Mesude Bayrakci, B.; Kirby, C.; Jeffrey, R.S.B. An automated model for rooftop PV systems assessment in ArcGIS using LiDAR. AIMS Energy 2015, 3, 401–420. [Google Scholar] [CrossRef]
  30. Jacques, D.A.; Gooding, J.; Giesekam, J.J.; Tomlin, A.S.; Crook, R. Methodology for the assessment of PV capacity over a city region using low-resolution LiDAR data and application to the city of Leeds (UK). Appl. Energy 2014, 124, 28–34. [Google Scholar] [CrossRef]
  31. Gagnon, P.; Margolis, R.; Melius, J.; Phillips, C.; Elmore, R. Estimating rooftop solar technical potential across the us using a combination of GIS-based methods, lidar data, and statistical modeling. Environ. Res. Lett. 2018, 13, 024027. [Google Scholar] [CrossRef]
  32. Wang, M.; Mao, X.; Gao, Y.; He, F. Potential of carbon emission reduction and financial feasibility of urban rooftop photovoltaic power generation in Beijing. J. Clean. Prod. 2018, 203, 1119–1131. [Google Scholar] [CrossRef]
  33. Taborianski, V.M.; Pacca, S.A. Carbon dioxide emission reduction potential for low income housing units based on photovoltaic systems in distinct climatic regions. Renew. Energy 2022, 198, 1440–1447. [Google Scholar] [CrossRef]
  34. Knuepfer, K.; Rogalski, N.; Knuepfer, A.; Esteban, M.; Shibayama, T. A reliable energy system for Japan with merit order dispatch, high variable renewable share and no nuclear power. Appl. Energy 2022, 328, 119840. [Google Scholar] [CrossRef]
  35. Zhang, X.; Wang, J.-X.; Cao, Z.; Shen, S.; Meng, S.; Fan, J.-L. What is driving the remarkable decline of wind and solar power curtailment in China? Evidence from China and four typical provinces. Renew. Energy 2021, 174, 31–42. [Google Scholar] [CrossRef]
  36. Denholm, P.; Hand, M. Grid flexibility and storage required to achieve very high penetration of variable renewable electricity. Energy Policy 2011, 39, 1817–1830. [Google Scholar] [CrossRef]
  37. Ziegler, M.S.; Mueller, J.M.; Pereira, G.D.; Song, J.; Ferrara, M.; Chiang, Y.-M.; Trancik, J.E. Storage requirements and costs of shaping renewable energy toward grid decarbonization. Joule 2019, 3, 2134–2153. [Google Scholar] [CrossRef]
  38. Wang, B.; Ji, F.; Zheng, J.; Xie, K.; Feng, Z. Carbon emission reduction of coal-fired power supply chain enterprises under the revenue sharing contract: Perspective of coordination game. Energy Econ. 2021, 102, 105467. [Google Scholar] [CrossRef]
  39. Pfenninger, S.; Staffell, I. Long-term patterns of European PV output using 30 years of validated hourly reanalysis and satellite data. Energy 2016, 114, 1251–1265. [Google Scholar] [CrossRef]
  40. Hargreaves, J.; Hart, E.K.; Jones, R.; Olson, A. Reflex: An adapted production simulation methodology for flexible capacity planning. IEEE Trans. Power Syst. 2015, 30, 1306–1315. [Google Scholar] [CrossRef]
  41. Zhou, K.; Lindenbergh, R.; Gorte, B.; Zlatanova, S. Lidar-guided dense matching for detecting changes and updating of buildings in airborne lidar data. ISPRS J. Photogramm. Remote Sens. 2020, 162, 200–213. [Google Scholar] [CrossRef]
  42. Esch, T.; Brzoska, E.; Dech, S.; Leutner, B.; Palacios-Lopez, D.; Metz-Marconcini, A.; Marconcini, M.; Roth, A.; Zeidler, J. World settlement footprint 3d—A first three-dimensional survey of the global building stock. Remote Sens. Env. 2022, 270, 112877. [Google Scholar] [CrossRef]
  43. Marconcini, M.; Metz-Marconcini, A.; Üreyen, S.; Palacios-Lopez, D.; Hanke, W.; Bachofer, F.; Zeidler, J.; Esch, T.; Gorelick, N.; Kakarla, A.; et al. Outlining where humans live, the world settlement footprint 2015. Sci. Data 2020, 7, 242. [Google Scholar] [CrossRef]
  44. Liu, P.; Liu, X.; Liu, M.; Shi, Q.; Yang, J.; Xu, X.; Zhang, Y. Building footprint extraction from high-resolution images via spatial residual inception convolutional neural network. Remote Sens. 2019, 11, 830. [Google Scholar] [CrossRef]
  45. Liu, T.; Yao, L.; Qin, J.; Lu, N.; Jiang, H.; Zhang, F.; Zhou, C. Multi-scale attention integrated hierarchical networks for high-resolution building footprint extraction. Int. J. Appl. Earth Obs. Geoinf. 2022, 109, 102768. [Google Scholar] [CrossRef]
  46. Jiang, H.; Lu, N.; Qin, J.; Yao, L. Hourly 5-km surface total and diffuse solar radiation in China, 2007–2018. Sci. Data 2020, 7, 311. [Google Scholar] [CrossRef]
  47. Jiang, H.; Yang, Y.; Wang, H.; Bai, Y.; Bai, Y. Surface diffuse solar radiation determined by reanalysis and satellite over east Asia: Evaluation and comparison. Remote Sens. 2020, 12, 1387. [Google Scholar] [CrossRef]
  48. Liu, Y.; Yao, L.; Jiang, H.; Lu, N.; Qin, J.; Liu, T.; Zhou, C. Spatial estimation of the optimum PV tilt angles in China by incorporating ground with satellite data. Renew. Energy 2022, 189, 1249–1258. [Google Scholar] [CrossRef]
  49. Munoz-Sabater, J.; Dutra, E.; Agusti-Panareda, A.; Albergel, C.; Arduini, G.; Balsamo, G.; Boussetta, S.; Choulga, M.; Harrigan, S.; Hersbach, H.; et al. Era5-land: A state-of-the-art global reanalysis dataset for land applications. Earth Syst. Sci. Data 2021, 13, 4349–4383. [Google Scholar] [CrossRef]
  50. Wu, C.; Zhang, X.-P.; Sterling, M. Solar power generation intermittency and aggregation. Sci. Rep. 2022, 12, 1363. [Google Scholar] [CrossRef]
  51. IPCC. Chapter 2: Stationary combustion. In 2006 IPCC Guidelines for National Greenhouse Gas Inventories Volume 2: Energy; Intergovernmental Panel on Climate Change; IPCC: Geneva, Switzerland, 2006. [Google Scholar]
  52. Typical Load Profiles of Provincial Power Grid. Available online: https://www.ndrc.gov.cn/xwdt/tzgg/202012/P020201202546044875868.pdf (accessed on 1 August 2022).
  53. China’s Regional Grid Emissions Factors. 2019. Available online: https://www.mee.gov.cn/ywgz/ydqhbh/wsqtkz/202012/t20201229_815386.shtml (accessed on 1 August 2022).
  54. Guan, Y.; Shan, Y.; Huang, Q.; Chen, H.; Wang, D.; Hubacek, K. Assessment to China’s recent emission pattern shifts. Earth’s Future 2021, 9, e2021EF002241. [Google Scholar] [CrossRef]
  55. Qin, J.; Jiang, H.; Lu, N.; Yao, L.; Zhou, C. Enhancing solar PV output forecast by integrating ground and satellite observations with deep learning. Renew. Sustain. Energy Rev. 2022, 167, 112680. [Google Scholar] [CrossRef]
  56. Bravo, R.; Ortiz, C.; Chacartegui, R.; Friedrich, D. Multi-objective optimisation and guidelines for the design of dispatchable hybrid solar power plants with thermochemical energy storage. Appl. Energy 2021, 282, 116257. [Google Scholar] [CrossRef]
  57. Asadi Majd, A.; Farjah, E.; Rastegar, M.; Bacha, S. Generation and transmission expansion planning for bulk renewable energy export considering transmission service cost allocation. Electr. Power Syst. Res. 2021, 196, 107197. [Google Scholar] [CrossRef]
  58. Sánchez de la Nieta, A.A.; Paterakis, N.G.; Gibescu, M. Participation of photovoltaic power producers in short-term electricity markets based on rescheduling and risk-hedging mapping. Appl. Energy 2020, 266, 114741. [Google Scholar] [CrossRef]
  59. Mallapaty, S. How China could be carbon neutral by mid-century. Nature 2020, 586, 482–483. [Google Scholar] [CrossRef] [PubMed]
  60. Liu, L.; Wang, Y.; Wang, Z.; Li, S.; Li, J.; He, G.; Li, Y.; Liu, Y.; Piao, S.; Gao, Z.; et al. Potential contributions of wind and solar power to China’s carbon neutrality. Resour. Conserv. Recycl. 2022, 180, 106155. [Google Scholar] [CrossRef]
Figure 1. Workflow for assessing the carbon reduction potential of rooftop PV.
Sustainability 15 03380 g001
Figure 2. Settlement and building footprints. (a) Settlement area in China at a spatial resolution of 500 m, aggregated from the world settlement footprint products [43]; (b) building rooftop area at a spatial resolution of 500 m, which was calculated based on sub-meter building footprints in Jiangsu Province, China [7].
Sustainability 15 03380 g002
Figure 3. Scatterplot of rooftop area and settlement area. (a) Areas are counted by towns in Jiangsu Province; (b) areas are counted by counties in Jiangsu Province.
Sustainability 15 03380 g003
Figure 4. Spatial distribution of key parameters for simulating the capacity factor. (a) Total solar radiation; (b) fraction of diffuse solar radiation; (c) optimal PV tilt angle; (d) air temperature.
Sustainability 15 03380 g004
Figure 5. (a) Spatial division of China’s regional grids [53]; (b) typical daily load profiles of the Beijing grid; (c) annual variations in base and peak loads of the Beijing grid.
Sustainability 15 03380 g005
Figure 6. (a) The renewable energy penetration rate of each regional grid (numbers were sourced from https://www.bjx.com.cn/, accessed on 30 December 2022); (b) total carbon emissions of the corresponding regions in each regional grid in 2019 [54].
Sustainability 15 03380 g006
Figure 7. Rooftop PV electricity generation potential in China. (a) Spatial distribution at a spatial resolution of 500 m; (b) statistics by regional grid, where rooftop PV generations are compared to social electricity consumption.
Sustainability 15 03380 g007
Figure 8. Variability in rooftop PV generation. (a) Coefficient of variation for the capacity factor; (b) variation in rooftop PV generation for the Beijing grid.
Sustainability 15 03380 g008
Figure 9. Potential carbon reductions from rooftop PV. (a) Total carbon reductions in China under different scenarios; (b) distribution of potential in the six primary regional grids.
Sustainability 15 03380 g009
Figure 10. Carbon offset rate of rooftop PV for each grid. (a) Minimum offset rate; (b) Maximum offset rate.
Sustainability 15 03380 g010
Table 1. Potential carbon reductions (unit: MtCO2) in each regional grid under different scenarios.
100% Flexibility90% Flexibility80% Flexibility
0 h4 h8 h12 h0 h4 h8 h12 h0 h4 h8 h12 h
Xinjiang111.5153.1166.5166.8101.9145.3165.8166.891.6136.1163.8166.4
Tibet3.64.85.96.63.04.35.35.62.53.74.44.5
Qinghai20.420.420.420.420.420.420.420.420.320.420.420.4
Gansu59.882.695.696.654.277.593.996.548.271.890.894.5
Ningxia47.254.654.654.643.954.554.654.639.954.354.654.6
Shan’xi74.6100.6126.0144.565.691.6117.2128.556.282.2102.8107.7
Beijing54.473.486.889.647.567.080.583.239.959.268.870.3
Tianjin41.556.468.072.336.751.864.668.531.646.858.059.7
Jibei92.4125.5158.2186.682.2115.4148.3168.971.6104.7136.9144.9
Jinan129.8172.1214.3245.4113.9156.2197.3213.097.5139.7171.4176.1
Shanxi117.9162.2196.5208.3105.7150.7188.8204.292.7138.0178.6188.9
Shandong253.3341.1428.3504.1221.9309.7396.0442.8189.2277.0354.5367.4
Mengxi124.9151.2151.3151.3115.8150.7151.3151.3105.3148.4151.3151.3
Mengdong43.357.671.984.037.952.266.572.732.446.759.160.3
Heilongjiang70.992.8114.7127.062.784.6104.7110.954.476.390.692.8
Jilin54.471.688.898.948.165.380.886.641.758.970.272.9
Liaoning134.3183.1230.3271.1120.4169.3217.0247.1106.0154.8202.3216.3
Sichuan100.0135.2158.6163.588.2124.3152.2158.175.4112.0136.9139.5
Chongqing37.648.851.551.532.845.850.851.227.241.144.945.1
Henan168.2225.7283.2330.4143.9201.5258.5282.1118.7176.3218.9225.9
Hubei93.2126.2156.9176.880.8113.9145.0156.967.6100.7124.6129.7
Hunan78.7105.0131.1149.467.994.2118.7128.356.682.999.8103.7
Jiangxi64.386.3108.1125.356.478.399.7110.048.070.087.591.1
Anhui89.4120.7151.9177.676.4107.8138.5152.762.994.2117.6123.0
Jiangsu242.2330.3389.8406.6214.6305.0373.3394.4184.8276.0346.4358.3
Shanghai48.555.255.455.444.554.555.455.439.153.054.955.2
Zhejiang162.3205.7212.0212.5146.8197.9209.1210.0129.0184.4203.4204.4
Fujian84.2107.8110.7110.876.8104.5110.4110.668.499.1109.0109.5
Yunnan67.791.5114.4130.760.884.6107.9118.953.777.499.1102.9
Guizhou51.268.373.773.945.463.972.973.538.958.267.468.1
Guangxi64.486.2107.9124.956.578.499.9109.348.270.187.789.7
Guangdong230.1299.2310.8311.2207.2286.2306.4307.5180.9265.2297.4299.8
Hainan12.516.821.124.611.015.319.621.89.513.817.618.2
Total3028.84011.94715.05153.12691.93722.34471.24762.12329.93393.54091.44212.7
Disclaimer/Publisher’s Note: The statements, opinions and data contained in all publications are solely those of the individual author(s) and contributor(s) and not of MDPI and/or the editor(s). MDPI and/or the editor(s) disclaim responsibility for any injury to people or property resulting from any ideas, methods, instructions or products referred to in the content.

