Article

Analyzing Healthcare and Wellness Products’ Quality Embedded in Online Customer Reviews: Assessment with a Hybrid Fuzzy LMAW and Fermatean Fuzzy WASPAS Method

by
Çiğdem Sıcakyüz
Industrial Engineering Department, Faculty of Engineering and Architecture, Ankara Science University, 06200 Ankara, Türkiye
Sustainability 2023, 15(4), 3428; https://doi.org/10.3390/su15043428
Submission received: 17 January 2023 / Revised: 8 February 2023 / Accepted: 9 February 2023 / Published: 13 February 2023

Abstract

:
With the high impetus in global digitization, online shopping (OS) is anticipated to increase further in the near future. Contrary to this anticipation, however, recent studies have emphasized a certain amount of drop in a considerable number of online purchasing transactions in 2022. One of the reasons might be customer dissatisfaction. To analyze online customer reviews, manual sentiment analysis was conducted to detect which quality criteria cause the dissatisfaction of online shoppers. The quality parameters are categorized into product, delivery service, and aftersales service quality (SQ). These main quality criteria are then divided into sub-factors. Eight health category products, including personal care products, wellness products, and household cleaners, were ranked to the importance of the sub-quality parameters using the multi-criteria decision-making (MCDM) method. In this study, a new hybrid MCDM method was also proposed, which combines the triangular fuzzy logarithm methodology of additive weights (F-LMAW) and the Fermatean fuzzy weighted aggregated sum product assessment method (FF-WASPAS). The study reveals that the most important criteria were products’ performance, as well as their side effects, pay-back, and change possibility, while the products’ reasonable price was the least important criterion. Aftersales service was more significant than delivery service. Furthermore, moisturizing creams and medical pillows were the most popular products bought in OS compared with hair conditioners and washing liquids. The study’s multifold contributions and managerial implications were elaborately discussed.

1. Introduction

Retail e-commerce (e-C) selling in 2021 is estimated to be worth roughly USD 5.2 trillion globally. This value is expected to rise by 56% over the following few years, approaching around USD 8.1 trillion by 2026 [1]. Furthermore, internet purchasing accounted for 19.7% of the worldwide retail market in 2022. That means that approximately USD 0.20 of every USD spent in retail globally was performed electronically last year [2].
As for the worldwide healthcare e-C industry, the estimates reveal an increase in compound annual growth rate (CAGR) of 18.5%, from USD 309.62 billion in 2022 to USD 366.94 billion in 2023 [3].
The online retailing of personal care products has exploded in recent years. It offers convenience, competitive pricing, and a more extensive product range than traditional retailers. e-C is growing for a variety of reasons, but mostly because there is plenty of room in the market for it. In 2022, 34% of all personal needs and healthcare transactions in the United States (US) were conducted online, and by 2025 it is expected to account for nearly half of all wellbeing sales. Figure 1 shows estimated sales in the US market for online health and personal care products in 2018 and 2025 [4].
The percentage of e-C medical sales in 2018 was 0.25 of offline purchases, but it increased dramatically from that year in the US. Sales peaked in 2020 and 2021, during the height of the pandemic, but are expected to grow at an annual rate of 10% until at least 2025. Internet sales of pharmaceuticals, health, and beauty products also continue to increase.
According to the Organization for Economic Cooperation and Development’s (OECD) report, the economy in Türkiye has one the most heightened inflation rates, with 85.5% [5]. With sales of USD 21.6 billion in 2021, Türkiye is the 18th largest e-C market, in front of Thailand and after the Netherlands. The Turkish e-C market increased by 18% in 2021, contributing to the global growth rate of 18%, and is anticipated to beat the world average of 10%, with annual increases of 19% by 2025 [6].
However, many online purchasing transactions were dropped in 2022, i.e., they were not turned into purchases. With a 98% abandonment ratio, websites providing ship and boat delivery services have the most significant cart abandon percentages of all examined areas. The biggest cause for quitting an e-shopping request for electronic consumers in the US is excessive additional expenditures such as delivery and taxes, followed by the obligation to make an account on the site to progress with the transaction [7]. Figure 2 illustrates the changing trends in e-C in the health industry between 2021 and 2022. In 2022, e-C sales in the health and wellness industry decreased by an average of 43.00% compared with 2021 [8].
Although sales were the same in July and August of 2021 and 2022, they peaked in November. However, they tended to decline again from November onwards.
Since the most challenging task for online buying is providing and maintaining consumer satisfaction (CS) [9], dissatisfied customers might cause another reason for this fall in demand for retailers’ online services due to their difficulty with OS.
Generally, trust between a consumer and a supplier or shop is a more significant problem online than offline because there is generally no face-to-face interaction when products and services are obtained. Conventional purchasing offers a social environment that supports purchases: it often necessitates the simultaneous exchanging of commodities and payment, contacts with employees, and “visual clues,” allowing the customer to assess the merchant’s or provider’s expertise. On the other hand, online services are “extended beyond space and time” and “dis-embedded” from a relationship of human trustworthiness and physical interaction. Although digital agents and, eventually, VR technology might aid this process, the online payment experience differs from older styles [10].
Ref. [11] identified six characteristics that examine the key challenges faced by buyers of goods/services purchased online among 29 European states in 2016. The problems faced were the long shipment time, damaged products, non-compliant products, fraud-related issues, underperforming complaint mechanisms, technical problems, inadequate customer service, and legal concerns. Similarly, the most prevalent issue with online purchasing in the four Visegrad countries, namely Slovakia, Czechia, Hungary, and Poland, was that products or services took longer to arrive than advertised by the vendor on the store’s website. Another issue was the delivery of incorrect or damaged merchandise. In the monitored years, 8% of online buyers in the EU had technical difficulties when purchasing online. Over the years under consideration, 4% of online customers in EU nations reported difficulty accessing warranty information on the seller’s website. Moreover, the cost of shipping or the final price was eventually more than what the merchant advertised on its website. Additionally, some internet shoppers experienced fraud [12].
As a result of COVID-19, for instance, there was a broad and considerable decrease in CS among Austria’s leading merchants. The pandemic has had a detrimental influence when comparing customer satisfaction levels before and during COVID-19 [13].
During the COVID-19 pandemic, to give another example, [14] investigated perceived health risks, online retail ethics, and online buying behavior in Indonesia. The procedure entailed developing numerous factors for perceived health risk and five for online retail ethics, which included security, privacy, non-deception, reliability fulfillment, and service recovery. All aspects, except for non-deception, significantly influenced online buying behavior during COVID-19.
Although Amazon is one of the most popular e-C platforms worldwide, its CS levels also fell recently. Figure 3 below [15] exemplifies this result by showing the American Customer Satisfaction Index (ACSI) level of Amazon’s e-C website.
Figure 3, from 2000 to 2021, shows that the percentage of online retailers’ CS level in 2021 was 78%. The CS level was the highest (88%) in the years 2002, 2003, 2007, and 2013, while in 2021, it was the lowest. Mainly, it fell dramatically from 2013. It increased by only 1% from 2018 to 2019. It is clear from Figure 3 that customers were unsatisfied with e-C on Amazon during COVID-19.
Due to recent events, individuals all over the nation have experienced an increased level of worry, rage, and fear, making advertising a complex landscape to negotiate. The intense emotions and more significant divisions of recent months may have long-term consequences on consumer behavior and alter long-term choices. Companies should ensure that all brand messages are sensitive to customer mood. The effectiveness of a firm’s communication ability and its capability to strike the proper style will provide significant competitive advantages [16]. The competitive advantage [17] was defined based on Porter’s (1985) emphasis on producing customer value so that the difference between two rivals on every possible parameter enables one to provide more value for the customer than the other. The companies should turn a temporary competitive advantage into a sustainable one. Firms with a stronger market position can only achieve a better outcome of transient competitive advantage [18]. More crucially, enterprises can use a temporary competitive advantage due to market position to improve their technical resources and capabilities, which can boost their long-term competitive advantages. Customer service is frequently used in retail-sector initiatives to gain a competitive edge [19] since SQ recreates an essential part of CS that, in turn, develops commitment [20]. Hence, companies should focus on customers and understand their needs, as it is already known that sales are affected by customer feedback on products and services.
Internet recommendations impact customers’ purchase of goods. However, not all internet suggestion sources are equally powerful. Even though it was considered less competent than human specialists and less credible than other consumers, the recommender system was determined to be the highest influential suggestion source. However, suggestions for the experience parameter were far more potent when searching for a product [21].
Word of mouth (WOM), or what other customers say about a product or service, is the most common kind of consumer recommendation. Such suggestions are considered especially significant in purchase decisions since they are more credible than suggestions from companies or advertisements. As a result, WOM may have a massive influence on purchase decisions: consumer WOM has been dubbed the most critical element in forecasting the long-term profitability of experiential goods. Twitter posts have recently been identified as one of the most potent brand image factors [22]. Customer reviews (CRs) are informative for prospective buyers and can help them to decide about products and services because CRs allow others to offer feedback and discuss their experiences when they comment on items and services. As a result, existing customers can negatively or positively affect the purchasing habits of other potential customers. Moreover, the proportion of negative reviews has a higher impact than the proportion of favorable reviews, confirming the negativity bias [23]. Hence, the complaints of customers are critical for companies.
Online complaints might jeopardize a company’s reputation in the marketplace. Furthermore, in service-related problems, customers may choose alternate service providers. According to estimates, 66% of purchasers do not return to the same service provider following a service problem, particularly when the issue is followed by an inadequate recovery [24]. Consequently, sellers may carefully create their image via user evaluations [25].
While much intense focus has been situated on the impact of e-service quality (e-SQ) on customer satisfaction and the intention to use a website for OS, little attention has been paid to the combined impact of good and e-SQ on CS [26]. Relatively few studies have focused on the links between post-purchase activities, such as shipment and return services, and consumer behavioral and attitudinal elements. It is still being determined how crucial post-purchase operations such as shipping and returns are to e-C and its maturation compared with customer care [27]. Unlike other studies that focused on the SQ of sellers, in this study, the SQ parameter was handled comprehensively, as it covers both the shipment process and the aftersales SQ. In addition, this work integrated product quality (PQ) to assess CS.
Moreover, the current work on buying behavior during the pandemic concentrated chiefly on variables influencing customers’ online purchasing decisions. This study revealed main elements, such as the benefits of internet buying, pandemic worries, media, and subjective standards. Other research highlighted the importance of hedonic motivation, economic situation, satisfaction, and trust when online buying. However, the majority of studies analyzed data acquired at the start of the COVID-19 pandemic in 2020, and only recorded customers’ buying behaviors at that point [26].
Moreover, the existing literature has concentrated chiefly on consumer surveys for CS research, neglecting the vast amount of data available online [28]. Instead of predicting CS and purchasing behavior, it is a reasonable way to comprehend their attitude from their experience by investigating what variables have influenced these behaviors after the COVID-19 pandemic.
Although the ratings and comments are significant customer information sources, qualitative survey responses reveal that the perceived usefulness of rating systems differ. Because of the unstructured nature of textual user evaluations, comparing user reviews takes time for the buyer [29]. In reviews, sentiment analysis (SA) or opinion mining (OM) computationally examines people’s attitudes, views, and feelings regarding a specific object. OM extracts and analyzes people’s opinions on an entity, whereas SA recognizes the sentiment indicated in a text [30].
However, the extensive assessment is published in a free-text style, making it challenging for computer systems to comprehend, evaluate, and aggregate. Because of this lack of structure, people frequently need help when searching for text reviews [31]. On the other hand, the results of computational sentiment analysis methods, such as parts-of-speech (POS), bag-of-words (BOW), maximum entropy (ME), n-gram, and lexicon-based, fluctuate depending on the sort of technical emotion task. Most importantly, sentiment research does not need to interpret the negative reviews if explicit or implicit [32].
Negative feelings in a review text are more effective in deciding item star ratings than positive sentiments of the same degree in the text’s content. Therefore, initiatives that minimize negative performance disconfirmation should be prioritized above those that provide positive interpretations of disconfirmation across all administrative choices [33].
On the other hand, the ratings can mislead about the quality of purchased products or services offered. Customers’ experiences may be fundamentally different, or they may disagree on how to judge the experience. Alternatively, people may provide a low rating owing to a negative delivery experience, inadvertently review the wrong product, or criticize a product for a failure caused by human error. Some customers may have a different perspective regarding the objective of product reviews than others. For example, some buyers may assess purchase value (quality for the money), punishing more expensive companies, while others may rate quality without assuming price [34].
Apart from these factors, using precise numerical numbers makes it difficult to represent perception inclinations. Many social scientific problems involve imprecision, restrictions, and acts that must be clearly described through measurements. The outcome of research in an uncertain setting is heavily influenced by subjective assessments that are ambiguous and imprecise. Zadeh [35] pioneered fuzzy logic as a mathematical method for representing and dealing with ambiguity in decision making to address this imprecision [36].
Therefore, it is worth examining customer comments and classifying the factors that caused them to give feedback and rating, particularly the scope and nature of complaints.
There is a gap in uncovering the critical factors causing problems and dissatisfaction embedded in CRs.
Hence, this study focused on the customer’s feedback on the health products purchased from different e-C retailer platforms. It aimed to analyze which perceived quality criteria might be in their feedback and how they are critical to purchasing products. Eight products in the health category, including household cleaners, personal care, and wellbeing items, were chosen on popular e-C platforms in Türkiye. Customers’ comments and star ratings for these products were analyzed through manual sentiment analysis by taking one-hundred review samples for each product. The possible causes of online shoppers’ comments were investigated in terms of three main quality parameters: product, delivery service, and aftersales service. The quality parameters were subdivided into related different sub-variables. Then, the customers’ preferences were ranked using a new hybrid Fuzzy LMAW and Fermatean fuzzy WASPAS as the MCDM method to detect the most critical products using the criteria. Finally, the ranking of the products that resulted in this study was compared with the general star rating on websites and the samples’ average. The sensitivity analyses were provided with both product ranking and quality parameter prioritizations by changing the number of experts.
The novelty of this study is that it provides 800 cases from consumers’ comments about their experiences with OS during and after the pandemic. The critical factors are detected from manual sentiment analysis and referred to as quality parameters that contribute to the satisfaction of customers. The detected quality criteria embedded in reviews were systematically validated from the decision maker’s point of view. The study gives a novel framework for perceived quality factors when purchasing online health, personal care, and wellness products. Furthermore, this study enriches the MCDM literature by establishing a new hybrid MCDM method and management literature, particularly customer relationship management (CRM), by providing a different aspect of CR analysis.
The following is how the paper is structured: Section 2 focuses on works connected with the study. Section 3 formalizes quality parameters and the framework of the study. Section 4 outlines the proposed hybrid MCDM method. Section 5 discusses the essential findings and comparison using the MCDM method for customer ratings with the quality parameters and products. In Section 6, the study examines the sensitivity analysis. Finally, Section 7 concludes with remarks and addresses the study’s limits, as well as future study opportunities.

2. Literature Review

The essence of a CRM strategic approach in the electronic marketplace is to build a sustainable competitive advantage by more deeply recognizing, interacting with, and providing to the needs of current customers while attracting and retaining new consumers [37].
Previous research has found that successful CRM needs conformity to a steady and consistent approach that concentrates on sustaining customer loyalty and utilizing complaints management data to address problems and handle customer complaints. Their complaints were seen as an opportunity to improve areas where problems are. Because customers are frequently presented with a diverse variety of products and services that might or might not suit a certain demand, they develop expectations about the value and satisfaction that different market commodities bring and purchase accordingly. As a result, pleased customers return and tell other people about their excellent service experience, whereas dissatisfied customers usually switch to competitors and complain to other people about the product [38]. Recent studies show that customer evaluations have become crucial in consumer purchasing decisions and product sales [37]. Customer satisfaction, high customer service, and delivering exceptional online shopping experiences foster client loyalty, improve market share, minimize customer complaints, and boost company profitability [39].
Many studies scrutinized CRs on websites. For example, a two-by-two between-subject factorial design was used in [40] to evaluate the impact of consumer expectations and internet reviews on movie selection and appraisal by moviegoers. Their findings showed that potential moviegoers valued consumer reviews more than critical ones and that CRs impacted their movie selection and post-viewing appraisal without considering the interaction effect. Negative CRs significantly affected movie selection more than good CRs. Some authors combined the various approaches to gain effective results. For instance, [28] employed text mining, machine learning, and econometric tools to identify which core and enhanced service characteristics and emotions are more relevant in specific service settings to reflect and forecast CS. In suggesting an automated and machine-learning-based technique for insight creation to inspect online consumers’ opinions, sentiment analysis was utilized based on the content of comments. Different algorithms were used to extract data. Ref. [31] evaluated the influence of text-derived information in predicting review ratings in a recommendation system providing novel ad hoc and regression-based recommendations. They found that incorporating textual information yields superior general or tailored reviewing score estimations than numerical star ratings provided by users. However, there are a variety of items with thousands of user-generated reviews. Mining these massive internet evaluations and refining numerous individual customers’ perspectives into collective consumer choices became difficult. These collective reviews help in product improvement procedures, the rating of items, and other tasks [41]. To deal with this complexity, some authors preferred utilizing MCDM methods to assess CRs in crisp or different fuzzy environments. For example, [42] analyzed the CRs using a combined machine learning algorithm aspect-based sentiment analysis (ABSA) and two MCDM approaches, including the Dawid–Skene algorithm and the best worst method (BWM). For product rating, [41] suggested a hybrid model, and AHP is applied to determine the relative weights of assessment criteria.

2.1. Satisfaction and Quality

The link between quality, satisfaction, and behavioral intentions has received a lot of attention in online purchasing studies [43]. Because quality is viewed as a critical strategic element of competitive advantage, corporations have prioritized efforts to improve PQ or SQ [44].
The literature provides a variety of interpretations for essential concepts such as trust and satisfaction and their relations to behavior intention. Customers’ perception of quality, which, in turn, affects their trust and loyalty to firms, comprises various dimensions embedded in CS, such as customers’ expectations and behavioral intentions about the products or services they purchase, because increased SQ is required to achieve high-level CS, which is closely related to beneficial behavioral intentions [9]. To analyze the behavioral attitudes of customers, most studies conducted in social sciences, such as for repurchase [45,46,47,48,49,50], provide a measure of CS intention while utilizing fundamental social theories, such as the theory of planned behavior (TPB), which originated from the theory of reasoned action (TRA) by [51]; expectation confirmation theory (ECT); social cognitive theory (SCT) studied by [52], and the unified theory of acceptance and use of technology (UTAUT) utilized by [53,54], as well as their various extensions.

2.1.1. Satisfaction with PQ

The PQ is frequently seen to establish a competitive advantage. Designing and manufacturing products tailored to satisfy client needs should improve quality. The product’s perceived performance determines CS compared with the buyer’s expectations. The client feels unsatisfied if the product fails to meet expectations, and the consumer is happy if the performance meets their expectations. When performance exceeds expectations, the consumer is extremely happy or thrilled [38].
Many types of research were conducted to examine satisfaction with the PQ in various products with diverse methods. [55] revealed that pricing, PQ, and promotion had favorable and significant impacts on CS with cosmetics and skincare purchases. Likewise, [56] found that PQ is essential to 64% of respondents when choosing a point of sale for their monthly purchasing of healthy foods and cosmetic products, irrespective of whether if it is an outlet or a web shop, which is followed by a wide range of offers (54%), the price of the product (52%), special offers (41%), previous experiences (41%), the labeling of the origin of the products (19%), and marketing (18%). Ref. [57] investigated men’s preference for face skin care products using an analytical hierarchy process (AHP), employing criteria such as price, promotion, availability, quality, packaging, and product variety. Price was the essential criterion for all possibilities among the six criteria. Ref. [58] aimed to determine which product qualities contributed to consumer loyalty. The halo effect using the convolutional neural networks (HECON) approach was introduced in that paper as a novel way to weigh the product loyalty criterion by incorporating the customer’s decisions halo effect using convolutional neural networks (CNN). Using the ranked voting method (RVM), mobile phone options are ranked and compared using the technique for order of preference by similarity to ideal solution (TOPSIS) method.

2.1.2. Satisfaction with Online Shopping Service (OSS)

Since the quality of e-services and information positively influences CS [59], researchers conducted various studies to measure SQ with diverse methods in different target customers in various sectors. For instance, [9] used structural equation modeling (SEM) to analyze the impact of CS on consumer behavior, such as repurchase intent, WOM, site revisit, and customer trust. The findings revealed that website design, security/privacy, and fulfillment all impacted total e-SQ; however, customer service had no statistically significant effect on overall e-SQ. Ref. [60] also used SEM to create a study model to investigate the association between e-SQ parameters, total SQ, CS, and purchase intentions. The SEM model results in [61] revealed that e-satisfaction and e-trust impact the development of e-loyalty. The association between e-trust and e-satisfaction is also considerable—the effects of retail quality elements on e-satisfaction and e-trust varied. E-satisfaction and e-trust were both influenced by fulfillment/reliability assessment. Furthermore, website design impacted e-satisfaction, whereas security/privacy influenced e-trust. However, responsiveness does not affect e-satisfaction or e-trust. Using multiple regression analysis, [62] uncovered that CS with OS is positively associated with website design, security, information quality, payment method, e-SQ, PQ, product variety, and delivery service. Ref. [63] sought to assess and evaluate SQ differences between clients’ perceptions and expectations of wireless communication services, as well as investigate the influence of multi-cultural communities on customers’ SQ expectations and perceptions to prioritize the SERVQUAL aspects. Ref. [63] determined the SQ based on two distinct factors, namely age and gender, and investigated the relationship between them and customer satisfaction. Their findings showed that customers’ highest expectations manifested in the assurance dimension. The most vital customer views were identified in the assurance and responsiveness dimensions; in general, women had more significant service gaps than men, particularly in the assurance and dependability dimensions. Although men may be partially happy with the guarantee supplied, women are not. Empathy is a dimension in which women are highly content while men are utterly unsatisfied; all individuals of various ages are dissatisfied with the promised services, as well as the accuracy and dependability with which problems are solved (reliability). On the other hand, [38] performed a customer loyalty evaluation using the fuzzy decision-making trial and evaluation laboratory (DEMATEL) and the fuzzy analytic network process (ANP), whereas [64] combined the DANP (DEMATEL-ANP) and the Visekriterijumska Optimicija İ Kompromisno Resenje (VIKOR) methods to improve e-store business.

2.2. SQ Models

The literature has provided a plethora of SQ models over the years. Some research concentrated on broad models, while other studies established new or altered existing models for specific sectors. The Nordic (European) model developed by [65] proposed two elements of SQ. Technical quality refers to what customers receive as an outcome of interacting with a service provider, whereas functional quality relates to how customers obtain services. Technical and operational excellence are precursors to corporate image, which is the model’s third dimension. The American model established by [66,67] defines SQ as the differences between the expected service level and customer perceptions. Initially, in SERVQUAL, ten SQ components were offered: dependability, responsiveness, competence, access, civility, communication, credibility, security, and tangibles. When applying the perceived SQ model, it became clear that the expectation construct is intricate and challenging to test legitimately. For example, customers’ expectations following a service process may change from their expectations prior to the process. Additionally, changing expectations during the service consumption process may impact how the service is viewed [68]. SERVPERF, in contrast to SERVQUAL, measures SQ performance by eliminating customers’ expectations to a good degree. According to [69], performance-based measurements are the only ones that accurately represent long-term SQ attitudes. They evaluated SQ by gauging performance in several industries and discovered that it represented a greater portion of the variance in a generic SQ measure than SERVQUAL. The three-component model was devised by [70]. SQ comprises three unique components: service product, service delivery, and service environment. The service product represents the outcome and consumer impression of the service. The consumption process and all-important events that occur throughout the service act constitute service delivery. The internal and exterior atmospheres comprise the service environment. The service environment is significant because it is an essential influence in forming customer service perception. Retail SQ, according to [71], has a hierarchical structure with five fundamental aspects, namely physical factors that are related to retail store appearance and layout; reliability, which is linked to retailers fulfilling their promises and doing the right thing; personal interaction, which expresses that retail store personnel are courteous, helpful, and inspire customer confidence; problem-solving ensures that retail store personnel are able to deal with returns and exchanges, customers’ problems, and complaints; and finally, policy is defined as the retail store’s criteria for merchandise quality, customer parking convenience, operating hours, and credit card acceptance. It also has six sub-dimensions: appearance, convenience, promises, doing it correctly, instilling confidence, and courtesy. Ref. [72] merged the model in [70] three-component model with a multilevel conceptualization of SQ in [73]. The three significant elements of SQ are the quality of interaction, physical environment, and result. Each of these characteristics is comprised three sub-dimensions: attitude, behavior, and experience (interaction quality); ambient conditions, design, and social variables (physical environment quality); and waiting time, tangibles, and valence (outcome quality). Ref. [74] proposed a model within the framework of SQ, CS, and perceived value by focusing on the post-purchase process. The model examines the relationship between consumer value and pricing, perceived performance, SQ, CS, repurchasing intentions, and advice. A new scale, e-CSI, was designed by [75] based on ACSI to gauge online shoppers’ satisfaction using partial least squares (PLS) in the retail industry. Recently, [76] created a new scale called sustainable logistics service quality (SLSQ) with a case study in Egypt using the Q-sorting approach.

2.3. Methods for the Measurement of e-SQ

Some works combined the SERVUQAL model in MCDM methods in various sectors with or without case studies. For example, [77] examined the e-SQ of several hospitals based on the SERVQUAL, including the tangible criteria factors, responsiveness, reliability, information quality, assurance, and empathy, using the AHP and TOPSIS in a triangular fuzzy environment, whereas [78] identified the SQ of terminal delivery service using SERVUQAL-AHP-TOPSIS. The full consistency method (FUCOM)-SERVUQAL model was proposed by [79]. Six e-C websites were evaluated by [80] using AHP and fuzzy TOPSIS approaches explicitly tailored for the Indian market. Ref. [81] used the preference ranking organization method for enrichment of evaluations (PROMETHEE) to prioritize eleven discount products by considering five online consumer purchasing factors (web quality, information, e-services, incentives for internet popularity, and post-purchase service) and personal information technology innovation (PITT). In the study of [82], the travel websites’ e-SQ was explored using MCDM based on a genetic algorithm, while [83] evaluated e-SQ in the airline industry using combined the fuzzy AHP and fuzzy measurement alternatives and ranking according to compromise solution (MARCOS). In contrast, [84] used triangular fuzzy VIKOR to assess the online information quality for diabetes based on criteria such as credibility, content, design, and security. Ref. [85] proposed a novel approximate weighting technique to assist multi-attribute decision analysis in determining the weight associated with each e-C website to rank them for CS. Using AHP and TOPSIS, [86] presented a novel way to analyze their e-C development’s existing risk environment. Instead of the SQ model, some researchers evaluated website quality to test websites’ usability, such as the system usability scale (SUS), which emerged in 1980 [87]. Ref. [88] combined different weighing methods in the SUS framework for ranking with the combinative distance-based assessment (CODAS).
The MCDM literature provides plenty of combinations of methods. However, the studies related to supplier selection, location selection, provider selection, technology selection, or product selection, which are intensively studied in the literature, are not included in the table because of the scope of this study. Instead, recent studies covering CS with a product or service/e-SQ topics have been reviewed and listed in Table 1. Table 1 shows the related service or product quality studies incorporating MCDM methods in the literature.
As shown in Table 1, WASPAS was used to measure CS, service/e-Service, or product quality studies separately in different working areas. Some are combined with WASPAS or other MCDM methods in different fuzzy environments. Some others were carried out without a fuzzy environment. However, no studies considered LMAW. According to the literature review in the scope of this study, although a couple of studies were conducted on WASPAS as hybrid methods, none of them were studied with the combination of the fuzzy LMAW. Similarly, in related works, no researchers considered their methods in the Fermatean fuzzy environments.
WASPAS, developed by [113] consists of two essential techniques. The WSM approach is uncomplicated, straightforward, and easy to grasp. It computes an alternative’s overall score as a weighted sum of the attribute values and is the most well-known and extensively utilized approach. The WPM was created to prevent options with low criterion values. It computes the score of each alternative as a product of the scale rating of each characteristic to a power equal to its relevance weight [114].
WASPAS method was reported to be capable of appropriately rating the options in all investigated selection issues. The parameter’s (λ) influence on the ranking accuracy of the WASPAS approach was also investigated.
Many studies combined WASPAS with AHP [98,100,101]. AHP, which was developed by [115,116], was used in the combination for the determination of the criteria weights in different problems. For the weighting of criteria, many methods are used in the literature. However, it is determined efficiency of these methods in discussing the topic in the wider research [117,118,119,120]. Though all of them have both advantages and disadvantages, if the criteria numbers increase, they might show either problem, such as consistency in the pairwise comparison of the AHP or leading the decision makers to misjudgments. On the other hand, the LMAW (logarithm methodology of additive weights) approach did not generate rank reversal issues. Thus, the LMAW approach demonstrates the substantial stability and reproducibility of outcomes in a dynamic context, even when processing more extensive data sets in several simulations [121]. The LMAW developed by [121,122] and [123] modified its crisp number using triangular fuzzy numbers.
Though the WASPAS method was used in different fuzzy environments, in this study, one of the recently developed Fermatean fuzzy WASPAS [124] methods, which is insufficiently investigated in the literature comparing other MCDM methods, was used.
Since few studies analyzed CS or dissatisfaction with MCDM approaches, and no studies handled a hybrid model of the F-LMAW with the Fermatean fuzzy WASPAS methods in assessment or ranking studies, this study contributes to management science and the MCDM literature with a new hybrid method.

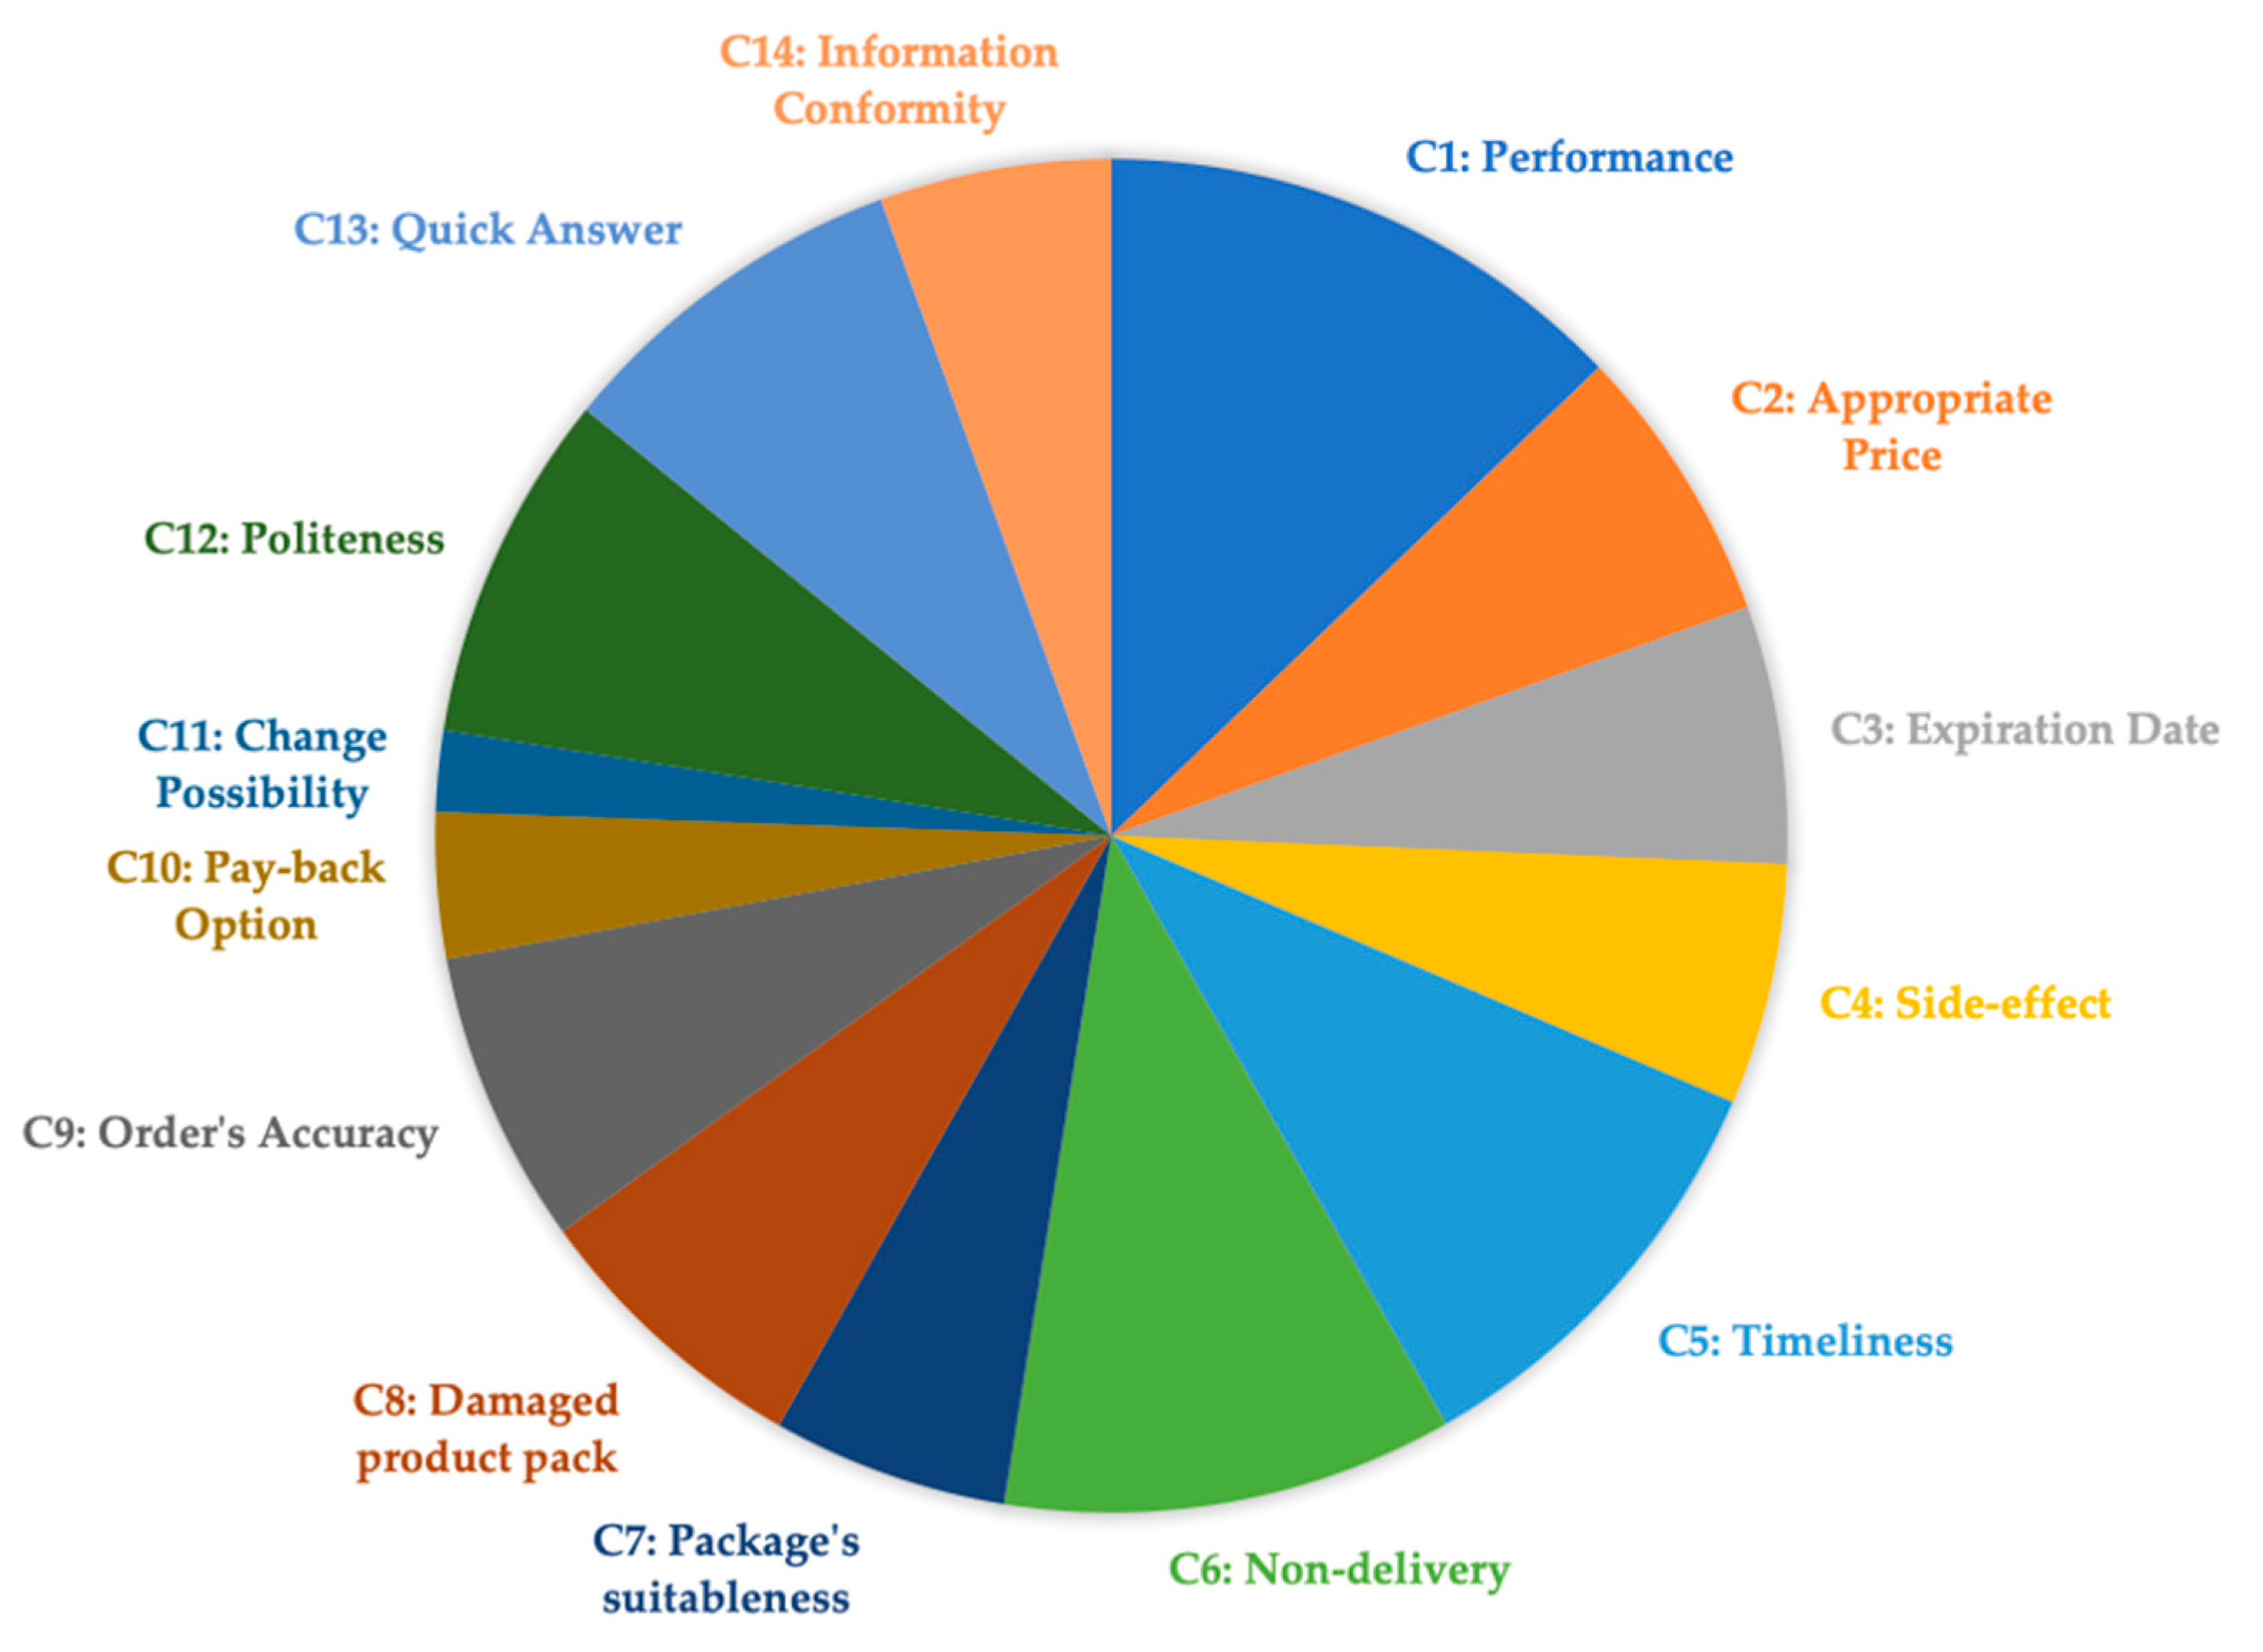
3. Model Framework and Selection of Quality Criteria

The majority of “personal care goods” are ruled by the US Food and Drug Administration (FDA) to be either cosmetics or pharmaceuticals (some are regarded as medicines). Cosmetics are designed to cleanse or beautify a person’s body (for example, shampoos and lipstick). In contrast, pharmaceuticals are intended to diagnose, cure, ameliorate, treat, or prevent illness, or to modify the structure or function of the body (for instance, sunscreens and acne creams). Some products, such as moisturizers and anti-dandruff shampoos, might be classified as both [125]. According to market classifications, health products also comprise household cleaners, such as cleaning tools, all-purpose cleaners, kitchen cleaners, metal polishes, septic treatments, upholstery cleaners, wood polish and care products, etc. Personal care products include hair care, shampoo, lip care, oral care, ear care, kids care, face masks, deodorants, lotions, creams, foot care, moisturizers, etc. Omega 3, protein nutrition, zinc, tea, weight loss supplements, nutrition bars and drinks, endurance and energy products, and sports nutrition items are examples of vitamins and dietary supplements. In contrast, massage oils, sleep products, and sprays are counted in the category of wellness and relaxation.
Even when sample sizes are big and variation is low, the market data studies show that average user ratings do not align well with reliability ratings. As stated in the beginning, this might be because average consumer ratings are impacted by characteristics that impact subjective perceptions of quality. Contentment happens when the discrepancy between what is expected and what is experienced is modest. When the disparity between expected and realized qualities is considerable, dissatisfaction arises. In contrast, some authors advise gauging service quality by combining expectations and beliefs [36].

3.1. Product Quality

Product characteristics can affect misalignment because the distinction between searched-for goods and experienced goods represents variations in the capacity to receive predictive data about a product’s quality before testing or purchasing. Before being trialed, searched products have more features that can be scientifically evaluated and readily compared. In contrast, experience goods have more subjective features, are harder to compare, and need consumers to use their senses to evaluate quality. Review characteristics and product qualities are predicted to play a role in misalignment [126]. Ref. [34] investigates the impact of price and branding, two of the solid extrinsic signals for quality.
Product quality is described as a consumer’s assessment of a product’s totality of features and characteristics, including whether a product review offers precise information on the essential attributes of the product. In contrast to review depth, which is often measured using review word count, product quality considers the amount of detail about crucial product performance characteristics, i.e., how much information on essential quality attributes is present in the review. Product quality is vital in consumer product selection; however, product performance qualities are far more challenging than pricing information [127]. Prior research demonstrated that older women were more interested in any study data offered on the proven usefulness of the product. Regarding cost, respondents aged 40–60 stated that expensive items were superior to inexpensive products more than women aged 20–35 [128].
The shelf life and expiration date of a specific pharmaceutical formulation are evaluated using different real-time and accelerated stability tests, which track the item over a time period in varied temperature and humidity storage settings [129]. Cosmetics begin to deteriorate or break down over time for various reasons. For example, dipping the fingers into a product introduces microorganisms, such as bacteria and fungus (mold and yeast), which must be managed (for example, using preservatives). On the other hand, emulsions, which are water and oil combinations, can separate. Moisture, such as in a restroom, may boost the growth of germs and fungus, and products might harden and crack when they dry out. Temperature fluctuations and exposure to sunshine and air can produce color and texture changes [125]. Personal care and cosmetic products are sensitive to consumption dates, posing possible health risks. Some products might also not comply with some people’s skin, even if the date is not overdue, because of the highly sensitive skin types or the chemical ingredients of products. Cosmetics and personal-care items may include substances with unknown safety or recognized health hazards. Cosmetic responses are the most prevalent single reason for hospitalization visits for allergic contact dermatitis [130].
Research has found that cosmetics containing harmful and dangerous chemicals are linked to malignancies, proliferation defects, abortion, and respiratory and skin hypersensitivity [131]. The lack of adverse effects is an essential element influencing women’s purchasing of skin care products. Hence, the fear of adverse effects and chemicals motivates people of all ages, genders, and educational levels to convert to herbal-based cosmetics [132].
On the other hand, household cleaners, for example chemical dishwashing detergents, frequently leave behind several dangerous petrochemicals, fragrances, dyes, and animal byproducts. Most dishwater detergents include hazardous chemicals that, if consumed or breathed, can induce various unpleasant effects. Some of these components have been linked to CNS illnesses such as multiple sclerosis, Parkinson’s, Alzheimer’s, and sudden infant death syndrome [133].
Thus, this study considered the expiration date and side-effect characteristics of health products’ quality parameters, which can affect the quality negatively, whereas it can affect product performance and reasonable price perception positively.

3.2. Service Quality

Ref [38] argues that most marketing strategies prioritize product quality and improvement. Focusing solely on the company’s products, on the other hand, might lead to marketing myopia. Some manufacturers, for example, feel that if they can “make a better mousetrap”, the rest of the world will follow. On the other hand, buyers may seek a better solution to a mouse problem rather than a better mousetrap. A better solution may be a pest control service or something more effective than a mousetrap. Furthermore, a better mousetrap will not sell until the maker attractively designs, packages, and prices it, positions it in an accessible distribution channel, obtains the attention of those who need it, and convinces consumers that it is a superior product.
Based on the SERVQUAL framework, reliability, responsiveness, and courtesy parameters were adopted for this study by defining delivery and aftersales service quality for purchased health and personal care products since the customers are served by different tiers in the marketplace. Ref. [67] defined reliability as performance consistency and dependability. It signifies that the company provides the service correctly the first time. It also implies that the company keeps its commitments. It entails billing accuracy, keeping accurate records, and executing the service on time. In this study, the different service companies perform two tasks: product delivery and aftersales service. The reliability concept is distinguished here into two dimensions: delivering service quality and aftersales service contexts.

3.2.1. Delivery Quality

Shipping is an essential operation in any process, notably in online purchasing. Customer satisfaction is dependent on product delivery service [134]. Delivery quality parameters address the effectiveness of the shipment of products. The essential considerations of effectivity are completeness and accuracy. Completeness indicates that no more manual tasks must be incorporated into a function, even in the worst-case situation. Correctness covers the product’s mistake-free functioning and includes resilience against a wide range of potential sources of error. Ensuring the accurate and complete realization of a job decreases the risk of unexpected or undesirable medical item utilization and, as a result, enhances the overall safety of the item [135].
Research uncovered latent customer satisfaction dimensions in product evaluations and investigated the link between these features and customer satisfaction in restaurant evaluations. One of these latent factors was the waiting time and service level [136]. Similarly, a study demonstrated multiple customer complaints about delayed refunds for “two-day delivery services”, which contradicts the quality improvement management components of quality management and the quality dimension’s dependability [137].
The delivery of products indicates that the client will receive the requested goods, which will be well packed, whose quantity, quality, and specifications will comply with the order, as well as the specified delivery time and location. The client anticipates that the store will provide the promised goods reliably and to an acceptable standard [134]. Thus, the inaccuracy of products ordered in terms of amount or type might lead to customer complaints. Prior works revealed that younger women were more interested in the shown-product’s package and color scheme [128]. Similarly, the product package might also be perceived as having quality characteristics because if a breakable product is ordered and improperly packed, even if it arrives safely to the customers, it might be distrusted. As a result, customers might avoid repurchasing the products from the e-marketplace because of the perceived risk of receiving them. Because there is a possibility of such a worst-case scenario, analogously, a damaged package might cause complaints even when the products were not harmed by shipping [138]. On the other hand, since the non-delivery of products also has a negative impact on online buyers’ attitudes [46], this parameter was incorporated into the model.
Accordingly, the factors of the package’s suitableness to the products, the damaged product’s package, the order’s accuracy, and the order’s non-delivery reflect perceived quality characteristics in addition to timeliness. In this study, the package’s suitableness to the products, as well as the orders’ timeliness and accuracy, might positively impact shipment service quality, while a damaged product’s packaging or order’s non-delivery might negatively affect service quality.

3.2.2. Aftersales Service Quality

Customers’ post-purchase activities are influenced by their level of satisfaction. A pleased customer is more likely to repurchase the goods and will also recommend the brand to others. The ultimate success is attained when a consumer advocates for the company’s service and promotes it to others. Customers who are dissatisfied with the goods may leave or return them. They may take public action by complaining to the corporation, consulting a lawyer, directly complaining to other groups (such as commercial, private, or government organizations), or publicizing their unhappiness to others online [139]. Expectation is a collection of assumptions that a consumer has regarding the items or services, and this can change between pre-consumption and post-consumption [19].
According to prior research, post-purchase customer care service is an essential component of CS. Product returns and order cancellations are reduced when purchasers obtain post-purchase contacts [139]. The buyer–seller connection, through which functional quality arises, is seen as a more significant marketing component than conventional marketing operations. This emphasizes the importance of the quality-generating process in service marketing, particularly buyer–seller communication [65]. Customers have sentiments of interactional justice when interactions with employees are characterized by politeness, empathy, and concern over service failure. Customer satisfaction is restored due to the perceived fairness given by online service recovery tactics [24]. Additionally, post-recovery contentment has a beneficial effect on post-purchase willingness [140].
Specifically, numerous actions have been discovered to be critical to a robust e-commerce organization and assure the company’s success in an e-business environment. These tasks include reacting quickly to client inquiries and concerns, providing access to services, and providing a positive view of the service quality obtained [27]. Guarantee or warranty and free repair service are examples of aftersales services [141]. Money-back guarantee ranked among the five most perceived risks of online shopping [138].
Responsiveness and trust criteria were identified as solid CS and loyalty determinants [20]. Responsiveness, particularly, was defined as workers’ eagerness or readiness to deliver service, which entails the timely delivery of services, including immediately mailing a transaction slip, calling the client back, and providing rapid service (e.g., setting up appointments quickly) [67]. However, responsiveness comprises many sub-variables to this definition. Hence, in this study, the responsiveness parameter of SERVQUAL was divided into pay-back option, change possibility, and quick answer because all these criteria are related to the responsiveness of retailers that give customers aftersales services.
The courtesy parameter entails being polite, respectful, considerate, and friendly to contact staff (including receptionists, telephone operators, and so on). In this study, politeness meets the definition.
Previous research found that certain internet merchants use unfair persuasion techniques, such as providing items that do not match the description on their website and persuading customers with exorbitant or false promotions and ads [14].
The customer will be disappointed when the explained information about the product on websites does not match the product delivered to them because information about the product is one of the most widely perceived risks of online shopping [138]. In this study, therefore, information conformity to the product delivered was regarded as a quality parameter.
The framework in this study was modified from [74] since it includes the post-purchase decision-making process, particularly WOM. Perceived value is predicted to directly explain both repurchase intention and WOM, in addition to its effect on WOM via customer satisfaction and continued buying intention between rebuy intention and willingness to recommend. The model hypothesizes that consumers who plan to repurchase the product/service would have a higher desire to suggest the product/service to people. [74] expressed that the model’s limitation is in single-item measurement, although the service quality might have several elements. With many service parameters derived from the SERVQUAL model and the prior research mentioned above, in this study, the following questions are sought to be answered:
Which factors are critical for consumers when buying goods in the health category?
How important are these factors for choosing specific health-related goods?
Do these factors change customers’ preferences while purchasing products online in the health category?
The model was constructed as shown in Figure 4 below for the above-mentioned quality characteristics of products and services.
Based on the model above, the following hypotheses were constructed:
H1: 
The performance of products in the health category affects customer satisfaction positively.
H2: 
The reasonable price of products in the health category affects customer satisfaction positively.
H3: 
The side effect of products in the health category affects customer satisfaction negatively.
H4: 
The expiration date of products in the health category affects customer satisfaction negatively.
H5: 
The timeliness of orders in the health category affects customer satisfaction positively.
H6: 
The non-delivery of orders in the health category affects customer satisfaction negatively.
H7: 
The order’s accuracy affects customer satisfaction positively.
H8: 
Product information conformity on the website positively affects customer satisfaction.
H9: 
The package’s suitableness for orders in the health category affects customer satisfaction positively.
H10: 
The damaged product pack affects customer satisfaction negatively.
H11: 
The pay-back option of retailers in the health category affects customer satisfaction positively.
H12: 
The change possibility of retailers in the health category affects customer satisfaction positively.
H13: 
The politeness of retailers in the health category affects customer satisfaction positively.
H14: 
The quick answer of retailers in the health category affects customer satisfaction positively.
The method is explained in the following section.

4. Methods Section

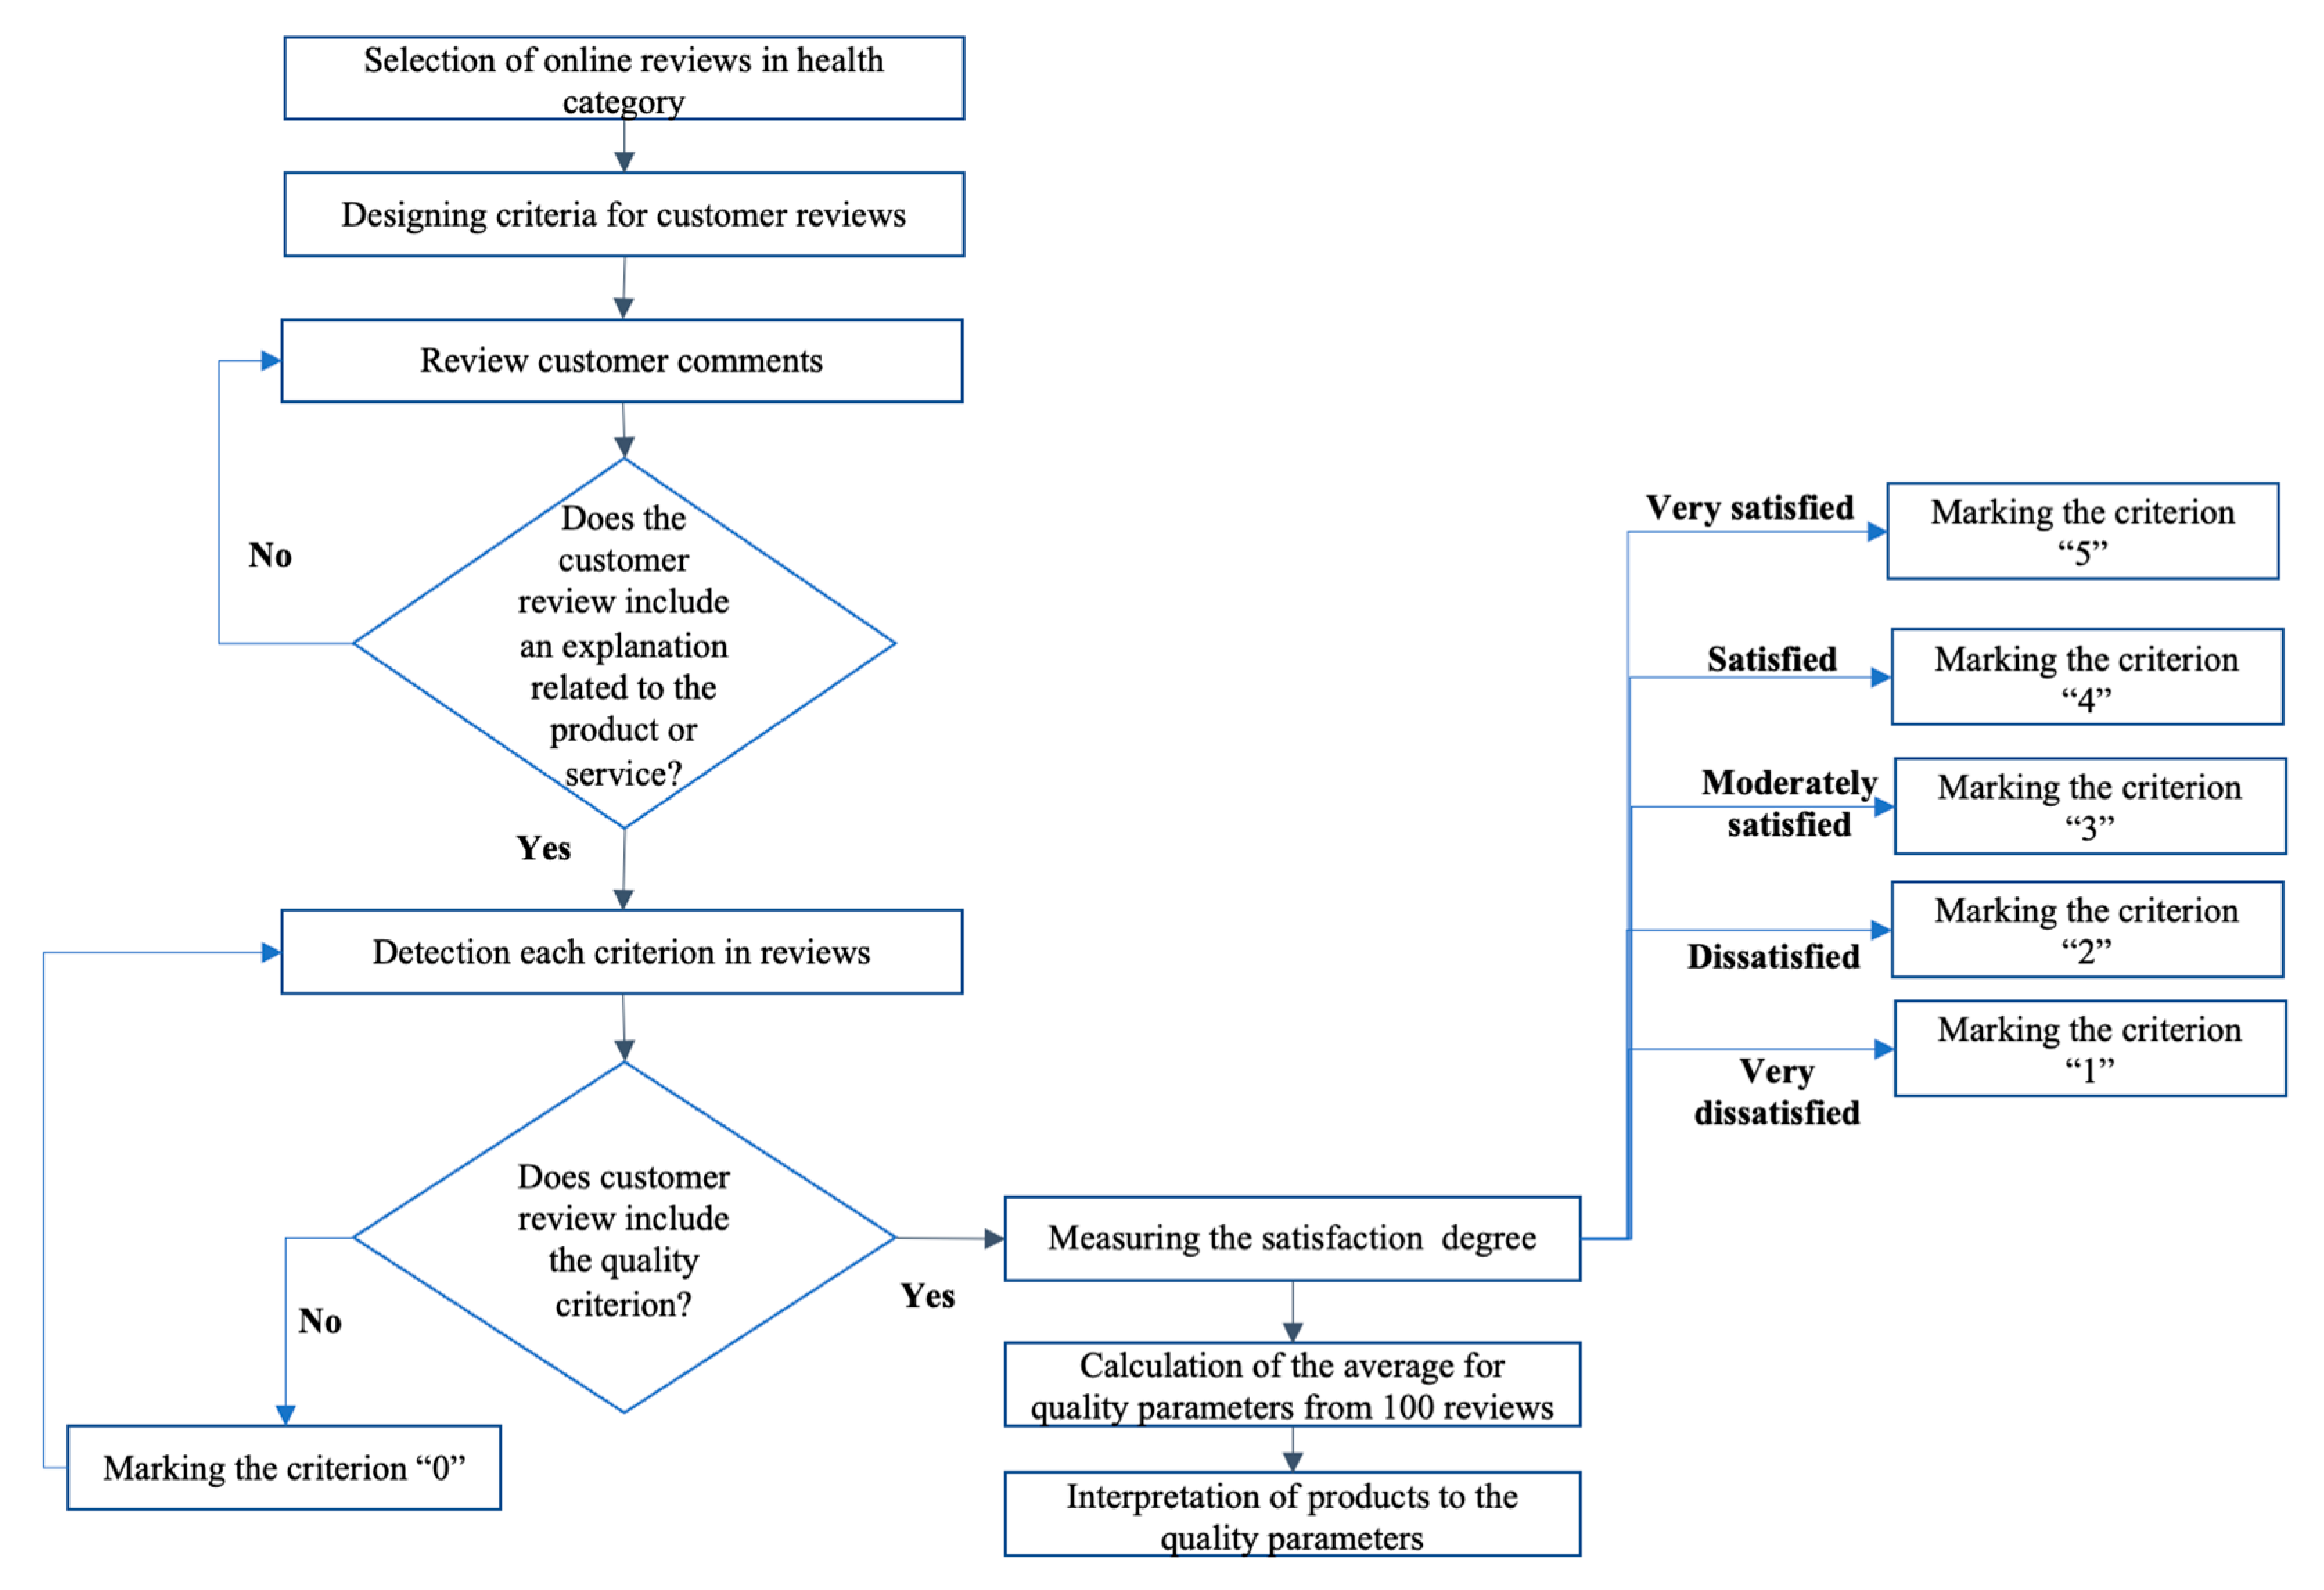
4.1. Analyzing Customer Reviews

Online shoppers’ reviews of items provide helpful information to future customers and product manufacturers. Due to the large number and unstructured nature of product evaluations, it is challenging and time consuming to manually sift through all relevant reviews and produce a detailed assessment of comparing items.
Customers’ online comments were collected for eight products, including personal care, wellbeing, and household products, on e-market sites. The investigated review date was chosen to be mainly after COVID-19. For each product, 100 sample customer comments were collected. The reviewed sample was more than 100. However, not all comments comprised the quality parameter. Some reviews contained only one word; on the other hand, some others had more sentences. Until a 100 with whole sentences sample, all reviews were investigated. In the comments, the keywords related to quality parameters were inspected. In line with fourteen quality parameters, each comment, when they were detected, was measured with a Likert-type scale (1: very dissatisfied, 5: very satisfied). In case of no quality-parameters-related keyword in the comments, the quality parameters are given 0. This parameter was set to zero when no parameters were mentioned in the customer comment. Each quality parameter in every comment was scored and the scores of 100 samples were averaged for each product. Figure 5 below summarizes the stepwise methodology for sentiment analysis.
Meanwhile, the ratings of comments were also collected and averaged. Additionally, the entire ratings were kept by comparing with the samples’ average. These values are given in coming sections.

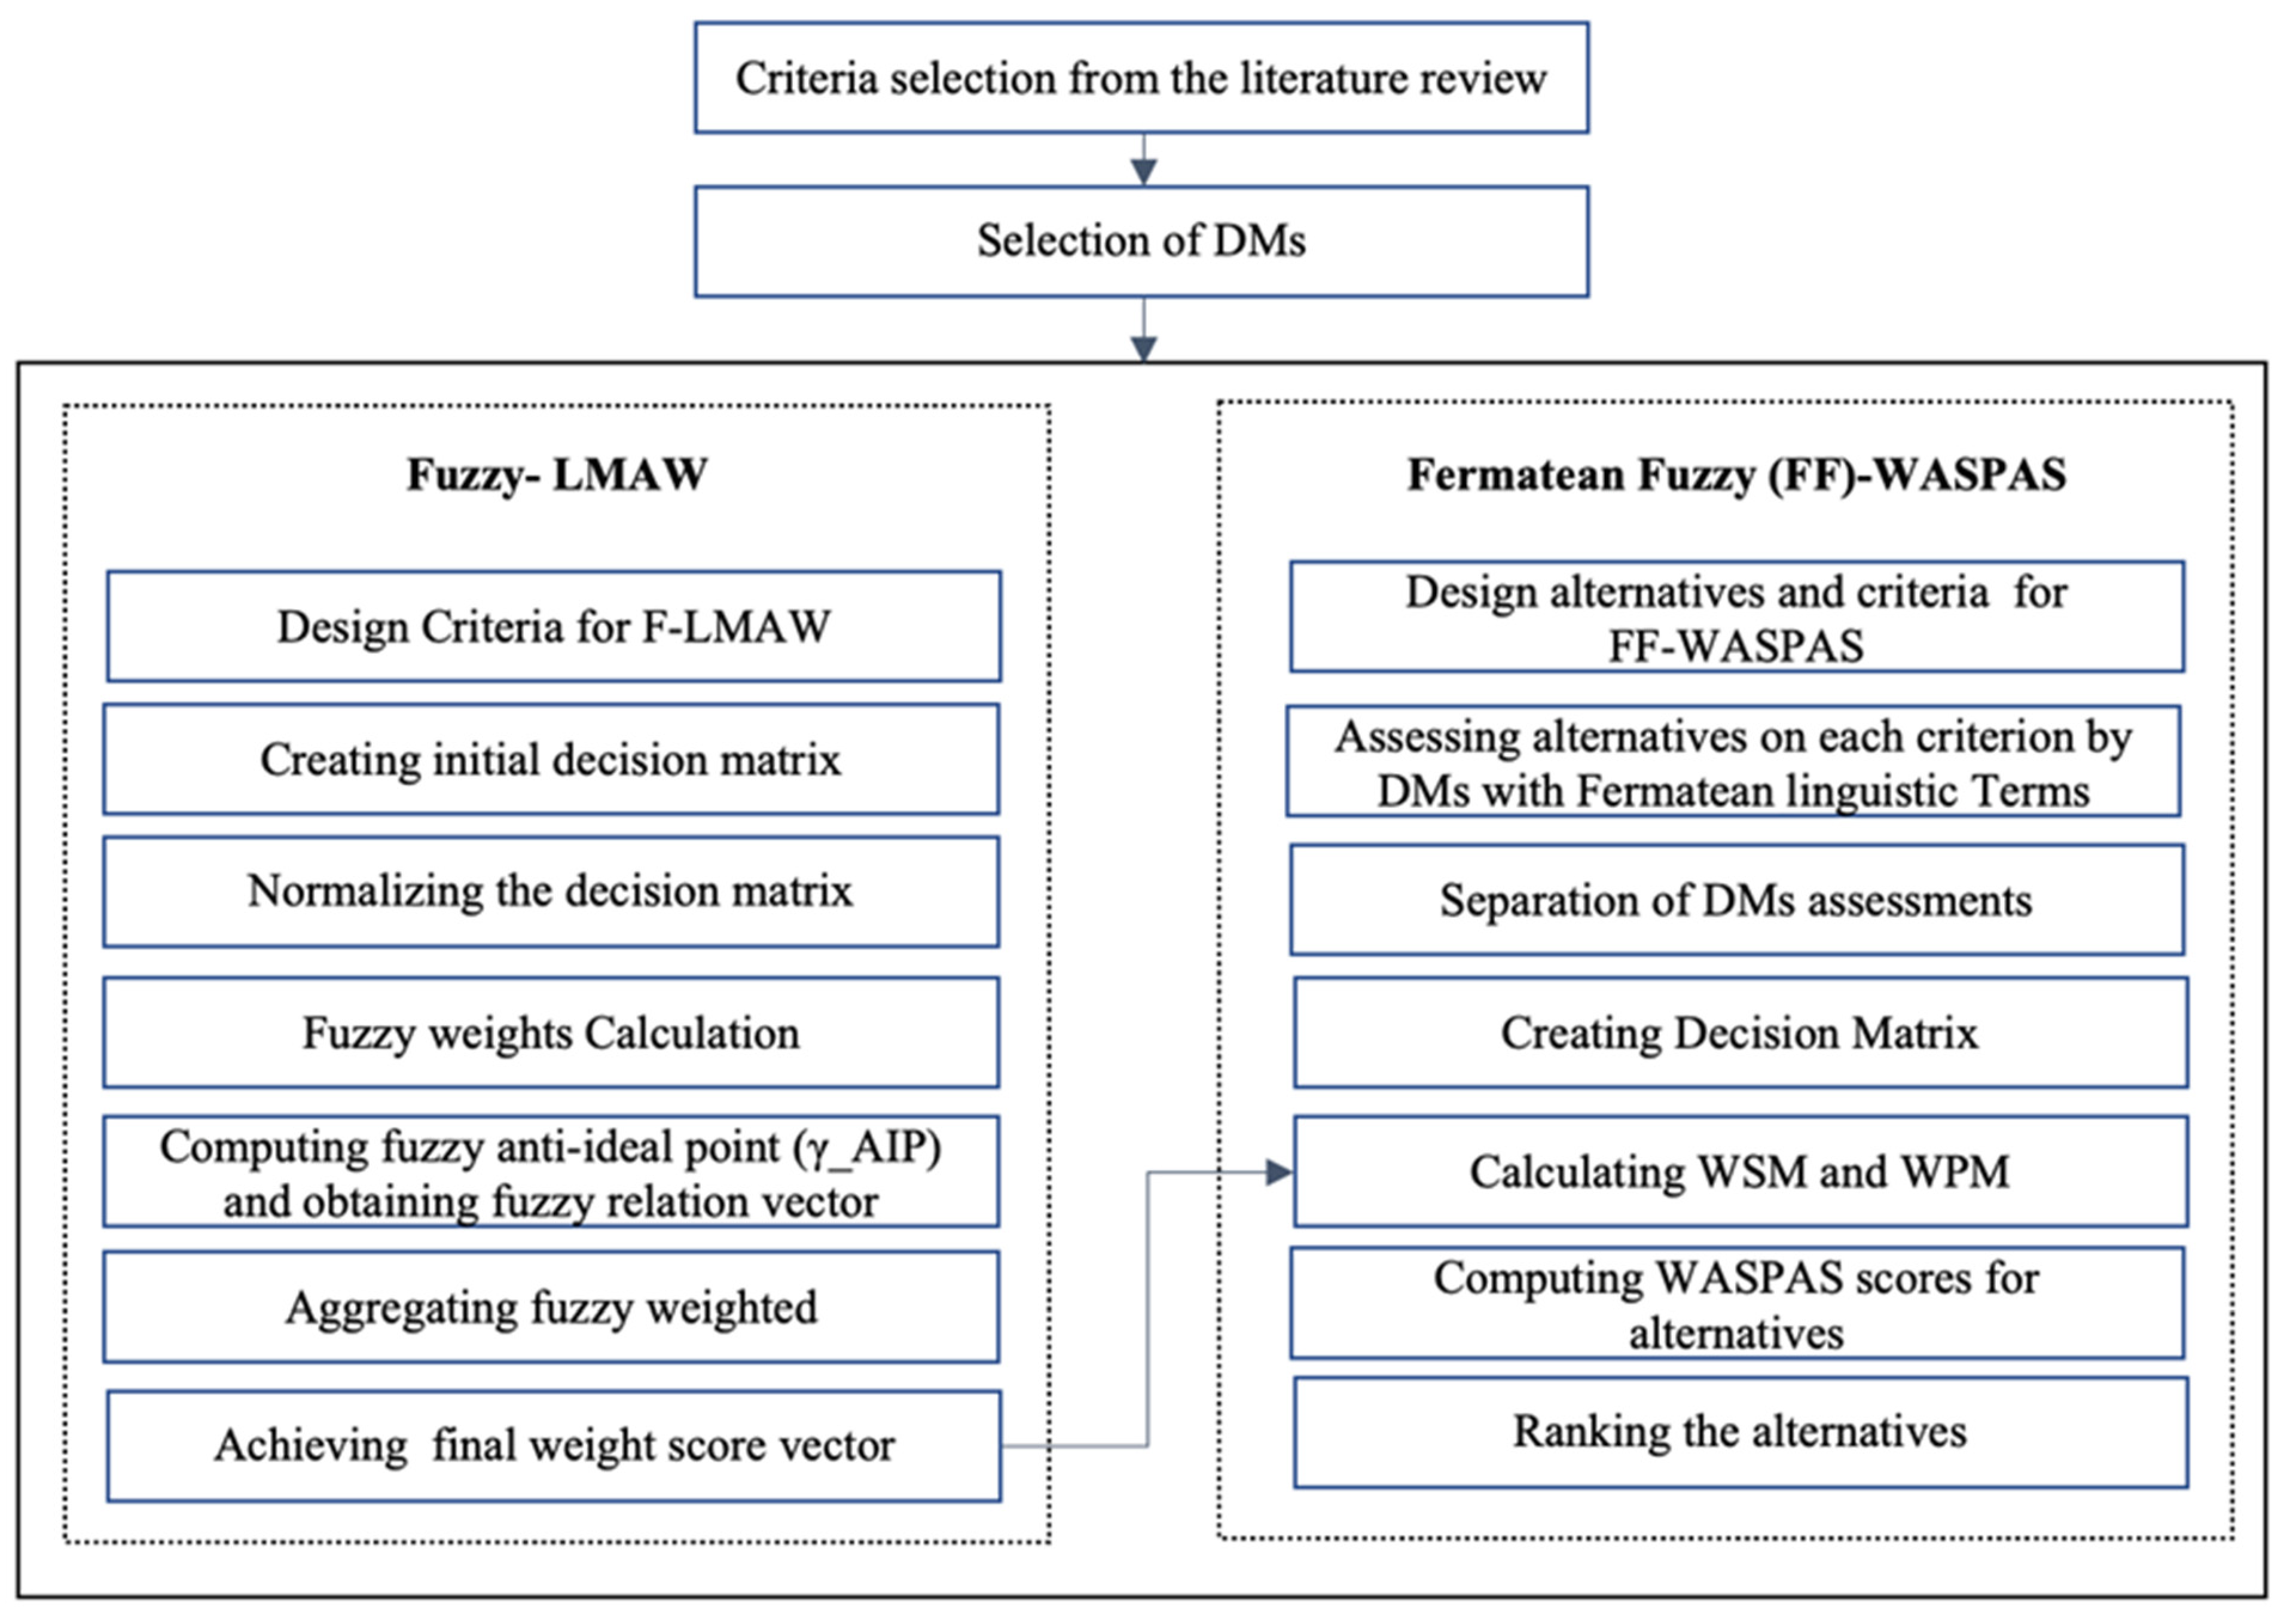
4.2. A Hybrid Model of the Fuzzy LMAW and the Fermatean Fuzzy WASPAS

This work combines the FF-WASPAS approach with the F-LMAW method. Fuzzy numbers are employed to portray fuzziness and ambiguities in information better.
The quality parameters were selected from the literature and detected in the customer reviews of eight products.
Many studies have revealed that females are more influenced by online customer evaluations than males [142,143] regarding e-SQ responsiveness and trustworthiness, which impact CS [144]. The age factor also affects online shopping behavior. The literature shows that varied age categories (under 35, 35–50, and above 50) perceive internet shopping differently [145]. Indeed, shoppers aged between 21 and 40 view online shopping more positively than their older counterparts [146].
Considering age, gender, shopping frequency, and education level, the decision makers were selected. All decision makers are female and shop frequently. The ages of DMs are 35, 33, 37, and 43, respectively. The education levels of DMs are the following: DM1 and DM4 graduated from a university, while DM2 and DM3 have high school degrees. Although DM2 and DM3 do not work for any company, they think online shopping is time saving and enjoyable. DM1’s profession is marketing, while DM4 has worked for a quality certification company for 5 years.
After selecting decision makers (DMs), the forms were designed. The decision makers’ assessment related to the criteria was taken based on the triangular fuzzy-based scale, and the criteria were weighted using the LMAW method. The methodology of the study was stepwise explained. The outline of the proposed novel methodology’s decision-making technique is illustrated in Figure 6 below.
The first step to the sixth shows the application of F-LMAW. From the F-LMAW method, normalized weighted criteria were gained in the methodology’s sixth step. After designing the WASPAS method, these weighted and normalized values were utilized in the seventh step to calculate WSM and WPM, and then FF-WASPAS followed the remaining steps.
The key terminology of the Fermatean fuzzy sets and the methodology are given in the next part.

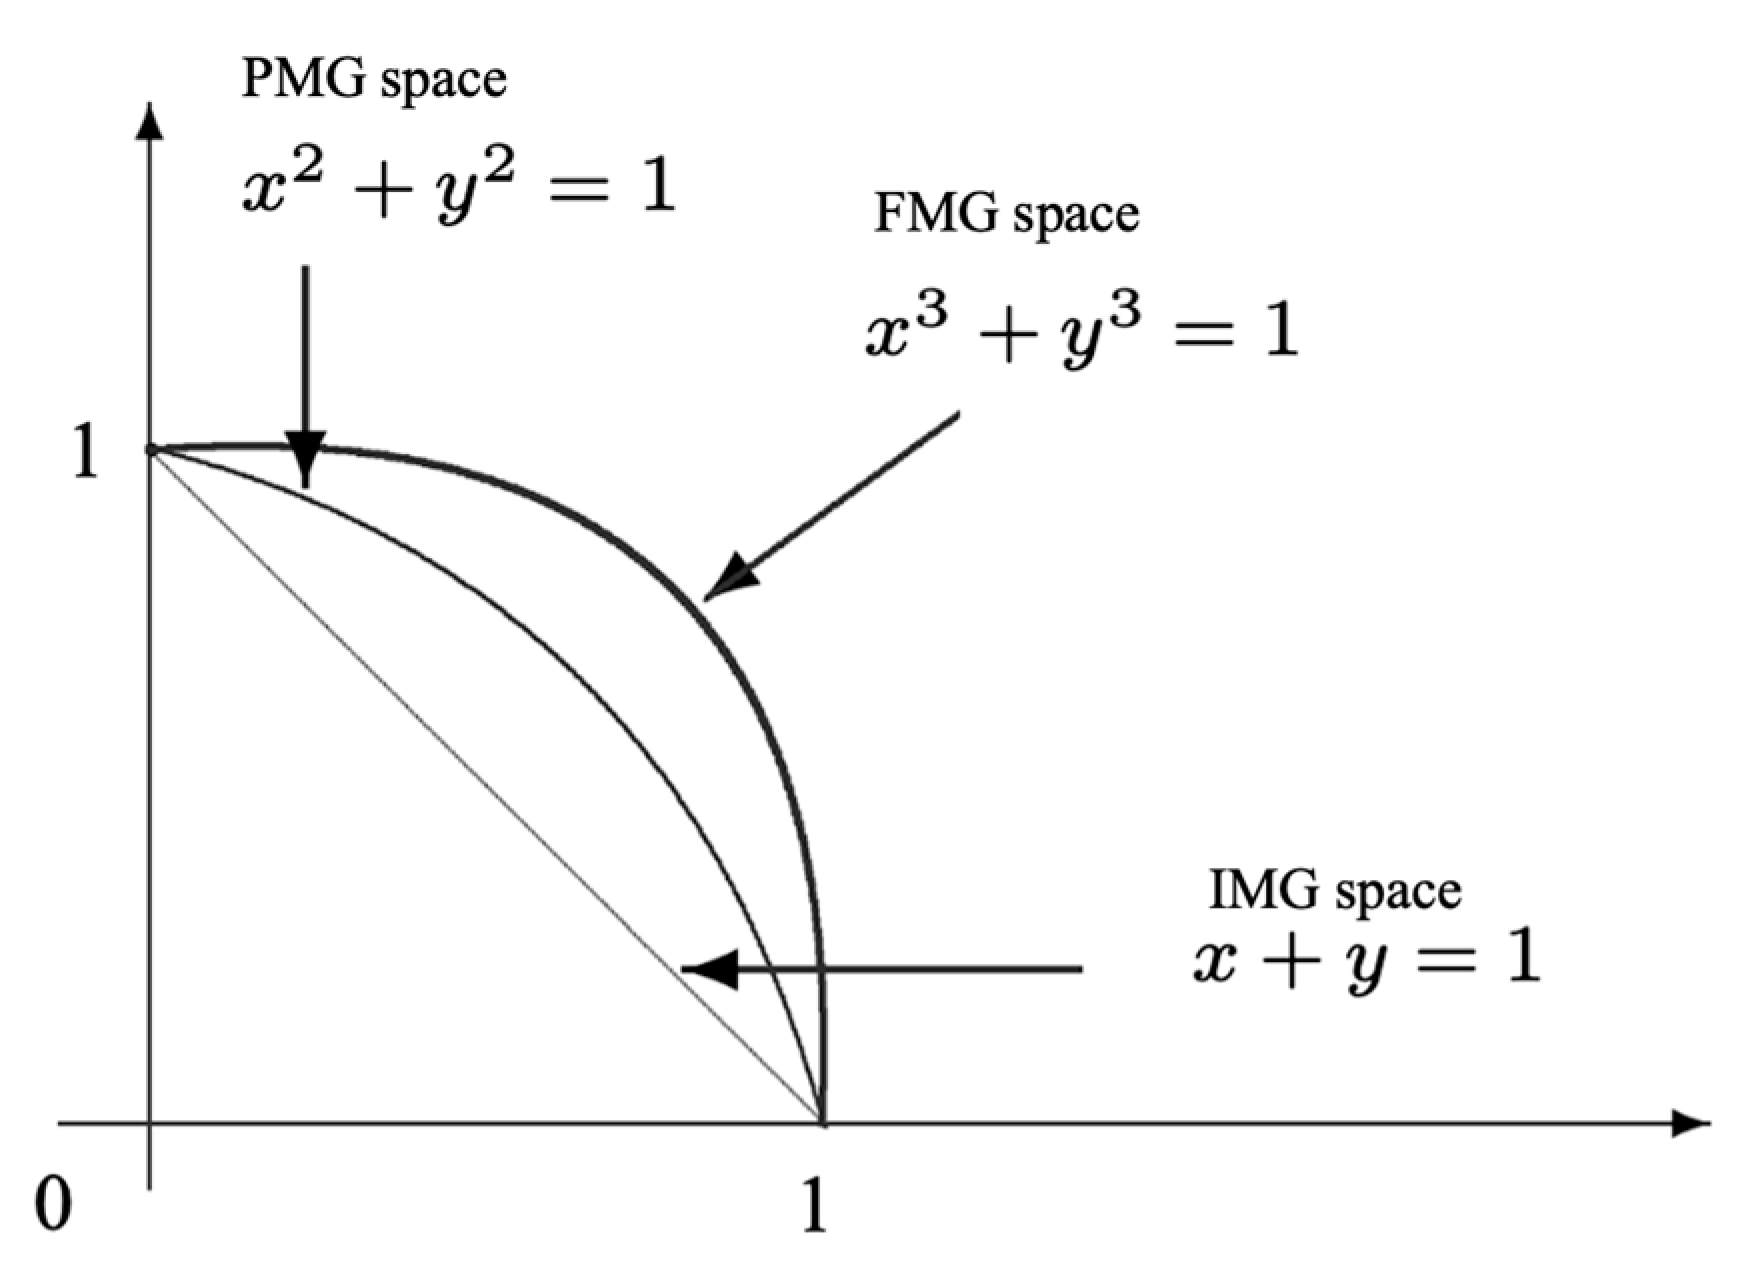
4.2.1. Preliminaries for Fermatean Fuzzy Sets

The Fermatean fuzzy set (FSs) developed by [147], which is similar to intuitionistic FSs and Pythagorean FSs, includes three fundamental components. These three components are defined as the membership degree ( a ˜ ( x )   ), the non-membership degree ( β ˜ ( x ) ), and the indeterminacy degree ( π ˜ ( x ) ). The distinctions of the membership degree spaces between IMS, PMGs, and FMGs can be seen in Figure 7. The FFs-related definitions are as follows:
Definition 1. 
Let X be a universe of discourse. A Fermatean fuzzy set ˜ in X is an element in the following form ˜ = { x , a ˜ ( x ) , β ˜ ( x ) : x   ϵ   X } , where a ˜ ( x ) ,     β ˜ ( x ) : X [ 0 , 1 ] , with the condition 0 ( a ˜ ( x ) 3 ) + ( β ˜ ( x ) 3 ) 1 ,     x X . For any FFS ˜ and x X , the indeterminacy degree of x to ˜ is defined as follows [147]:
π ˜ ( x ) = 1 ( α ˜ ( x ) ) 3 ( β ˜ ( x ) ) 3 3  
For simplicity, the symbol is addressed as follows: ˜ = ( α ˜ ,   β ˜ )   for the FFS ˜ = { x , a ˜ ( x ) , β ˜ ( x ) : x   ϵ   X } .
For the sake of simplicity, the Fermatean fuzzy numbers (FFNs) were assumed to be FFS elements.
The set operations on FFS are given in Equations (2)–(5).
Definition 2. 
Suppose ˜ 1   = ( α ˜ 1 , β ˜ 1 ) and ˜   2 = ( α ˜ 2 , β ˜ 2 ) are two FFSs, and λ > 0 , then the following operations were defined [147]:
˜ 1 ˜ 2 = ( α ˜ 1 3 + α ˜ 2 3 α ˜ 1 3 α ˜ 2 3 , 3   β ˜ 1 β ˜ 2 ) ,
˜ 1 ˜ 2 = ( α ˜ 1   α ˜ 2   ,   β ˜ 1 3 + β ˜ 2 3 β ˜ 1 3 β ˜ 2 3 3 ) ,
λ ˜ = ( 1 ( 1 α ˜ 3 ) λ 3 ,   β ˜ λ )
˜ λ = ( a ˜ λ , 1 ( 1 β ˜ 3 ) λ 3 )
The complement function is the following:
Definition 3. 
The complement function of Fermatean fuzzy set ˜ = ( α ˜ ,   β ˜ )   is given in Equation (6) [147]:
˜ = ( β ˜ ,   α ˜   )    
The ranking function with FFS is given in Equations (7) and (8).
Definition 4. 
The score and accuracy functions are used in the ranking. Suppose ˜ = ( α ˜ ,   β ˜ )   is an FFS, the score function Equation (7) and accuracy function Equation (8) are given below [147]:
˜   s c o r e   = ( a ˜ 3 β ˜ 3 )
where ˜   s c o r e   [ 1 , 1 ]
˜   a c c   = ( a ˜ 3 + β ˜ 3 )
where ˜   a c c   [ 0 , 1 ]
Definition 5. 
Assume ˜ 1   = ( α ˜ 1 , β ˜ 1 ) and ˜   2 = ( α ˜ 2 , β ˜ 2 ) are two FFSs, and ˜   s c o r e   1 and ˜   s c o r e   2 are the score functions, respectively, then the scoring is given with these conditions [147]:
If ˜   s c o r e   1 < ˜   s c o r e   2   ˜ 1 <     ˜ 2 ;
If ˜   s c o r e   1 > ˜   s c o r e   2   ˜ 1 > ˜ 2 ;
If ˜   s c o r e   1 = ˜   s c o r e   2   ˜ 1 ~   ˜ 2 ;
Definition 6. 
Assume ˜ 1   = ( α ˜ 1 , β ˜ 1 ) and ˜   2 = ( α ˜ 2 , β ˜ 2 ) are two FFSs, and ˜   a c c   1 and ˜   a c c   2 are the accuracy functions, respectively, then these conditions are given [147]:
If ˜   s c o r e   1 < ˜   s c o r e   2   ˜ 1 <   ˜ 2 ;
If ˜   s c o r e   1 > ˜   s c o r e   2   ˜ 1 > ˜ 2 ;
If ˜   s c o r e   1 = ˜   s c o r e   2
If ˜   a c c   1 < ˜   a c c   2   ˜ 1 < ˜ 2 ,
If ˜   a c c   1 > ˜   a c c   2   ˜ 1 >   ˜ 2 ,
If ˜   a c c   1 = ˜   a c c   2   ˜ 1 =   ˜ 2 .
Definition 7. 
Suppose ˜ i = ( α ˜ i ,   β ˜ i )   is the set of k FFS, and w = ( w 1 , , w k ) T is the weight vector for ˜ i ( i   w i = 1 ) where i = 1 , 2 , , k .
FF weighted average aggregation operator F F W A is defined as follows [124]:
F F W A = ( ˜ 1 , ˜ 2 ,   , ˜ k ) = ( i = 1 k w i α ˜ i , i = 1 k w i β ˜ i )
Definition 8. 
The positive defuzzied value is defined in Equation (10) [124]:
T p o s ( X ˜ i j ) = 1 + T ( X ˜ i j )
where T ( ˜ ) [ 1 , 1 ]

4.2.2. Weighting the Criteria with the Triangular F-LMAW Method

The details are provided below.
  • Step 1: Establish a group of decision makers and design the decision-making matrices: In this stage, each decision maker (DM) evaluates n criteria with the help of linguistic terms given in Table 2.
    Using the triangular fuzzy number, the first decision matrix is formed.
  • Step2: Create the first (aggregated) decision-making matrix ( X ˜ ). The Bonferroni aggregator is used to combine initial (expert) matrices into a single aggregate matrix, as shown in Equation (11):
    A ˜ i j = ( 1 k ( k 1 ) i , j = 1 i j k A ˜ i ( e ) p A ˜ j ( e ) q ) = { ( 1 k ( k 1 ) i , j = 1 i j k A ˜ i ( l   e ) p A ˜ j ( l e ) q ) 1 p + q , ( 1 k ( k 1 ) i , j = 1 i j k A ˜ i ( m   e ) p A ˜ j ( m   e ) q ) 1 p + q , ( 1 k ( k 1 ) i , j = 1 i j k A ˜ i ( r   e ) p A ˜ j ( r   e ) q ) 1 p + q }
    where A ˜ i j states the averaged values derived by using the Bonferroni aggregator, p,q > 0 represent the Bonferroni aggregator’s formation settings, and e denotes the e-th expert of k expert, where l and r represent the fuzzy number’s distributions with left and right, respectively, while m represents the value at which the membership function of a fuzzy number equals 1.
  • Step 3: Normalizing the initial matrix: The components of the first decision-making matrix are normalized using the formula below Equation (12), and the normalized matrix A ˜ i j N is obtained:
    A ˜ i j N = { 1 + A ˜ i j A ˜ j + = ( 1 + A i j l A j + , 1 + A i j m A j + , 1 + A i j r A j + )   i f   j   B ,   1 + A ˜ j A ˜ i j = ( 1 + A j A i j r , 1 + A j A i j m , 1 + A j A i j l )   i f   j   C .
    where A j + = max ( A ˜ j r ) and A j = min ( A ˜ j l ) .
  • Step 4: Calculate the weightings of the criteria: The decision makers are intended to be involved in determining the weighting values of the criterion E = { E 1 , E 2 ,   , E k } . The n criteria are prioritized. The greater value from the linguistic variables scale is allocated to the criteria with the highest relevance, and inversely. As a result, the priority vectors P ˜ e = { γ ˇ C 1 e , γ ˇ C 2 e ,   , γ ˇ C n e } are obtained. γ ˇ C n e corresponds to the value from the fuzzy linguistic scale ascribed to the criteria n by the expert e.
  • Step 5: Compute fuzzy anti-ideal point ( γ A I P ) and obtain fuzzy relation vector: Using Equation (13), the absolute fuzzy anti-ideal point ( γ A I P ), a fuzzy value that is less than the least from the collection of all priority vectors, and fuzzy relation vector R ˜ e = ( η ˜ e C 1 , η ˜ e C 2 , , η ˜ e C n ) are determined.
    A ˜ i j N = η ˜ e C n = ( γ ˇ C n e γ ˜ A I P ) = ( γ C n ( l ) e γ A I P ( r ) , γ C n ( m ) e γ A I P ( m ) , γ C n ( r ) e γ A I P ( l ) )
  • Step 6: Aggregate fuzzy weighted and achieving final score vector: Using Equation (14), the weighting values calculated for each decision maker and the weighting vector w e j = ( w ˜ e 1 , w ˜ e 2 , , w ˜ e n )   T are obtained.
    w ˜ j e = ( ln ( η ˜ C n e ) ln ( j = 1 n η ˜ C n e ) ) = ( ln ( η ˜ C n ( l ) e ) ln ( j = 1 n η ˜ C n ( r ) e ) , ln ( η ˜ C n ( m ) e ) ln ( j = 1 n η ˜ C n ( m ) e ) , ln ( η ˜ C n ( r ) e ) ln ( j = 1 n η ˜ C n ( l ) e ) )
The aggregation of fuzzy weighted vector w j is determined with the help of the Bonferroni operator in Equation (15)
w j = { ( 1 k ( k 1 ) i , j = 1 i j k w i ( l   e ) p w j ( l   e ) q ) 1 p + q , ( 1 k ( k 1 ) i , j = 1 i j k w i ( m   e ) p w j ( m   e ) q ) 1 p + q , ( 1 k ( k 1 ) i , j = 1 i j k w i ( r   e ) p w j ( r   e ) q ) 1 p + q }
Ultimately, the final weighting vector w j   = ( w j   , w j   , , w j   ) T is determined from the coefficients of values computed by defuzzification using Equation (16).
w j   = ( l + 4 m + r 6 )

4.2.3. Ranking of Alternatives with the FF-WASPAS

  • Step 7: Create a list of options. The decision makers assess the products based on the linguistic terms for each criterion. The linguistic terms were translated into the Fermatean fuzzy crisp numbers in Table 3.
  • Step 8: Define linguistic concepts and the Fermatean fuzzy sets (FFSs) that correspond to them. In this phase, decision makers should specify language phrases, such as “extremely low” and “very high”, as well as their respective FFSs.
  • Step 9: Obtain each decision maker’s assessment based on each criterion. Each DM should analyze options in relation to each stated criterion in this stage. The assessment technique uses the linguistic concepts created in the preceding stage based on the Fermatean fuzzy sets. The kth decision maker’s appraisal of the ith choice on the jth criterion is represented D M ˜ i j k = ( α D M ˜ i j k ,   β D M ˜ i j k ) .
  • Step 10: Aggregate decision makers’ judgments with the aggregation operator defined in Equation (9) in the preceding part. The judgments produced by each DM in Step 6 were combined using the following calculation and equivalent weights w ˜ k = 1 p . As a result, the aggregated assessments or components of the decision matrix X ˇ   i j = ( α X ˇ   i j , β X ˇ   i j )   are given as follows (17):
    X ˇ   i j = F F W A ( D M ˜ i j 1 , D M ˜ i j 2 , , D M ˜ i j p ) = ( 1 p k = 1 p α D M ˜ i j k , k = 1 p β D M ˜ i j k )
  • Step 11: Normalize the decision matrix in step eight. The decision matrix is normalized using the normalization approach in the conventional WASPAS. After employing the Fermatean fuzzy sets, it must be dealt with components with values ranging from 0 to 1. As a result, it is unnecessary to utilize a normalization method to change the value scale. In the case of cost criteria, the notion of the complement of FFSs Equation (8) is applied to change the values associated with cost criteria. Let B and C represent the sets of benefit and cost criteria. The following are the elements of the normalized decision matrix:
    N ˜     i j = { X ˇ   i j             ;   i f   j B ( X ˇ   i j )   ;   i f   j C
  • Step 12: Determine the WSM and WPM values. WSM and WPM values are calculated using the addition, multiplication, and other operators of FFSs established in the preceding section Equations (2)–(5).
    Q ˜ i S   = j = 1 m w j ( N ˜     i j )
    Q ˜ i p   = j = 1 m ( N ˜     i j ) w j
  • Step 13: Determine the WASPAS value. Integrating the WSM and WPM values yields the WASPAS metric using a combining parameter ( δ ). This step’s calculation is based on the formula below in Equation (21).
    Q ˜ i   = δ Q ˜ i s   ( 1 δ ) Q ˜ i p    
  • Step 14: Sort the options according to their positive Q ˜ i   values. Definition 6, stated in the preceding section, compares and ranks the options.

5. Results

5.1. Customer Reviews Results

The sentiment analysis, which is manually performed, of 100 customer comments for each product according to the quality parameters mentioned above showed the causes of their complaints. As Figure 5 shows, the sentiment analysis method is carried out for each product. Additionally, Figure 8 below depicts the design of the form for analysis and exemplifies the comments and ratings for electric toothbrushes. The original comments were shown in Figure S1 as Supplementary Materials, and the reviews were translated into English. The translated reviews with readable size were displayed in Figure S2 as Supplementary Materials.
The expiration date is a more sensitive parameter in health-related products, which is taken seriously by pharmaceutical and chemists. Although it will be a rare experience for customers to obtain an expired product, from a customers’ point of view, the lifetime or time for the product to be used is expected to be as long as is indicated. For example, from Figure 8, a customer who commented on 10 December 2021 perceived that the bought electric toothbrush did not look like it would be used for long. Skin products such as creams have a specific expiration date. Although it is not shown here, during analysis, it was noticed that customers complained that the product’s expiration date was close to the purchase date of the products. Although they intended to use the product for one year, they could not use it since its expiration date was near. Likewise, multi-vitamins have a certain shelf life. Some customers purchased two bottles of multi-vitamins to use after finishing one. However, they expressed that they could not finish the entire product due to its expiration date.
In some reviews, particularly regarding moisturizing cream, it was observed that some sellers sent a small gift in a similar product category with the purchased products to some customers, while others did not. Although the customers were satisfied with both products and their service, some rated under five stars because they did not receive any gifts.
Again, from Figure 8 in the highlighted rows, the electric toothbrush gave the customer who commented on 24 November 2020 side effects because it caused bleeding and tartar on the teeth. Because of side effects, this parameter was scored as “1,” showing very high dissatisfaction with the product according to this quality criterion.
As mentioned earlier, the related criteria for each product were scored according to customer comments. The score shows the satisfaction level of customers with the products related to the quality criteria. Each criterion was scored from a hundred customers, then averaged and summarized.
Table 4 below demonstrates the average levels of customer satisfaction with online products and their average ratings.
According to Table 4, the customers were most satisfied with the shampoo they purchased. Following that, multi-vitamins came with an average rating of about 3.7 stars. The most dissatisfied people were those who purchased medical pillows. The second most dissatisfied consumers with online shopping were those who bought antiperspirant cream deodorant. The average satisfaction levels of electric toothbrushes and washing liquids were medium and nearly identical. The moisturizing creams were rated under the expectations of consumers.
From Table 4, in the last column that shows average rating scores, it can be seen that customers were most disappointed when they wanted to change the products or be refunded their money. These consequences lead to customer views regarding a lack of quality in post-service activities. Particularly, customers were surprised that the ordered products did not match what they usually purchased from the stores. These consumers use the specific products regularly and know the product quality, and for ease of ordering, they use an e-commerce platform. However, some sellers sell imitation products in the marketplace to make a profit by misusing the real product’s brand. The imitated products might also cause side effects, which can be perceived as a side effect of the original product by customers. This situation may induce the original product to be disparaged and its sales to decrease.
Another problem is that the product’s expiry date might be passed or close to the selling date. Additionally, the product might not be stored in the correct environmental conditions. Humidity, temperature, and other factors can spoil the content of the product, so it may also have side effects.
However, it is worth noticing that the average ratings were calculated for the 100 review samples (for each product). Shampoos, multi-vitamins, and electric toothbrushes were selected, and the product ratings that are 3 or below were purposely selected to enhance and examine the complaints. The overall rating for the electric toothbrush is demonstrated in Figure 9 below.
The picture of the product is not displayed due to its brand. From Figure 9, it is clear that 4893 customers rated the product, and 342 (181 + 49 + 112) of them rated it 3 or below. A total of 4551 (621 + 3930) online shoppers, which make up 93% of the total, were satisfied with the product. The overall rating for the electric toothbrush is 4.7 stars.
For the selected products, the overall customer rating for each product is given in Table 5 below.
As seen from Table 5, the entire customer reviews ratings differ from the samples. Customers’ overall ratings for the selected products are very close to 5. The entire reviews show that people’s satisfaction levels with each product are over 70%; however, the satisfaction levels of multi-vitamin and medical pillows were lower than others. Those whose ratings are 3 or below for their reviews indicate that more than 15% of online buyers had problems with the products or services.
The dissatisfied people, whose ratings are 3 or below, for almost all products counted for about 8%, except medical pillows (10%). This ratio shows the consistency with the samples selected. However, the selected review samples comprise recent data collected after the COVID-19 pandemic (2019–2022). Furthermore, although the satisfaction level with antiperspirants in entire reviews has the highest value, in the sample reviews, this level showed under-average ratings. This might be because the sample size is enormous compared with the others, which affects the results.
What important is that the overall product ratings do not exactly reflect the quality of products because the customers underrated them; although the quality of the products was acceptable or high, their interaction with the retailer was poor. They underrated the products when receiving below-standard service from retailers compared with what was experienced by others, such as receiving a gift. Consequently, when potential shoppers want to try products they have never used before, they might hesitate and give up purchasing them or, most likely, ignore the products without reading comments by just looking at their overall rating score because they might easily switch to others that have high scores on the screen. Moreover, this might pose a danger to new manufacturers because it unknowingly decreases the value of a brand.
The perceived quality parameters of OS and their sub-variables are listed separately in Figure 10. The most causes of customer dissatisfaction were lack of possibility to change unsatisfactory products, pay-back problems, information conformity, package suitableness, and side-effect factors.
Though all quality parameters were rated under the sample’s average rating, the product’s performance was the factor that dissatisfied online shoppers the least.
During the COVID-19 pandemic and after that period, most people did not encounter the non-delivery of their ordered products much. The comments were mainly associated with the possibility of changing products among the samples’ reviews. Online shoppers could not swap their product for another one, or they experienced difficulties with the swapped products. This result might be reasonable because, during the pandemic, mass orders would negatively affect retailers and shipping agents. The period was challenging and time demanding for shippers. As can be imagined, shippers’ schedules would be complex, unpredictable, and unexpectedly intensive due to high numbers of orders and insufficient numbers of vehicles and couriers.

5.2. MCDM Results

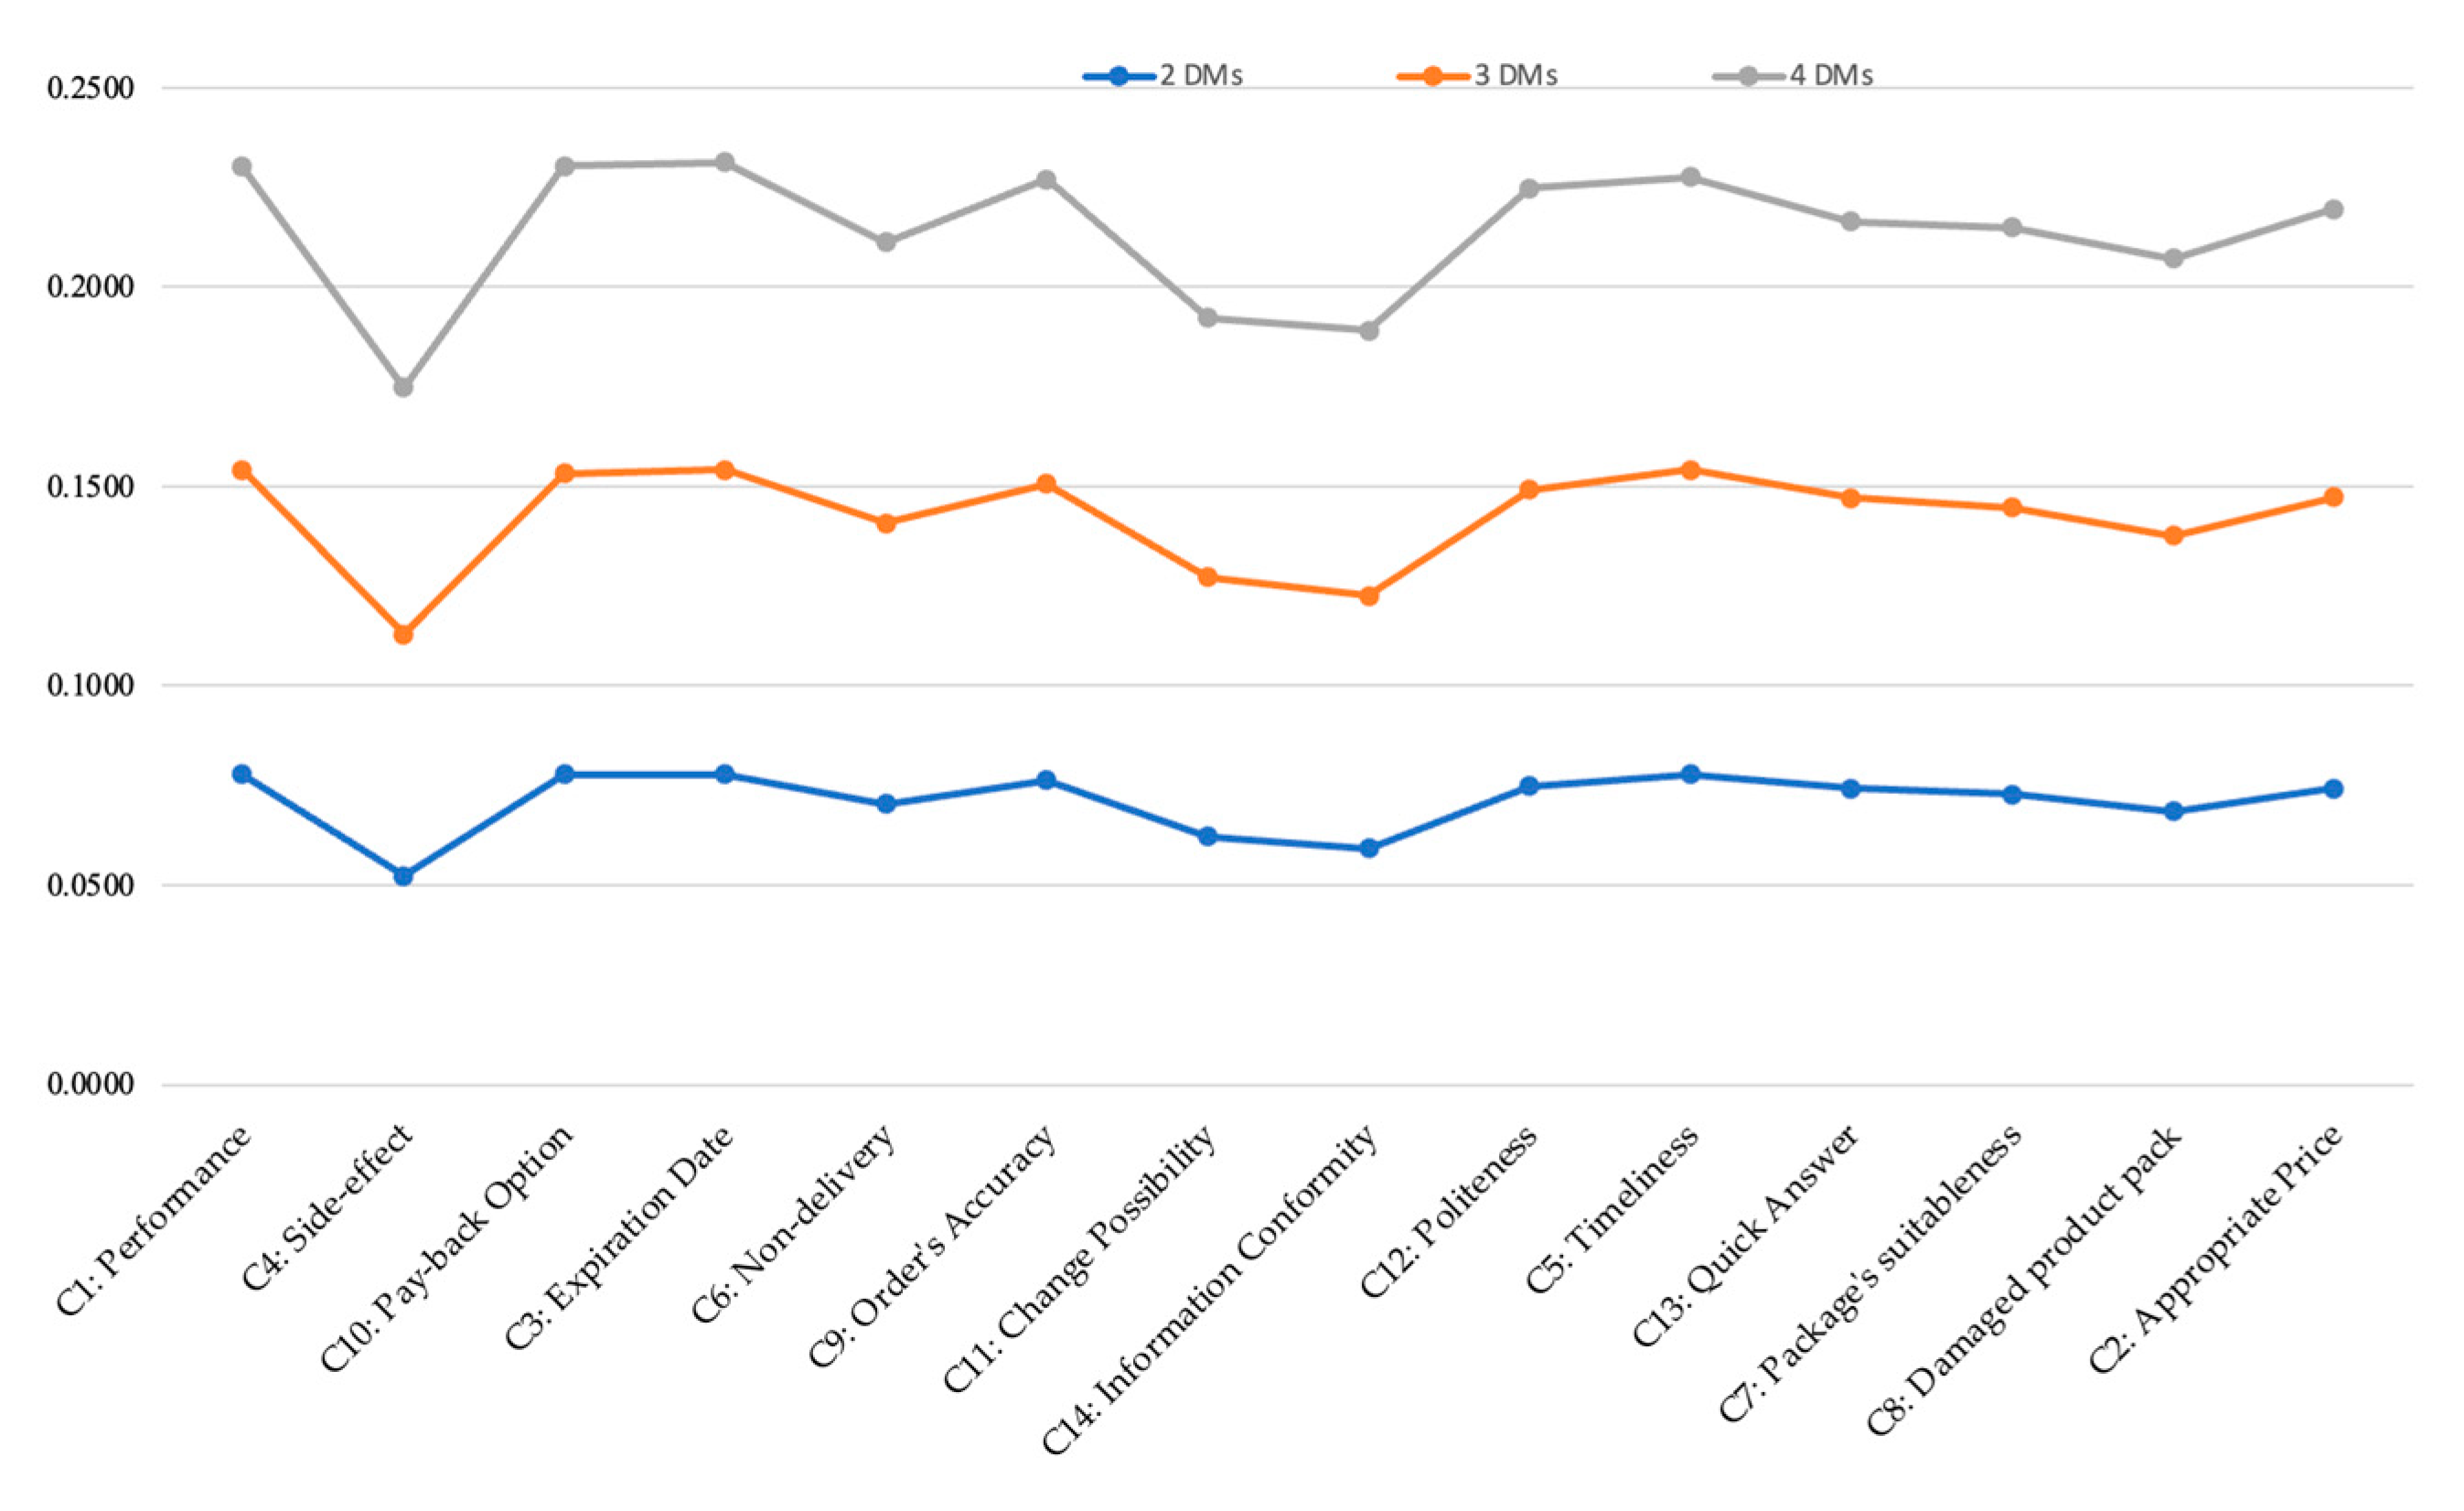
5.2.1. Criteria Weights

Decision makers verbally evaluated the importance levels of the relevant quality criteria with a nine-scale tool while purchasing products in the health category (AH: the highest importance, AL: the lowest importance). The decision makers’ assessment for each quality criterion was based on the triangular fuzzy scale (Table 2). The linguistic assessment of each decision maker is shown in Table 6.
The given criteria are of several sorts. The criteria side effect, expiration date, non-delivery, and damaged products are the cost-type criteria (a smaller value is much more desirable). In contrast, the remaining criteria are benefit-type criteria whose higher value is much more anticipated. Then, the steps explained in the prior section were applied to gain the criteria weight vector.
The values of the qualitative criteria were aggregated using the Bonferroni aggregator, creating the first decision matrix by taking average specialist judgments. To enhance the standardized matrix, the initial decision matrix was normalized. The values of the weight coefficients criterion are determined in the section that follows. Due to limited space, the weight coefficients vector and aggregated fuzzy vector are combined and given in the Supplementary Materials (Table S1). The aggregated fuzzy weight coefficients and final weights of the quality criteria are listed in Table 7.
It can be seen from Table 7 that the magnitudes of the criteria are close to each other. However, compared with others, the price factor is the least important factor to the decision makers. The most important quality criteria are products’ side effects and performance, as well as the pay-back option provided by e-commerce marketplaces with the same weight (0.07630).
These scores were used in the FF-WASPAS method. The results of the FF-WASPAS method were discussed in the following sub-section.

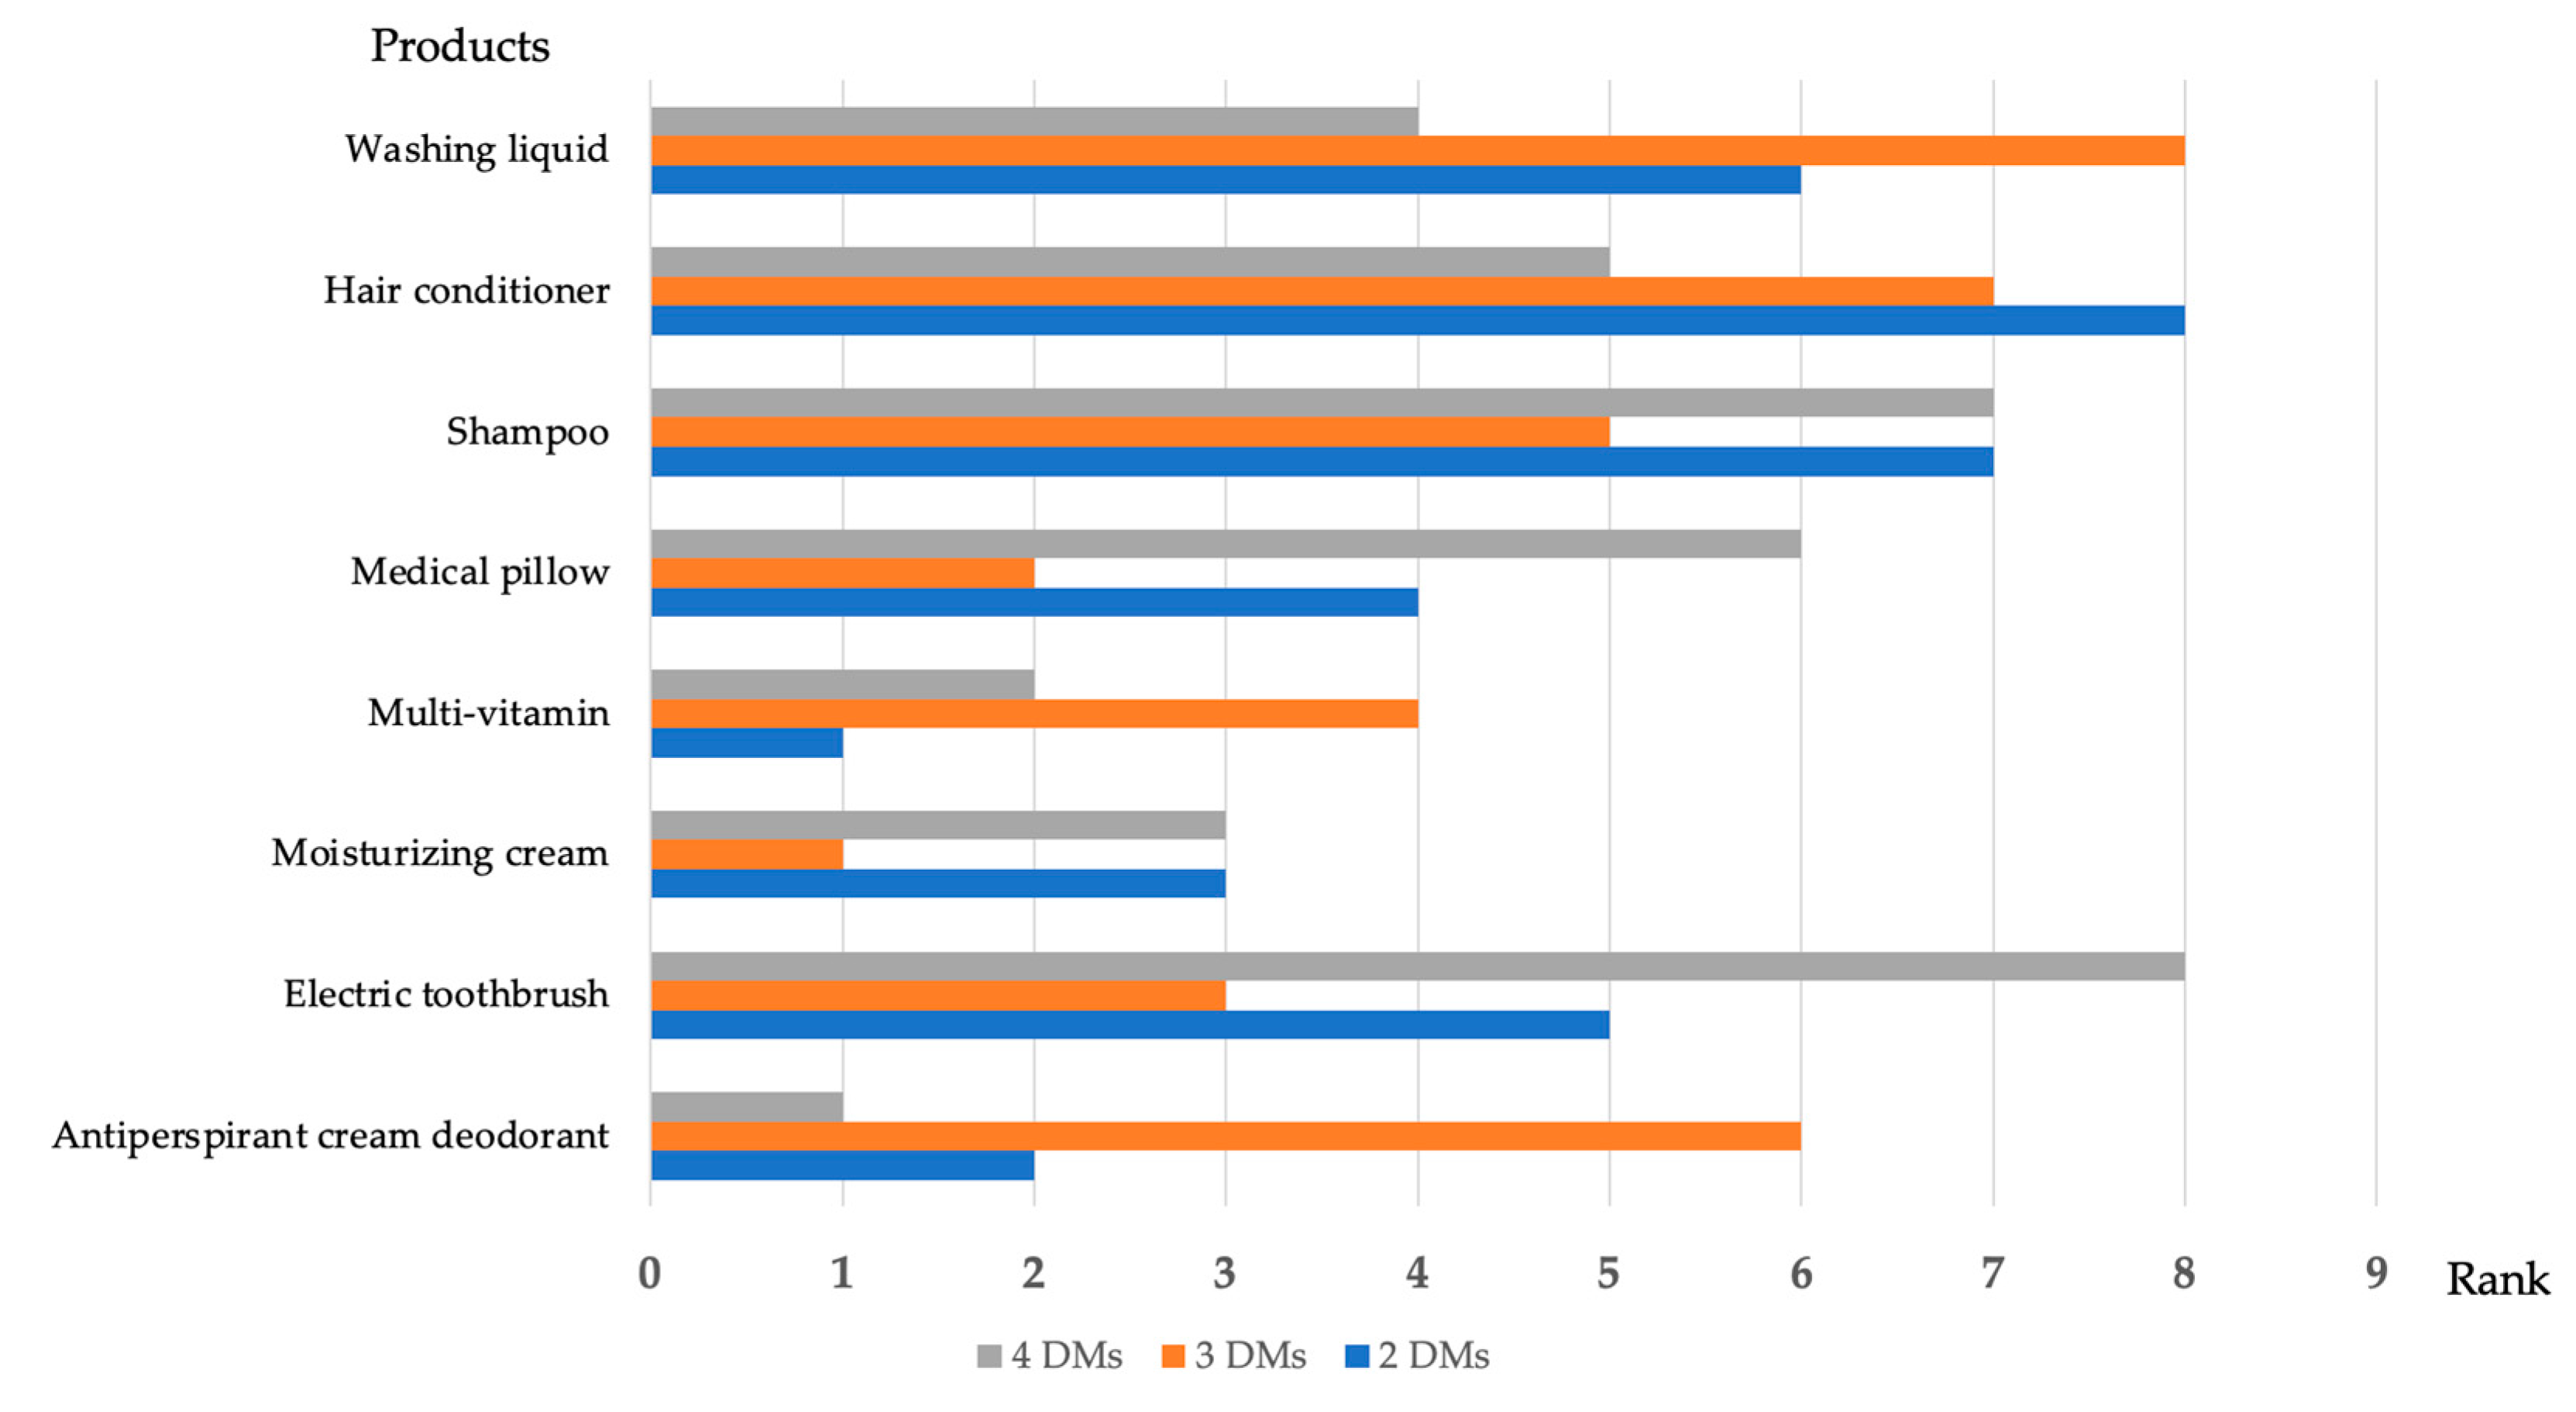
5.2.2. FF-WASPAS Results

The three decision makers who frequently perform OS assessed each product for each quality criterion based on the Fermatean fuzzy scale (see Table 3). The initial decision matrix was constructed based on the decision makers’ evaluation. Then, the matrix was aggregated. As the first necessitated a linear normalization of the decision matrix components and matrices used, the decision makers’ evaluations for each product (Table S2), as well as their initial (Table S3) and normalized matrices (Table S4), are given in Supplementary Materials due to scarcity.
The matrix was then weighted for WSM and WPM. The gained criteria weight was used in calculating the WSM and the WPM. In this investigation, the WASPAS measure of the alternatives was computed using δ = 0.5. The rank of the options was determined. Table 8 displays the outcomes of this stage, including the WSM, WPM, and FF-WASPAS measurements, scores, and final rankings.
Table 8 shows that shoppers chose moisturizing cream over washing liquid regarding the quality criteria when purchasing health products online. The second most important product in internet purchasing was high-quality medical pillows. Following that, the electric toothbrush, multi-vitamins, and shampoo were shoppers’ most preferred choices for online shopping. Antiperspirant cream deodorant and hair conditioner were placed last in terms of quality standards.
The rankings for unsatisfactory products, where consumers in the population (overall rating) rated them three or below, are compared with the MCDM ranking illustrated in Figure 11.
Figure 11 reveals that online shoppers in the population were primarily dissatisfied with the medical pillow they purchased, since the customers’ percentage (14%) of this product was higher than the other products. Secondly, moisturizing cream and shampoo caused negative comments. Washing liquid seemed to be the least-complained-about product among online shoppers, which complies with the MCDM results. According to the FF-WASPAS method, the electric toothbrush was ranked as the third most important product for online customers. The percentage of dissatisfied people was lower than the buyers of multi-vitamin, antiperspirant cream deodorant, and hair conditioner. The reason is that the repurchasing frequency of electric toothbrushes was lower than these daily consumed products. The quality parameters and their relevance and importance are displayed in Table 9.
According to Table 9, almost all quality parameters have similar importance except for the reasonable price of products. However, there are slight differences between them.
The F-LMAW results showed that the essential quality parameter was performance, a side effect of products, followed by the pay-back option of the e-commerce platform. At the same time, the least significant factor was the fair price of products. The non-delivery and accuracy of orders were of the same importance for online shoppers. Moreover, the politeness of representatives toward customers ranks before the timeliness of products ordered. Along with quick answers, politeness becomes a priority in comparing suitable and damaged packages of products.
From Table 9, it can be comprehended that customers experienced mostly change and pay-back problems, which are essential issues to consumers after receiving the products. Table 9 clearly shows that the result of the sentiment analysis complies with the F-LMAW. For example, the performance of the purchased products, as the most crucial factor, was at least a customer dissatisfaction parameter since its average sample rating was higher than the other parameters. Similarly, sentiment analysis shows that during COVID-19, online shoppers experienced problems with the timeliness and non-delivery of their orders. Online shoppers experienced a side effect of the products, which probably caused their compliance after using them. However, complaining about the expiration date of health products came after the side effect of products when looking at average ratings. What is outstanding is that online shoppers give more importance to the information conformity of products on the website than the damaged product pack.
All propositions in the study accepted that the quality criteria influence online shopping.
Moreover, considering the sample CRs, the customers faced the most problems with changing products and getting money back during and after the COVID-19 pandemic. Since these parameters are significant to customers, they needed to share their experiences on websites by commenting. The affordable prices of products probably only caused commenting and underrating only when the products’ quality was low, as expressed in their reviews.

6. Sensitivity Analysis

In this section, the findings acquired by the F-LMAW and FF-WASPAS methods were tested. The sensitivity analysis was performed by altering the number of decision makers in the F-LMAW and FF-WASPAS models.
This part compares the findings of implementing the F-LMAW and FF-WASPAS methodology to the strategies often employed in multi-criteria decision making. Since experts’ assessments are subjective, the results might change for the experts. Hence, the methods were applied to different numbers of decision makers, including examples with two, three, or four. The results of both methods were compared with the three strategies.
For the assessment of each quality characteristic by two DMs, three DMs, and four DMs, the F-LMAW results are demonstrated in Figure 12.
According to the F-LMAW method, the quality criteria values showed a similar pattern. That is, the criteria prioritization did not change when the number of DMs was changed. Product performance in three scenarios ranked first, while fair price remained behind all quality criteria. The other quality factors behave analogously. This result implies the robustness and reliability of the F-LMAW method.
Although the performance of products was prioritized as the most important quality criterion while buying products, it is considerable that products’ short expiry date, adverse effect, or joint effect might deteriorate or reduce the effectiveness of the products due to their short time usage.
The FF-WASPAS method, however, produced different results. The positive score function values and ranks for each product according to three scenarios are demonstrated in Table 10.
Since it is demanding to notice the distinctions between the three scenarios from Table 10, the products’ rankings for the three scenarios are illustrated in Figure 13.
According to the FF-WASPAS results, the rank order of products varies when the number of experts changes. The FF-WASPAS results indicate that antiperspirant cream deodorant ranks in the first order, whereas electric toothbrushes sequenced last. The importance of multi-vitamins came before moisturizing cream, which was ranked first in the scenario of three decision makers. In the first scenario, where two experts evaluated the criteria and products, the multi-vitamins were prioritized first, while the hair conditioner came last. The results of the FF-WASPAS method diverge when the number of experts changes.

7. Conclusions

This study analyzed online customers’ reviews of health products, wellness products, personal care products, and household cleaners. The quality parameters of online shopping were identified via manual sentiment analysis on every hundred product reviews. With the help of MCDM methods, the importance of quality parameters was retained. The products mentioned above were ranked according to the quality parameters. The results revealed that moisturizing cream is the most critical health product for customers, whereas washing liquid is the least critical when they purchase online. Quality medical pillows came as the second most essential product in online shopping. Following that, the next most important items are the electric toothbrush, multi-vitamin, and shampoo. Antiperspirant cream deodorant and hair conditioner were ranked behind them according to the quality parameters.
No matter what online customers buy, the performance of products was found to be the essential quality factor for them. When it concerns health, the side effects and expiration date of the products they purchased are the most probable trigger for customers’ complaints. Though the timely arrival of purchased products is vital for them, their non-delivery might be negatively reflected in their comments.
This study found that the quality of the shipment was the least important factor compared with the aftersales service of firms. Although product quality was essential to the customers, they wanted to ensure the quality of the aftersales service of online shopping platforms. Even if they received damaged products, they might accept them when satisfied with the aftersales service. The attitude of companies, including whether they provide prompt answers, the politeness of their representatives, and whether they have truthful product explanations on their websites, might alter customers’ behavior when firms compensate for the problems customers experience during and after online shopping.
Even if some customers overlook the expiration date of products, when they encounter a side effect after using them, they can easily start blaming the firms. The manufacturer who produced and sold their goods to third parties might be impacted negatively when their products are commented upon negatively online, since the negative comments of experienced customers cause potential buyers to become reluctant to make a purchase.
Another study finding is that even though fair prices came behind other criteria for online shoppers, shoppers might hesitate to procure any health commodities—even if the price is low—when e-C platforms do not offer change or pay-back possibilities on websites. This result demonstrates that online shoppers want to rely upon the e-C platform.
With the sensitivity analysis, the study confirmed the stability of the fuzzy LMAW on criteria prioritizing by changing the number of decision makers. On the other hand, the FF-WASPAS method resulted in different outcomes when experts changed. Since experts’ evaluations are subjective and perceived quality is related to the expectation of people, the distinction in the outcomes of the FF-WASPAS method does not mean that this method is unreliable. Still, personal preferences and expectations from a product or service might change from person to person.
This study differs from others in that it uses sentiment analysis and MCDM. Furthermore, because manual sentiment analysis collects emotions and words in a cultural context, this study varies from computer sentiment analysis in detecting the perceived quality characteristics associated with complaints in reviews. Additionally, this study introduces a new hybrid MCDM method with fuzzy LMAW and Fermatean fuzzy WASPAS to the MCDM literature.
Specifically, COVID-19 affected many companies so negatively that they are now faced with closing their physical stores because of decreased customer demands. As a result, in addition to these challenging situations, COVID-19 brought out an opportunity for companies to sell their products online. However, competing in an online market is more challenging because of the wider variety of brands and product types available. Even though customers tend to shop online more after COVID-19, the fact that there are still so many complaints from customers due to a lack of product and afterservice quality, despite promotions on prices, implies that the sellers sell products or services with insufficient quality but fair prices according to consumer perception. Those sellers will only survive a short time when evaluated in terms of sustainable market competition. Thus, in this environment of intense competition, sellers need to re-evaluate their products and service quality to survive.
This study helps to improve the service quality of e-market platforms because the manager can easily recognize and classify which problems cause dissatisfied customers, and if the courier, seller, or product causes the issue.
The usage and disposal of the product are crucial components of post-purchase action that e-commerce companies should track. Product consumption rate is a significant determinant of sales frequency: the faster purchasers consume a product, the sooner they may be in the market to repurchase it [139]. Indirectly, the products’ manufacturers will be negatively affected by sales on e-commerce retailers due to negative WOM online.
Since the control initiative stands by the e-commerce marketplace, if they do not take action to prevent greenwashing among sellers and not compensate for the problems that customers experience in a polite and timely manner, customers might lose their trust in websites. Monitoring the satisfaction of customers with the products that they buy can help assess the service quality of sellers. As such, appropriate measures might be taken against the potential root causes of buyer dissatisfaction. The standardization, strict rules, and possible penalties of using virtual environments might discourage and prevent those companies from causing further customer dissatisfaction.
On the other hand, merchants must monitor whether their products are still kept in the appropriate warehouse conditions. They can benefit from new technologies such as radio frequency identification (RFID) to track the relevant information.
Organizations must set acceptable and practical criteria for choosing appropriate suppliers or corporate partners. Most importantly, they should provide a high-quality aftersales service. If customers face problems during or after online shopping, the firms must compensate for their needs in an appropriately communicative way.

Limitations and Future Directions

This study covers the quality of health products and customer service. Customer reviews might have other tangible criteria apart from what this study analyzed. For example, personality might also impact reviews. Some people are sensitive to health products, while others ignore products’ ingredients or expiration dates. Some other people are punctual and planned and give more importance to the delivery time of products. Consequently, different people react to the various characteristics of products. Hence, the framework can be extended by incorporating personality into the model.
In this study, the interactions between criteria were not considered. Some quality parameters might influence others. For example, customers might perceive the products’ performance as poor due to their side effects, and the product’s passed expiration date might cause an undesired smell, physical changes, or the ineffectiveness of products. Hence, a subsequent study might analyze the effects of parameters on the others by using either the DEMATEL method in the MCDM, or other methods that examine the interaction effects between criteria, such as the design of experiment (DOE), which can be used and compared to see the results.
Three separate interpretative structural modeling (ISM), matrice d’impacts croisés multiplication appliquée á un classement (MICMAC), and interpretive ranking procedure (IRP) approaches were used by [148] to study the existence, type, and effect of lean implementation hurdles. Based on their methodology, customer reviews can be analyzed for future work. For example, a future study could investigate the complaints made by customers, their linkages, and their effects on other quality criteria using ISM. The quality criteria can be identified as the most critical categorization of complaints into independent, dependent, autonomous, and linked categories utilizing MICMAC analysis. The IRP can be applied to rating the importance of quality criteria.
The study was limited to ranking only eight products in the health category. The critical factor of products themselves to the quality criteria might change when different products are added to the model.
On the other hand, the quality parameters in each product are detected by different persons. The scoring criteria in the sentiment analysis might be subjective and vary while grasping customers’ exact emotions and feelings in the comments. Hence, the sentiment analysis must be performed by the same persons to make it consistent. Furthermore, the review samples were small and might not be generalized to the whole population. Therefore, it is necessary to take more samples and reanalyze the results to detect whether the comments have any additional factors; however, this is costly and time consuming.
A future study might investigate the reviews about whether there is a difference between the periods of pre-and post-COVID-19 in terms of online reviews and complaints.
Moreover, one of the most pressing issues is the ease of access to the official responsible employee [63]. For the efficiency of post-service quality, the service quality of communication personnel can be analyzed using SERVQUAL or other models. The workers’ loads due to huge calls can be balanced and scheduled using optimization techniques to optimize service time and quick responses.
Future studies could automatically incorporate the quality parameters of this study into their sentiment analysis with an appropriate machine learning algorithm. Other MCDM methods can be applied by prioritizing the different products to the quality parameters, or similar products can be compared in the proposed framework with different MCDM methods.
The proposed model framework was analyzed using the MCDM methods. However, the construction of parameters was not validated statistically. Hence, this framework construction might be validated in coming studies using a structural equation model (SEM) or confirmatory factor analysis (CFA). This framework can be extended, adopted, and examined in management and social science studies.

Supplementary Materials

The following are available online at https://www.mdpi.com/article/10.3390/su15043428/s1, Table S1. Criteria weight coefficients and aggregated fuzzy vectors from the result of LMAW. Table S2. Decision Makers’ products- evaluation for each criterion. Table S3: FF-WASPAS Initial Decision Matrix. Table S4. FF-WASPAS Normalized Matrix. Figure S1. Example of sentiment analysis (original). Figure S2. Example of sentiment analysis (translated).

Funding

This research received no external funding.

Institutional Review Board Statement

Not applicable.

Informed Consent Statement

Not applicable.

Data Availability Statement

Data are available on request due to restrictions.

Conflicts of Interest

The author declares no conflict of interest.

References

  1. Chevalier, S. Retail E-Commerce Sales Worldwide from 2014 to 2026. Available online: https://www.statista.com/statistics/379046/worldwide-retail-e-commerce-sales/ (accessed on 7 January 2023).
  2. Bernhardt, G. Global Ecommerce Sales Growth Report for 2021–2026. Available online: https://www.shopify.com/blog/global-ecommerce-sales (accessed on 7 January 2023).
  3. The Business Research Company Global Healthcare E-Commerce Market. Available online: https://www.thebusinessresearchcompany.com/report/healthcare-ecommerce-global-market-report (accessed on 7 January 2023).
  4. Roberts, R. Health and Wellness Marketing: An Ecommerce Report on the Health and Wellness Industry, Consumer Trends & Strategies for Growth. Available online: https://commonthreadco.com/blogs/coachs-corner/health-wellness-ecommerce-marketing-industry-trends (accessed on 7 January 2023).
  5. OECD. Inflation Edges up to 10.7% in October; OECD: Paris, France, 2022. [Google Scholar]
  6. Ecommerce DB The ECommerce Market in Turkey. Available online: https://ecommercedb.com/markets/tr/all (accessed on 7 January 2023).
  7. Pasquali, M. Shopping Cart Abandonment Rate Worldwide 2022, by Industry. Available online: https://www.statista.com/statistics/457078/category-cart-abandonment-rate-worldwide/ (accessed on 7 January 2023).
  8. IRP Ecommerce Market Data and Ecommerce Benchmarks for the Health and Wellbeing Market. Available online: https://www.irpcommerce.com/en/gb/ecommercemarketdata.aspx?Market=2 (accessed on 31 January 2023).
  9. Rita, P.; Oliveira, T.; Farisa, A. The Impact of E-Service Quality and Customer Satisfaction on Customer Behavior in Online Shopping. Heliyon 2019, 5, e02690. [Google Scholar] [CrossRef] [PubMed]
  10. WEF. The Global Governance of Online Consumer Protection and E-Commerce Building Trust; WEF: Colony, Switzerland, 2019. [Google Scholar]
  11. Sabou, S.; Avram-Pop, B.; Zima, L.A. The Impact of the Problems Faced by Online Customers on Ecommerce. Stud. Univ. Babes-Bolyai Oeconomica 2017, 62, 77–88. [Google Scholar] [CrossRef]
  12. Fedorko, R.; Kráľ, Š. Online Shopping Problems in the Context of B2C E-Commerce in the Visegrad Four Countries. In Springer Proceedings in Business and Economics; Martínez-López, F.J., López López, D., Eds.; Springer: Cham, Switzerland, 2021; pp. 83–94. [Google Scholar] [CrossRef]
  13. Brandtner, P.; Darbanian, F.; Falatouri, T.; Udokwu, C. Impact of COVID-19 on the Customer End of Retail Supply Chains: A Big Data Analysis of Consumer Satisfaction. Sustainability 2021, 13, 1464. [Google Scholar] [CrossRef]
  14. Fihartini, Y.; Helmi, A.; Hassan, M.; Oesman, Y.M. Perceived Health Risk, Online Retail Ethics, and Consumer Behavior within Online Shopping during the Covid-19 Pandemic. Innov. Mark. 2021, 17, 17–29. [Google Scholar] [CrossRef]
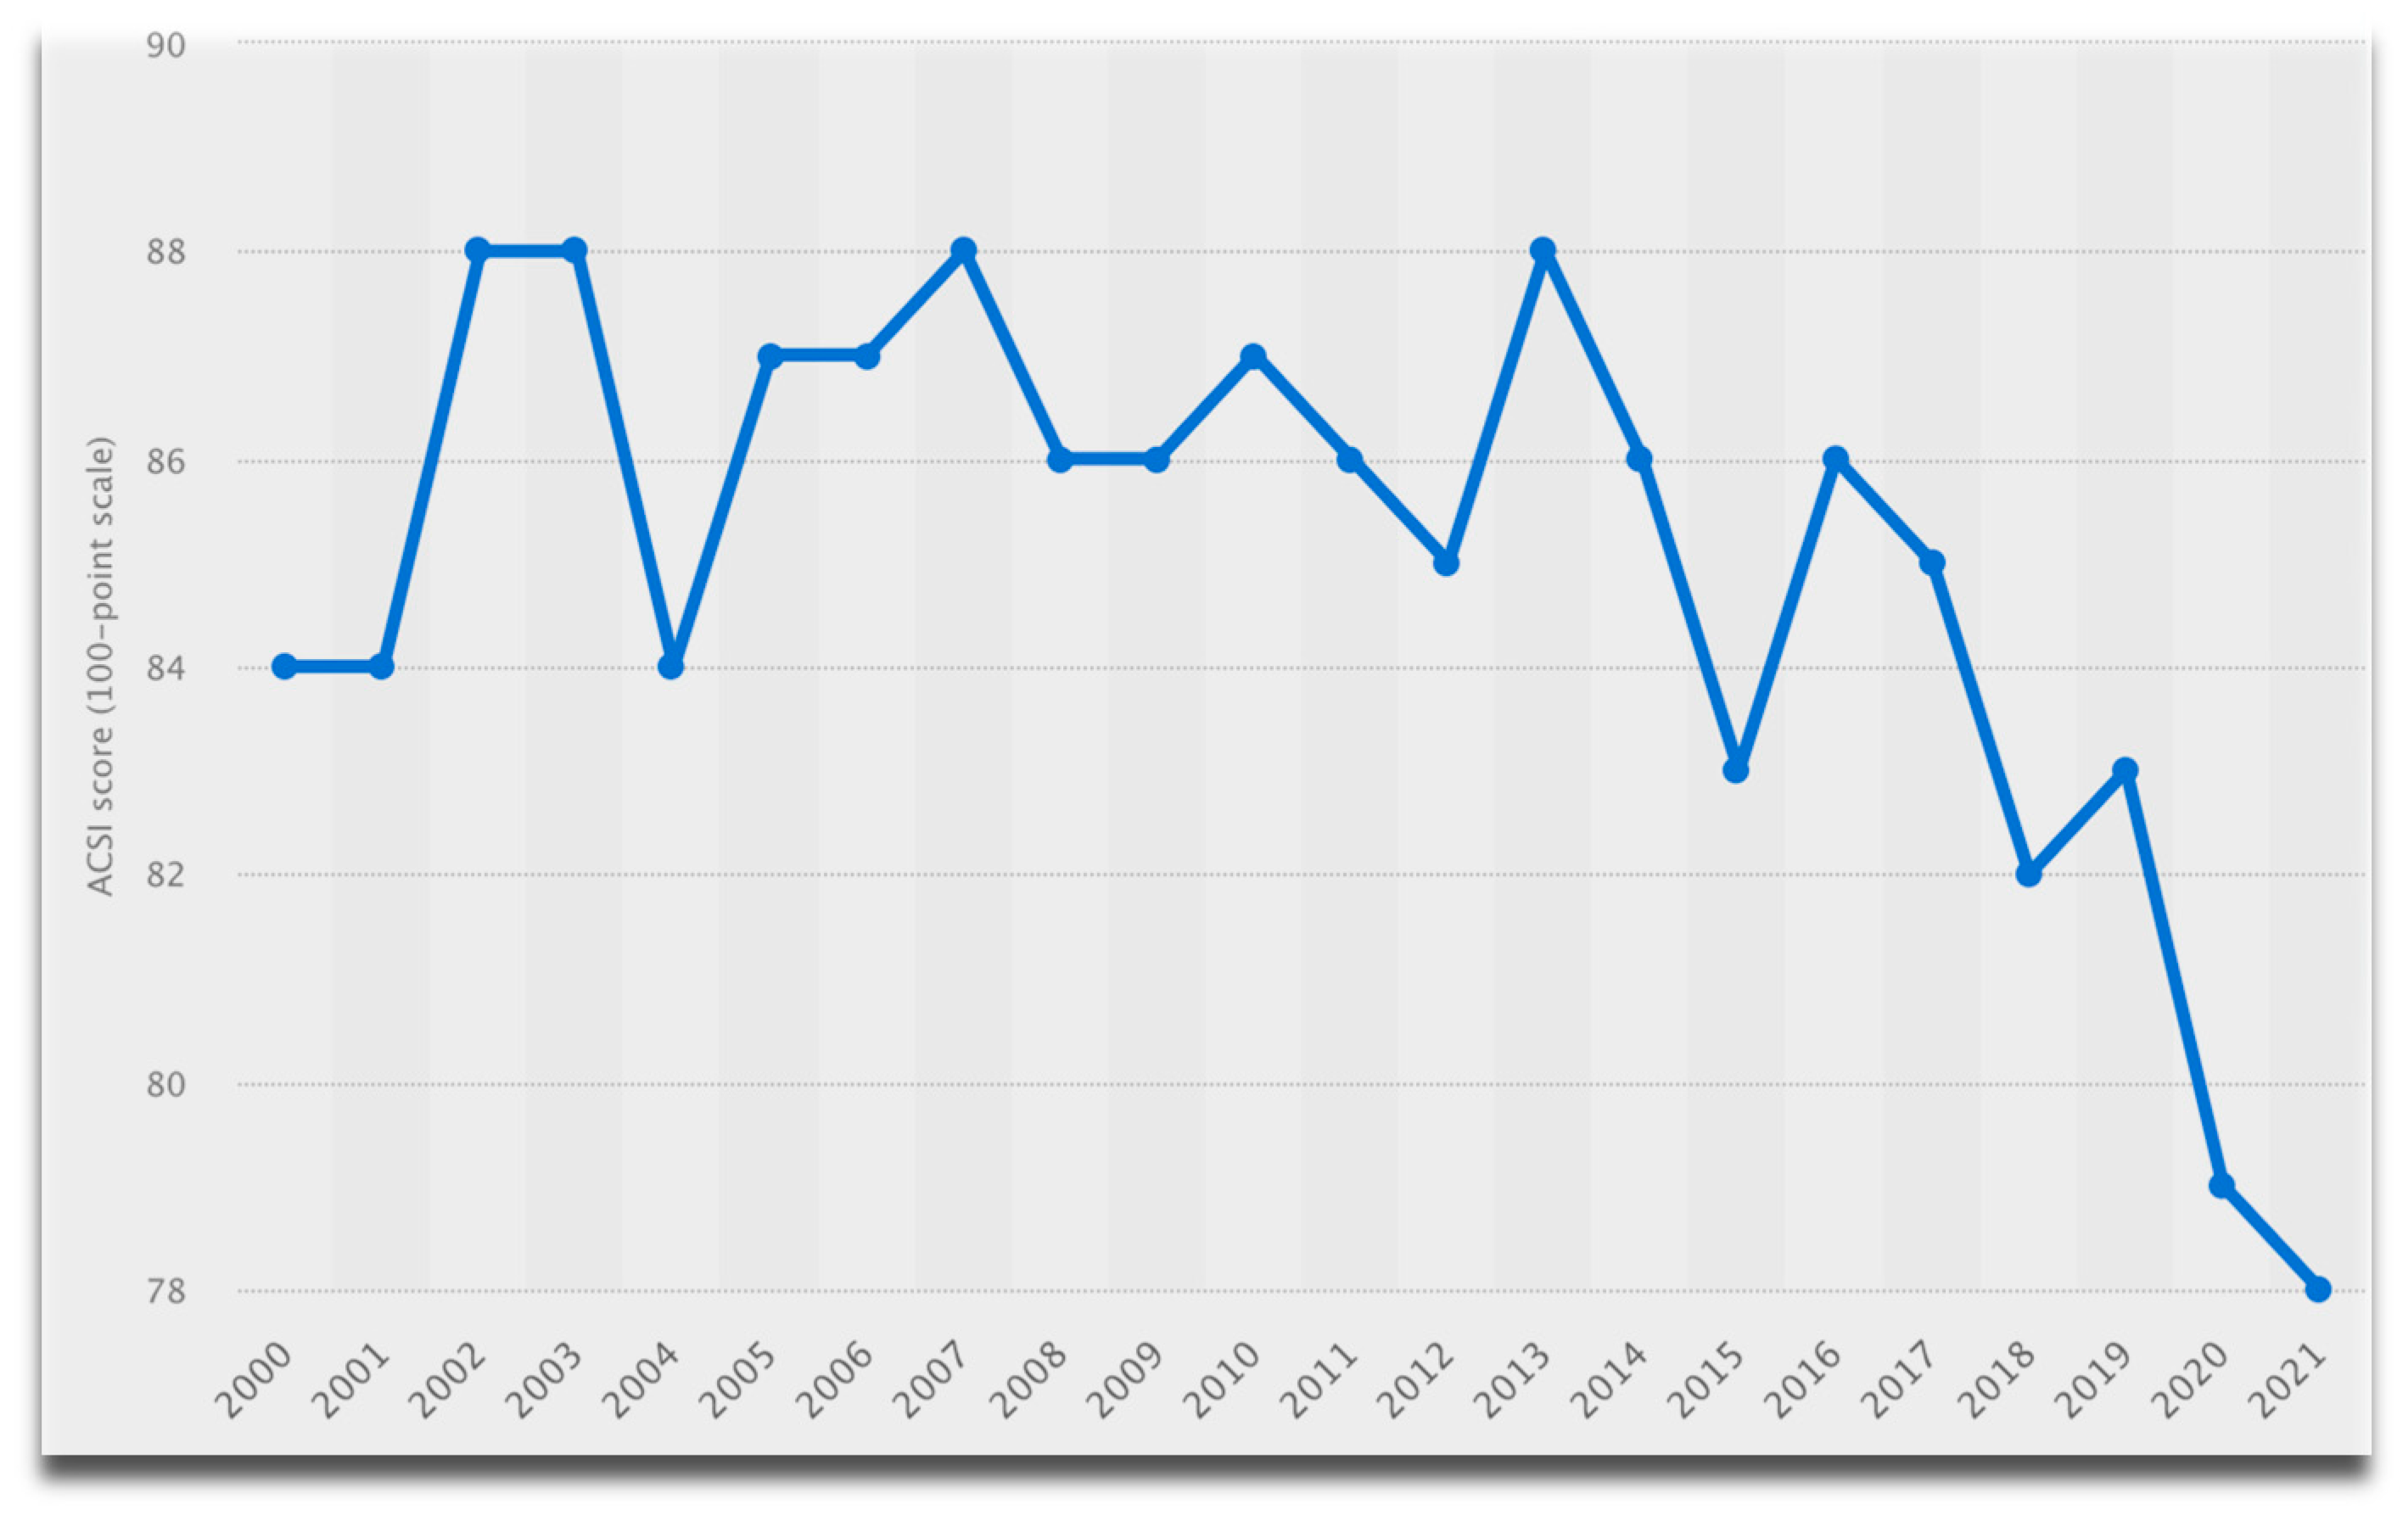
  15. Coppola, D. ACSI—U.S. Customer Satisfaction with Amazon.Com as of 2021. Available online: https://www.statista.com/statistics/185788/us-customer-satisfaction-with-amazon/ (accessed on 7 January 2023).
  16. Charm, T.; Dhar, R.; Haas, S.; Liu, J.; Novemsky, N.; Teichner, W. Understanding and Shaping Consumer Behavior in the next Normal. Available online: https://www.mckinsey.com/capabilities/growth-marketing-and-sales/our-insights/understanding-and-shaping-consumer-behavior-in-the-next-normal (accessed on 7 January 2023).
  17. Ma, H. Competitive Advantage and Firm Performance. Compet. Rev. 2000, 10, 15–32. [Google Scholar] [CrossRef]
  18. Huang, K.F.; Dyerson, R.; Wu, L.Y.; Harindranath, G. From Temporary Competitive Advantage to Sustainable Competitive Advantage. Br. J. Manag. 2015, 26, 617–636. [Google Scholar] [CrossRef]
  19. Uzir, M.U.H.; al Halbusi, H.; Thurasamy, R.; Thiam Hock, R.L.; Aljaberi, M.A.; Hasan, N.; Hamid, M. The Effects of Service Quality, Perceived Value and Trust in Home Delivery Service Personnel on Customer Satisfaction: Evidence from a Developing Country. J. Retail. Consum. Serv. 2021, 63, 102721. [Google Scholar] [CrossRef]
  20. Sundaram, V.; Ramkumar, D.; Shankar, P. Impact of E-Service Quality on Customer Satisfaction and Loyalty Empirical Study in India Online Business. KINERJA 2017, 21, 48–69. [Google Scholar] [CrossRef]
  21. Senecal, S.; Nantel, J. The Influence of Online Product Recommendations on Consumers’ Online Choices. J. Retail. 2004, 80, 159–169. [Google Scholar] [CrossRef]
  22. Robson, K.; Farshid, M.; Bredican, J.; Humphrey, S. Making Sense of Online Consumer Reviews: A Methodology. Int. J. Mark. Res. 2013, 55, 6. [Google Scholar] [CrossRef]
  23. Cui, G.; Lui, H.K.; Guo, X. The Effect of Online Consumer Reviews on New Product Sales. Int. J. Electron. Commer. 2012, 17, 39–58. [Google Scholar] [CrossRef]
  24. Singh, J.; Crisafulli, B. Managing Online Service Recovery: Procedures, Justice and Customer Satisfaction. J. Serv. Theory Pract. 2016, 26, 764–787. [Google Scholar] [CrossRef]
  25. Wang, W.; Li, F.; Yi, Z. Scores vs. Stars: A Regression Discontinuity Study of Online Consumer Reviews. Inf. Manag. 2019, 56, 418–428. [Google Scholar] [CrossRef]
  26. Truong, D.; Truong, M.D. How Do Customers Change Their Purchasing Behaviors during the COVID-19 Pandemic? J. Retail. Consum. Serv. 2022, 67, 102963. [Google Scholar] [CrossRef]
  27. Cao, Y.; Ajjan, H.; Hong, P. Post-Purchase Shipping and Customer Service Experiences in Online Shopping and Their Impact on Customer Satisfaction: An Empirical Study with Comparison. Asia Pac. J. Mark. Logist. 2018, 30, 400–416. [Google Scholar] [CrossRef]
  28. Chatterjee, S.; Goyal, D.; Prakash, A.; Sharma, J. Exploring Healthcare/Health-Product Ecommerce Satisfaction: A Text Mining and Machine Learning Application. J. Bus. Res. 2021, 131, 815–825. [Google Scholar] [CrossRef]
  29. Lackermair, G.; Kailer, D.; Kanmaz, K. Importance of Online Product Reviews from a Consumer’s Perspective. Adv. Econ. Bus. 2013, 1, 1–5. [Google Scholar] [CrossRef]
  30. Medhat, W.; Hassan, A.; Korashy, H. Sentiment Analysis Algorithms and Applications: A Survey. Ain. Shams Eng. J. 2014, 5, 1093–1113. [Google Scholar] [CrossRef]
  31. Ganu, G.; Am, A.; Marian, A. Beyond the Stars: Improving Rating Predictions Using Review Text Content. In Proceedings of the Twelfth International Workshop on the Web and Databases (WebDB 2009), Providence, RI, USA, June 2009; pp. 1–6. Available online: http://www.dbmi.columbia.edu/noemie/ursa/ (accessed on 8 February 2023).
  32. Hussein, D.M.E.D.M. A Survey on Sentiment Analysis Challenges. J. King Saud Univ. Eng. Sci. 2018, 30, 330–338. [Google Scholar] [CrossRef]
  33. Ramachandran, R.; Sudhir, S.; Unnithan, A.B. Exploring the Relationship between Emotionality and Product Star Ratings in Online Reviews. IIMB Manag. Rev. 2021, 33, 299–308. [Google Scholar] [CrossRef]
  34. de Langhe, B.; Fernbach, P.M.; Lichtenstein, D.R. Navigating by the Stars: Investigating the Actual and Perceived Validity of Online User Ratings. J. Consum. Res. 2016, 42, 817–833. [Google Scholar] [CrossRef]
  35. Zadeh, L.A. The Concept of a Linguistic Variable and Its Application to Approxirqate Reasoning-III*. Inf. Sci. 1975, 9, 43. [Google Scholar] [CrossRef]
  36. Tseng, M.L. Using Hybrid MCDM to Evaluate the Service Quality Expectation in Linguistic Preference. Appl. Soft Comput. J. 2011, 11, 4551–4562. [Google Scholar] [CrossRef]
  37. Javalgi, R.G.; Radulovich, L.P.; Pendleton, G.; Scherer, R.F. Sustainable Competitive Advantage of Internet Firms: A Strategic Framework and Implications for Global Marketers. Int. Mark. Rev. 2005, 22, 658–672. [Google Scholar] [CrossRef]
  38. Kotler, P.; Armstrong, G.; Gary, M. Principles of Marketing; University of Minnesota Libraries Publishing: Minneapolis, MN, USA; ISBN 9780133795028.
  39. Rajgopal, S.; Venkatachalam, M.; Kotha, S. Does the Quality of Online Customer Experience Create a Sustainable Competitive Advantage for E-Commerce Firms? 2001. Available online: https://citeseerx.ist.psu.edu/document?repid=rep1&type=pdf&doi=c7951ef4b85a785bc233aa37d022e41afc8a770a/ (accessed on 8 February 2023).
  40. Tsao, W.C. Which Type of Online Review Is More Persuasive? The Influence of Consumer Reviews and Critic Ratings on Moviegoers. Electron. Commer. Res. 2014, 14, 559–583. [Google Scholar] [CrossRef]
  41. Kumar, R.; Sharan, A. Hybrid Multi-Criteria Decision Making Approach for Product Ranking Using Customers Reviews. J. Data Process. 2018, 8, 1–17. [Google Scholar]
  42. Eshkevari, M.; Jahangoshai Rezaee, M.; Saberi, M.; Hussain, O.K. An End-to-End Ranking System Based on Customers Reviews: Integrating Semantic Mining and MCDM Techniques. Expert Syst Appl 2022, 209, 118294. [Google Scholar] [CrossRef]
  43. Sun, H.; Ni, W.; Wang, Z. A Consumption System Model Integrating Quality, Satisfaction and Behavioral Intentions in Online Shopping. Inf. Technol. Manag. 2016, 17, 165–177. [Google Scholar] [CrossRef]
  44. Ling, K.C.; Chai, L.T.; Piew, T.H. The Effects of Shopping Orientations, Online Trust and Prior Online Purchase Experience toward Customers’ Online Purchase Intention. Int. Bus. Res. 2010, 3, 63. [Google Scholar] [CrossRef]
  45. Pappas, I.O.; Pateli, A.G.; Giannakos, M.N.; Chrissikopoulos, V. Moderating Effects of Online Shopping Experience on Customer Satisfaction and Repurchase Intentions. Int. J. Retail Distrib. Manag. 2014, 42, 187–204. [Google Scholar] [CrossRef]
  46. Mohd Shoki Md, A.; Michele, S.; Norhayati, Z.; Khalid, I.; Kamarudin Mat, A. Consumer Perceived Risk, Attitude and Online Shopping Behaviour; Empirical Evidence from Malaysia. In Proceedings of the MOIME 2014, IOP Conference Series: Materials Science and Engineering 58. Jakarta, Indonesia, 29–31 March 2014; 31 March 2014. [Google Scholar]
  47. Lin, C.S.; Wu, S.; Tsai, R.J. Integrating Perceived Playfulness into Expectation-Confirmation Model for Web Portal Context. Inf. Manag. 2005, 42, 683–693. [Google Scholar] [CrossRef]
  48. Zamzuri, N.H.A.; Mohamed, N.; Hussein, R. Antecedents of Customer Satisfaction in Repurchase Intention in the Electronic Commerce Environment. In Proceedings of the International Symposium on Information Technology, Washington, DC, USA, 20–22 December 2008; Institute of Electrical and Electronics Engineers: Kuala Lumpur, Malaysia, 2008; pp. 1–5. [Google Scholar]
  49. Cimperman, M.; Makovec Brenčič, M.; Trkman, P. Analyzing Older Users’ Home Telehealth Services Acceptance Behavior-Applying an Extended UTAUT Model. Int. J. Med. Inf. 2016, 90, 22–31. [Google Scholar] [CrossRef]
  50. Mousa Jaradat, M.-I.R.; al Rababaa, M.S. Assessing Key Factor That Influence on the Acceptance of Mobile Commerce Based on Modified UTAUT. Int. J. Bus. Manag. 2013, 8, 102–112. [Google Scholar] [CrossRef]
  51. Ajzen, I. The Theory of Planned Behavior. Organ Behav. Hum. Decis. Process 1991, 50, 179–211. [Google Scholar] [CrossRef]
  52. Bandura, A. Health Promotion from the Perspective of Social Cognitive Theory. Psychol. Health 1988, 13, 623–649. [Google Scholar] [CrossRef]
  53. Venkatesh, V.; Morris, M.G.; Davis, G.B.; Davis, F.D. User Acceptance of Information Technology: Toward a Unified View. MIS Q. 2003, 27, 425–478. [Google Scholar] [CrossRef]
  54. Viswanath, V.; Fred, D.D. A Theoretical Extension of the Technology Acceptance Model: Four Longitudinal Field Studies. Manag. Sci. 2000, 46, 186. [Google Scholar]
  55. Gunawan Wibowo, Y. Impact of Price, Product Quality, and Promotion on Consumer Satisfaction in Cosmetics and Skincare. J. Econ. Financ. Manag. Stud. 2021, 4, 978–986. [Google Scholar] [CrossRef]
  56. Martinovic, M.; Domovic, J.; Piric, V. Perception of Health Products and Trends in Online Shopping and Promotion of Health Products in Croatia. Вісник Націoнальнoї Академії Керівних Кадрів Культури І Мистецтв 2018, 4, 422–428. [Google Scholar]
  57. Togubu, S.F.I.; Saerang, D.P.E.; Worang, F.G.; Hierarchy, A. Analytical Hierarchy Process in Choosing Men Facial Skin Care Products. A Study of Ponds, Garnier and Nivea. J. EMBA J. Ris. Ekon. Manaj. Bisnis Dan Akunt. 2018, 6, 120–191. [Google Scholar]
  58. Haseli, G.; Ranjbarzadeh, R.; Hajiaghaei-Keshteli, M.; Jafarzadeh Ghoushchi, S.; Hasani, A.; Deveci, M.; Ding, W. HECON: Weight Assessment of the Product Loyalty Criteria Considering the Customer Decision’s Halo Effect Using the Convolutional Neural Networks. Inf. Sci. 2023, 623, 184–205. [Google Scholar] [CrossRef]
  59. Hizza Bt Hila Ludin, I.; Liat Cheng, B. Factors Influencing Customer Satisfaction and E-Loyalty: Online Shopping Environment among the Young Adults. Manag. Dyn. Knowl. Econ. 2014, 2, 462–471. [Google Scholar]
  60. Lee, G.G.; Lin, H.F. Customer Perceptions of E-Service Quality in Online Shopping. Int. J. Retail. Distrib. Manag. 2005, 33, 161–176. [Google Scholar] [CrossRef]
  61. Kim, J.; Jin, B.; Swinney, J.L. The Role of Etail Quality, e-Satisfaction and e-Trust in Online Loyalty Development Process. J. Retail. Consum. Serv. 2009, 16, 239–247. [Google Scholar] [CrossRef]
  62. Guo, X.; Ling, K.C.; Liu, M. Evaluating Factors Influencing Consumer Satisfaction towards Online Shopping in China. Asian Soc. Sci. 2012, 8, 40–49. [Google Scholar] [CrossRef]
  63. Abu Jadayil, W.; Shakoor, M.; Bashir, A.; Selmi, H.; Qureshi, M.R.N.N. Using SERVIQUAL to Investigate the Quality of Provided Wireless Communication Services in UAE. Int. J. Qual. Serv. Sci. 2020, 12, 109–132. [Google Scholar] [CrossRef]
  64. Chiu, W.Y.; Tzeng, G.H.; Li, H.L. A New Hybrid MCDM Model Combining DANP with VIKOR to Improve E-Store Business. Knowl. Based Syst. 2013, 37, 48–61. [Google Scholar] [CrossRef]
  65. Grönroos, C. A Service Quality Model and Its Marketing Implications. Eur. J. Mark. 1984, 18, 36–44. [Google Scholar] [CrossRef]
  66. Parasuraman, A.; Zeithaml, V.A.; Berry, L.L. A Conceptual Model of Service Quality and Its Implications for Future Research. J. Mark. 1985, 49, 41–50. [Google Scholar] [CrossRef]
  67. Parasuraman, A.; Zeithaml, V.A.; Berry, L. SERVQUAL: A Multiple-Item Scale for Measuring Consumer Perceptions of Service Quality. J. Retail. 1988, 64, 12–40. [Google Scholar]
  68. Grönroos, C. Marketing Services: The Case of a Missing Product. J. Bus. Ind. Mark. 1998, 13, 322–338. [Google Scholar] [CrossRef]
  69. Cronin, J.J.; Taylor, S.A. Measuring Service Quality: A Reexamination and Extension. J. Mark. 1992, 56, 55–68. [Google Scholar] [CrossRef]
  70. Rust, R.T.; Oliver, R.L. Service Quality: New Directions in Theory and Practice; Sage Publications: Thousand Oaks, CA, USA, 1993. [Google Scholar]
  71. Dabholkar, P.A.; Thorpe, D.I.; Rentz, J.O. A Measure of Service Quality for Retail Stores: Scale Development and Validation. J Acad Mark Sci 1996, 24, 3–16. [Google Scholar] [CrossRef]
  72. Brady, M.K.; Cronin, J.J. Some New Thoughts on Conceptualizing Perceived Service Quality: A Hierarchical Approach. J. Mark 2001, 65, 34–49. [Google Scholar] [CrossRef]
  73. Dabholkar, P.A.; Shepherd, C.D.; Thorpe, D.I. A Comprehensive Framework for Service Quality: An Investigation of Critical Conceptual and Measurement Issues Through a Longitudinal Study. J. Retail. 2000, 76, 139–173. [Google Scholar] [CrossRef]
  74. Oh, H. Service Quality, Customer Satisfaction, and Customer Value: A Holistic Perspective. Int. J. Hosp. Manag. 1999, 18, 67–82. [Google Scholar] [CrossRef]
  75. Hsu, S.H. Developing an Index for Online Customer Satisfaction: Adaptation of American Customer Satisfaction Index. Expert Syst. Appl. 2008, 34, 3033–3042. [Google Scholar] [CrossRef]
  76. Ali, A.H.; Melkonyan, A.; Noche, B.; Gruchmann, T. Developing a Sustainable Logistics Service Quality Scale for Logistics Service Providers in Egypt. Logistics 2021, 5, 21. [Google Scholar] [CrossRef]
  77. Büyüközkan, G.; Çifçi, G. A Combined Fuzzy AHP and Fuzzy TOPSIS Based Strategic Analysis of Electronic Service Quality in Healthcare Industry. Expert Syst. Appl. 2012, 39, 2341–2354. [Google Scholar] [CrossRef]
  78. Ma, P.; Yao, N.; Yang, X. Service Quality Evaluation of Terminal Express Delivery Based on an Integrated SERVQUAL-AHP-TOPSIS Approach. Math. Probl. Eng. 2021, 2021, 8883370. [Google Scholar] [CrossRef]
  79. Prentkovskis, O.; Erceg, Ž.; Stević, Ž.; Tanackov, I.; Vasiljević, M.; Gavranović, M. A New Methodology for Improving Service Quality Measurement: Delphi-FUCOM-SERVQUAL Model. Symmetry 2018, 10, 757. [Google Scholar] [CrossRef]
  80. Dey, S. Evaluation of Indian B2C E-Shopping Websites under Multi Criteria Decision-Making Using Fuzzy Hybrid Technique. Int. J. Appl. Eng. Res. 2015, 10, 24551–24580. [Google Scholar]
  81. Ajripour, I. Applying MCDM Technique in Analyzing the Effect of Promotion Items Based on Online Shopping Factors: A Case Study; University of Szeged: Szeged, Hungary, 2020; pp. 9–27. [Google Scholar] [CrossRef]
  82. Hu, Y.C. Fuzzy Multiple-Criteria Decision Making in the Determination of Critical Criteria for Assessing Service Quality of Travel Websites. Expert Syst. Appl. 2009, 36, 6439–6445. [Google Scholar] [CrossRef]
  83. Bakir, M.; Atalik, Ö. Application of Fuzzy Ahp and Fuzzy Marcos Approach for the Evaluation of E-Service Quality in the Airline Industry. Decis. Mak. Appl. Manag. Eng. 2021, 4, 127–152. [Google Scholar] [CrossRef]
  84. Afful-Dadzie, E.; Nabareseh, S.; Komínková Oplatková, Z.; Klímek, P. Model for Assessing Quality of Online Health Information: A Fuzzy VIKOR Based Method. J. Multi-Criteria Decis. Anal. 2016, 23, 49–62. [Google Scholar] [CrossRef]
  85. Zaim, H.; Ramdani, M.; Haddi, A. Multi-Criteria Analysis Approach Based on Consumer Satisfaction to Rank B2C E-Commerce Websites. In Proceedings of the SITA 2016—11th International Conference on Intelligent Systems: Theories and Applications, Mohammedia, Morocco, 5 December 2016; Institute of Electrical and Electronics Engineers Inc.: Piscataway, NJ, USA, 2016. [Google Scholar]
  86. Alharbi, S.; Naderpour, M. E-Commerce Development Risk Evaluation Using MCDM Techniques; Springer: Berlin/Heidelberg, Germany, 2016. [Google Scholar]
  87. Lewis, J.R. The System Usability Scale: Past, Present, and Future. Int. J. Hum. Comput. Interact. 2018, 34, 577–590. [Google Scholar] [CrossRef]
  88. Can, G.F.; Delice, E.K.; Feryal, G. A Hybrid Multi-Dimensional Usability Evaluation Approach Proposal: A Case Study Related to Airline Firms’ Websites. Res. Sq. 2021. [Google Scholar] [CrossRef]
  89. Kang, D.; Park, Y. Review-Based Measurement of Customer Satisfaction in Mobile Service: Sentiment Analysis and VIKOR Approach. Expert Syst. Appl. 2014, 41, 1041–1050. [Google Scholar] [CrossRef]
  90. Lupo, T. A Fuzzy Framework to Evaluate Service Quality in the Healthcare Industry: An Empirical Case of Public Hospital Service Evaluation in Sicily. Appl. Soft Comput. J. 2016, 40, 468–478. [Google Scholar] [CrossRef]
  91. Keshavarz Ghorabaee, M.; Amiri, M.; Kazimieras Zavadskas, E.; Antuchevičienė, J. Assessment of Third-Party Logistics Providers Using a CRITIC–WASPAS Approach with Interval Type-2 Fuzzy Sets. Transport 2017, 32, 66–78. [Google Scholar] [CrossRef]
  92. Castro-Lopez, A.; Puente, J.; Vazquez-Casielles, R. E-Service Quality Model for Spanish Textile and Fashion Sector: Positioning Analysis and B2C Ranking by F-Topsis. Int. J. Inf. Technol. Decis. Mak. 2018, 17, 485–512. [Google Scholar] [CrossRef]
  93. Sisodia, G. Intuitionistic Fuzzy Weighted Sum and Product Method for Electronic Service Quality Selection Problem. Int. J. Mod. Educ. Comput. Sci. 2018, 10, 33–43. [Google Scholar] [CrossRef]
  94. Ilbahar, E.; Kahraman, C. Retail Store Performance Measurement Using a Novel Interval-Valued Pythagorean Fuzzy WASPAS Method. J. Intell. Fuzzy Syst. 2018, 35, 3835–3846. [Google Scholar] [CrossRef]
  95. Çakır, E.; Akel, G.; Doğaner, M. Türkiye’de Faaliyet Gösteren Özel Alışveriş Sitelerinin Bütünleşik SWARA—WASPAS Yöntemi Ile Değerlendirilmesi. Uluslararası İktisadi Ve İdari İncelemeler Derg. 2018, 18, 599–616. [Google Scholar] [CrossRef]
  96. Stanujkic, D.; Karabasevic, D.; Maksimovic, M.; Popovic, G.; Momcilovic, O. An Approach to Evaluating the Quality of Websites Based on the Weighted Sum Preferred Levels of Performances Method. Acta Polytech. Hung. 2019, 16, 195–215. [Google Scholar]
  97. Singh, N.; Chakraborty, A.; Bose, S.; Majumdar, B.M. Impact of Social Media in Banking Sector under Triangular Neutrosophic Arena Using MCGDM Technique. Neutrosophic Sets Syst. 2020, 35, 153–176. [Google Scholar]
  98. Sergi, D.; Ucal Sari, I. Prioritization of Public Services for Digitalization Using Fuzzy Z-AHP and Fuzzy Z-WASPAS. Complex Intell. Syst. 2021, 7, 841–856. [Google Scholar] [CrossRef]
  99. Karamaşa, Ç. Ranking Service Quality Using Multi-Criteria Decision-Making Methods: Example of Erzurum Province. J. Process Manag. New Technol. 2021, 9, 1–12. [Google Scholar] [CrossRef]
  100. Tumsekcali, E.; Ayyildiz, E.; Taskin, A. Interval Valued Intuitionistic Fuzzy AHP-WASPAS Based Public Transportation Service Quality Evaluation by a New Extension of SERVQUAL Model: P-SERVQUAL 4.0. Expert Syst. Appl. 2021, 186, 115757. [Google Scholar] [CrossRef]
  101. Nguyen, N.B.T.; Lin, G.H.; Dang, T.T. Fuzzy Multi-Criteria Decision-Making Approach for Online Food Delivery (OFD) Companies Evaluation and Selection: A Case Study in Vietnam. Processes 2021, 9, 1274. [Google Scholar] [CrossRef]
  102. Usta, S.K.; Kadaifçi, Ç. An Integrated Methodology Proposal for Sustainable Fashion: Understanding and Examining Criteria Affecting the Second-Hand Clothes Shopping. J. Fac. Eng. Archit. Gazi Univ. 2022, 37, 873–887. [Google Scholar] [CrossRef]
  103. Luo, Y.; Zhang, X.; Qin, Y.; Yang, Z.; Liang, Y. Tourism Attraction Selection with Sentiment Analysis of Online Reviews Based on Probabilistic Linguistic Term Sets and the IDOCRIW-COCOSO Model. Int. J. Fuzzy Syst. 2021, 23, 295–308. [Google Scholar] [CrossRef]
  104. Özdağoğlu, A.; Keleş, M.K. Evaluation of the Accessibility of Elderly Individuals to Airline Company Websites: Comparative Analysis with OWA, WASPAS, WSM, WPM. In App and Website Accessibility Developments and Compliance Strategies; GI Global: New York, NY, USA, 2022; pp. 188–204. [Google Scholar]
  105. Altay, B.C.; Okumuş, A.; Adıgüzel Mercangöz, B. An Intelligent Approach for Analyzing the Impacts of the COVID-19 Pandemic on Marketing Mix Elements (7Ps) of the on-Demand Grocery Delivery Service. Complex Intell. Syst. 2022, 8, 129–140. [Google Scholar] [CrossRef]
  106. Chaudhary, M.; Gangele, A.; Naved, M.; Gaur, L.; Singh, G. The Function of Driver Categorisation in the Ride-Hailing Industry: A Study on On-Demand Transport. In Proceedings of the 2022 3rd International Conference on Computation, Automation and Knowledge Management (ICCAKM), Noida, India, 15–17 November 2022; IEEE: Noida, India, 2022; pp. 1–6. [Google Scholar]
  107. Gupta, T.K.; Mangal, D.; Srivastava, V.S.; Gupta, V.P.; Patel, R.V. A Frame Work for Ranking the Factors Affecting Customer Service Quality by MOORA Approach. In Proceedings of the Lecture Notes in Mechanical Engineering, Rabat, Morocco, 10–12 May 2022; Springer Science and Business Media Deutschland GmbH: Berlin/Heidelberg, Germany, 2022; pp. 197–215. [Google Scholar]
  108. Çinaroğlu, E.; Zarali, F. Cappadocia Hotels’ Website Quality Evaluation: A Multi-Criteria Intuitionistic Fuzzy EDAS (IF-EDAS) Method Application. Bus. Manag. Stud. Int. J. 2022, 10, 769–786. [Google Scholar] [CrossRef]
  109. Cid-López, A.; Hornos, M.J.; Carrasco, R.A.; Herrera-Viedma, E. Decision-Making Model for Designing Telecom Products/Services Based on Customer Preferences and Non-Preferences. Technol. Econ. Dev. Econ. 2022, 1–36. [Google Scholar] [CrossRef]
  110. Çinaroğlu, E.; Zarali, F. Evaluation of the Airline Website Quality with the Intuitionistic Fuzzy TOPSIS Method. J. Turk. Oper. Manag. 2022, 2, 1277–1296. [Google Scholar] [CrossRef]
  111. Qin, Y.; Wang, X.; Xu, Z. Ranking Tourist Attractions through Online Reviews: A Novel Method with Intuitionistic and Hesitant Fuzzy Information Based on Sentiment Analysis. Int. J. Fuzzy Syst. 2022, 24, 755–777. [Google Scholar] [CrossRef]
  112. Nguyen, T.Q.; Ngo, L.T.T.; Huynh, N.T.; le Quoc, T.; van Hoang, L. Assessing Port Service Quality: An Application of the Extension Fuzzy AHP and Importance-Performance Analysis. PLoS ONE 2022, 17, e0264590. [Google Scholar] [CrossRef]
  113. Zavadskas, E.K.; Turskis, Z.; Antucheviciene, J. Optimization of Weighted Aggregated Sum Product Assessment. Elektron. Ir Elektrotechnika 2012, 112, 3–6. [Google Scholar] [CrossRef]
  114. Turskis, Z.; Zavadskas, E.K.; Antucheviciene, J.; Kosareva, N.; Turskis, Z.; Zavadskas, K.; Antucheviciene, J.; Kosareva, N. A Hybrid Model Based on Fuzzy AHP and Fuzzy WASPAS for Construction Site Selection. Int. J. Comput. Commun. Control. 2015, 10, 113. [Google Scholar] [CrossRef]
  115. Saaty, T.L. The Analytic Hierarchy Process in Conflict Management. Int. J. Confl. Manag. 1990, 1, 47–68. [Google Scholar] [CrossRef]
  116. Saaty, T.L. The Analytic Hierarchy Process. Int. J. Serv. Sci. 2008, 1, 83–98. [Google Scholar] [CrossRef]
  117. Ezell, B.; Lynch, C.J.; Hester, P.T. Methods for Weighting Decisions to Assist Modelers and Decision Analysists: A Review of Ratio Assignment and Approximate Techniques. Appl. Sci. 2021, 11, 10397. [Google Scholar] [CrossRef]
  118. Jahan, A.; Mustapha, F.; Sapuan, S.M.; Ismail, M.Y.; Bahraminasab, M. A Framework for Weighting of Criteria in Ranking Stage of Material Selection Process. Int. J. Adv. Manuf. Technol. 2012, 58, 411–420. [Google Scholar] [CrossRef]
  119. Odu, G.O. Weighting Methods for Multi-Criteria Decision Making Technique. J. Appl. Sci. Environ. Manag. 2019, 23, 1449. [Google Scholar] [CrossRef]
  120. Sureeyatanapas, P. Comparison of Rank-Based Weighting Methods for Multi-Criteria Decision Making. KKU Eng. J. 2016, 43, 376–379. [Google Scholar] [CrossRef]
  121. Pamučar, D.; Žižović, M.; Biswas, S.; Božanić, D. A New Logarithm Methodology of Additive Weights (LMAW) for Multi-Criteria Decision-Making: Application in Logistics. Facta Univ. Ser. Mech. Eng. 2021, 19, 361–380. [Google Scholar] [CrossRef]
  122. Žižovic, M.; Pamucar, D. New Model for Determining Criteria Weights: Level Based Weight Assessment (Lbwa) Model. Decis. Mak. Appl. Manag. Eng. 2019, 2, 126–137. [Google Scholar] [CrossRef]
  123. Božanić, D.; Pamučar, D.; Milić, A.; Marinković, D.; Komazec, N. Modification of the Logarithm Methodology of Additive Weights (LMAW) by a Triangular Fuzzy Number and Its Application in Multi-Criteria Decision Making. Axioms 2022, 11, 89. [Google Scholar] [CrossRef]
  124. Keshavarz-Ghorabaee, M.; Amiri, M.; Hashemi-Tabatabaei, M.; Zavadskas, E.K.; Kaklauskas, A. A New Decision-Making Approach Based on Fermatean Fuzzy Sets and Waspas for Green Construction Supplier Evaluation. Mathematics 2020, 8, 2202. [Google Scholar] [CrossRef]
  125. FDA Shelf Life and Expiration Dating of Cosmetics. Available online: https://www.fda.gov/cosmetics/cosmetics-labeling/shelf-life-and-expiration-dating-cosmetics (accessed on 29 January 2023).
  126. Mudambi, S.M.; Schuff, D.; Zhang, Z. Why Aren’t the Stars Aligned? An Analysis of Online Review Content and Star Ratings. In Proceedings of the Annual Hawaii International Conference on System Sciences, Waikoloa, HI, USA, 6–9 January 2014; IEEE Computer Society: Washington, DC, USA, 2014; pp. 3139–3147. [Google Scholar]
  127. Siering, M.; Muntermann, J. What Drives the Helpfulness of Online Product Reviews? From Stars to Facts and Emotions. In Proceedings of the 11th International Conference on Wirtschaftsinformatik, Leipzig, Germany, 27 February–1 March 2013; pp. 103–118. [Google Scholar]
  128. Kokoi, I. Female Buying Behaviour Related to Facial Skin Care Products; HAAGA-HELIA University of Applied Sciences: Helsinki, Finland, 2011. [Google Scholar]
  129. Sharma, S.; Sharma, A.K.; Moe, H.W.; Khanapure, A.; Mohan, P. A Study to Investigate the Chemical Potency, Physical Stability, and Efficacy of Analgesic Agents over a Period of Two Years Post Their Expiry Date. Med. J. Armed. India 2022, 78, S194–S200. [Google Scholar] [CrossRef] [PubMed]
  130. Amasa, W.; Santiago, D.; Mekonen, S.; Ambelu, A. Are Cosmetics Used in Developing Countries Safe? Use and Dermal Irritation of Body Care Products in Jimma Town, Southwestern Ethiopia. J. Toxicol. 2012, 2012, 204830. [Google Scholar] [CrossRef]
  131. Vergura, D.T.; Zerbini, C.; Luceri, B. Consumers’ Attitude and Purchase Intention towards Organic Personal Care Products. An Application of the S-O-R Model 1. Sinergie 2020, 38, 121–137. [Google Scholar]
  132. Irshad Ali, M.; Yadav, M. A Study of Consumer Perception of Herbal Products in Bhopal (With Special Reference to Vindhya Herbal Products). Int. J. Manag. Stud. 2015, 2, 69–80. [Google Scholar]
  133. Green Kulture Real Dangers of Chemical Dishwashing Detergents. Available online: https://greenkulture.sg/blogs/news/real-dangers-of-chemical-dishwashing-detergents (accessed on 8 January 2023).
  134. Vasic, N.; Kilibarda, M.; Kaurin, T. The Influence of Online Shopping Determinants on Customer Satisfaction in the Serbian Market. J. Theor. Appl. Electron. Commer. Res. 2019, 14, 255–274. [Google Scholar] [CrossRef]
  135. Doerr, J.; Kerkow, D.; Landmann, D. Supporting Requirements Engineering for Medical Products-Early Consideration of User-Perceived Quality. In Proceedings of the ICSE’08, Leipzig, Germany, 10–18 May 2008; pp. 639–647. [Google Scholar]
  136. Situmeang, F.; de Boer, N.; Zhang, A. Looking beyond the Stars: A Description of Text Mining Technique to Extract Latent Dimensions from Online Product Reviews. Int. J. Mark. Res. 2020, 62, 195–215. [Google Scholar] [CrossRef]
  137. Rajendran, S. Improving the Performance of Global Courier & Delivery Services Industry by Analyzing the Voice of Customers and Employees Using Text Analytics. Int. J. Logist. Res. Appl. 2021, 24, 473–493. [Google Scholar] [CrossRef]
  138. Zheng, L.; Favier, M.; Huang, P. Chinese Consumer Perceived Risk and Risk Relievers in E-Shopping for Clothing. J. Electron. Commer. Res. 2012, 13, 255–274. [Google Scholar]
  139. Kotler, P.; Keller, K.L.; Chernev, A. Marketing Management, Global Edition, 16th ed.; Pearson Education: London, UK, 2021; Volume 16e, ISBN1 1292404817. ISBN2 9781292404813. [Google Scholar]
  140. Kuo, Y.F.; Wu, C.M. Satisfaction and Post-Purchase Intentions with Service Recovery of Online Shopping Websites: Perspectives on Perceived Justice and Emotions. Int. J. Inf. Manag. 2012, 32, 127–138. [Google Scholar] [CrossRef]
  141. Geetha, V.; Kalyani, D.; Geetha, R.; Rangarajan, K. A Conceptual Framework For Perceived Risk in Consumer Online Shopping; VIU University: Vellore, India, 2015; Volume 10. [Google Scholar]
  142. Bae, S.; Lee, T. Gender Differences in Consumers’ Perception of Online Consumer Reviews. Electron. Commer. Res. 2011, 11, 201–214. [Google Scholar] [CrossRef]
  143. Watanabe, T.; Omori, Y. Online Consumption during the COVID-19 Crisis: Evidence from Japan. COVID Econ. Vetted Real-Time Pap. 2020, 32, 208–241. [Google Scholar]
  144. Wang, W.; Kim, S. Lady First? The Gender Difference in the Influence of Service Quality on Online Consumer Behavior. Nankai Bus. Rev. Int. 2019, 10, 408–428. [Google Scholar] [CrossRef]
  145. Passyn, K.A. Images of Online Versus Store Shopping: Have the Attitudes of Men and Women, Young and Old really Changed? J. Bus. Econ. Reserach 2011, 9, 99–110. [Google Scholar] [CrossRef]
  146. Wu, S.I. The Relationship between Consumer Characteristics and Attitude toward Online Shopping. Mark. Intell. Plan. 2003, 21, 37–44. [Google Scholar] [CrossRef]
  147. Senapati, T.; Yager, R.R. Fermatean Fuzzy Sets. J. Ambient Intell. Hum. Comput. 2020, 11, 663–674. [Google Scholar] [CrossRef]
  148. Qureshi, K.M.; Mewada, B.G.; Alghamdi, S.Y.; Almakayeel, N.; Mansour, M.; Qureshi, M.R.N. Exploring the Lean Implementation Barriers in Small and Medium-Sized Enterprises Using Interpretive Structure Modeling and Interpretive Ranking Process. Appl. Syst. Innov. 2022, 5, 84. [Google Scholar] [CrossRef]
Figure 1. Online sales of health and personal care products in the US [4].
Sustainability 15 03428 g001
Figure 2. E-commerce sales in 2022 compared with the previous year [8].
Sustainability 15 03428 g002
Figure 3. Amazon store’s customer satisfaction level [15].
Sustainability 15 03428 g003
Figure 4. The proposed conceptual model framework for quality parameters in customer ratings.
Sustainability 15 03428 g004
Figure 5. The methodology of manual sentiment analysis.
Sustainability 15 03428 g005
Figure 6. The procedure of the proposed hybrid MCDM model.
Sustainability 15 03428 g006
Figure 7. Comparison of space of FMGs, PMGs, and IMGs.
Sustainability 15 03428 g007
Figure 8. Example of sentiment analysis.
Sustainability 15 03428 g008
Figure 9. Customers’ overall rating.
Sustainability 15 03428 g009
Figure 10. Distribution of quality parameters according to the sample’s (800 CRs) average rating.
Sustainability 15 03428 g010
Figure 11. The ranking of unsatisfactory products among overall online shoppers.
Sustainability 15 03428 g011
Figure 12. The criteria importance weights for the number of decision makers.
Sustainability 15 03428 g012
Figure 13. The ranking of products with the number of decision makers.
Sustainability 15 03428 g013
Table 1. MCDM literature comprises service and product quality.
AuthorYearSectorFocusFuzzyLMAWWASPASOther
[89]2013Mobile applicationMobile service quality VIKOR
[90]2016HealthcareSERVQUALTriangular F AHP
[84]2016HealthcareHealth information service qualityTriangular F VIKOR
[91]20173PL logisticOverall performanceIT2-Fuzzy CRITIC
[57]2018HealthcareProduct quality TOPSIS, PROMETHEE, AHP
[92]2018TextileE-service qualityF TOPSIS
[93]2018Service providerE-service qualityIF TOPSIS, WSM, WPM
[94]2018Retailers’ performanceOverall service performanceIV -Pythagorean IV- IF
[95]2018E-shoppingOverall performance SWARA
[96]2019Company websiteSERVQUAL WS PLP
[97]2020BankingService quality with Social MediaTriangular
neutrosophic
MCDGM
[98]2021Public serviceService qualityF- Z AHP
[99]2021TourismService quality SWARA
[100]2021Public transportationP-SERVQUALIV+ IF AHP
[101]2021FoodOverall service performanceF AHP
[102]2021ClothsService quality SWARA
[103]2021TourismTourism attractions service qualityPLTSs COCOSO, IDOCRIW
[83]2021AirlineService qualityF MARCOS, AHP
[104]2022AirlineWebsite service quality OWA, WSM, and WPM
[105]2022GroceryOverall service performanceF AHP
[106]2022TransportService quality MARCOS, EWM
[107]2022General service qualitySurvey MOORA
[108]2022TourismWebsite service qualityIF EDAS
[109]2022Telecom sectorLean six sigma service qualityIF
[110]2022AirlineWebsite qualityIF TOPSIS, EDAS
[111]2022TourismTourist attraction service qualityIHF TOPSIS
[112]2022Port industryPort service qualityF AHP
This study HealthcareProduct + Delivery Service + Aftersales service qualityFermatean F
F: fuzzy, F-Z: fuzzy Z; IF: intuitionistic fuzzy; IV: interval-valued; IT2F: interval type-2 fuzzy sets; IHF: intuitionistic and hesitant fuzzy; MOORA: multi-objective optimization on basis of ratio analysis; SWARA: step-wise weight assessment ratio analysis; EWM: entropy weight method; WS PLP: weighted sum preferred levels of performances; MCDGM: multi-criteria group, decision-making problems; PLTSs: probabilistic linguistic term sets; IDOCRIW: integrated determination of objective criteria weights; COCOSO: combined compromise solution; CRITIC: criteria importance through inter-criteria correlation; EDAS: evaluation based on distance from average solution; OWA: ordered weighted averaging; WSM: weighted sum model; WPM: weighted product model. * The abbreviations of other MCDM methods.
Table 2. Fuzzy scale for criteria prioritization.
Fuzzy Linguistic TermsAbbreviationFuzzy Number
Absolutely LowAL111
Very LowVL11.52
LowL1.522.5
Medium LowML22.53
EqualE2.533.5
Medium HighMH33.54
HighH3.544.5
Very HighVH44.55
Absolutely HighAH4.555
Table 3. The linguistic terms and FFSs.
Linguistic TermsAbbreviationFermatean Fuzzy Number
µν
Very Very LowVVL0.10.9
Very LowVL0.10.75
Low L0.250.6
Medium LowML0.40.5
MediumM0.50.4
Medium HighMH0.60.3
HighH0.70.2
Very HighVH0.80.1
Very Very HighVVH0.90.1
Table 4. Sample customer reviews according to the quality parameters.
SourceQuality VariablesAverage Satisfaction Levels of Products
P1P2P3P4P5P6P7P8Average
ProductPerformance1.1413.6081.8822.0901.0304.5882.2691.1522.220
Appropriate Price0.1313.3750.7190.9000.0002.1820.4271.5151.156
Expiration Date0.0101.8330.0001.0600.6065.0000.0000.0001.064
Side effect0.3371.0001.0710.2600.1114.4580.2600.4650.995
DeliveryTimeliness0.5053.8571.0001.9700.4445.0000.2331.2861.787
Non-delivery0.0003.7000.3570.1440.4855.0004.2880.9391.864
Package’s suitableness0.0712.0501.2380.4040.1723.2330.2690.3740.976
Damaged product pack0.0212.8081.1821.3300.3643.3440.2600.2221.191
Order’s Accuracy0.0003.2090.0001.7350.0004.6150.1150.0201.212
AftersalesPay-back Option0.1721.0000.6253.0000.0000.0000.0190.0000.602
Change Possibility0.2991.0001.1760.0000.0800.0000.0580.0410.332
Politeness0.0001.3330.0005.0000.1705.0000.0480.0101.445
Quick Answer0.4851.2500.1545.0000.0005.0000.0100.0401.492
Information Conformity0.2631.8251.0001.5000.8401.0001.2310.0000.957
Average Rating Star1.9903.0082.0503.7201.4854.4302.9522.9092.818
P1: antiperspirant cream deodorant; P2: electric toothbrush; P3: moisturizing cream; P4: multi-vitamin; P5: medical pillow; P6: shampoo; P7: hair conditioner; P8: washing liquid.
Table 5. Customers’ overall ratings for the selected product.
Rating5 Stars4 Stars3 Stars2 Stars1 StarOverall Avg.
Rating
Total Reviews
Antiperspirant deodorant46,2074146191389015194.754,675
%85%8%3%2%3%
Electric toothbrush3930621181491124.74893
%80%13%4%1%2%
Moisturizing cream4042514226821504.65014
%81%10%5%2%3%
Multi-vitamin4691800248692094.66017
%78%13%4%1%3%
Medical pillow3109736366901624.54463
%70%16%8%2%4%
Shampoo4364548237822294.65460
%80%10%4%2%4%
Hair conditioner34134133174.7408
%84%8%3%1%4%
Washing liquid17,77722755991384834.721,272
%84%11%3%1%2%
Table 6. Decision makers’ assessment criteria.
CriteriaDM1DM2DM3
PerformanceAHAHAH
Appropriate PriceVHVLAH
Expiration DateAHAHVH
Side EffectAHAHAH
TimelinessMHVHVH
Non-deliveryVHAHVH
Package’s SuitablenessMLHVH
Damaged Product PackLVHVH
Order’s AccuracyVHVHAH
Pay-back OptionAHAHAH
Change PossibilityHAHVH
PolitenessHVHVH
Quick AnswerMHHVH
Information ConformityAHHVH
Table 7. The aggregated fuzzy weights and final criteria score of criteria of LMAW Results.
CriteriaSumAggregated Fuzzy Weight Coefficient VectorsFinal Weight Coefficients
Performance0.004960.070440.07630
0.005850.07648
0.006630.08143
Appropriate Price0.002570.050730.06047
0.003670.06059
0.004860.06974
Expiration Date0.004790.069200.07532
0.005670.07533
0.006630.08143
Side Effect0.004960.070440.07630
0.005850.07648
0.006630.08143
Timeliness0.004030.063480.07043
0.004910.07009
0.006190.07870
Non-delivery0.004610.067920.07432
0.005500.07414
0.006630.08143
Package’s Suitableness0.003290.057320.06504
0.004200.06478
0.005450.07383
Damaged Product Pack0.003030.055030.06341
0.003990.06320
0.005270.07262
Order’s Accuracy0.004610.067900.07430
0.005490.07411
0.006630.08143
Pay-back Option0.004960.070440.07630
0.005850.07648
0.006630.08143
Change Possibility0.004410.066440.07296
0.005300.07279
0.006420.08015
Politeness0.004250.065210.07199
0.005130.07164
0.006420.08015
Quick Answer0.003850.062060.06912
0.004730.06880
0.006000.07747
Information Conformity0.004420.066470.07299
0.005300.07282
0.006430.08017
Table 8. The positive final scores and ranking of FF-WASPAS.
Products Q ˜ i S   Q ˜ i p   Q ˜ i     Positive
Score Function
Ranking
Antiperspirant cream deodorant(0.68, 0.31)(0.43, 0.62)(0.59, 0.44)1.1246
Electric toothbrush(0.73, 0.25)(0.51, 0.52)(0.65, 0.36)1.2293
Moisturizing cream(0.77, 0.21)(0.49, 0.58)(0.68, 0.35)1.2661
Multi-vitamin(0.73, 0.26)(0.45, 0.62)(0.64, 0.40)1.1934
Medical pillow(0.72, 0.25)(0.54, 0.48)(0.65, 0.35)1.2352
Shampoo(0.65, 0.32)(0.48, 0.52)(0.58, 0.41)1.1315
Hair conditioner(0.60, 0.34)(0.47, 0.50)(0.55, 0.42)1.0917
Washing liquid(0.61, 0.37)(0.45, 0.53)(0.54, 0.44)1.0748
Table 9. Comparison of quality parameters and their importance weight.
Quality ParametersSample’s Average LMAW Results
Performance2.220.0760
Side Effect0.9950.0760
Pay-back Option0.6020.0760
Expiration Date1.0640.0750
Non-delivery1.8640.0740
Order’s Accuracy1.2120.0740
Change Possibility0.3320.0730
Information Conformity0.9570.0730
Politeness1.4450.0720
Timeliness1.7870.0700
Quick Answer1.4920.0690
Package’s Suitableness0.9760.0650
Damaged Product Pack1.1910.0630
Appropriate Price1.1560.0600
Table 10. Comparison of products’ rankings according to decision makers’ number.
DM2DM3DM4
ProductsPositive
Score Function
RankPositive
Score Function
RankPositive
Score Function
Rank
Antiperspirant cream Deodorant1.17321.12461.2361
Electric toothbrush1.12651.22931.0408
Moisturizing cream1.15931.26611.1673
Multi-vitamin1.25811.19341.1872
Medical pillow1.13341.23521.0776
Shampoo1.05571.13151.0677
Hair conditioner1.04681.09171.1005
Washing liquid1.07761.07481.1184
Disclaimer/Publisher’s Note: The statements, opinions and data contained in all publications are solely those of the individual author(s) and contributor(s) and not of MDPI and/or the editor(s). MDPI and/or the editor(s) disclaim responsibility for any injury to people or property resulting from any ideas, methods, instructions or products referred to in the content.

