Article

A New Method to Predict Final Products of Red Mud-Slag-Based Alkali-Activated Materials Using Complete Phase Analysis of Precursors

Department of Civil and Environmental Engineering, University of Hawaii at Manoa, Honolulu, HI 96822, USA
*
Author to whom correspondence should be addressed.
Sustainability 2023, 15(4), 3473; https://doi.org/10.3390/su15043473
Submission received: 26 November 2022 / Revised: 22 January 2023 / Accepted: 8 February 2023 / Published: 14 February 2023
(This article belongs to the Special Issue Decarbonization in the Cement and Concrete Industry)

Abstract

:
This paper presents a new method for predicting the final products of red mud-slag-based alkali-activated materials (RM-AAMs) using comprehensive phase analysis. As the first step, a quantitative method by X-ray diffraction (XRD) was used to analyze six different types of red mud and ground-granulated blast-furnace slag (GGBS). Secondly, X-ray fluorescence (XRF) was employed to determine the bulk elemental oxide contents of the precursors. A procedure combining XRD and XRF was then used to quantify both the crystalline and amorphous components of the precursors. In addition to investigating precursors, soluble silica from sodium silicate has been considered in calculating reactive silica. The research includes forty sets of alkali-activated samples using various activators with different concentrations. The XRD results of hardened paste samples revealed that the method could successfully predict the final products of RM-AAMs. By predicting the final products of the alkali-activation process, the optimization of raw material types and contents will be more efficient. For example, in the case of having C-S-H as the final product, adding substances with high reactive alumina would be unnecessary.

1. Introduction

Red mud (RM) is an industrial by-product of the aluminum production process. The Bayer process extracts Al out of bauxite ores and remaining substances include heavy metals and alkalis. The color of RM varies from reddish gray to brownish red, depending on the content of Fe oxides. During the Bayer process, clay and aluminum silicate minerals of the bauxite are dissolved under various temperature conditions and caustic concentrations [1]. Red mud contains some percentage of aluminum if the process is not able to retract this element completely. The presence of a relatively high amount of silica in RM is also likely. The possibility of the existence of calcium, aluminum, and non-crystalline alkalis in RM is strong, and RM is potentially an economically and environmentally friendly choice for the production of alkali-activated materials (AAMs) [2].
The first terminology for geopolymers is attributable to Davidovits [3]. Geopolymerization occurs through chemical reactions of powders containing aluminosilicate oxides with alkalis leading to the formation of Si-O-Al bonds. These three-dimensional networks are amorphous to semi-crystalline silicoaluminate structures [3]. Material scientists classify any binder system obtained from the reaction of alkali sources with solid silicate powders as AAMs [2,4,5]. The precursor can be calcium silicate or aluminosilicate-rich powders such as blast furnace slag (BFS), fly ash, natural pozzolans, or bottom ash. The alkali activators can be soluble materials, which increase the pH in the mix and accelerate the dissolution process [2,6].
Except for a particular study [7] in which red mud was directly activated by sodium silicate, comparatively low alumina in RM makes it rarely the sole precursor for AAMs. It is more common to add other Al-rich sources to form binders with satisfactory strength and durability. Dimas et al. blended metakaolin and RM to synthesize inorganic polymers [8]. Calcined oil shale at elevated temperatures was found to be able to enhance the hydration of red mud and fly-ash-based cementitious materials [9]. It has also been reported that AAMs have developed by substituting a limited percentage of fly ash with RM [10]. Blast furnace slag (BFS) is an excellent source of reactive alumina, silica, and calcium, which makes it possible to use BFS as the primary precursor of the AAMs. However, the high cost of BFS in some regions, fast setting time, and potential rheological issues have encouraged scholars to replace some part of BFS with waste materials such as RM. Pan et al. [11] activated RM-BFS cementitious materials using solid sodium silicate and achieved satisfactory mechanical properties at room temperature. Red mud was also used as a part of the binder along with BFS and Portland cement [12].
The pore structure of alkali-activated materials cast by red mud has been studied recently. Li et al. [13] investigated the microstructure of the C-A-S-H gel in red-mud-based AAMs and concluded that the gel was mainly composed of SiQ (3) structure in mature samples. Another study (study [14]) confirms that the red mud acts as a micro-filler that refines the pore structure and, thus, reduces the concentration of harmful pores (≥50 nm). Song et al. [15] evaluated the microstructure of red mud-iron tailing-based alkali-activated mortar and found that the main products of their samples was the C-A-S-H gel and suggested the utilization of iron tailing and red mud in AAMs.
However, the mentioned studies have yet to focus on the critical role of reactive alumina, silica, and calcium as the main components of the red-mud-based AAMs. The present paper follows a novel procedure to quantify the reactive portion of silica, alumina, and calcium in AAMs mixes, compare it with a ternary diagram, and predict the final products of alkali activation that could be C-S-H, C-A-S-H, or N-A-S-H. The prediction will be important to optimize the raw materials, specifically the chemicals, including sodium silicate and sodium hydroxide leading to lower fabrication costs.
It is crucial to better understand the mechanism of chemical reactions and predict the final products of alkali activation to optimize the costs and performance of AAMs. Limited studies are available in the literature, at which satisfactory mechanical properties were achieved by replacing significant percentages of BFS with RM. As of this moment, the levels of contribution from reactive calcium, alumina, and silica have not been systematically considered in the fabrication of AAMs by RM and BFS. The chemical composition of precursors obtained from XFR has typically been used in the literature as the base for the mix design of AAMs, which may lead to unnecessarily high concentrations of alkalis to dissolve the crystalline or semi-crystalline portion of the precursors. Because alkalis are the most expensive raw material in the AAMs, a mix design using high concentrations of chemicals could be uneconomical and impractical.
This research presents a new method to predict the final products of red mud-slag-based alkali-activated materials to optimize the mix-design procedures. This method can quantitatively identify the crystalline and amorphous phases of the RM, as well as of the slag. The final products can be successfully predicted based on a ternary diagram of reactive calcium, silica, and alumina. The predicted final products were verified by the XRD results of paste samples prepared by different activators.

2. Materials and Methods

2.1. Raw Materials

As shown in Table 1 and Table 2, six different types of red mud stemming from the Bayer process, were studied in this study. All samples were in wet conditions except RM1-d and RM2, which were in the form of hard lumps. A laboratory ceramic ball mill was used to ground the lumps before use. Water contents of samples, listed in Table 1, were considered as part of the total amount of water in each mix.
Sodium hydroxide and sodium silicate were used as the activators. Sodium hydroxide (NaOH) (Ward’s Science, Rochester, NY, USA) was in pellet form with 99% purity. Three different classes of sodium silicate were used as the sources of soluble silicon ions with the general formula of SiO2·(n1)Na2O·(n2)H2O. Sodium silicate solutions with SiO2/Na2O = 3 and 37 wt% (Fisher Scientific, Waltham, MA, USA), sodium silicate with SiO2/Na2O = 2.1 and 44.1 wt%, and solid sodium metasilicate pentahydrate (PQ Corporation, Malvern, PE, USA) were used. The fine aggregate used was local Hawaiian basalt sand. The sand could pass through a #8 (2.38 mm) sieve but was retained on a #50 (0.297 mm) sieve in the gradation test (see Figure 1).
Table 2 summarizes the XRF results of the chemical composition of the precursors, including six red mud and BFS samples.

2.2. Experimental Procedure

2.2.1. X-ray Diffraction

X-ray powder diffraction was used to characterize the crystalline components of the precursors. All samples were dried, ground, and prepared for scanning to identify the phases. An advance diffractometer (Bruker D8, Billerica, MA, USA) [16] collected the data with Cu Kα radiation, operated at 40 mA, and 40 kV. The scan was from 5° to 85° 2ϴ with increments of 0.01° at the speed of 192 s/step.
A commercially available software package (DIFFRAC EVA, Billerica, MA, USA) was used for qualitative analysis. The software identified the “background” pattern and fitted either cubic spline or shifted polynomial functions, depending on the general shape of the base. The process subtracted the broad “humps” caused by the amorphous powder fractions. The program employed the Crystallography Open Database (COD) [17] to compare reference patterns of crystalline phases. Commonly known reference patterns of minerals found in red muds were clues to locating diffraction peaks.
The software in [5,18] could quantify the relative proportion of each crystalline phase [19]. A user needs to enter the chemical compositions of the precursors based on the XRF results into the software, which were used to determine the bulk amorphous fraction. Additionally, an analysis by Rietveld was carried out using TOPAS [20] to quantify each component. The analysis procedure was like the study of Li et al. [17].
The procedure characterized the crystalline fraction of the powders by providing the concentration of each element or metal oxide separately. The amorphous proportion of each compound could be calculated directly by subtracting the concentration of non-reactive metal oxides from the total amount achieved by XRF.

2.2.2. Mortar Sample Preparation and Mix Procedure

In this study, twenty one RM-slag precursors were dissolved using sodium hydroxide, and sodium silicate was added as the source of soluble silica. Table 3 shows the detailed proportioning of these mixes. Under the Mix Label column, “RMx” stands for red mud, followed by numbers indicating the type of red mud. The “Sxx,” followed by two-digit numbers refers to the amount of slag that has been used in the mix. “Chx” stands for chemical type. For example, in the RM4S30Ch1 mixes, Type 4 red mud was mixed with 30% slag, and RM5S40Ch1 had the same sodium silicate and sodium hydroxide as RM4S30Ch1. A precursor/sand ratio of one was used for all specimens. The concentration of [Si4+] was less than 1.5 M. The final molarity of sodium hydroxide (NaOH) was from 1.5 to 2.7 M. The water content in the sodium silicate solution decreased the sodium hydroxide’s final molarity from 6 M to the mentioned values. Low concentrations of [Si4+] and [OH] were selected to optimize the cost and performance of concrete. Yip et al. [21,22] also reported that the activation of calcium silicate sources at lower concentrations would achieve higher mechanical properties.
The mixing procedure started with the preparation of a solution of 6 M NaOH to dissolve the precursors, which was a mixture of RM and BFS. Sodium hydroxide with a designed concentration was added slowly until a soft paste was achieved after ten minutes of mixing (See Figure 2a). The sand was then added to the paste and mixed to obtain a homogenous mortar, over the course of approximately five minutes. The final step was to introduce a sodium silicate solution to the mixture (See Figure 2b).

2.2.3. Paste Samples for XRD Analysis

Paste cylinders with dimensions of 25 mm diameter × 5 mm height were prepared to investigate the effects of different types of soluble silica in the final product of RM-based AAMs. Samples were moisture-cured in a plastic container at a temperature of 21 ± 2 °C until the desired ages.
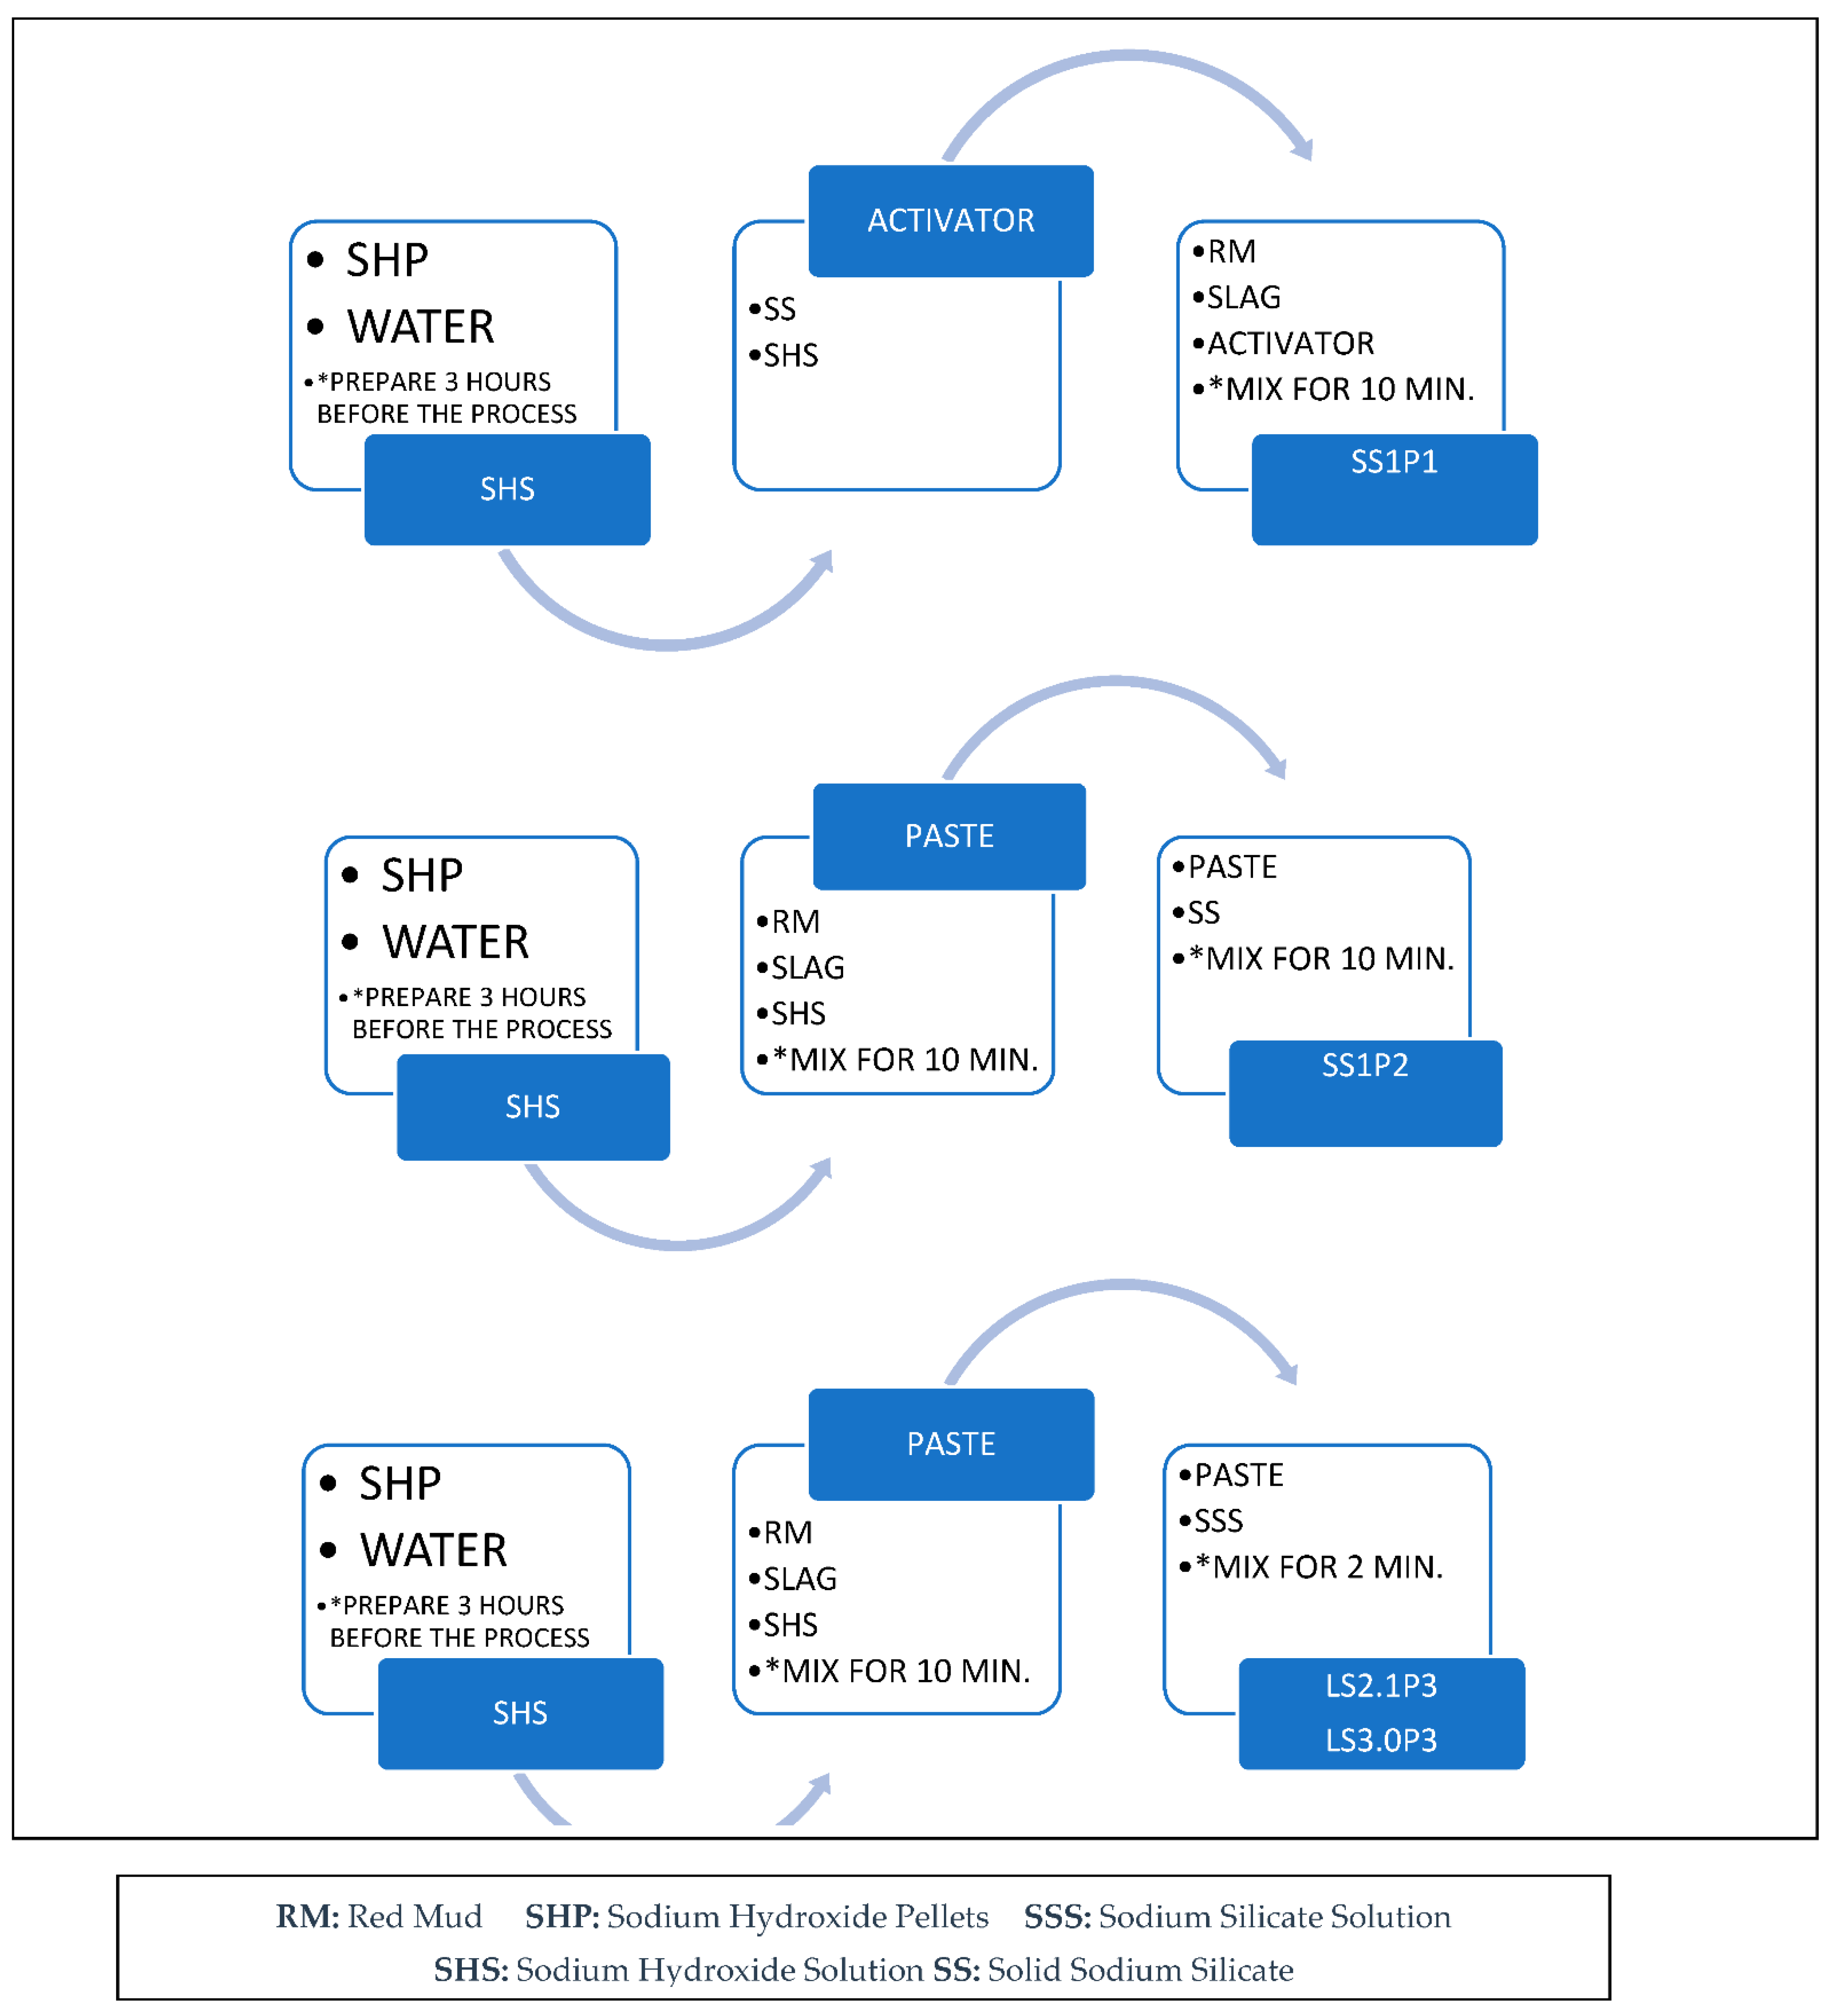
Paste samples were prepared based on the mix proportion of the RM1-aS30 in Row 4 of Table 3, except no sand was added and different types of sodium silicate were used (see Table 4). RM1-aS30 was chosen because of its high compressive strength. Solid sodium silicate with different mixing procedures was used for mixes SS1P1 and SS1P2 (see Figure 3). In mix SS1P1, solid sodium silicate pellets and sodium hydroxide solution were mixed first and then were added into the precursor. In the case of SS1P2, a sodium hydroxide solution was introduced to the precursor first, mixed for 10 min, and then the solid sodium silicate pellets were added to the mix. The sodium silicate solution with a SiO2/Na2O = 2.1 and 3.0 and the sodium hydroxide solution were the chemicals in mixes LS2.1P3 and LS3.0P3, respectively (see Table 4).
For each sample set (SS1P1, SS1P2, LS201P3, and LS3.0P3), nine 2” × 2” × 2” specimens have been cast, and the compressive strength of them has been measured after 1, 7, and 28 days (See Figure 4). Figure 5 shows the 28-day compressive strength of the alkali-activated paste samples. The chart shows that the compressive strength is sensitive to the amount of soluble silicate in the mix. The concentration of the active silica from the sodium silicate would not be the only factor contributing to the total amount of reactive silica. Therefore, the absolute reactive values of silica, calcium and alumina will be discussed in the following section to better understand the factors affecting the formation of the final alkali-activation products.
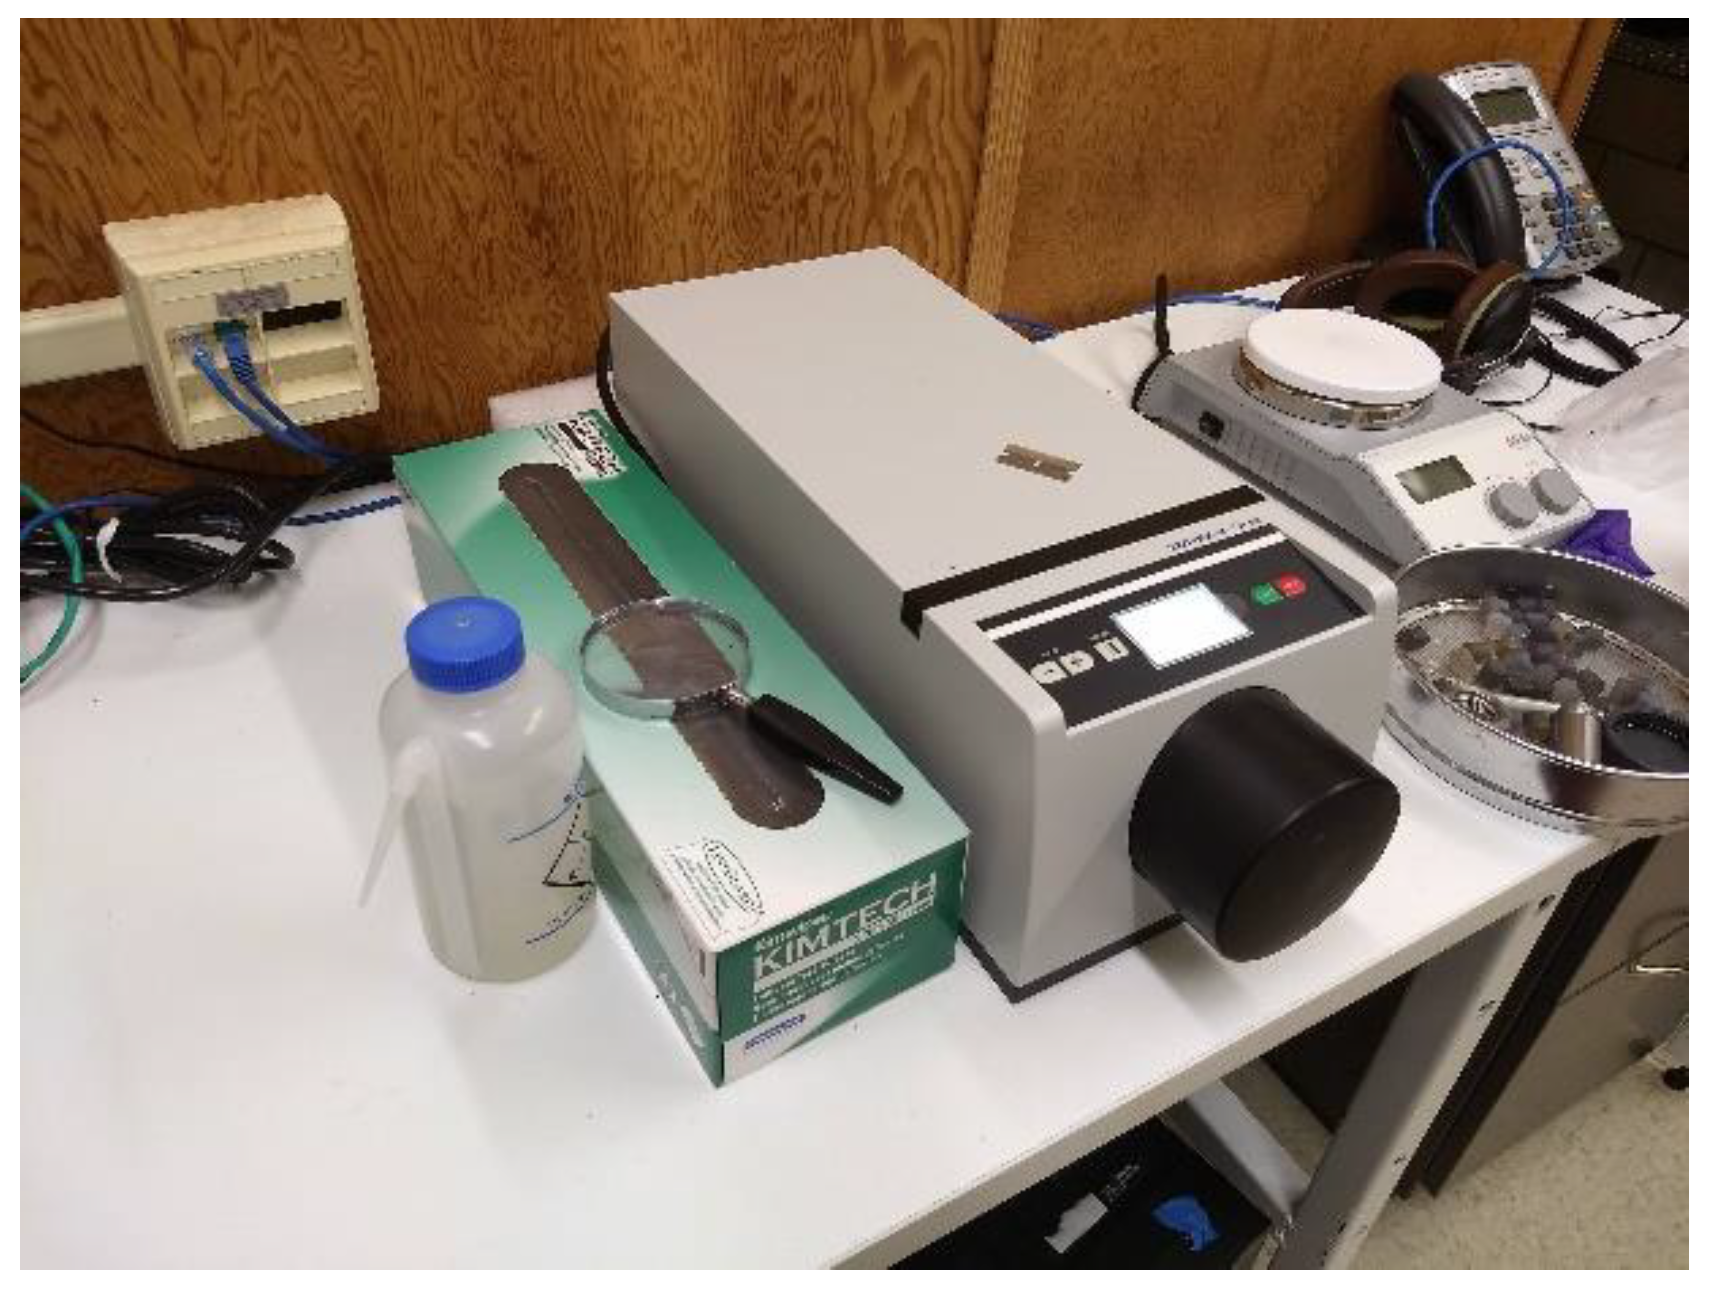
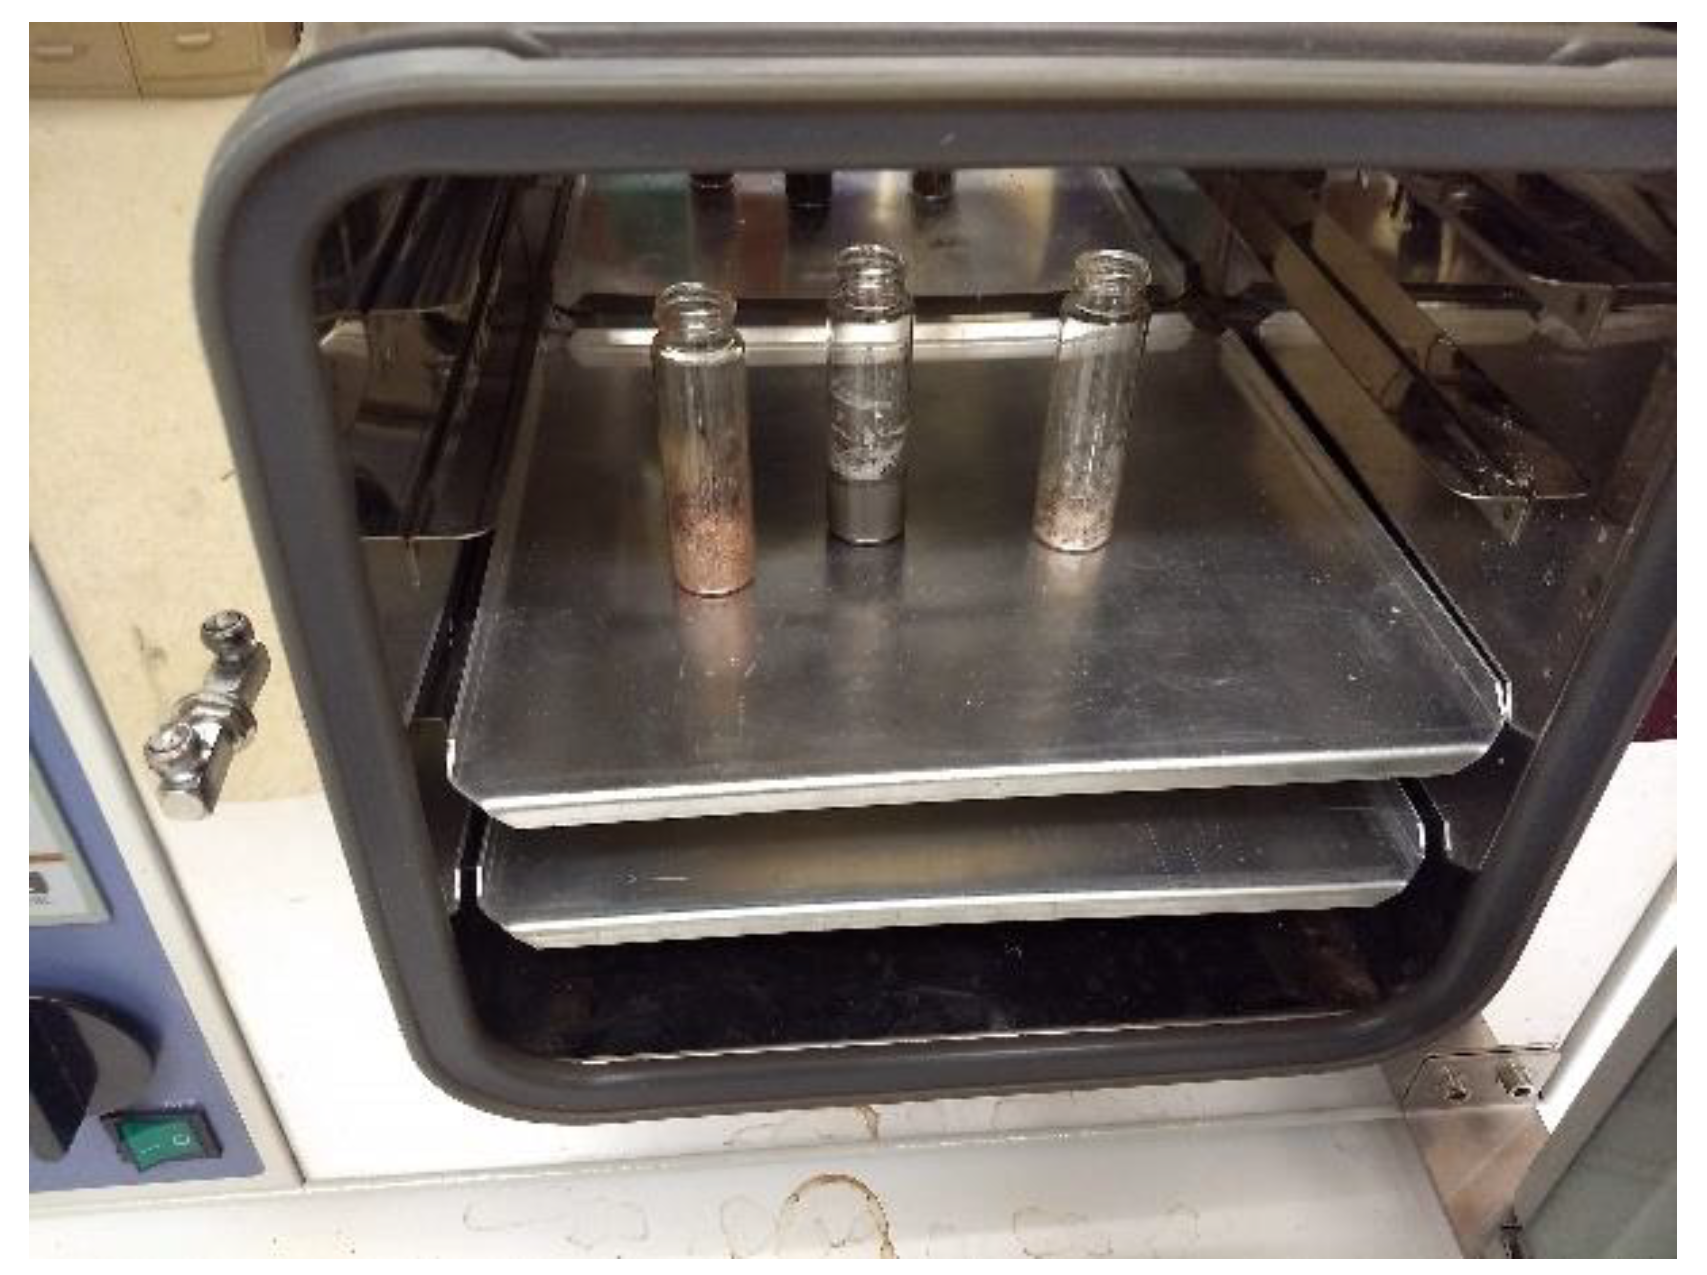
X-ray powder diffraction was conducted on paste samples after 1, 7, and 28 days. The hardened specimens were crushed, ground by an agate mortar and pestle, and then micronized by a mill (XRD-Mill Crone) to 5 µm (see Figure 6). Acetone was utilized to stop the chemical reaction at the specified testing age. No heat was applied during the drying process of the samples because the elevated temperature could have changed the final products from the alkali-activation reaction. Figure 7 illustrates a vacuum oven working at lab temperature. The wet powder was kept in a vacuum oven at room temperature until the complete evaporation of the blend of water and acetone was achieved.

3. Results and Discussion

3.1. Quantitative Crystalline Phases Identification

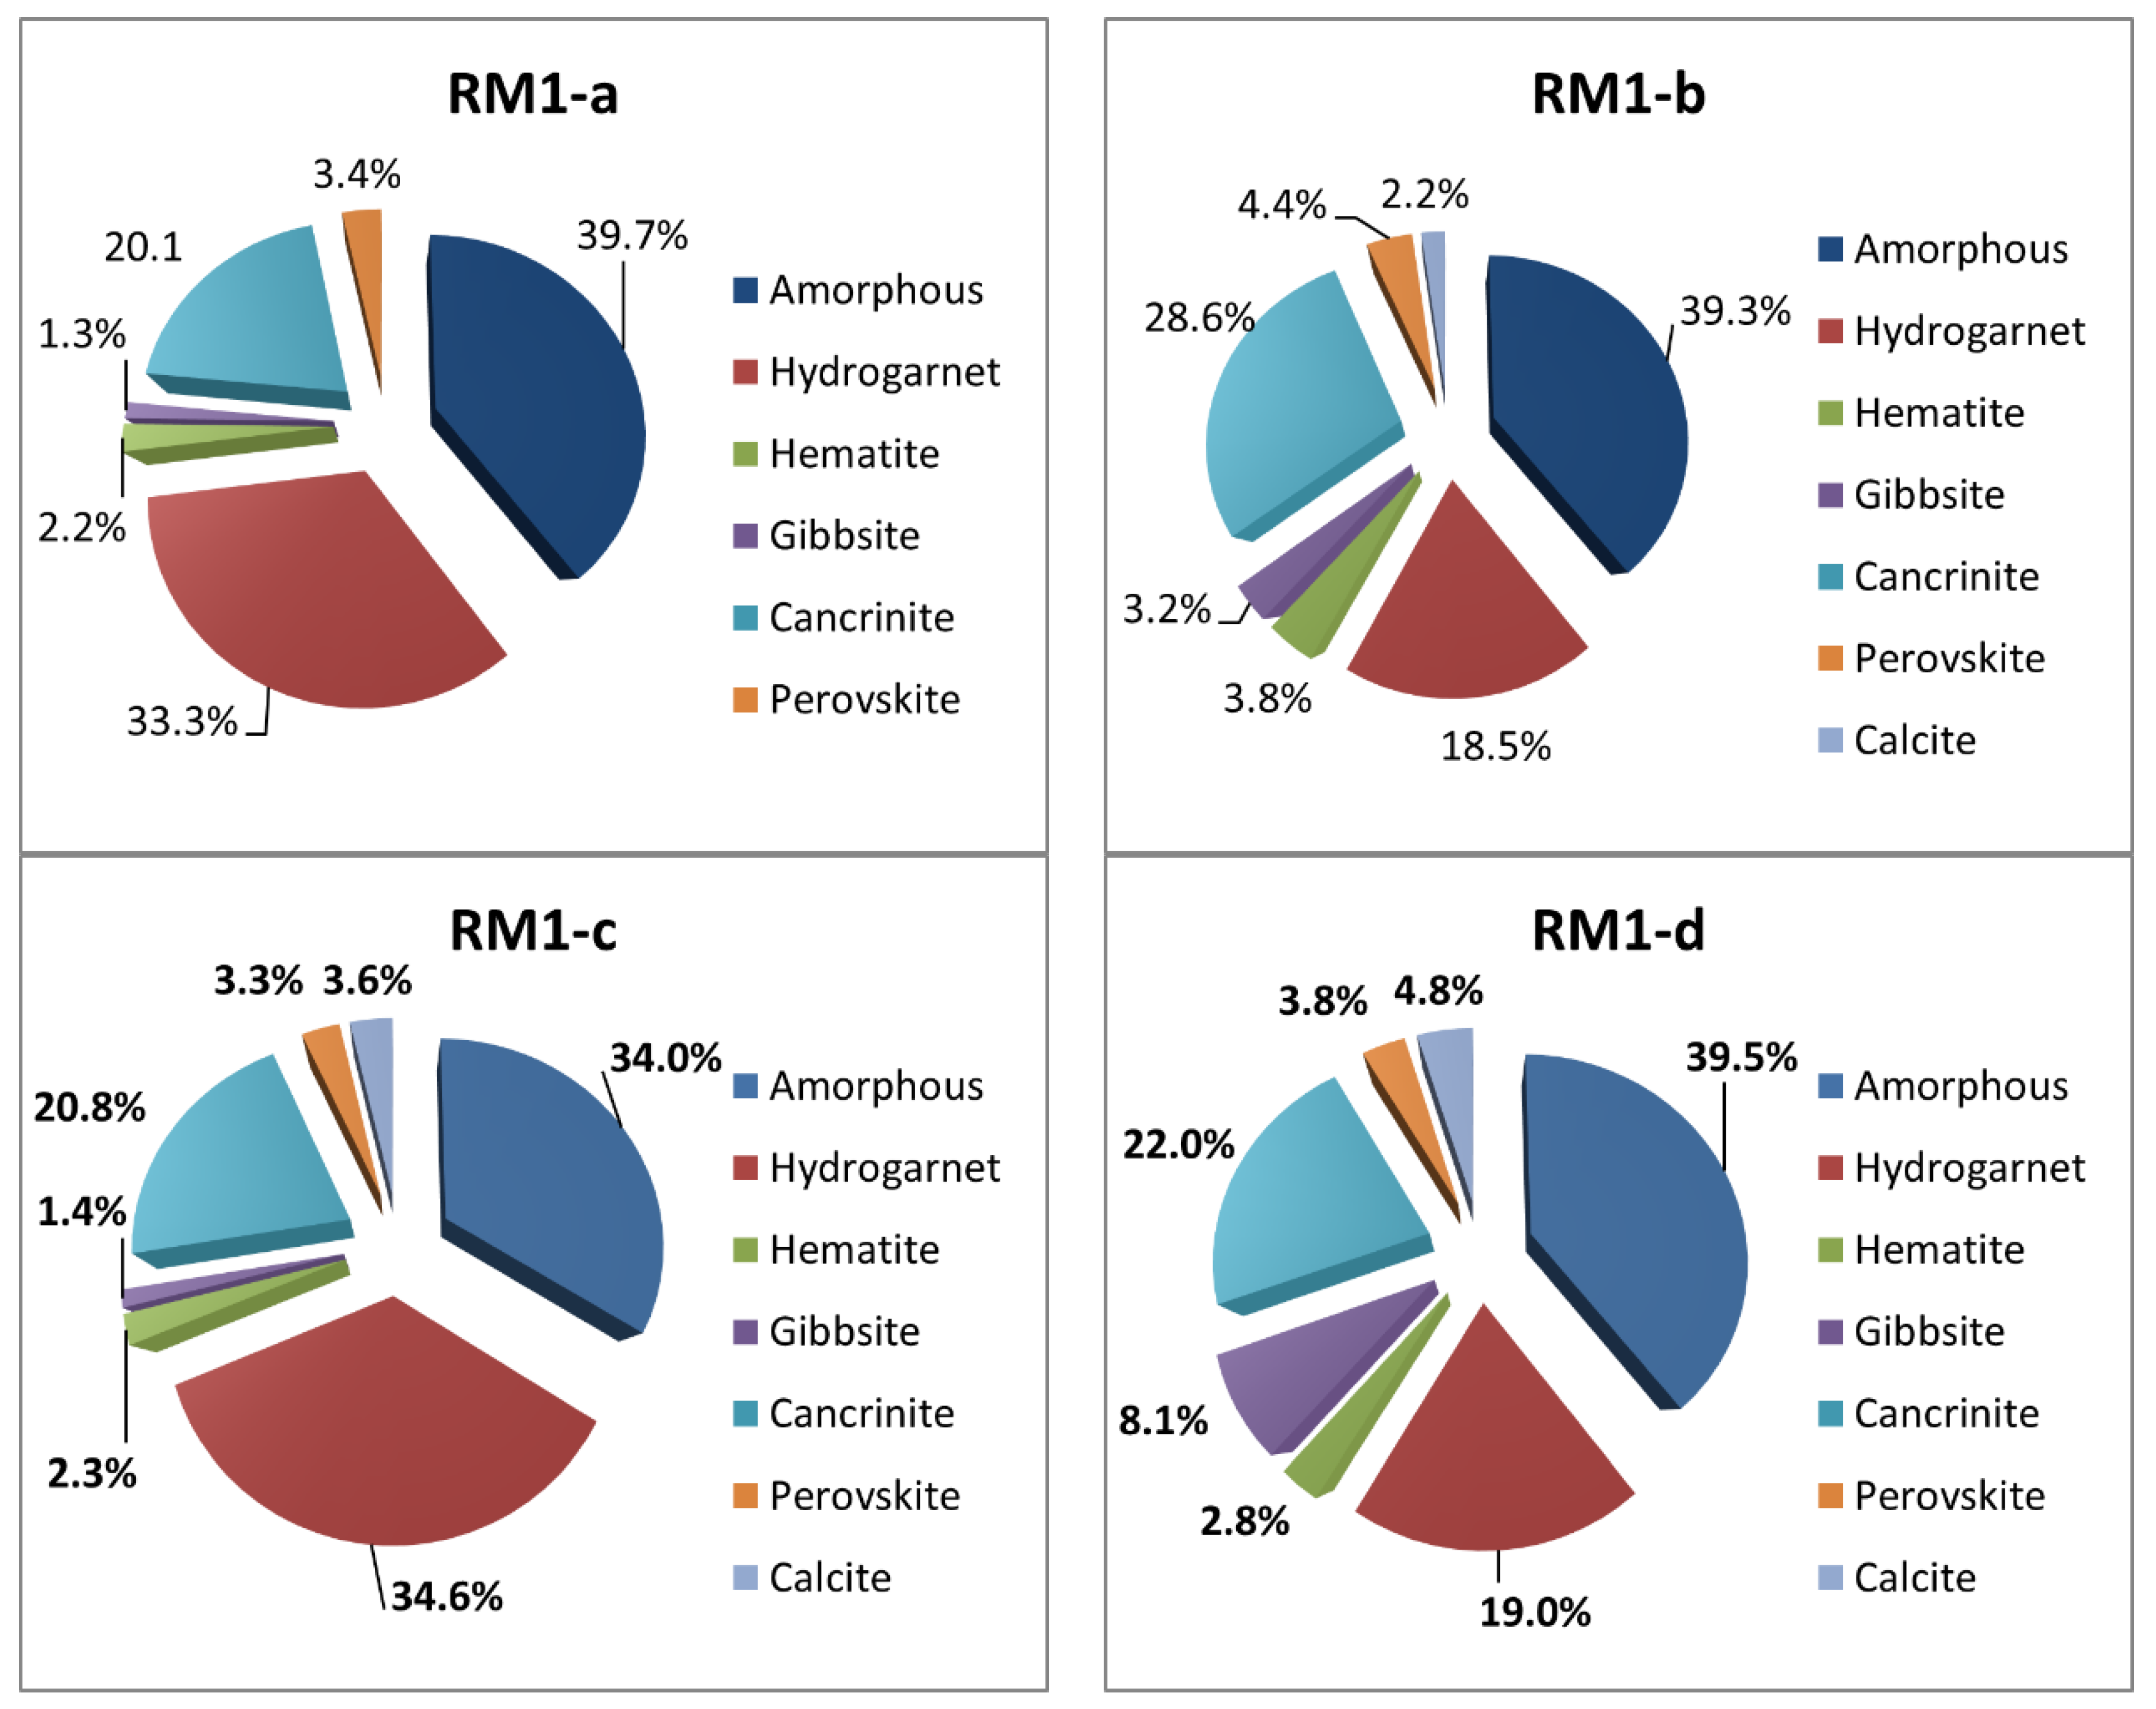
Figure 8 illustrates the quantitative proportions of distinctive crystals detected in samples RM1-a to RM1-d. Although the source ore bauxite of these four red muds was the same, minerals with different proportions appeared in these substances after the aluminum extraction process. The difference could be attributed to the different concentrations of sodium used by various plants. However, the thought-provoking point in the phase analysis of RM1-a to RM1-d is that Hydrogarnet (Ca3Al2(SiO4)3−x(OH)4x) and Cancrinite (Na6Ca2[(CO3)2|Al6Si6O24]·2H2O) are the primary phases of these materials. The total percentages of these two crystals are 88%, 78%, 84%, and 68% of the whole non-amorphous phase for RM1-a to RM1-d, respectively. The hardness of Hydrogarnet is 7–7.5, and is 5–6 for Cancrinite on the Mohs scale. Perovskite (CaTiO3) and Hematite (Fe2O3) with the Mohs hardness of 5–5.5 and 5–6.5 are the minor minerals that retain their mineralogical properties after alkali activation.
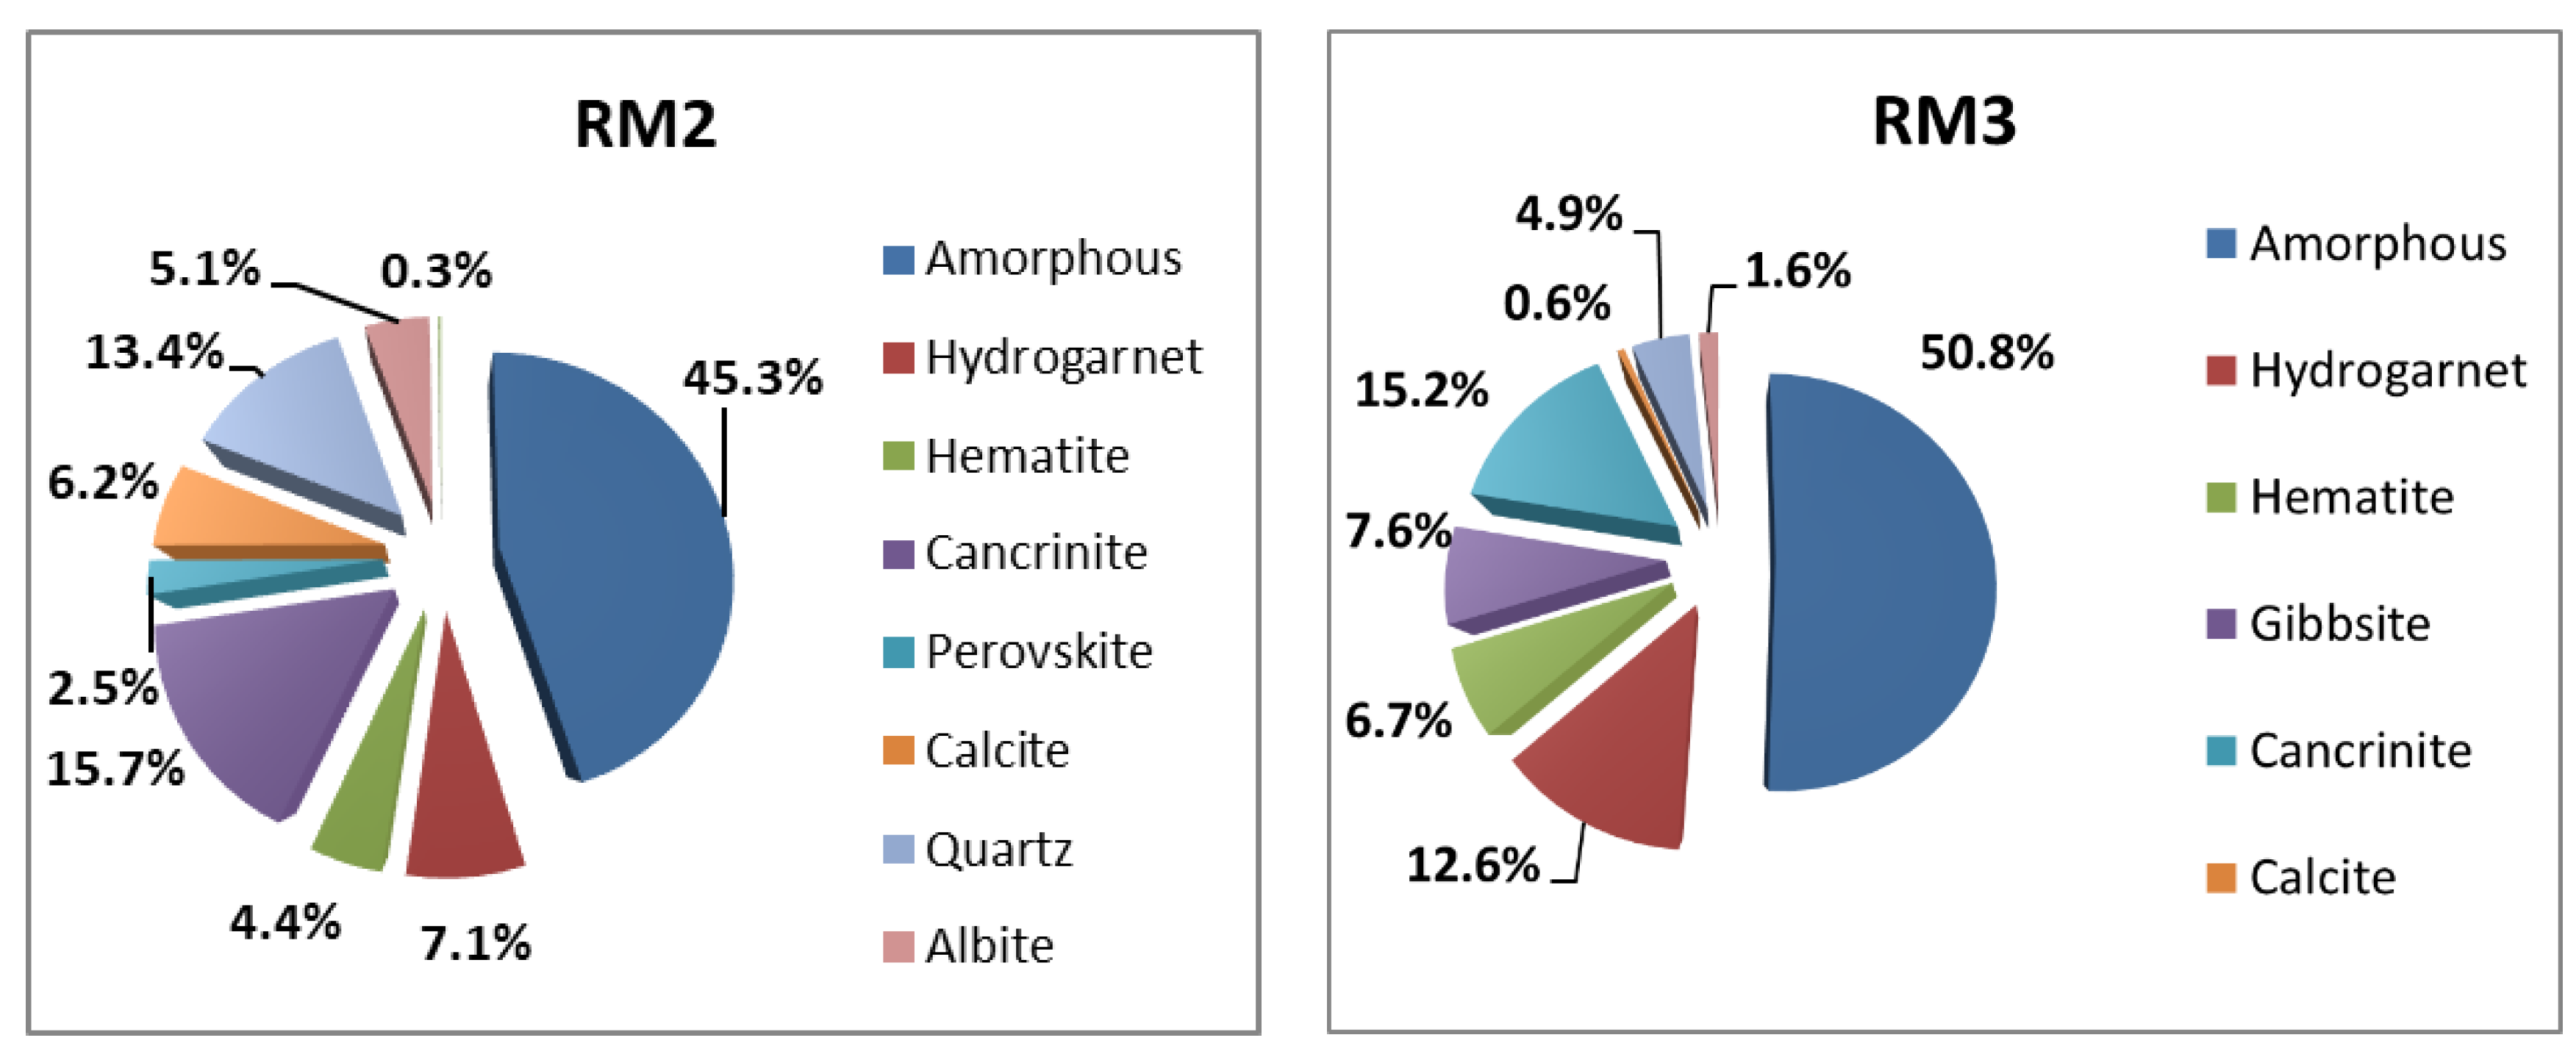
Figure 9 demonstrates different crystalline phases, as well as the total amorphous phases in samples RM2 and RM3. In RM2, Quartz (SiO2), albite (NaAlSi3O8), Cancrinite, Hydrogarnet, Hematite, and perovskiteare are solid phases of this type of RM. The hardness of Quartz is 7, and is 5–6.5 for Albite. The total percentage of the aforementioned hard crystals accounts for 80% of the total crystalline materials in RM2. Magnesio-foitite and anatase polymorph (TiO2), with the hardness of 7 [23] and 5.5–6 [24], respectively, are distinct stable crystals in RM3 in addition to Cancrinite, Hydrogarnet, and Hematite. The sum of these hard minerals comprises 83% of the RM3’s crystalline structure.
The relatively high hardness of the crystalline phases indicates that even if the red mud could not participate in the alkali-activation process, the crystals would still serve as strong and durable micro-fillers in the matrix. The comparison between the hardness of granite (with a compressive strength as high as 131 MPa), which is 6–6.5, and the hardness of the aforementioned crystals supports the hypothesis.
Small amounts of crystals are also available in RM samples that activators could ionize. Gibbsite (ɣ-Al(OH)3) with a hardness of 2.5–3 is an aluminum hydroxide mineral that originated from bauxite. Depending on the type of RM used in this study, small proportions (1–8%) of gibbsite from the extraction process were formed. Although Koshy et al. [25] concluded that this mineral could negatively influence the strength development of their samples, this does not seem to be the case in the present study. The reason may be that a transformation of Gibbsite to Boehmite (ɣ-AlOOH with the hardness of 3.5) occurs in environments with high pH, such as AAMs. The transformation is evidenced in previous studies [26] and in Section 3.4 of this study.
Furthermore, the amount of Gibbsite in the RM samples is low enough to have little interference in the alkali-activation process. Moreover, Humed et al. [27] reported that the dissolution of Calcite and its replacement with C-A-S-H is possible, resulting in higher ultimate compressive strength. The formation of C-A-S-H as a minor product of alkali activation is also investigated in Section 3.4.
It is reasonable to conclude that most RM crystals are hard and stable in high alkaline environments. Therefore, increasing the concentration of activators to dissolve these crystals to contribute to the alkali activation is not necessary and may lead to the following undesirable consequences. Firstly, higher levels of activators will increase costs since they are the most expensive ingredients in AAMs. Secondly, efflorescence problems may occur, which is more likely in the case of low-strength mixes with a porous and open microstructure [28,29,30]. Thirdly, an overdosage of strong alkali-activators, such as sodium and potassium hydroxide (at high concentration), and low water content could lead to flash setting [31,32]. Lastly, high levels of alkalis in the pore solution may lead to a significant expansion in alkali–silica reactions (ASRs) [33].

3.2. Quantitative Vitreous Phase Identification

Table 5 tabulates the quantitative phase analysis of the RM samples. The table does not show components of less than 1% by mass. Because of the high hardness of the above-mentioned crystals and the low concentration of sodium hydroxide in samples of this study, almost no Na+, Al3+, Ca2+, or Si4+ ions could be detached from the crystals and contribute to the formation of new products after the alkali-activation process. Therefore, only the vitreous phases of metal oxides from RMs might be involved in the alkali-activation process, and this assumption will be verified in Section 3.4.

Reactive Alumina (Al2O3), Silica (SiO2), and Calcium Oxide (CaO)

Although XRF results show that the percentage of Al2O3 is higher than 20%, in the RM1-a through the RM1-d samples, only 4.8% of the alumina is glassy. This means that for an RM1-a sample with 30% slag and 70% RM, the mix has only around 7% (0.3 × 12.05 (Table 2 for BFS) + 0.7 × 4.80) reactive alumina. So, it is expected to have a few percentages of aluminum-containing materials. RM2 and RM3 contain 9.4% and 6.2% of reactive alumina, respectively, and are expected to generate more N-A-S-H since RM2 and RM3 have more alumina compared to RM1-a through RM1-d.
Table 5 also shows quantitative amounts of silica for each RM sample. Samples RM1-a to RM1-d have 8.7% to 13.9% of glassy SiO2, while these portions are 5.3% and 4.1% for RM2 and RM3, respectively. Interestingly, despite acceptable amounts of SiO2 based on the XRF results, especially for RM2 with 28.3%, the major part of silica is crystalline and non-reactive. The amount of vitreous calcium oxide was limited to less than 10% in most cases, except for RM1-b and RM1-c with 11.7%. This means that RM-AAMs would be more reliant on slag to provide calcium in alkali activations. Section 3.3 will thoroughly discuss the prediction of the final products of RM-AAMs based on the reactive components of raw materials using a ternary diagram.

3.3. Prediction of Final Products of RM-AAMs Based on Reactive Components

Table 6 summarizes the mole percentages of total reactive CaO, SiO2, and Al2O3 in each mix design. The subsequently listed steps were taken to arrange this table.
  • Step 1: Based on the mix proportions of each sample, the total mass values of H2O, SiO2, Al2O3, CaO, and Na2O are computed. For example, the mass values of glassy silica in RM, slag, and sodium silicate (in solution or solid form) are accumulated for SiO2;
  • Step 2: The quantities obtained in the previous step are then divided by the molar mass of each oxide or water.
  • Dividing the results of Step 2 by the total molarity and then multiplying them by one hundred leads to the mole percentage of each oxide.
Garcia-Lodeiro et al. [34] used the precipitation–dissolution approach to study the compatibility of C-A-S-H and N-A-S-H. Different aqueous solutions were prepared using NaOH, Al(OH)3, SiO2, and Ca(OH)2 to prepare sodium aluminate, sodium silicate, and calcium hydroxide. They plotted a ternary diagram to illustrate different possible final products of alkali activation for various compositions (mol.%) of CaO, SiO2, and Al2O3.
Based on Table 6, the CaO/SiO2 ratio is between 0.68 and 1.29, and the Al2O3/SiO2 ratio is in the range of 0.09–0.41. Figure 6 also illustrates the ternary plot based on the total reactive silica, alumina, and calcium oxide in the present study. By adapting the ternary diagram in Figure 10 and the findings of Garcia-Lodeiro et al. [34], the prediction of the main product(s) in the RM-AAMs system is possible. In the highlighted area, red stars in the green circle, in Figure 10, the main product is C-(A)-S-H in which the C-(A)-S-H composition ranges from C1.94SHx to C1.94A0.06SHx, depending on the availability of alumina. Although the cited research did not predict the final products, it can be used as a basic guideline by analyzing the proportions of reactive SiO2, CaO, and Al2O3. Various factors influence the formation of reaction products, such as reaction kinetics and alkalinity. However, the proposed methodology would predict major reaction products. More details in the following sections will be discussed to illustrate the accuracy of this hypothesis.

3.4. XRD Analysis of Final Products

X-ray powder diffraction was employed to study the effects of different types of sodium silicate as the source of soluble silica on mechanical properties of RM-based AAMs. X-ray powder diffraction may provide an insight into the microstructural analysis, which helps explain why samples with different types of soluble silicate could achieve different strengths.
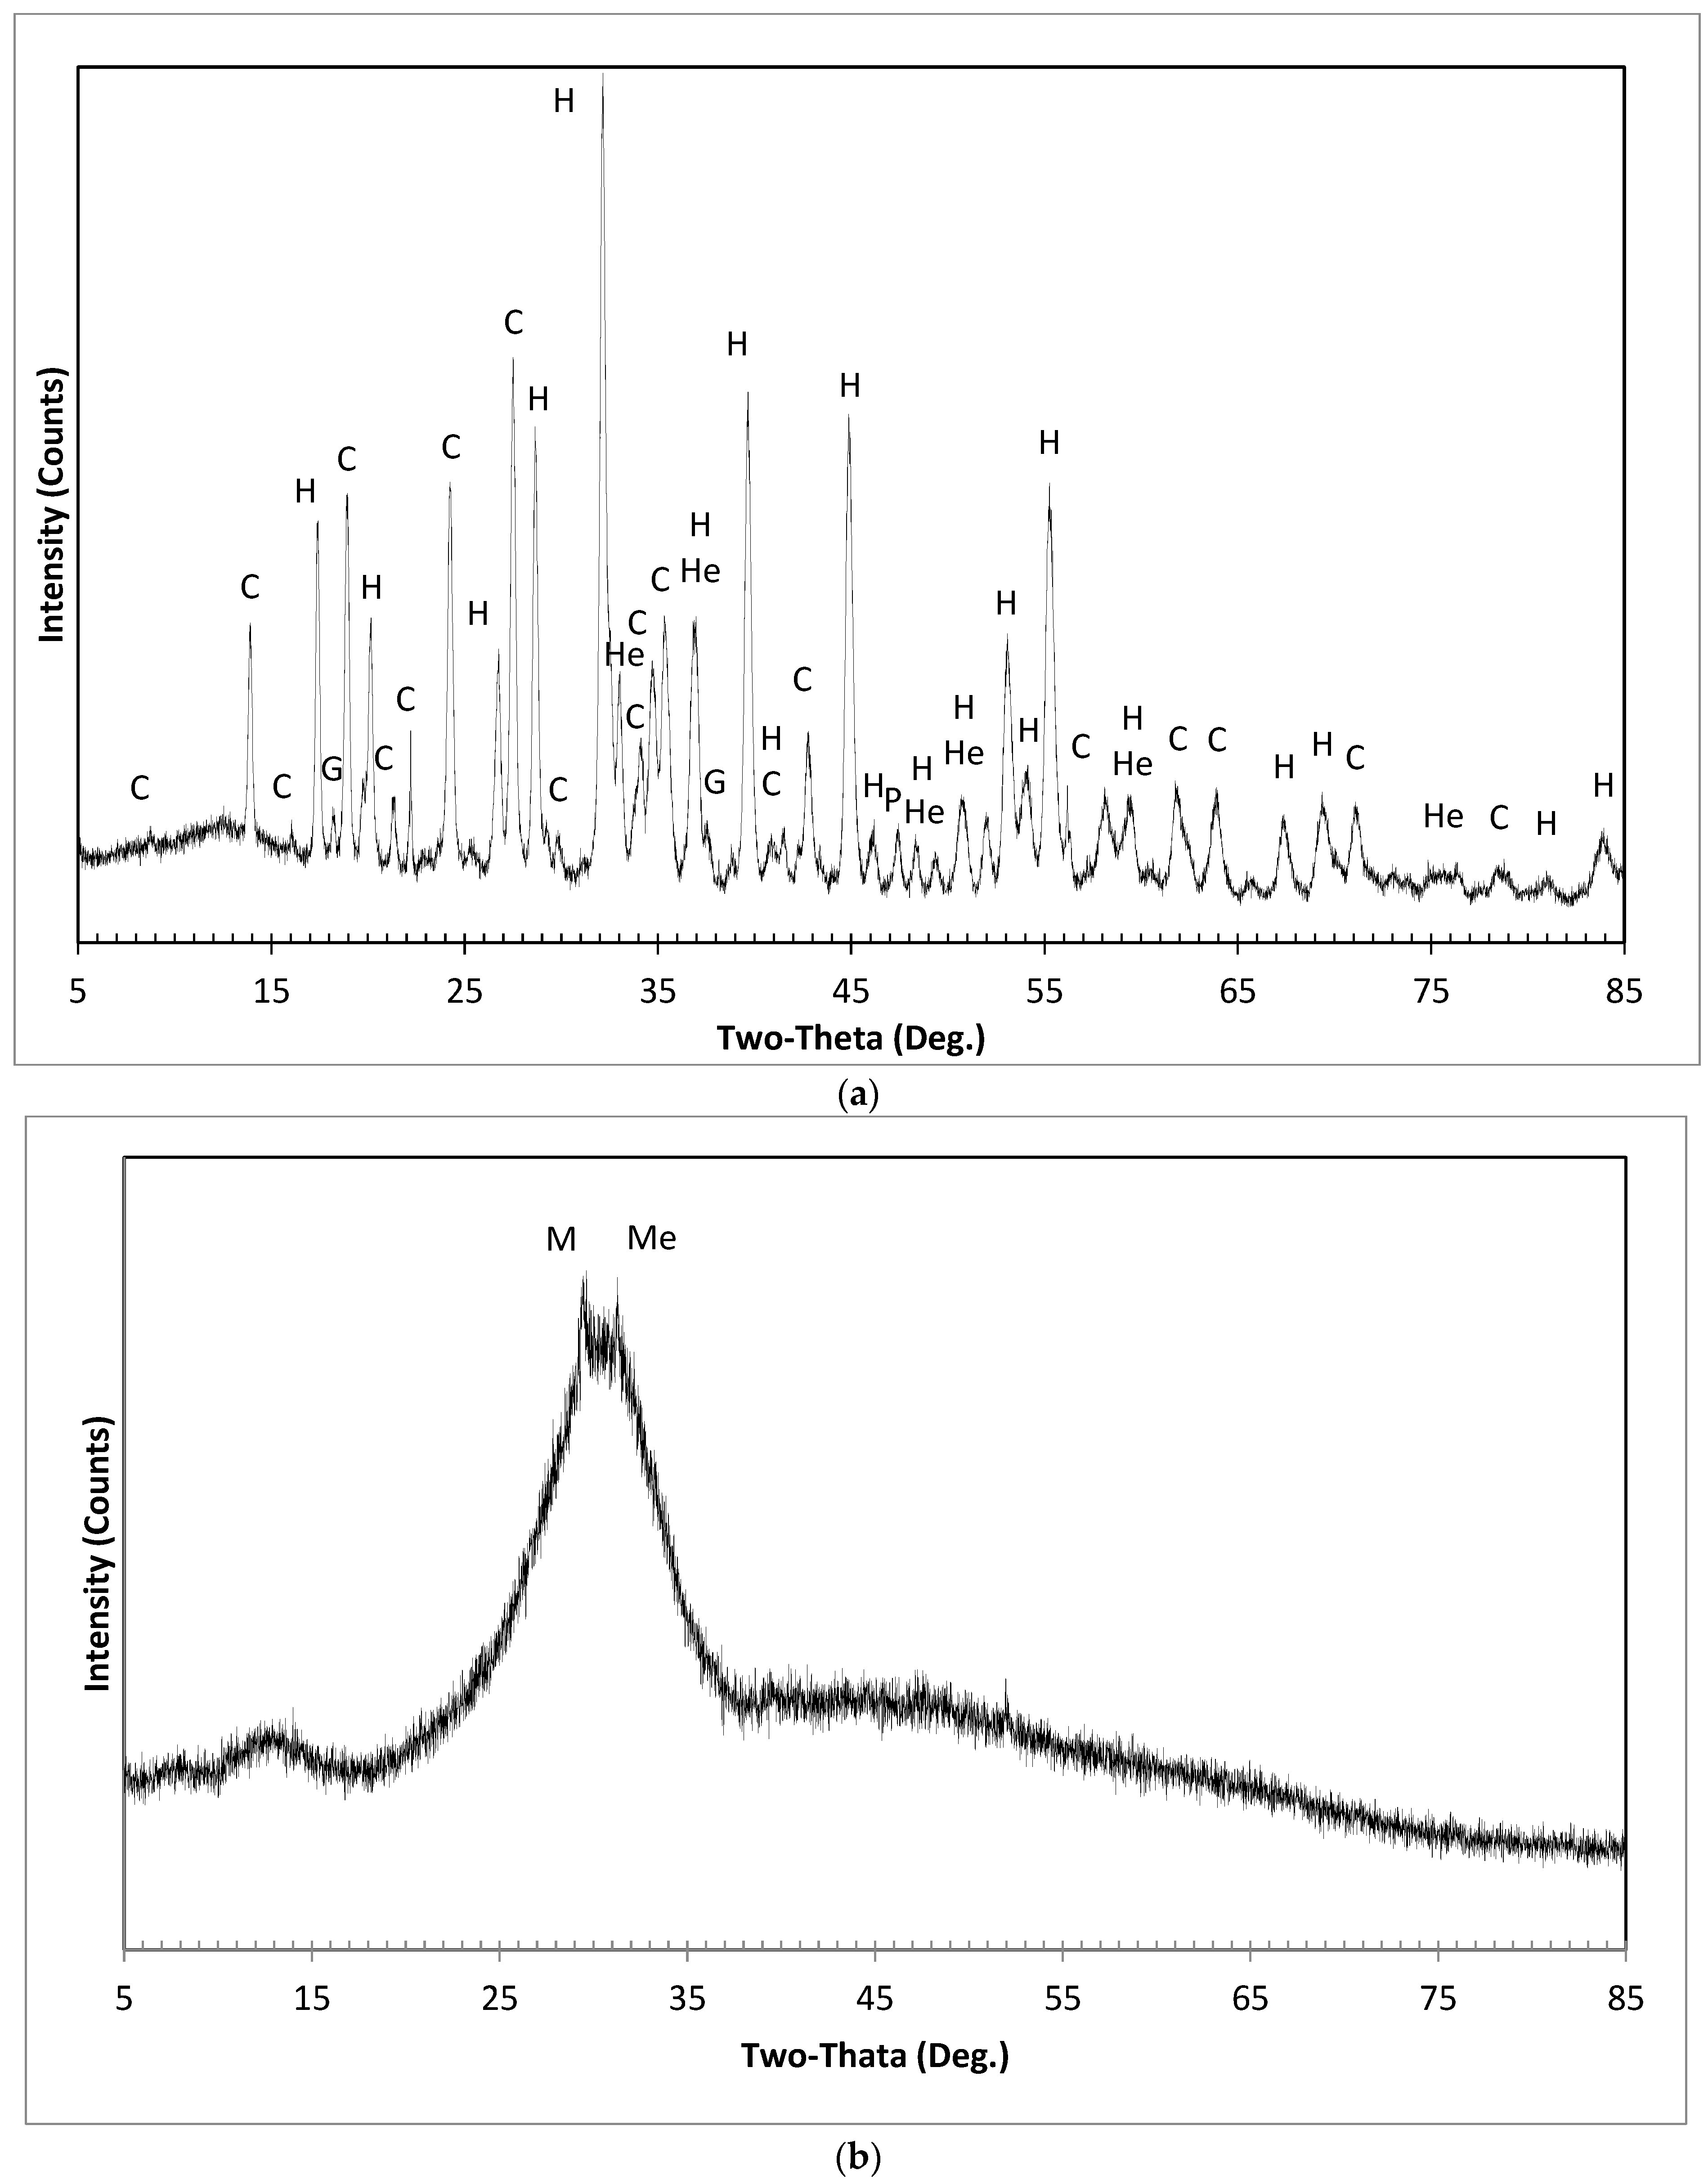
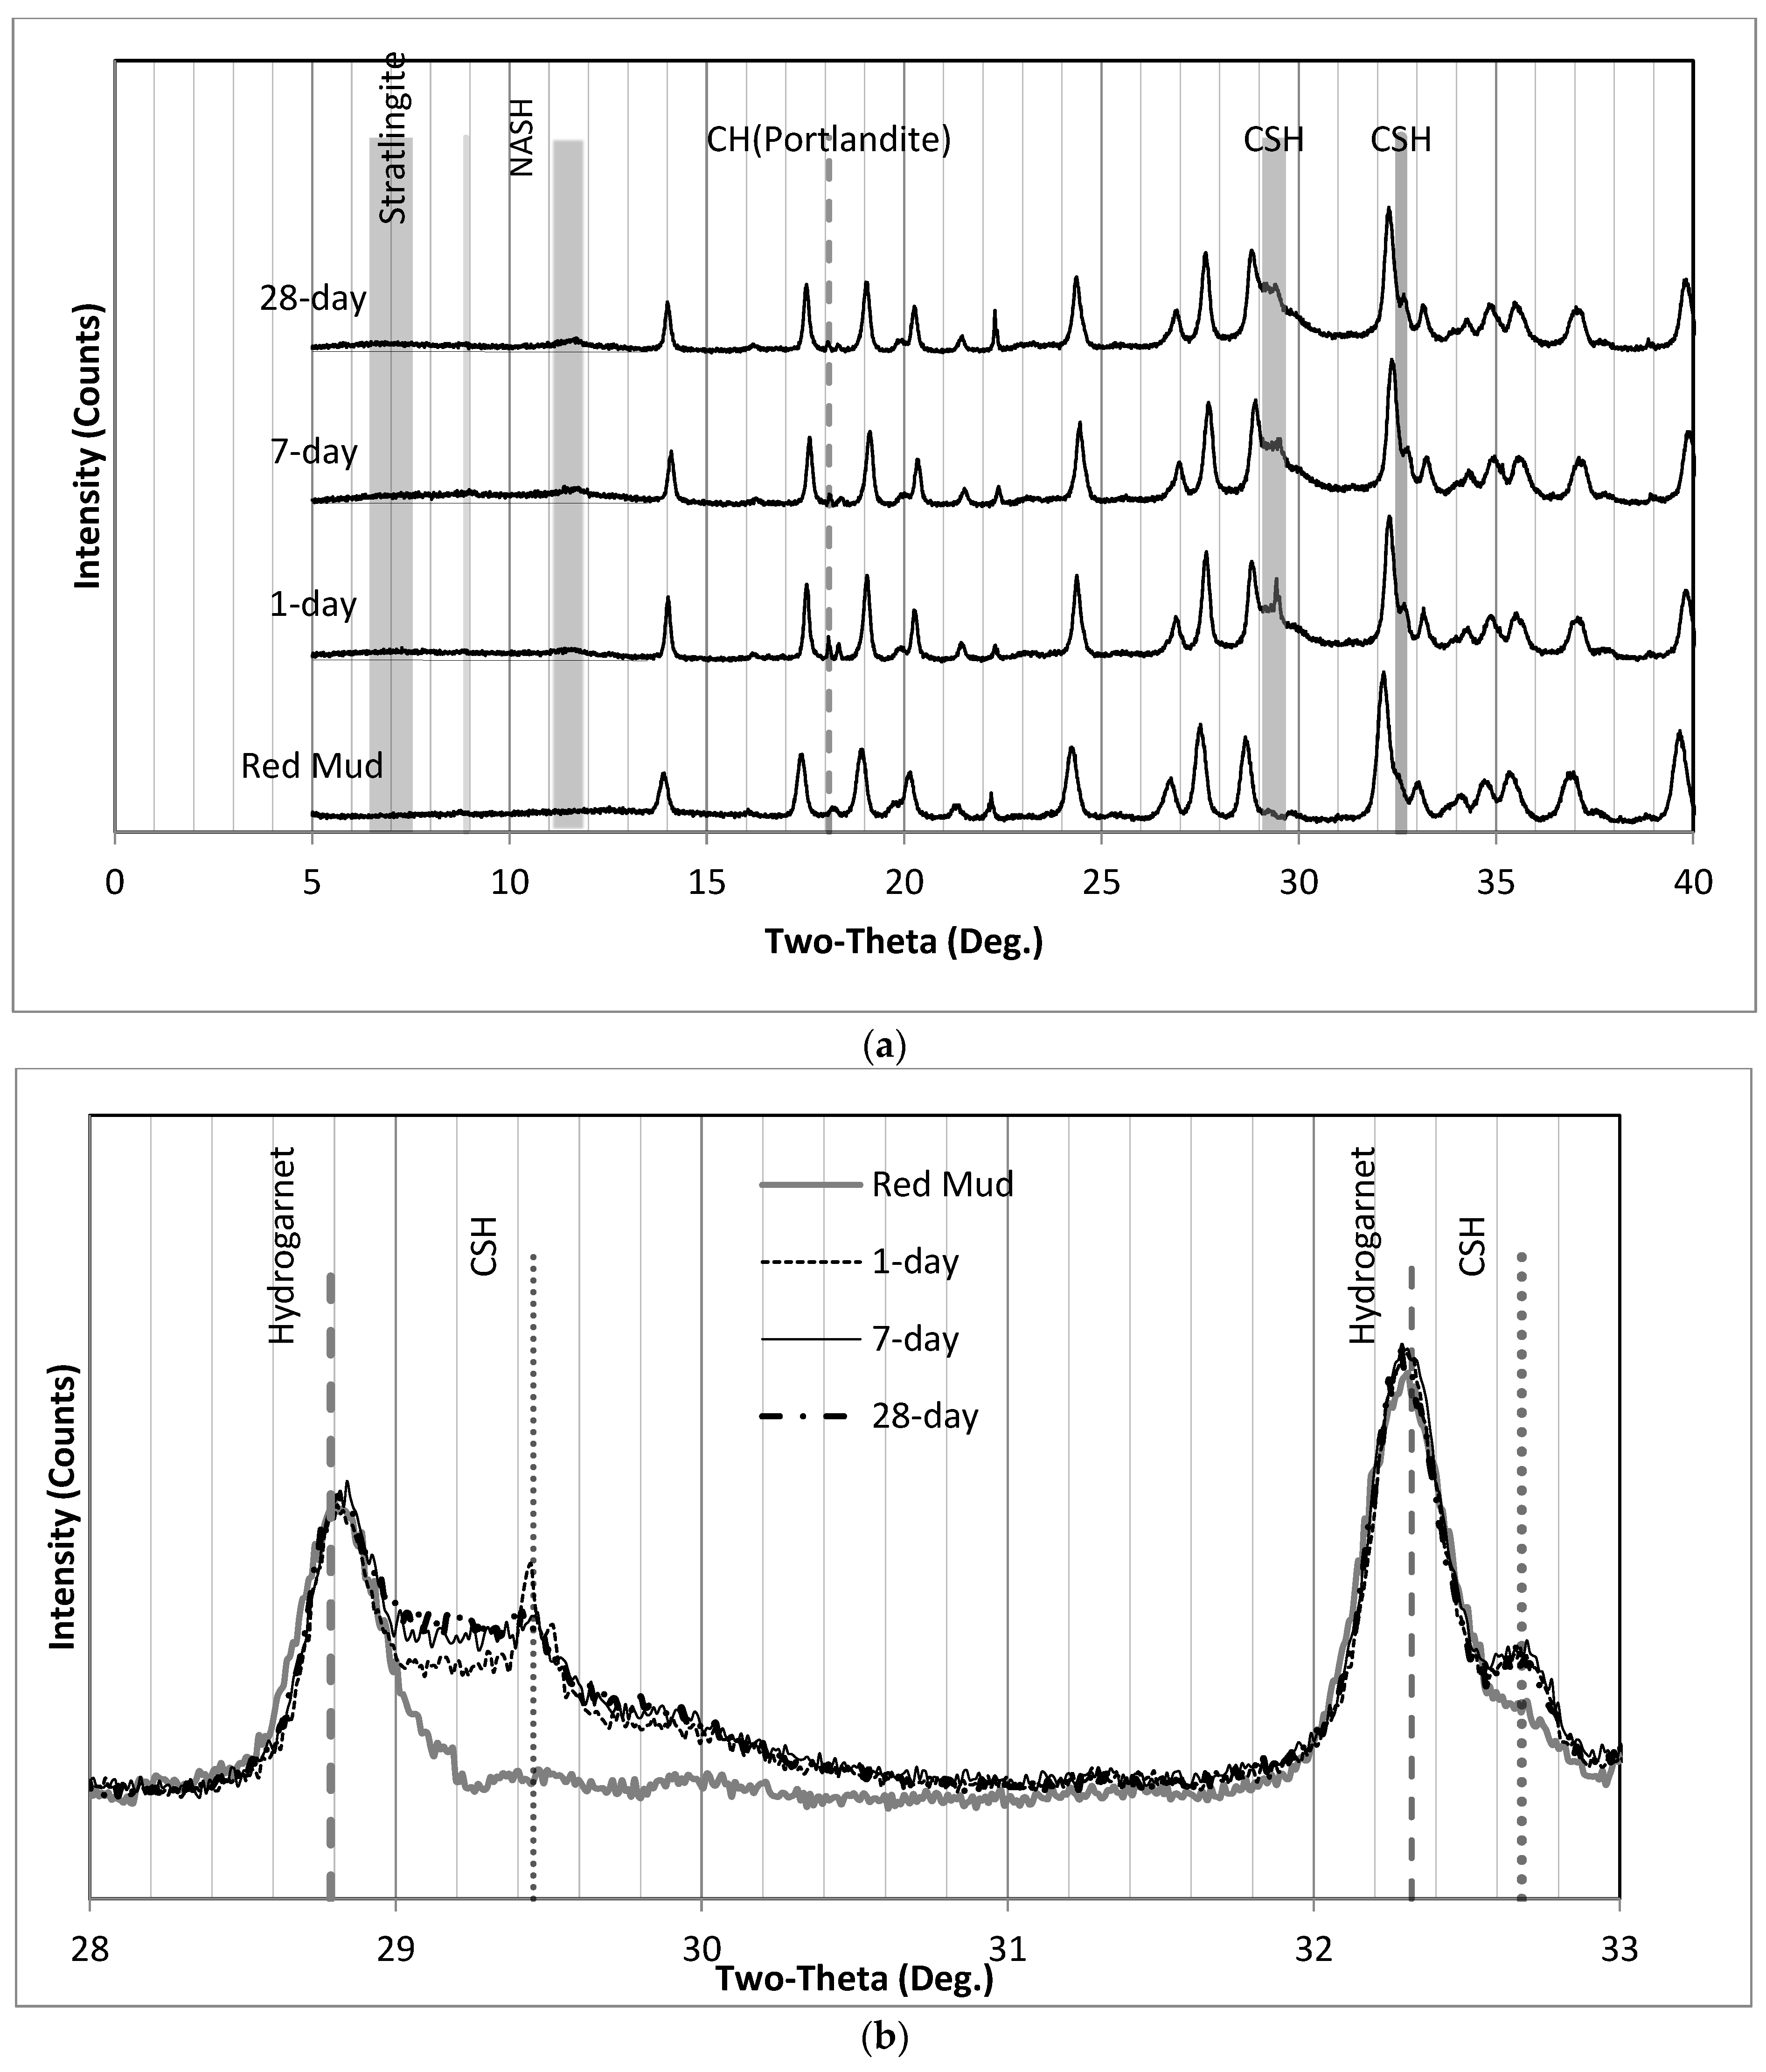
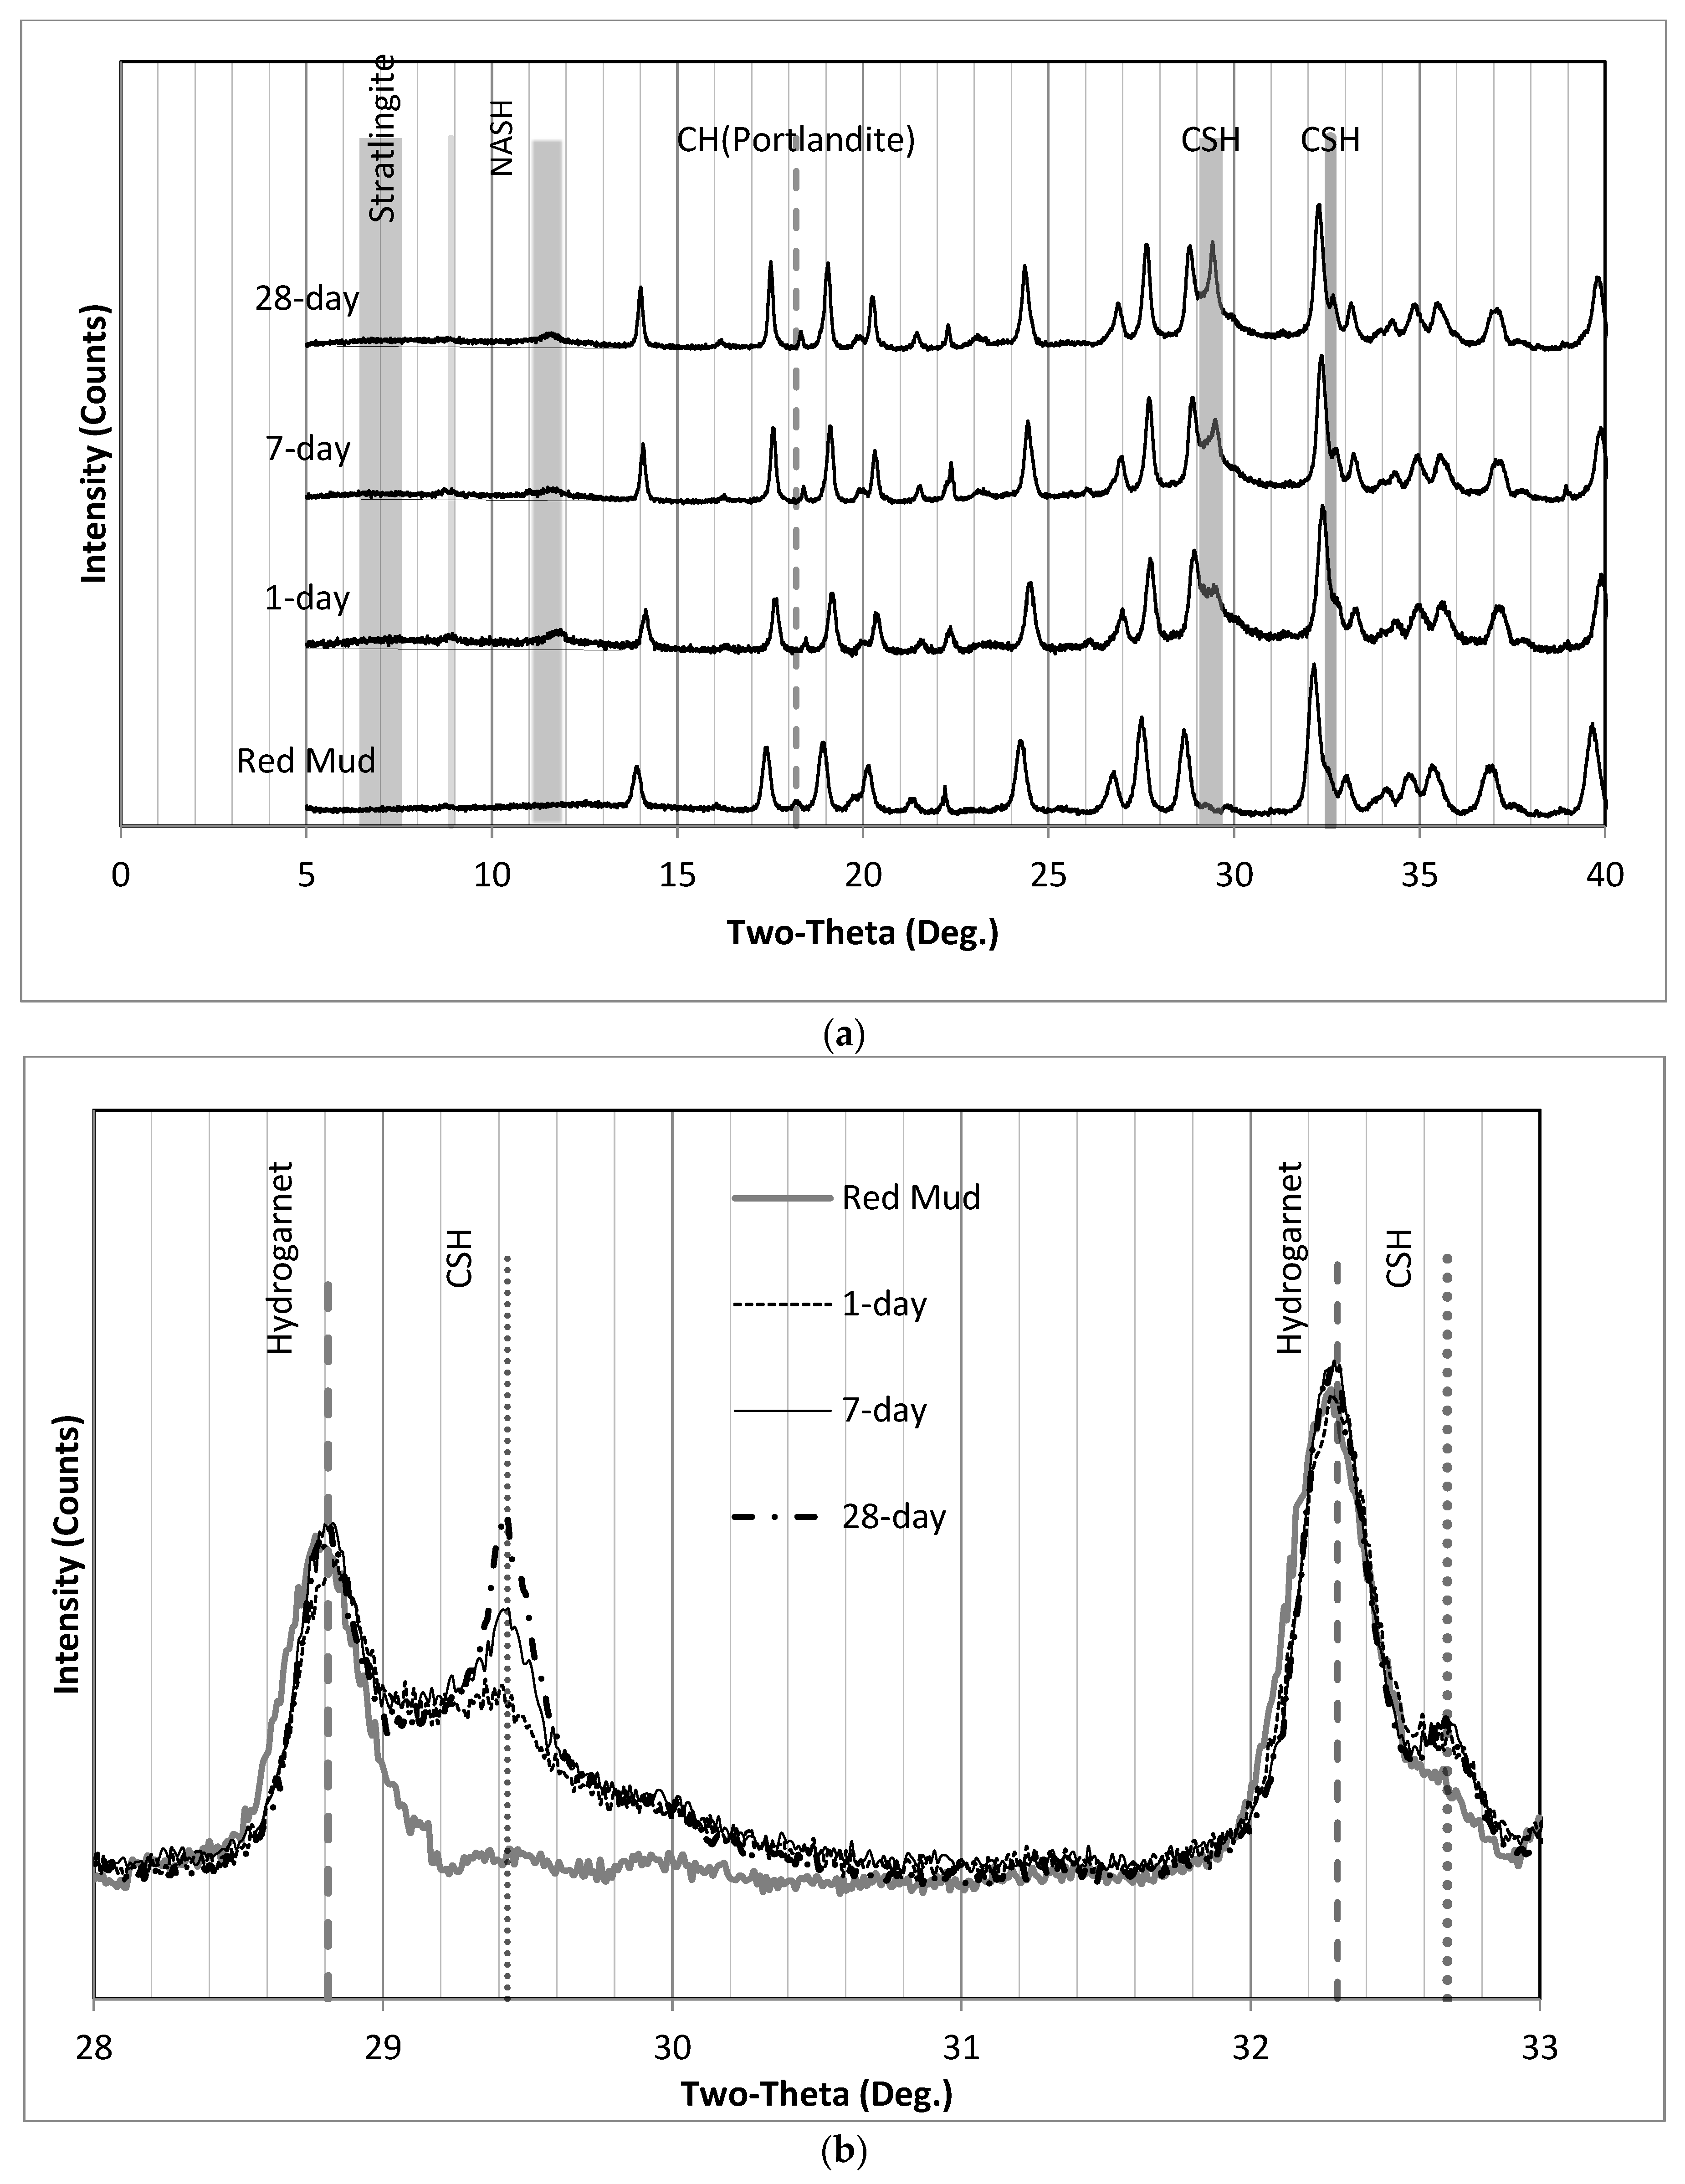
Figure 11a,b shows the XRD patterns of RM1 and slag as raw materials. X-ray powder diffraction patterns of hardened paste samples after 1, 7, and 28 days are illustrated in Figure 12, Figure 13, Figure 14 and Figure 15 for mixes SS1P1, SS1P2, SS2.1, and SS3, respectively. The X-ray powder diffraction pattern of RM1 is shown at the bottom of each figure to better distinguish new crystals and humps in comparison to phases remained unchanged from the RM.
Figure 12a demonstrates the XRD patterns of SS1P1, which basically shows no changes after 2ϴ = 40°. Therefore, the illustration limits were set to 0° to 40° in Figure 12b to better illustrate the differences. The only peak attributed to Portlandite (Ca(OH)2) not hidden by the RM peaks is at 18.3° and is labeled “CH (Portlandite)”. The appearance of this CH peak is most evident on the 7-day chart, where it goes up on top of the Gibbsite peak from RM. While for the 28-day chart, the intensity of CH decreased, which possibly turned into C-S-H (as broad humps on 29.4° and 32.6°). These asymmetrical maxima of C-S-H are similar to the disordered layered structure of tobermorite [35].
The broad peak at 7° shows the formation of amorphous Stratlingite, which is also known as Gehlenite hydrate (Ca2Al2SiO7·8H2O). It is well known as C-A-S-H in the literature. The structures of amorphous halos centered at 8.9° and 11.5° are assigned to N-A-S-H (Na3.06Al7.2Si40.8H4.14O96). C-A-S-H and N-A-S-H are the two main components of AAMs.
Figure 12c shows two broad peaks at both 29.3° 2ϴ and 32.6° 2ϴ associated with the formation of C-S-H, the nano-crystalline calcium silicate hydrate. The XRD pattern of RM could be used as a baseline to help compare phase changes after alkali activation. According to published XRD patterns, since the reactive Ca/Si ratios range between 0.68 to 1.29, the XRD pattern on these peaks is expected to be fully compatible with nanocrystalline and turbostratic tobermorite [35].
Similarly, the XRD patterns of SS1P2 are illustrated in Figure 13. The only difference between SS1P1 and SS1P2 is the sequence of mixing. Sodium silicate in solid form had a chance to dissolve first in solution SS1P1. A small peak of CH appeared immediately after the concrete hardened in the 1-day sample, and the intensity decreased in the 7-day sample and remained relatively unchanged in the 28-day sample. Regarding the C-S-H asymmetric broad peak at 29.2° 2ϴ, which can be seen more clearly in Figure 13b, a sharp peak occurred in the 1-day curve and then hid under the hump that went up in the 7-day and 28-day curves.
Figure 10 and Figure 15 illustrate the XRD results of SS2.1 and SS3. The formation of C-S-H after 7 days was faster in the SS2.1 samples compared with SS3 specimens. Upon inspection, it can be seen in Figure 14b that the intensity of 7-day samples at 29.2° 2ϴ has not changed significantly compared with the 28-day samples. This figure may explain why for the SS2.1 samples, the major proportion of the strength had been achieved by the end of the seventh day.
In Figure 15, while the intensity of the XRD results at 29.2° 2ϴ was very low after 1 day, the intensity increased after 7 days and again on the 28th day. This increase in the peak of the C-S-H over time suggests that the Ca/Si ratio may not been suitable initially. However, more dissolved calcium became available after 7 days to form more C-S-H with highly soluble silica available in the SS3 samples.

4. Conclusions

This study employed a new method to predict final products of red mud-slag-based alkali-activated materials (RM-AAMs) using comprehensive phase analysis. Different types of red mud samples have been investigated to evaluate their potential as the precursor for alkali-activated materials (AAMs), and the following conclusions can be drawn based on results presented in this investigation:
  • Although the XRF results present general ideas about the chemical compositions of precursors, AAMs should not be designed solely based on XRF analysis. A quantitative method could be employed to optimize the mix design of AAMs;
  • A quantitative crystalline phase analysis of RM samples could identify various crystals along with mass percentages. Information about types and hardness of these crystals could help in understanding whether certain crystals may contribute in alkali-activation reactions (AARs). Increasing the concentrations of alkali solutions to dissolve the aforementioned crystals in the RM samples could unnecessarily increase material costs and adversely affect mechanical properties;
  • Certain RM may contain hard crystals that can be considered micro-fillers and may enhance the mechanical properties of AAMs;
  • A quantitative amorphous phase analysis of RM samples could be used to identify essential components for alkali-activation reactions, including the percentages of reactive calcium, silica, and alumina. Reasonably accurate estimations of the final products of AARs could be possible with the help of this information.
  • A ternary diagram based on the total concentration of reactive CaO, SiO2, and Al2O3 can be created after a quantitative analysis of the crystalline and amorphous phases of the precursors for AAMs, such as RM and slag. This diagram could help predict the final products of alkali-activation;
  • The new analysis technique for RM samples presented in this paper could successfully predict final product types, which is critical in optimizing the mix proportions of RM-slag-based AAMs;
  • Depending on the amount of reactive alumina in RM samples, the formation of N-A-S-H and C (A)-S-H traces in the final products of AARs is possible. However, C-S-H was the major product of RM-slag-based AAMs for this study, which controls the mechanical properties of the AAM samples.
  • Since the nanocrystals of C-S-H contribute to strength development, the Ca/Si ratio should be optimized in the design of AAMs based on RM, slag, and alkalis. Through the optimization process the amount of soluble silica, which would be available in sodium silicate solutions, is critical and should be considered in the calculation of Si.

Author Contributions

Conceptualization, L.S. and R.M.; methodology, R.M. and L.S.; software, R.M.; validation, R.M. and L.S.; formal analysis, R.M.; investigation, R.M. and L.S.; resources, L.S.; data curation, R.M.; writing—original draft preparation, R.M.; writing—review and editing, L.S., R.M. and J.H.; visualization, R.M.; supervision, L.S.; project administration, L.S.; funding acquisition, L.S. All authors have read and agreed to the published version of the manuscript.

Funding

This research was funded by Hawaii Department of Transportation—TA 2013-3R.

Institutional Review Board Statement

Not applicable.

Informed Consent Statement

Not applicable.

Data Availability Statement

All data has been included in the context of the manuscript.

Conflicts of Interest

The authors declare no conflict of interest.

References

  1. Kaußen, F.M.; Friedrich, B. Phase Characterization and Thermochemical Simulation of (Landfilled) Bauxite Residue (“Red Mud”) in Different Alkaline Processes Optimized for Aluminum Recovery. Hydrometallurgy 2018, 176, 49–61. [Google Scholar] [CrossRef]
  2. Provis, J.; van Deventer, J. (Eds.) Alkali Activated Materials State-of-the-Art Report, RILEM TC 224-AAM, 1st ed.; Springer: Dordrecht, The Netherlands, 2014; ISBN 978-94-024-0278-0. [Google Scholar]
  3. Davidovits, J. Geopolymers-Inorganic Polymeric New Materials. J. Therm. Anal. 1991, 37, 1633–1656. [Google Scholar] [CrossRef]
  4. Shi, C.; Roy, D.; Krivenko, P. Alkali-Activated Cements and Concretes, 1st ed.; CRC Press: London, UK, 2003; ISBN 9781482266900. [Google Scholar]
  5. Buchwald, A.; Kaps, C.; Hohmann, M. Alkali-Activated Binder and Pozzolan Cement Binders-Compete Reaction or Two Side of the Story? In Proceedings of the 11th International Congress on the Chemistry of Cement (ICCC), Durban, South Africa, 11–16 May 2003; pp. 1238–1246. [Google Scholar]
  6. Li, Y.; Shen, L.; Mirmoghtadaei, R.; Ai, L. A Design of Experiment Approach to Study the Effects of Raw Material on the Performance of Geopolymer Concrete. Adv. Civ. Eng. Mater. 2017, 6, 20160007. [Google Scholar] [CrossRef]
  7. Wagh, A.; Douse, V. Silicate Bonded Unsintered Ceramics of Bayer Process Waste. J. Mater. Res. 1991, 6, 1094–1102. [Google Scholar] [CrossRef]
  8. Dimas, D.D.; Giannopoulou, I.P.; Panias, D. Utilization of Alumina Red Mud for Synthesis of Inorganic Polymeric Materials. Miner. Process. Extr. Metall. Rev. 2009, 30, 211–239. [Google Scholar] [CrossRef]
  9. Sun, W.; Feng, X.; Zhao, G. Effect of Distortion Degree on the Hydration of Red Mud Base Cementitious Material. J. Coal Sci. Eng. 2009, 15, 88–93. [Google Scholar] [CrossRef]
  10. Kumar, A.; Kumar, S. Development of Paving Blocks from Synergistic Use of Red Mud and Fly Ash Using Geopolymerization. Constr. Build. Mater. 2013, 38, 865–871. [Google Scholar] [CrossRef]
  11. Pan, Z.; Cheng, L.; Lu, Y.; Yang, N. Hydration Products of Alkali-Activated Slag-Red Mud Cementitious Material. Cem. Concr. Res. 2002, 32, 357–362. [Google Scholar] [CrossRef]
  12. Krivenko, P.; Kovalchuk, O.; Pasko, A.; Croymans, T.; Hult, M.; Lutter, G.; Vandevenne, N.; Schreurs, S.; Schroeyers, W. Development of Alkali Activated Cements and Concrete Mixture Design with High Volumes of Red Mud. Constr. Build. Mater. 2017, 151, 819–826. [Google Scholar] [CrossRef]
  13. Li, C.; Zhang, N.; Zhang, J.; Song, S.; Zhang, Y. C-A-S-H Gel and Pore Structure Characteristics of Alkali-Activated Red Mud–Iron Tailings Cementitious Mortar. Materials 2022, 15, 112. [Google Scholar] [CrossRef] [PubMed]
  14. Yuan, B.; Yuan, S.; Straub, C.; Chen, W. Activation of Binary Binder Containing Fly Ash and Portland Cement Using Red Mud as Alkali Source and Its Application in Controlled Low-Strength Materials. J. Mater. Civ. Eng. 2020, 32, 04019356. [Google Scholar] [CrossRef]
  15. Song, S.; Zhang, N.; Yuan, J.; Zhang, Y. New Attempt to Produce Red Mud-Iron Tailing Based Alkali-Activated Mortar: Performance and Microstructural Characteristics. J. Build. Eng. 2021, 43, 103222. [Google Scholar] [CrossRef]
  16. X-ray Diffraction (XRD) and Scattering. Available online: https://www.bruker.com/products/x-ray-diffraction-and-elemental-analysis/x-ray-diffraction.html (accessed on 1 June 2020).
  17. Day, N. Crystallography Open Database. Available online: http://www.crystallography.net/cod/ (accessed on 1 June 2020).
  18. XRD Software-DIFFRAC.EVA. Available online: https://www.bruker.com/products/x-ray-diffraction-and-elemental-analysis/x-ray-diffraction/xrd-software/eva/overview.html (accessed on 1 June 2020).
  19. Mirmoghtadaei, R.; Shen, L. Design of Alkali-Activated Materials Based on Quantitative Microanalysis of Precursors and Reaction Kinetics. Ph.D. Thesis, University of Hawai’i at Manoa, Manoa, HI, USA, 2020. [Google Scholar]
  20. Coelho, A.A. TOPAS and TOPAS-Academic: An Optimization Program Integrating Computer Algebra and Crystallographic Objects Written in C++. J. Appl. Crystallogr. 2018, 51, 210–218. [Google Scholar] [CrossRef]
  21. Li, X.; Snellings, R.; Scrivener, K.L. Quantification of Amorphous Siliceous Fly Ash in Hydrated Blended Cement Pastes by X-ray Powder Diffraction. J. Appl. Crystallogr. 2019, 52, 1358–1370. [Google Scholar] [CrossRef]
  22. Yip, C.K.; Lukey, G.C.; Provis, J.L.; van Deventer, J.S.J. Effect of Calcium Silicate Sources on Geopolymerisation. Cem. Concr. Res. 2008, 38, 554–564. [Google Scholar] [CrossRef]
  23. Hawthorne, F.C.; Selway, J.B.; Kato, A.; Matsubara, S.; Shimizu, M.; Grice, J.D.; Vajdak, J. Magnesiofoitite, (Mg2Al)Al6(Si6O18)(BO3)3(OH)4, a New Alkali-Deficient Tourmaline. Can. Mineral. 1999, 37, 1439–1443. [Google Scholar]
  24. Wikipedia Contributors Anatase. Available online: https://en.wikipedia.org/w/index.php?title=Anatase&oldid=920207787 (accessed on 1 June 2020).
  25. Koshy, N.; Dondrob, K.; Hu, L.; Wen, Q.; Meegoda, J.N. Mechanical Properties of Geopolymers Synthesized from Fly Ash and Red Mud under Ambient Conditions. Crystals 2019, 9, 572. [Google Scholar] [CrossRef]
  26. Gong, X.; Nie, Z.; Qian, M.; Liu, J.; Pederson, L.A.; Hobbs, D.T.; McDuffie, N.G. Gibbsite to Boehmite Transformation in Strongly Caustic and Nitrate Environments. Ind. Eng. Chem. Res. 2003, 42, 2163–2170. [Google Scholar] [CrossRef]
  27. Humad, A.M.; Provis, J.L.; Cwirzen, A. Alkali Activation of a High MgO GGBS-Fresh and Hardened Properties. Mag. Concr. Res. 2018, 70, 1256–1264. [Google Scholar] [CrossRef]
  28. Najafi Kani, E.; Allahverdi, A.; Provis, J.L. Efflorescence Control in Geopolymer Binders Based on Natural Pozzolan. Cem. Concr. Compos. 2012, 34, 25–33. [Google Scholar] [CrossRef]
  29. Škvára, F.; Kopecký, L.; Myšková, L.; Šmilauer, V.Í.T.; Alberovská, L.; Vinšová, L. Aluminosilicate Polymers-Influence of Elevated Temperatures, Efflorescence. Ceram.-Silik. 2009, 53, 276–282. [Google Scholar]
  30. Pacheco-Torgal, F.; Jalali, S. Influence of Sodium Carbonate Addition on the Thermal Reactivity of Tungsten Mine Waste Mud Based Binders. Constr. Build. Mater. 2010, 24, 56–60. [Google Scholar] [CrossRef]
  31. Lim, N.G.; Jeong, S.W.; Her, J.W.; Ann, K.Y. Properties of Cement-Free Concrete Cast by Finely Grained Nanoslag with the NaOH-Based Alkali Activator. Constr. Build. Mater. 2012, 35, 557–563. [Google Scholar] [CrossRef]
  32. Pacheco-Torgal, F.; Labrincha, J.; Leonelli, C.; Palomo, A.; Chindaprasit, P. Handbook of Alkali-Activated Cements, Mortars and Concretes; Elsevier Science & Technology: Kent, UK, 2014; ISBN 9781782422884. [Google Scholar]
  33. Bakharev, T.; Sanjayan, J.G.; Cheng, Y.B. Resistance of Alkali-Activated Slag Concrete to Acid Attack. Cem. Concr. Res. 2003, 33, 1607–1611. [Google Scholar] [CrossRef]
  34. Garcia-lodeiro, I.; Palomo, A.; Fernández-jiménez, A.; Macphee, D.E. Compatibility Studies between N-A-S-H and C-A-S-H Gels. Study in the Ternary Diagram Na2O-CaO-Al2O3-SiO2-H2O. Cem. Concr. Res. 2011, 41, 923–931. [Google Scholar] [CrossRef]
  35. Grangeon, S.; Linard, Y.; Chiaberge, C. X-ray Diffraction: A Powerful Tool to Probe and Understand the Structure of Nanocrystalline Calcium Silicate Hydrates Research Papers. Struct. Sci. Cryst. Eng. Mater. 2013, B69, 465–473. [Google Scholar] [CrossRef] [Green Version]
Figure 1. Grading curve of sand used in mortar samples.
Sustainability 15 03473 g001
Figure 2. Mortar sample mixing procedure: (a) Dissolution of red mud and slag in 6 N NaOH; (b) Final red-mud-based AAM.
Sustainability 15 03473 g002
Figure 3. Mixing procedure of the alkali-activated pastes (* The mixing duration should be selected based on the explained method).
Sustainability 15 03473 g003
Figure 4. Compressive strength test of red-mud-based samples.
Sustainability 15 03473 g004
Figure 5. Twenty-eight-day compressive strengths of the alkali-activated pastes.
Sustainability 15 03473 g005
Figure 6. XRD sample preparation (5 µm mill).
Sustainability 15 03473 g006
Figure 7. Vacuum oven operating at lab temperature.
Sustainability 15 03473 g007
Figure 8. Quantitative crystalline phase analysis of samples RM1-a to RM1-d.
Sustainability 15 03473 g008
Figure 9. Quantitative crystalline phase analysis of samples RM2 and RM3.
Sustainability 15 03473 g009
Figure 10. Ternary diagram based on total reactive alumina, silica, and calcium in the binder.
Sustainability 15 03473 g010
Figure 11. XRD patterns of (a) red mud and (b) slag. (a) XRD pattern of red mud (RM1); C: Cancrinite; H: Hydrogarnet; He: Hematite; G: Gibbsite; P: Perovskite. (b) XRD pattern of slag; M: Magnesiumdiphosphat; Me: Melilite.
Sustainability 15 03473 g011
Figure 12. XRD patterns of SS1P1 (a) 0° to 85°; (b) 0° to 40°; and (c) where C-S-H humps appear. (a) XRD patterns of SS1P1 (0° to 85°); (b) XRD patterns of SS1P1 (0° to 40°); (c) XRD patterns of SS1P1 where the C-S-H hump appears.
Sustainability 15 03473 g012aSustainability 15 03473 g012b
Figure 13. XRD patterns of SS1P2 (a) 0° to 40° and (b) where the C-S-H humps appear. (a) XRD patterns of SS1P2 (0° to 40°); (b) XRD patterns of SS1P2, where the C-S-H hump appears.
Sustainability 15 03473 g013
Figure 14. XRD patterns of (a) SS2.1 (0° to 40°) and (b) SS2.1 where the C-S-H humps appear. (a) XRD patterns of SS2.1 (0° to 40°); (b) XRD patterns of SS2.1 where the C-S-H hump appears.
Sustainability 15 03473 g014
Figure 15. XRD patterns for (a) SS3 (0° to 40°) and (b) SS3 where the C-S-H humps appear. (a) XRD patterns of SS3 (0° to 40°), (b) XRD patterns of SS3 where the C-S-H hump appears.
Sustainability 15 03473 g015
Table 1. The moisture contents of RM samples.
Red MudMoisture Contents (%)
RM1-a30.67
RM1-b37.87
RM1-c29.94
RM1-d2.37
RM21.12
RM334.86
Table 2. Chemical compositions of precursors.
XRF Total Chemical Oxides (wt.%)RM1-aRM1-bRM1-cRM1-dRM2RM3BFS
Al2O323.6421.4520.0723.7717.7821.6912.05
SiO220.8520.2718.9920.5128.3316.1631.15
CaO20.2820.425.6818.8413.981.7545.55
Na2O9.327.056.598.246.7312.970.31
K2O1.481.991.672.091.620.000.58
Fe2O35.589.947.896.9317.2931.580.49
TiO24.425.694.843.943.316.080.53
SO31.220.670.601.100.370.432.01
MgO0.881.111.201.211.190.005.93
P2O50.270.180.220.220.320.000.00
Cl0.200.000.540.170.230.000.00
ZrO20.150.190.170.130.000.220.03
SrO0.110.000.140.110.140.000.09
MnO0.000.000.000.000.130.000.11
CuO0.000.000.000.000.150.000.00
BaO0.000.000.000.000.000.000.06
LOI11.6011.0611.3912.728.569.111.11
Total w/LOI100.00100.00100.00100.00100.00100.00100.00
LOI = loss on the ignition.
Table 3. Mix proportioning of the alkali-activated mortars.
Row #Mix LabelSi4+ MoleOH MoleWater/
Solution
Solution/
Binder
Red Mud/
Precursor (wt.%)
BFS/
Precursor (wt.%)
Sand/
Precursor
1RM1-aS40Ch10.912.300.840.3760401.00
2RM1-aS20Ch10.792.000.860.428020
3RM1-aS20Ch21.141.800.840.448020
4RM1-aS30Ch11.112.100.840.397030
5RM1-aS30Ch2-10.141.900.830.437030
6RM1-aS40Ch2-10.172.400.790.376040
7RM1-aS30Ch2-20.182.700.780.377030
8RM1-aS30Ch2-30.262.400.740.47030
9RM1-aS30Ch2-40.342.300.710.427030
10RM1-aS30Ch2-50.282.600.730.587030
11RM1-aS30Ch2-60.252.400.750.67030
12RM1-aS30Ch31.112.100.840.397030
13RM1-bS20Ch10.431.800.890.468020
14RM1-bS30Ch20.991.900.850.437030
15RM1-cS20Ch11.461.600.820.498020
16RM1-cS30Ch21.122.100.840.397030
17RM1-dS30Ch11.052.000.840.357030
18RM2S40Ch11.282.400.820.316040
19RM2S25Ch11.162.200.830.337525
20RM3S40Ch10.622.100.870.336040
21RM3S20Ch20.611.500.890.48020
Table 4. Mix proportioning of the alkali-activated pastes.
Mix LabelSi4+ MoleOH MoleWater/
Solution
Solution/
Binder
Red Mud/
Precursor (wt.%)
BFS/
Precursor (wt.%)
Sodium Silicate TypeMix
Proc.
SS1P11.112.110.840.397030SolidP1
SS1P2P2
LS2.1P3Solution (Si/Na = 2.1)P3
LS3.0P3Solution (Si/Na = 3.0)
Table 5. Quantitative phase analysis of the RM samples.
RM
Components
Al2O3SiO2CaONa2OK2OFe2O3TiO2SO3MgO
RM1-aXRF23.620.920.39.31.55.54.51.20.9
Crystalline, % by mass18.87.015.54.70.02.22.10.00.0
Amorphous, % by mass4.813.94.84.61.53.32.41.20.9
RM1-bXRF21.520.320.47.12.09.95.70.71.1
Crystalline, % by mass18.510.18.77.00.03.70.00.00.0
Amorphous, % by mass3.010.211.70.12.06.25.70.71.1
RM1-cXRF20.119.025.76.61.77.94.80.61.2
Crystalline, % by mass19.610.314.05.50.02.82.00.00.0
Amorphous, % by mass0.58.711.71.11.75.12.80.61.2
RM1-dXRF23.820.518.88.32.16.94.01.11.2
Crystalline, % by mass20.17.611.95.20.02.82.20.00.0
Amorphous, % by mass3.712.96.93.12.14.11.81.11.2
RM2XRF17.828.314.06.81.617.33.40.41.2
Crystalline, % by mass8.423.08.13.80.04.41.50.00.0
Amorphous, % by mass9.45.35.93.01.612.91.90.41.2
RM3XRF21.716.21.813.00.031.66.10.40.0
Crystalline, % by mass15.512.10.47.00.07.21.70.00.0
Amorphous, % by mass6.24.11.46.00.024.44.40.40.0
Table 6. Total reactive mole percentage of CaO, SiO2, and Al2O3 in each mix design.
Row
Number
Mix Labeln(H2O)
(mol%)
n(SiO2)
(mol%)
n(Al2O3)
(mol%)
n(CaO)
(mol%)
n(Na2O)
(mol%)
CaO/SiO2Al2O3/SiO2
1RM1S40Ch170.9510.842.0511.145.021.030.19
2RM1S20Ch178.738.391.496.265.130.750.18
3RM1S20Ch278.988.551.395.825.270.680.16
4RM1S30Ch174.129.721.788.715.680.90.18
5RM1S30Ch2-175.479.211.698.285.360.90.18
6RM1S40Ch2-171.5810.381.9610.625.471.020.19
7RM1S30Ch2-272.8110.081.859.066.20.90.18
8RM1S30Ch2-373.739.921.688.266.410.830.17
9RM1S30Ch2-474.589.761.527.446.710.760.16
10RM1S30Ch2-576.938.321.175.757.830.690.14
11RM1S30Ch2-678.877.621.075.267.170.690.14
12RM1S30Ch374.179.651.788.725.680.90.18
13RM2S20Ch182.645.841.027.183.331.230.17
14RM2S30Ch275.368.841.339.325.161.050.15
15RM3S20Ch180.867.190.626.774.560.940.09
16RM3S30Ch274.558.61.1510.84.91.260.13
17RM4S30Ch173.3510.171.729.475.280.930.17
18RM5S40Ch168.0410.083.3612.685.831.260.33
19RM5S25Ch173.877.883.29.085.961.150.41
20RM6S40Ch170.899.412.5812.184.931.290.27
21RM6S20Ch281.865.71.865.834.751.020.33
Disclaimer/Publisher’s Note: The statements, opinions and data contained in all publications are solely those of the individual author(s) and contributor(s) and not of MDPI and/or the editor(s). MDPI and/or the editor(s) disclaim responsibility for any injury to people or property resulting from any ideas, methods, instructions or products referred to in the content.