Author Contributions
Conceptualization, F.T., E.C., A.H. and J.L.; Methodology, F.T., E.C., A.H. and J.L.; Software, F.T., E.C., A.H. and J.L.; Validation, F.T., E.C., A.H. and J.L.; Formal analysis, F.T., E.C., A.H. and J.L.; Investigation, F.T., E.C., A.H. and J.L.; Resources, F.T., E.C., A.H. and J.L. Data curation, F.T., E.C., A.H. and J.L.; Writing—review & editing, F.T., E.C., A.H. and J.L.; Project administration, F.T., E.C., A.H. and J.L. All authors have read and agreed to the published version of the manuscript.
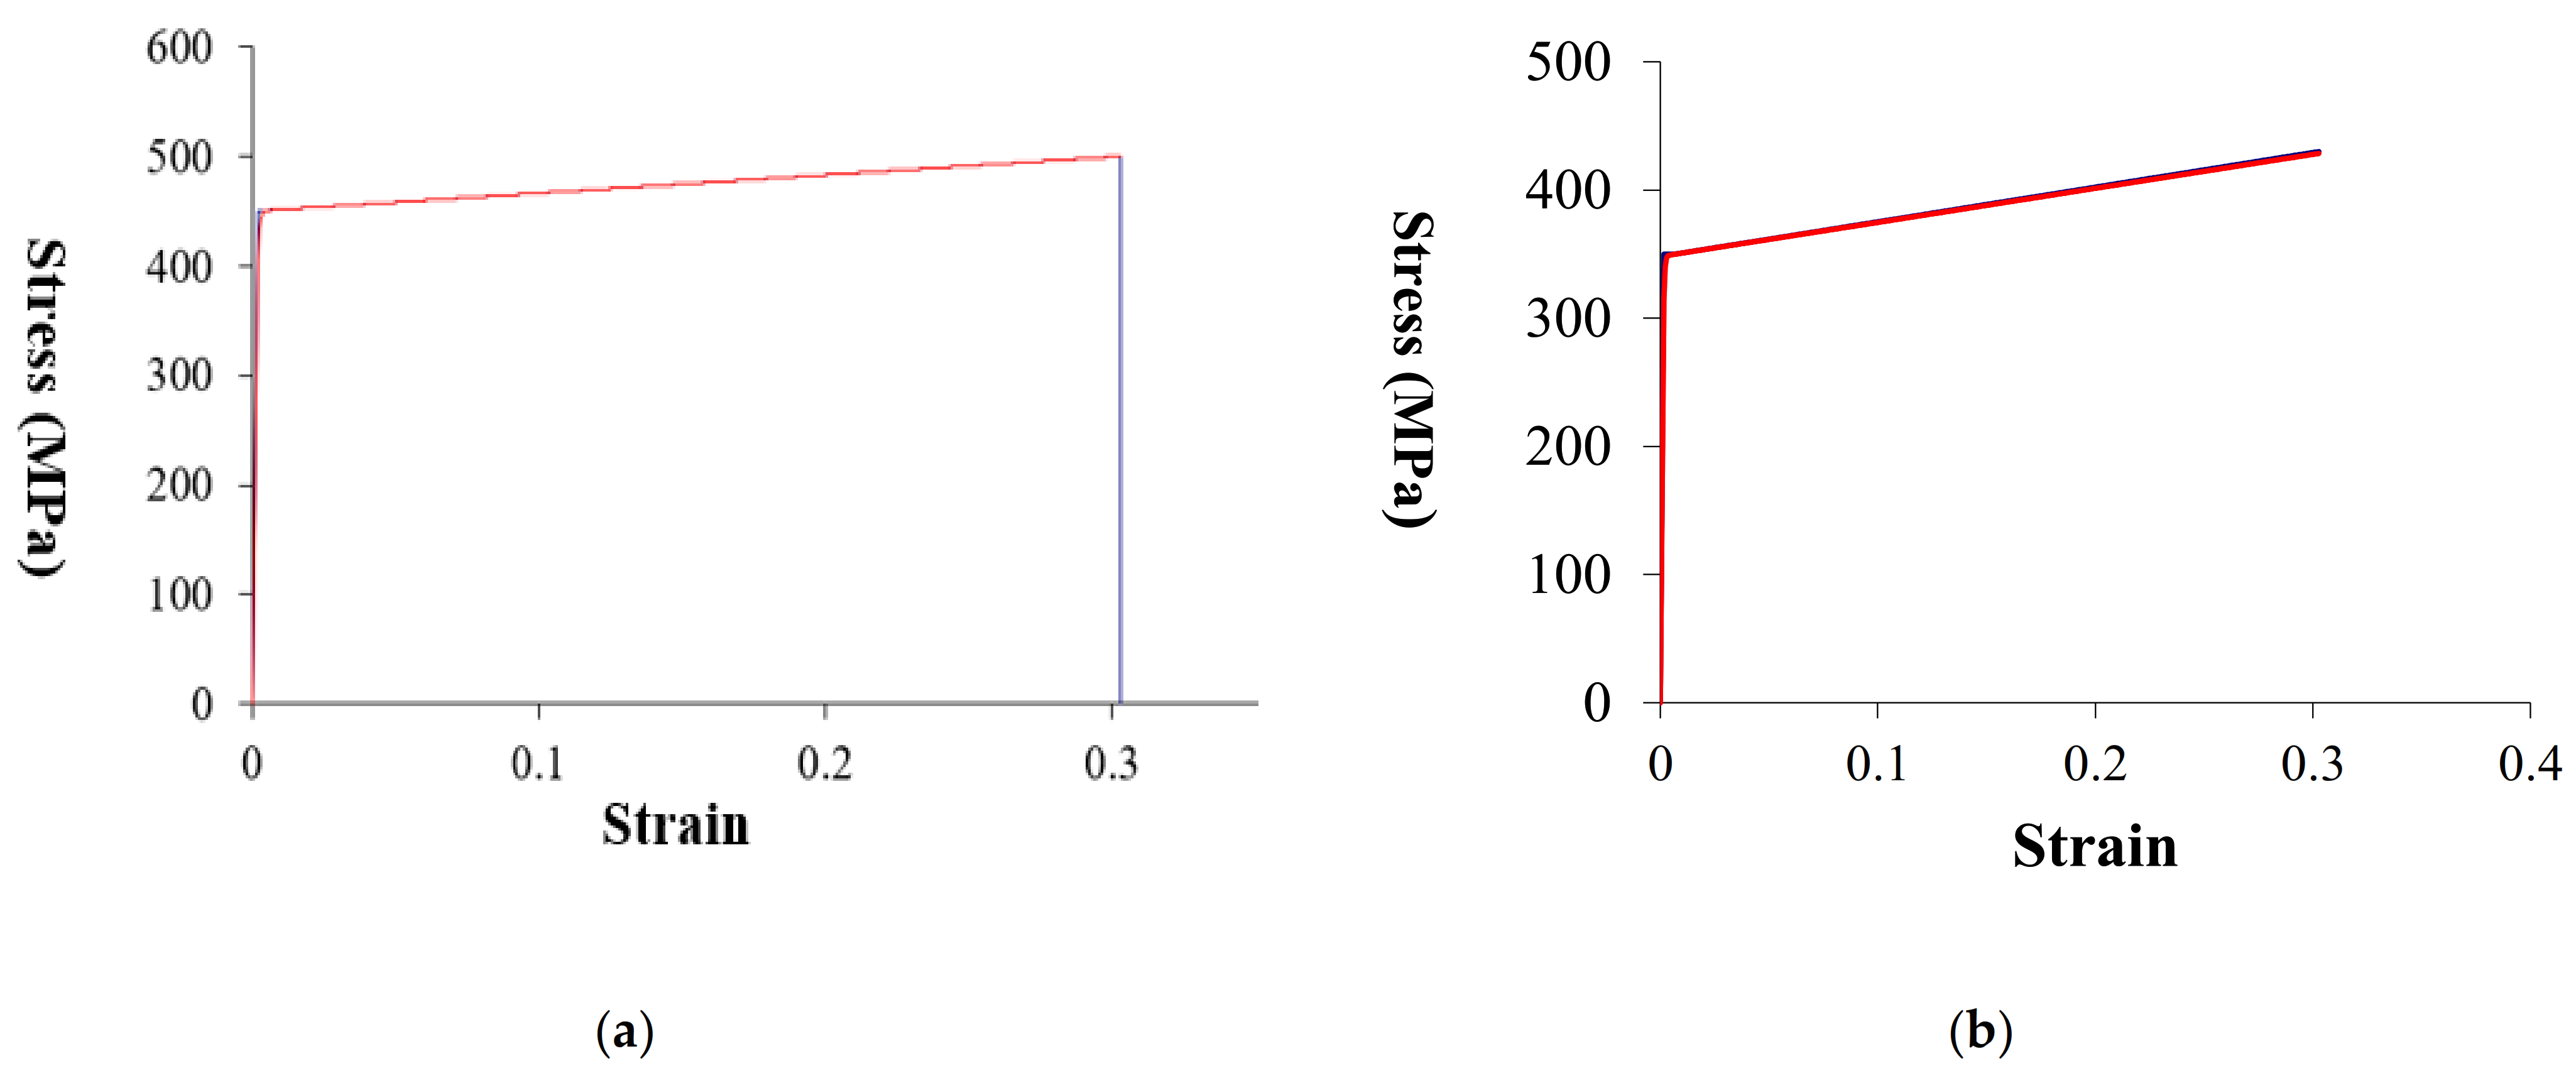
Figure 1.
Stress–strain curve for nonlinear analysis: (a) stress–strain Curve for Lakhwiya and CommBank Stadium (C450L0); (b) stress–strain Curve for Optus Stadium (C350L0).
Figure 1.
Stress–strain curve for nonlinear analysis: (a) stress–strain Curve for Lakhwiya and CommBank Stadium (C450L0); (b) stress–strain Curve for Optus Stadium (C350L0).
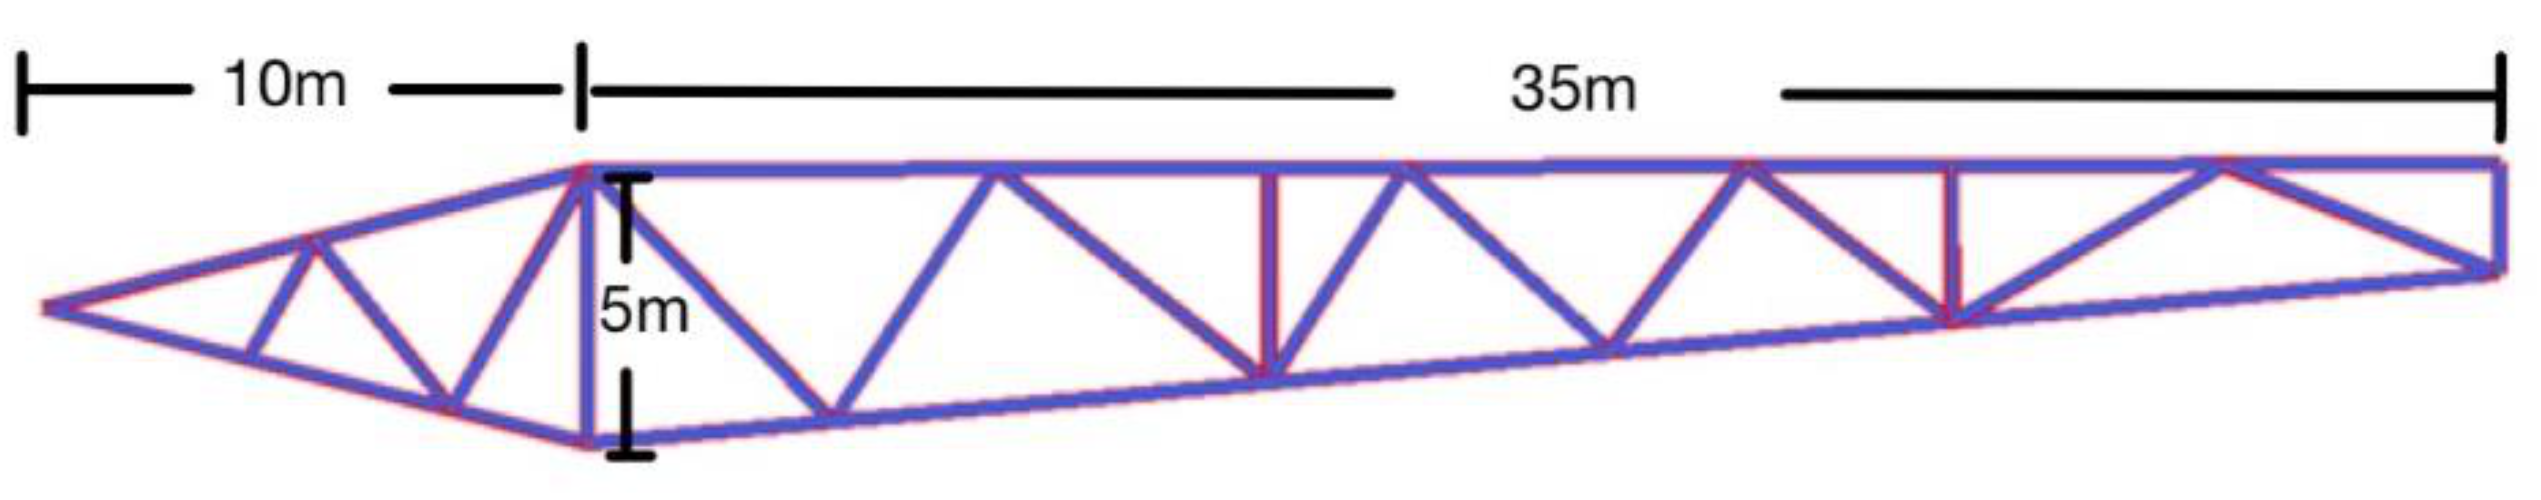
Figure 2.
Two-Dimensional View of Singular Truss Member of CommBank Stadium.
Figure 2.
Two-Dimensional View of Singular Truss Member of CommBank Stadium.
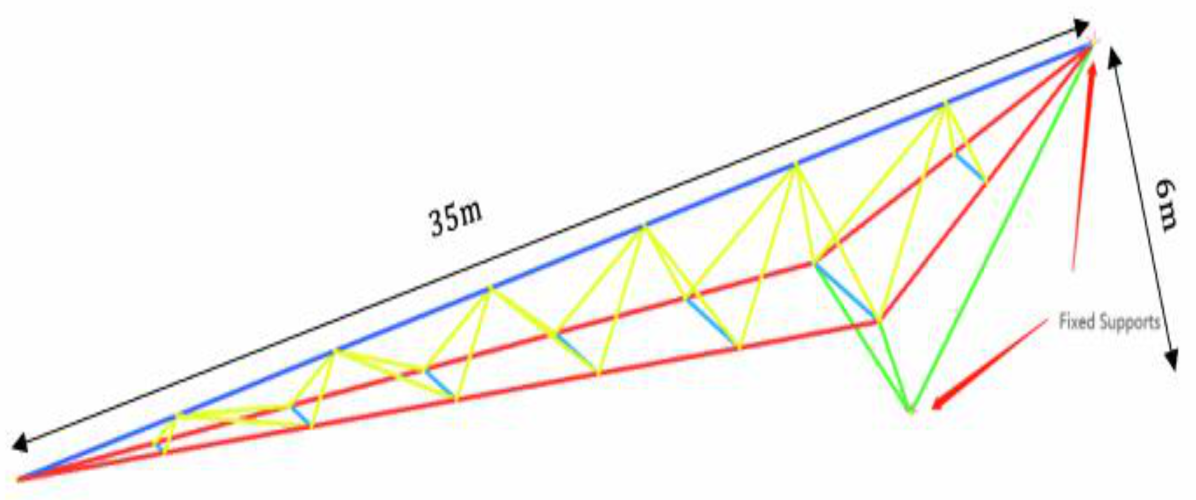
Figure 3.
Two-Dimensional View of Singular Truss Member of Optus Stadium.
Figure 3.
Two-Dimensional View of Singular Truss Member of Optus Stadium.
Figure 4.
Two-Dimensional View of Singular Truss Member of Lakhwiya Stadium.
Figure 4.
Two-Dimensional View of Singular Truss Member of Lakhwiya Stadium.
Figure 5.
Three-Dimensional Isotropic View of CommBank Stadium.
Figure 5.
Three-Dimensional Isotropic View of CommBank Stadium.
Figure 6.
Three-Dimensional Isotropic View of Optus Stadium.
Figure 6.
Three-Dimensional Isotropic View of Optus Stadium.
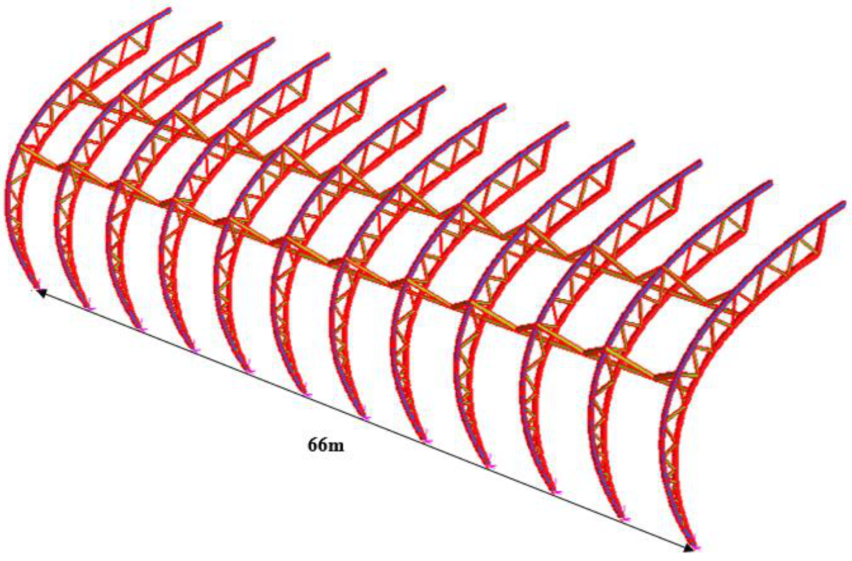
Figure 7.
Three-Dimensional Isotropic View of Lakhwiya Stadium.
Figure 7.
Three-Dimensional Isotropic View of Lakhwiya Stadium.
Figure 8.
Deformed shape of CommBank, Optus, and Lakhwiya Stadium under 1.2G + W with 5% displacement scale.
Figure 8.
Deformed shape of CommBank, Optus, and Lakhwiya Stadium under 1.2G + W with 5% displacement scale.
Figure 9.
CommBank stadium First Mode deformation shape under linear buckling analysis in 1.2G + W.
Figure 9.
CommBank stadium First Mode deformation shape under linear buckling analysis in 1.2G + W.
Figure 10.
Lakhwiya Stadium First Mode deformation shape under linear buckling analysis in 1.2G + W.
Figure 10.
Lakhwiya Stadium First Mode deformation shape under linear buckling analysis in 1.2G + W.
Figure 11.
Optus Stadium First Mode deformation shape under linear buckling analysis in 1.2G + W.
Figure 11.
Optus Stadium First Mode deformation shape under linear buckling analysis in 1.2G + W.
Figure 12.
CommBank Stadium deformation shape under non-linear buckling analysis in 1.2G + W.
Figure 12.
CommBank Stadium deformation shape under non-linear buckling analysis in 1.2G + W.
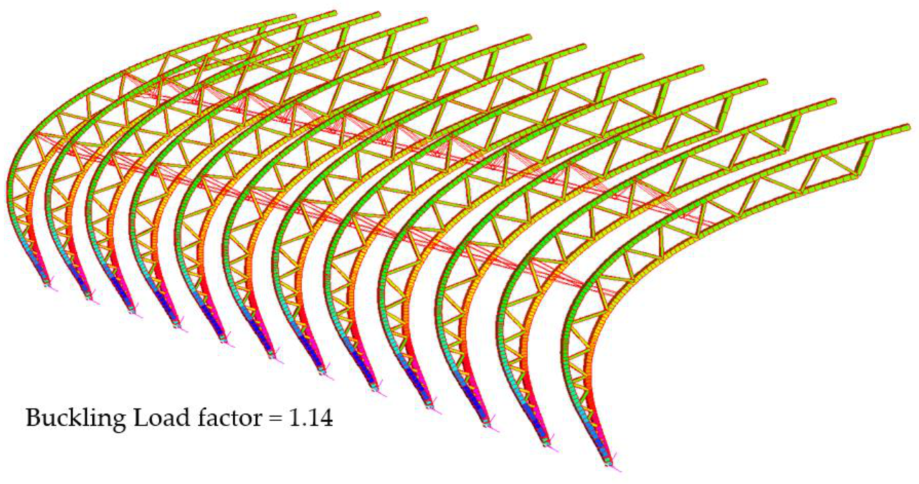
Figure 13.
Lakhwiya Stadium deformation shape under non-linear buckling analysis in 1.2G + W.
Figure 13.
Lakhwiya Stadium deformation shape under non-linear buckling analysis in 1.2G + W.
Figure 14.
Optus Stadium deformation shape under non-linear buckling analysis in 1.2G + W.
Figure 14.
Optus Stadium deformation shape under non-linear buckling analysis in 1.2G + W.
Figure 15.
CommBank Stadium Load Factor vs. Nodal Rotation (dead and live load cases).
Figure 15.
CommBank Stadium Load Factor vs. Nodal Rotation (dead and live load cases).
Figure 16.
CommBank Stadium Load Factor vs. Nodal Rotation (wind load cases).
Figure 16.
CommBank Stadium Load Factor vs. Nodal Rotation (wind load cases).
Figure 17.
Lakhwiya Stadium Load Factor vs. Nodal Displacement (dead and live load cases).
Figure 17.
Lakhwiya Stadium Load Factor vs. Nodal Displacement (dead and live load cases).
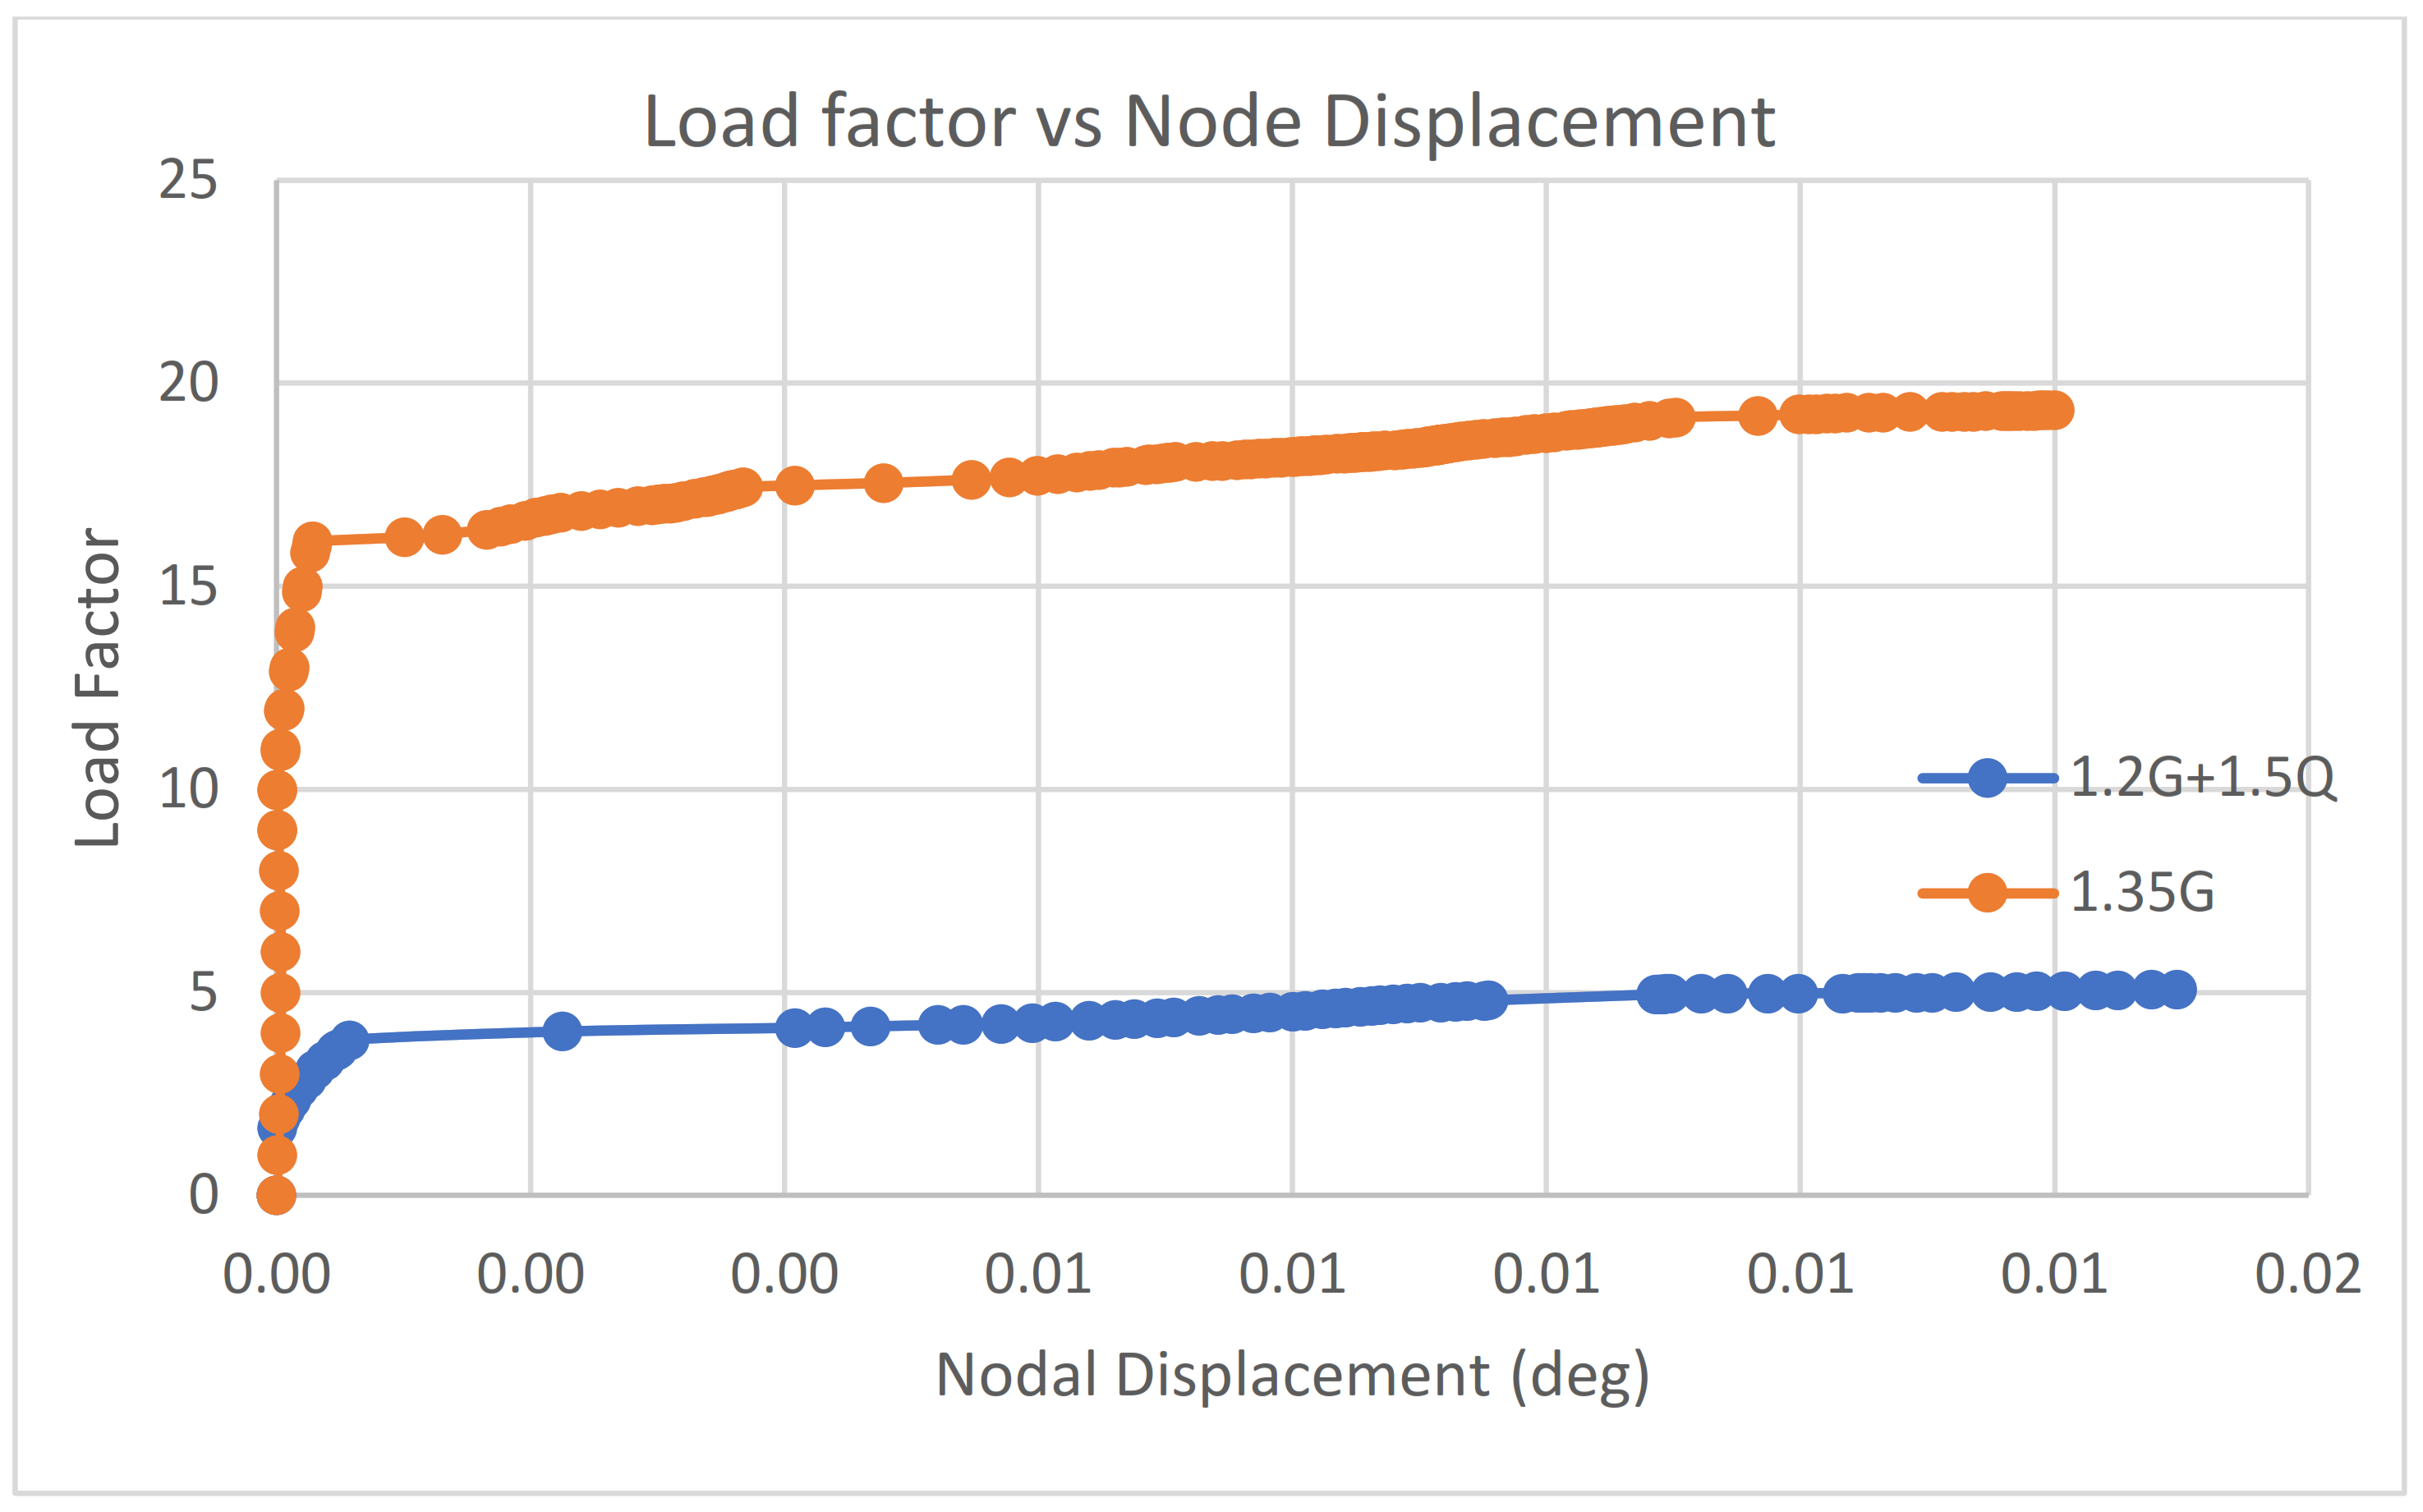
Figure 18.
Lakhwiya Stadium Load Factor vs. Nodal Displacement (wind load cases).
Figure 18.
Lakhwiya Stadium Load Factor vs. Nodal Displacement (wind load cases).
Figure 19.
Optus Stadium Load Factor vs. Nodal Rotation (dead and live load cases).
Figure 19.
Optus Stadium Load Factor vs. Nodal Rotation (dead and live load cases).
Figure 20.
Optus Stadium Load Factor vs. Nodal Rotation (wind load cases).
Figure 20.
Optus Stadium Load Factor vs. Nodal Rotation (wind load cases).
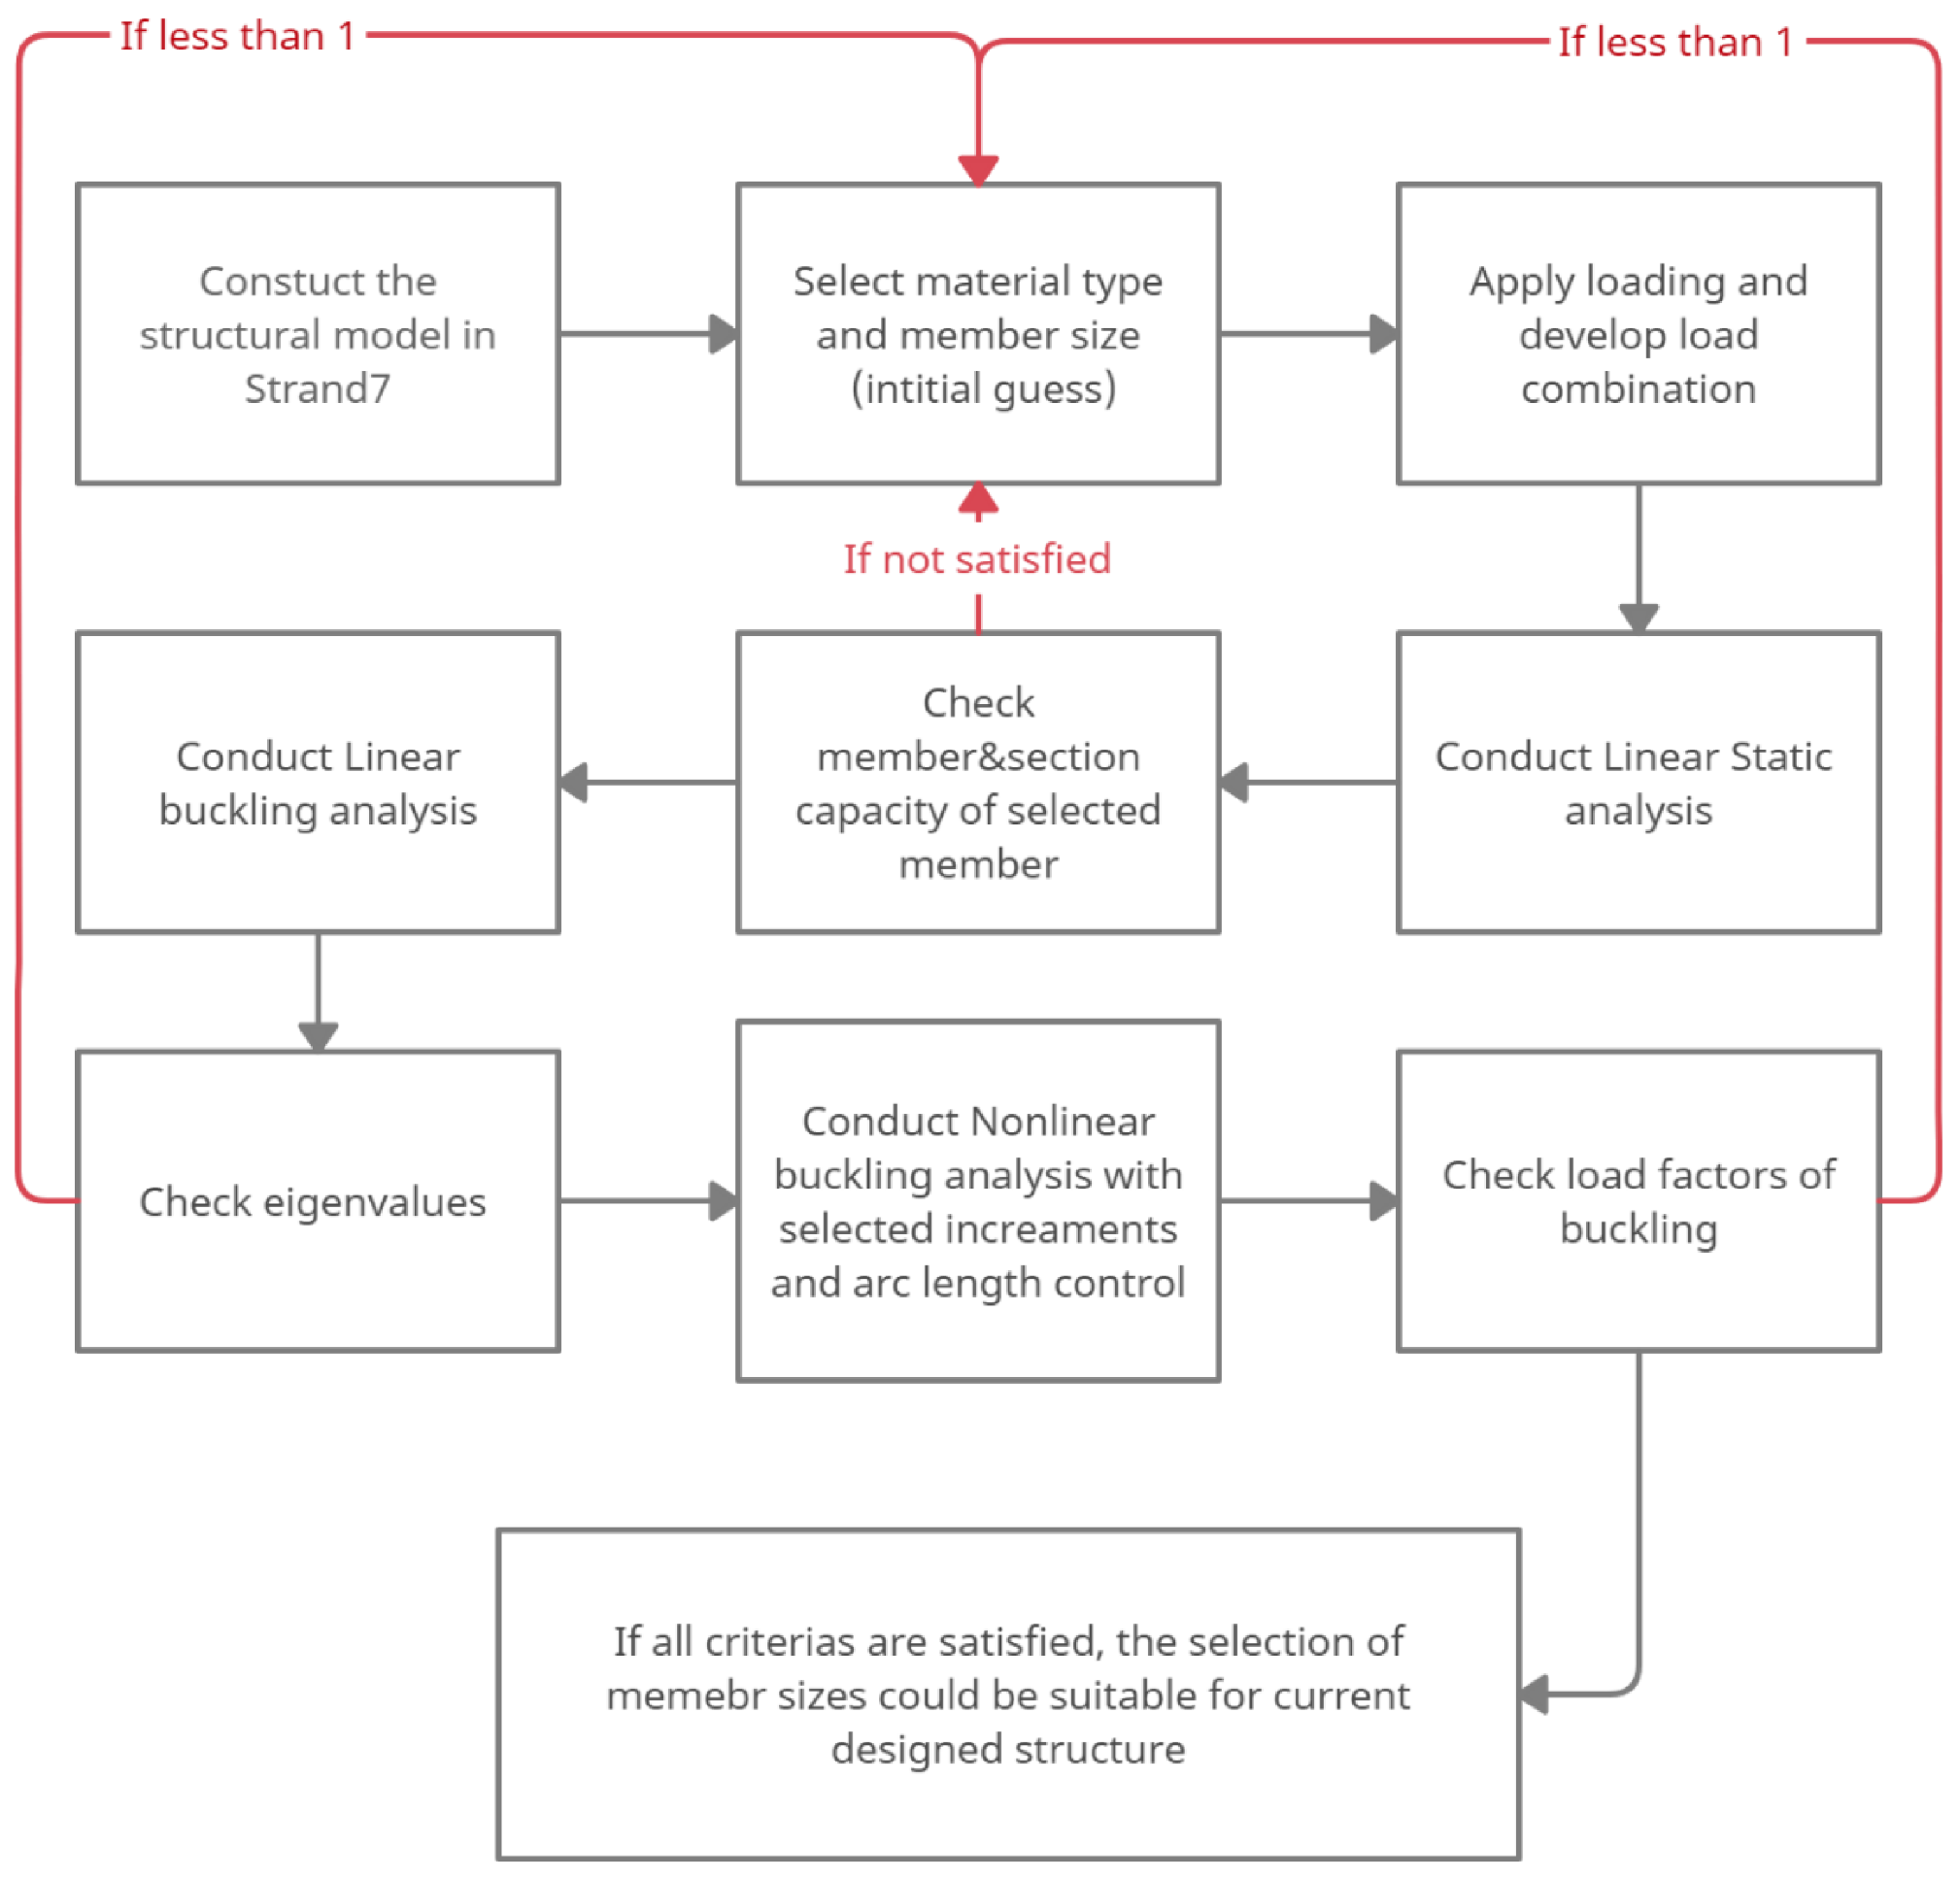
Figure 21.
Universal design flowchart for stadium roofing structure.
Figure 21.
Universal design flowchart for stadium roofing structure.
Table 1.
Preliminary Section Sizes.
Table 1.
Preliminary Section Sizes.
| Stadium | Frame | Structural Member | Member Size |
|---|
| CommBank | Main | Top Chord | C450L0 150 × 150 × 6 |
| Stadium | | Bot Chord | C450L0 150 × 150 × 8 |
| (SHS) | | Diagonal | C450L0 150 × 150 × 5 |
| | Connection | Top Chord | C450L0 125 × 125 × 5 |
| | | Bot Chord | C450L0 125 × 125 × 6 |
| | | Diagonal Chord | C450L0 125 × 125 × 4 |
| Optus Stadium | Main | Top Chord | C350L0 273.1 × 12.7 |
| | | Bot Chord | C350L0 273.1 × 12.7 |
| | | Web Diagonal | C350L0 101.6 × 3.2 |
| | | Bot Diagonal | C350L0 101.6 × 3.2 |
| | | Bot Structure | C350L0 168.3 × 7.1 |
| | Connection | Lateral Beam | C350L0 88.9 × 2.6 |
| Lakhwiya | End Frame | Top Chord | C450L0 200 × 200 × 8 |
| Stadium | | Bot Chord | C450L0 200 × 200 × 9 |
| | | Diagonals | C450L0 65 × 65 × 6 |
| | | Cross-Bracing | C450L0 65 × 65 × 3 |
| | Central Frame | Top Chord | C450L0 200 × 200 × 8 |
| | | Bot Chord | C450L0 200 × 200 × |
| | | Diagonals | C450L0 100 × 100 × 4 |
| | | Cross-Bracing | C450L0 65 × 65 × 3 |
Table 2.
Load Combinations under Consideration.
Table 2.
Load Combinations under Consideration.
| Limit State | Load Combination |
|---|
| Ultimate Limit State (ULS) | 1.2G + 1.5Q |
| 1.35G |
| 1.2G + W + Ψc 1Q |
| Serviceability Limit State (SLS) | G + Ψs 2Q + Wup |
| G + Ψl 3Q + Wup |
Table 3.
Main Frame of CommBank Stadium Roof (Axial force in kN).
Table 3.
Main Frame of CommBank Stadium Roof (Axial force in kN).
| Load Combination | Top Chord | Bot Chord | Diagonal Chord |
|---|
| | Tension | Comp. | Tension | Comp. | Tension | Comp. |
|---|
| 1.2G + 1.5Q | 523.9 | −14.6 | 154.7 | −629 | 490.8 | −461 |
| 1.35G | 148 | −1.25 | 44.61 | −181 | 139.6 | −131 |
| 1.2G + W | 16.6 | −420 | 470.4 | −118 | 313.3 | −386 |
| G + 0.7Q + W | 11.85 | −261 | 281.5 | −72 | 187.2 | −238 |
| Maximum | 523.9 | −420 | 470.4 | −629 | 490.8 | −461 |
Table 4.
Connection Frame of CommBank Stadium Roof (Axial force in kN).
Table 4.
Connection Frame of CommBank Stadium Roof (Axial force in kN).
| Load Combination | Top Chord | Bot Chord | Diagonal Chord |
|---|
| | Tension | Comp. | Tension | Comp. | Tension | Comp. |
|---|
| 1.2G + 1.5Q | 0.62 | −194 | 33.5 | −67.4 | 27.2 | −36.2 |
| 1.35G | 0.9 | −54.7 | 8.05 | −20.7 | 8.09 | −8.92 |
| 1.2G + W | 123.3 | −1.16 | 35.3 | −35.7 | 22.8 | −18.3 |
| G + 0.7Q + W | 82.1 | −9.84 | 30.3 | −37.2 | 19.8 | −19.2 |
| Maximum | 123.3 | −194 | 35.3 | −37.2 | 27.2 | −36.2 |
Table 5.
Main Frame of CommBank Stadium Roof (Bending in kNm).
Table 5.
Main Frame of CommBank Stadium Roof (Bending in kNm).
| Load Combination | Top Chord | Bot Chord | Diagonal Chord |
|---|
| | End1 | End2 | End1 | End2 | End1 | End2 |
|---|
| 1.2G + 1.5Q | 0.341 | 3.84 | 0.376 | 19.7 | 1.24 | 9.6 |
| 1.35G | 0.045 | 0.8 | 0.03 | 2.07 | 0.33 | 1.51 |
| 1.2G + W | 0.336 | 4.31 | 0.28 | 48.72 | 0.47 | 28.92 |
| G + 0.7Q + W | 0.2 | 3.05 | 0.15 | 34.06 | 0.22 | 20.66 |
| Maximum | 0.341 | 4.31 | 0.376 | 48.72 | 1.24 | 28.92 |
Table 6.
Connection Frame of CommBank Stadium Roof (Bending in kNm).
Table 6.
Connection Frame of CommBank Stadium Roof (Bending in kNm).
| Load Combination | Top Chord | Bot Chord | Diagonal Chord |
|---|
| | End1 | End2 | End1 | End2 | End1 | End2 |
|---|
| 1.2G + 1.5Q | 0.73 | 8.7 | 1.22 | 1.67 | 0.55 | 2.18 |
| 1.35G | 0.13 | 2.31 | 1.35 | 1.65 | 0.57 | 0.78 |
| 1.2G + W | 0.98 | 5.09 | 1.21 | 1.47 | 0.53 | 3.27 |
| G + 0.7Q + W | 0.72 | 2.33 | 1 | 1.16 | 0.43 | 2.41 |
| Maximum | 0.98 | 8.7 | 1.35 | 1.67 | 0.57 | 3.27 |
Table 7.
Central Frame of Lakhwiya Stadium (Tensile Force in kN).
Table 7.
Central Frame of Lakhwiya Stadium (Tensile Force in kN).
| Load Combination | Top Chord | Bot Chord | Diagonal Chord | Cross-Connections |
|---|
| 1.2G + 1.5Q | 585 | n/a | 103 | 76 |
| 1.35G | 156 | n/a | 23.6 | 0.56 |
| 1.2G + W | n/a | 2244 | 448 | 21 |
| G + 0.7Q + W | n/a | 2017.19 | 401 | 16 |
| Maximum | 156 | 2265 | 456 | 76 |
Table 8.
Central Frame of Lakhwiya Stadium (Compressive Force kN).
Table 8.
Central Frame of Lakhwiya Stadium (Compressive Force kN).
| Load Combination | Top Chord | Bot Chord | Diagonal Chord | Cross-Connections |
|---|
| 1.2G + 1.5Q | 0.36 | 611 | 128 | 68 |
| 1.35G | 0.31 | 179 | 45 | 5 |
| 1.2G + W | 2169 | n/a | 404 | 22 |
| G + 0.7Q + W | 1951 | n/a | 363 | 17 |
| Maximum | 2193 | 611 | 415 | 68 |
Table 9.
Central Frame of Lakhwiya Stadium (Bending Force kN).
Table 9.
Central Frame of Lakhwiya Stadium (Bending Force kN).
| Load Combination | Top Chord | Bot Chord | Diagonal Chord | Cross-Connections |
|---|
| 1.2G + 1.5Q | 50 | 57 | 0.31 | 0.30 |
| 1.35G | 0.42 | 0.40 | n/a | 0.085 |
| 1.2G + W | 12 | 14 | 0.74 | 0.65 |
| G + 0.7Q + W | 10.00 | 11 | 0.59 | 0.52 |
| Maximum | 50 | 57 | 2.4 | 0.65 |
Table 10.
End Frame of Lakhwiya Stadium (Tensile Force in kN).
Table 10.
End Frame of Lakhwiya Stadium (Tensile Force in kN).
| Load Combination | Top Chord | Bot Chord | Diagonal Chord | Cross-Connections |
|---|
| 1.2G + 1.5Q | 446.36 | n/a | 78.24 | 76 |
| 1.35G | 143.63 | n/a | 21.97 | 0.56 |
| 1.2G + W | n/a | 1886.90 | 381.77 | 21 |
| G + 0.7Q + W | n/a | 1734.83 | 349.74 | 16.36 |
| Maximum | 446.36 | 1906 | 389 | 76 |
Table 11.
End Frame of Lakhwiya Stadium (Compressive Force in kN).
Table 11.
End Frame of Lakhwiya Stadium (Compressive Force in kN).
| Load Combination | Top Chord | Bot Chord | Diagonal Chord | Cross-Connections |
|---|
| 1.2G + 1.5Q | 0.36 | 465.35 | 98.53 | 68 |
| 1.35G | 0.31 | 164.4 | 41.07 | 5.05 |
| 1.2G + W | 1819.5 | n/a | 341.93 | 22 |
| G + 0.7Q + W | 1673.13 | n/a | 313.79 | 17.38 |
| Maximum | 1842 | 465.35 | 341.93 | 68 |
Table 12.
End Frame of Lakhwiya Stadium (Bending Force kN).
Table 12.
End Frame of Lakhwiya Stadium (Bending Force kN).
| Load Combination | Top Chord | Bot Chord | Diagonal Chord | Cross-Connections |
|---|
| 1.2G + 1.5Q | 38.82 | 52.47 | 0.42 | 0.3 |
| 1.35G | −0.5 | 0.78 | 0.0052 | 0.085 |
| 1.2G + W | 10.16 | 13.31 | 1.08 | 0.65 |
| G + 0.7Q + W | 8.04 | 10.46 | 0.80 | 0.52 |
| Maximum | 38.82 | 52.47 | 3.03 | 0.65 |
Table 13.
Main Frame of Optus Stadium (Tensile Force in kN).
Table 13.
Main Frame of Optus Stadium (Tensile Force in kN).
| Load Combination | Top Chord | Bot Chord | Web Diagonal | Bot Diagonal | Bot Structure |
|---|
| 1.2G + 1.5Q | 208.2 | n/a | 85.8 | 19.5 | 3.4 |
| 1.35G | 432.6 | n/a | 27.2 | 17.5 | 3.9 |
| 1.2G + W | 453.5 | 51.5 | 39.4 | 16.7 | 10.7 |
| G + 0.7Q + W | 834.5 | n/a | 64.9 | 34 | 2.9 |
| Maximum | 834.5 | 51.5 | 85.8 | 19.5 | 10.7 |
Table 14.
Main Frame of Optus Stadium (Compressive Force in kN).
Table 14.
Main Frame of Optus Stadium (Compressive Force in kN).
| Load Combination | Top Chord | Bot Chord | Web Diagonal | Bot Diagonal | Bot Structure |
|---|
| 1.2G + 1.5Q | n/a | −615.4 | −97.3 | −21.8 | −458 |
| 1.35G | n/a | −202.5 | −33 | −6.4 | −154 |
| 1.2G + W | −102.8 | −205.6 | −41.5 | −6 | −173 |
| G + 0.7Q + W | n/a | −380 | −66.9 | −10.8 | −301 |
| Maximum | −102.8 | −615.4 | −97.3 | −21.8 | −301 |
Table 15.
Main Frame of Optus Stadium (Bending Moment in kNm).
Table 15.
Main Frame of Optus Stadium (Bending Moment in kNm).
| Load Combination | Top Chord | Bot Chord | Web Diagonal | Bot Diagonal | Bot Structure |
|---|
| 1.2G + 1.5Q | 17.8 | 40.3 | 2.8 | 0.17 | 35.2 |
| 1.35G | 7.7 | 11.6 | 1.2 | 0.17 | 11.7 |
| 1.2G + W | 7.5 | 14.6 | 0.9 | 0.16 | 12.1 |
| G + 0.7Q + W | 11.9 | 25.6 | 1.9 | 0.14 | 21.8 |
| Maximum | 17.8 | 40.3 | 2.8 | 0.17 | 35.2 |
Table 16.
Connections of Optus Stadium.
Table 16.
Connections of Optus Stadium.
| Load Combination | Tensile Force kN | Compressive Force kN | Bending Moment kNm |
|---|
| 1.2G + 1.5 | n/a | −30.5 | 0.38 |
| 1.35G | n/a | −9.8 | 0.44 |
| 1.2G + W | n/a | −5 | 0.88 |
| G + 0.7Q + W | n/a | −13.8 | 0.8 |
| Maximum | n/a | −30.5 | 0.88 |
Table 17.
Tensile Capacity vs. Critical Loading (CommBank Stadium).
Table 17.
Tensile Capacity vs. Critical Loading (CommBank Stadium).
| Member | Member Size | Tensile Capacity | Critical Loading |
|---|
| Main Top Chord | C450L0 150 × 150 × 6 | 1031.71 | 523.9 |
| Main Bot Chord | C450L0 150 × 150 × 8 | 1338.44 | 470.4 |
| Main Diag. Chord | C450L0 150 × 150 × 5 | 870.61 | 490.8 |
| Conn. Top Chord | C450L0 125 × 125 × 5 | 715.7 | 123.3 |
| Conn. Bot Chord | C450L0 125 × 125 × 6 | 845.8 | 35.3 |
| Conn. Diag. Chord | C450L0 125 × 125 × 4 | 582.47 | 27.2 |
Table 18.
Compressive Capacity vs. Critical Loading (CommBank Stadium).
Table 18.
Compressive Capacity vs. Critical Loading (CommBank Stadium).
| Member | Member Size | Compressive Capacity | Critical Loading |
|---|
| Main Top Chord | C450L0 150 × 150 × 6 | 1266.62 | 420 |
| Main Bot Chord | C450L0 150 × 150 × 8 | 1373.34 | 628.9 |
| Main Diag. Chord | C450L0 150 × 150 × 5 | 849.07 | 460.6 |
| Conn. Top Chord | C450L0 125 × 125 × 5 | 863.2 | 193.5 |
| Conn. Bot Chord | C450L0 125 × 125 × 6 | 865.8 | 37.2 |
| Conn. Diag. Chord | C450L0 125 × 125 × 4 | 673.06 | 36.2 |
Table 19.
Bending Moment Capacity vs. Critical Loading (CommBank Stadium).
Table 19.
Bending Moment Capacity vs. Critical Loading (CommBank Stadium).
| Member | Member Size | Bending Moment Capacity | Critical Moment |
|---|
| Main Top Chord | C450L0 150 × 150 × 6 | 60.75 | 4.31 |
| Main Bot Chord | C450L0 150 × 150 × 8 | 76.14 | 48.72 |
| Main Diag. Chord | C450L0 150 × 150 × 5 | 42.86 | 28.92 |
| Conn. Top Chord | C450L0 125 × 125 × 5 | 29.66 | 8.7 |
| Conn. Bot Chord | C450L0 125 × 125 × 6 | 40.91 | 1.67 |
| Conn. Diag. Chord | C450L0 125 × 125 × 4 | 29.28 | 3.27 |
Table 20.
Tensile Capacity vs. Critical Loading (Lakhwiya Stadium).
Table 20.
Tensile Capacity vs. Critical Loading (Lakhwiya Stadium).
| Member | Member Size | Tensile Capacity | Critical Loading |
|---|
| Central Top Chord | C450L0 200 × 200 × 8 | 1834 | 585 |
| Central Bot Chord | C450L0 200 × 200 × 9 | 2265 | 2045 |
| Central Diag Chord | C450L0 100 × 100 × 4 | 459 | 456 |
| Central Cross-bracing | C450L0 65 × 65 × 3 | 223.4 | 21 |
| End Top Chord | C450L0 200 × 200 × 8 | 1834 | 446 |
| End Bot Chord | C450L0 200 × 200 × 9 | 2045 | 1906 |
| End Diag Chord | C450L0 65 × 65 × 6 | 400 | 389 |
| End Cross-bracing | C450L0 65 × 65 × 3 | 223.4 | 21 |
Table 21.
Compressive Capacity vs. Critical Loading (Lakhwiya Stadium).
Table 21.
Compressive Capacity vs. Critical Loading (Lakhwiya Stadium).
| Member | Member Size | Compressive Capacity | Critical Loading |
|---|
| Central Top Chord | C450L0 200 × 200 × 8 | 2285 | 2169 |
| Central Bot Chord | C450L0 200 × 200 × 9 | 1810 | 611 |
| Central Diag Chord | C450L0 100 × 100 × 4 | 534 | 404 |
| Central Cross-bracing | C450L0 65 × 65 × 3 | 26 | 22 |
| End Top Chord | C450L0 200 × 200 × 8 | 2285 | 1842 |
| End Bot Chord | C450L0 200 × 200 × 9 | 1810 | 465 |
| End Diag Chord | C450L0 65 × 65 × 6 | 356 | 351 |
| End Cross-bracing | C450L0 65 × 65 × 3 | 26 | 22 |
Table 22.
Bending Moment Capacity vs. Critical Loading (Lakhwiya Stadium).
Table 22.
Bending Moment Capacity vs. Critical Loading (Lakhwiya Stadium).
| Member | Member Size | Bending Capacity | Critical Loading |
|---|
| Central Top Chord | C450L0 200 × 200 × 8 | 112 | 50 |
| Central Bot Chord | C450L0 200 × 200 × 9 | 123 | 57 |
| Central Diag Chord | C450L0 100 × 100 × 4 | 14 | 2.4 |
| Central Cross-bracing | C450L0 65 × 65 × 3 | 5.2 | 0.65 |
| End Top Chord | C450L0 200 × 200 × 8 | 112 | 38.82 |
| End Bot Chord | C450L0 200 × 200 × 9 | 123 | 52.47 |
| End Diag Chord | C450L0 65 × 65 × 6 | 7 | 3 |
| End Cross-bracing | C450L0 65 × 65 × 3 | 5.2 | 0.65 |
Table 23.
Tensile Capacity vs. Critical Loading (Optus Stadium).
Table 23.
Tensile Capacity vs. Critical Loading (Optus Stadium).
| Member | Member Size | Tensile Capacity | Critical Loading |
|---|
| Top Chord | C350L0 273.1 × 12.7 | 3143 | 834.5 |
| Bot Chord | C350L0 273.1 × 12.7 | 3143 | 51.5 |
| Web Diagonal | C350L0 101.6 × 3.2 | 311 | 85.8 |
| Bot Diagonal | C350L0 101.6 × 3.2 | 311 | 34 |
| Bot Structure | C350L0 168.3 × 7.1 | 1134 | 10.7 |
| Connections | C350L0 88.9 × 2.6 | 222 | n/a |
Table 24.
Compressive Capacity vs. Critical Loading (Optus Stadium).
Table 24.
Compressive Capacity vs. Critical Loading (Optus Stadium).
| Member | Member Size | Compressive Capacity | Critical Loading |
|---|
| Top Chord | C350L0 273.1 × 12.7 | −3143 | −102.8 |
| Bot Chord | C350L0 273.1 × 12.7 | −3143 | −615.4 |
| Web Diagonal | C350L0 101.6 × 3.2 | −161 | −97.3 |
| Bot Diagonal | C350L0 101.6 × 3.2 | −161 | −21.8 |
| Bot Structure | C350L0 168.3 × 7.1 | 961 | −458 |
| Connections | C350L0 88.9 × 2.6 | −91.3 | −30.5 |
Table 25.
Bending Moment Capacity vs. Critical Loading (Optus Stadium).
Table 25.
Bending Moment Capacity vs. Critical Loading (Optus Stadium).
| Member | Member Size | Bending Moment Capacity | Critical moment |
|---|
| Top Chord | C350L0 273.1 × 12.7 | 263 | 17.8 |
| Bot Chord | C350L0 273.1 × 12.7 | 263 | 40.3 |
| Web Diagonal | C350L0 101.6 × 3.2 | 6.54 | 2.8 |
| Bot Diagonal | C350L0 101.6 × 3.2 | 6.54 | 0.17 |
| Bot Structure | C350L0 168.3 × 7.1 | 53 | 35.2 |
| Connections | C350L0 88.9 × 2.6 | 3.28 | 0.88 |
Table 26.
Eigenvalue of First Mode shape of deformation.
Table 26.
Eigenvalue of First Mode shape of deformation.
| Load Combination | CommBank Stadium
Eigenvalue 1 | Optus Stadium
Eigenvalue 1 | Lakhwiya Stadium Eigenvalue 1 |
|---|
| 1.2G + 1.5Q | 3.67 | 5.76 | 22.34 |
| 1.35G | 13.91 | 18.5 | 46.62 |
| 1.2G + W | 6.17 | 21.4 | 8.72 |
| G + 0.7Q + W | 7.89 | 11.2 | 9.6 |
Table 27.
CommBank Stadium Linear vs. Non-linear Buckling.
Table 27.
CommBank Stadium Linear vs. Non-linear Buckling.
| Load Combination | Eigenvalue (LB) | Critical Load (LB) | Load Factor (NLB) | Critical Load (NLB) |
|---|
| 1.2G + 1.5Q | 3.67 | 363.84 | 2.06 | 204.23 |
| 1.35G | 13.91 | 161.91 | 6.75 | 78.86 |
| 1.2G + W | 6.17 | 942.09 | 4.29 | 655.04 |
| G + 0.7Q + W | 7.89 | 1895.10 | 5.14 | 1234.57 |
Table 28.
Lakhwiya Stadium Linear vs. Non-linear Buckling.
Table 28.
Lakhwiya Stadium Linear vs. Non-linear Buckling.
| Load Combination | Eigenvalue (LB) | Critical Load (LB) | Load Factor (NLB) | Critical Load (NLB) |
|---|
| 1.2G + 1.5Q | 22.34 | 817 | 3.83 | 165.84 |
| 1.35G | 46.62 | 445 | 15.83 | 151.10 |
| 1.2G + W | 8.72 | 1219 | 1.14 | 155 |
| G + 0.7Q + W | 9.6 | 1179 | 1.06 | 188 |
Table 29.
Optus Stadium Linear vs. Non-linear Buckling.
Table 29.
Optus Stadium Linear vs. Non-linear Buckling.
| Load Combination | Eigenvalue (LB) | Critical Load (LB) | Load Factor (NLB) | Critical Load (NLB) |
|---|
| 1.2G + 1.5Q | 5.76 | 980 | 3.33 | 566 |
| 1.35G | 18.5 | 669 | 11.4 | 431 |
| 1.2G + W | 21.4 | 1532 | 9.03 | 647 |
| G + 0.7Q + W | 11.2 | 1453 | 4.1 | 532 |


