Article

Impact of Government Subsidies, Competition, and Blockchain on Green Supply Chain Decisions

1
School of Economics and Management, Shanghai University of Sport, Shanghai 200438, China
2
School of Economics and Management, Qingdao University of Science and Technology, Qingdao 266061, China
*
Author to whom correspondence should be addressed.
Sustainability 2023, 15(4), 3633; https://doi.org/10.3390/su15043633
Submission received: 11 January 2023 / Revised: 10 February 2023 / Accepted: 13 February 2023 / Published: 16 February 2023
(This article belongs to the Section Environmental Sustainability and Applications)

Abstract

:
At present, environmental and competitive pressures urge enterprises to engage in research and development (R&D) of green products, and a green supply chain has become the main trend in the sustainable development of enterprises. This study analyzes the optimal operation decisions of a green supply chain for two manufacturers under different competitive and cooperative relationships, considering factors such as government subsidies, consumer green preferences, and the impact of the green information trust. The results show that government subsidies can lead to higher social welfare when manufacturers have a cooperative relationship, but the optimal choice of subsidies (for R&D costs or product production costs) depends on the level of competition and the difficulty of R&D. For the manufacturers, the optimal choice of R&D strategy (individual or joint) and the use of blockchain technology also depends on the level of difficulty of R&D and the type of government subsidies. Overall, this study highlights the importance of considering various factors when making decisions in a green supply chain to achieve the best outcomes for all parties involved.

1. Introduction

With the development of industry, resource and environmental issues have become a common challenge worldwide, so the concept of environmental protection has been introduced into supply chains [1]. Green technology innovation is an effective means to promote the development of green supply chains [2] and affect economic growth and environmental sustainability [3]. For example, Gree and Haier have continued to launch green products to enhance their environmental image and promote green development. However, green technology innovation is characterized by high costs and high risk, which requires enterprises to pay a lot of design R&D costs and a long capital recovery period. This limits the enthusiasm of companies in the supply chain to implement green technology innovation [4].
Therefore, the government has implemented incentives to promote green technology innovation in supply chains. Typically, governments use subsidies as the main incentive for green technology innovation. Currently, there are two types of government subsidies available: green technology innovation subsidies and green product subsidies. The green technology innovation subsidy is a grant provided by the government to green manufacturers to improve green production technology and produce green products [5]. For example, in 2012, the European Commission invested €41.8 million in a green campaign for electric vehicles and provided funding for research and development (R&D) of energy technologies. In 2019, the UK’s innovation agency provided £20 million in R&D funding to support the development of advanced low-carbon propulsion in the automotive sector. Green product subsidies subsidize the manufacture of products, an example being Section 1142 of the American Recovery and Reinvestment Act (ARRA) Energy Incentives for Business, which creates a special tax credit for two types of plug-in vehicles, namely low-speed electric vehicles and two- or three-wheeled vehicles.
With the development of economic globalization and changes in the external environment, environmental pressures are driving companies to engage in green product research and development, and competition between companies is moving from a single price competition to a price–greenness competition. The increased costs of green product research and development are driving supply chain members to cooperate in response to environmental pressures, while at the same time they are competing to maximize their own interests, as in the case of Toyota and BMW, which are both jointly developing and competing in the end product market. If supply chain members join together horizontally to develop key green technologies, the total R&D costs will be reduced, but the reduction in customer perceptions of product variation will increase competition between the members. Obviously, under the price–greenness competition, the competitive game among supply chain members and the choice of R&D model are of great practical significance for the successful implementation of green supply chain management. The competitive strategic advantages of enterprises promote the management of green supply chains, leading to better performance. Enterprises are now pursuing the goal of sustainable development and have established strategic alliances to implement green supply chain management practices [6]. For example, the automotive companies YUDO and FAW have collaborated to jointly develop new energy vehicles. Toyota has collaborated with Panasonic to produce more environmentally friendly batteries. At the same time, due to information asymmetry, consumers may not be aware of the actual greenness of products and suspect that manufacturers’ green products are not as “green” as they portray them to be [7]. Therefore, in recent years, some companies have used blockchain technology to improve the traceability of information and increase consumer confidence in their products: for example, by using blockchain technology, IKEA can guarantee that the entire process is controlled, and that the final product is indeed made from a specific wood [8]. When manufacturers produce and distribute green products, if blockchain technology is applied to the supply chain, downstream agents (retailers and consumers) can also have access to valuable and reliable product information, increasing trust in the product [9].
In recent years, scholars have conducted extensive research on government subsidy approaches in supply chains. Specifically, product substitution, retail competition and demand uncertainty are considered in a three-tier supply chain model consisting of manufacturers, retailers, and consumers to address the question of who needs to be subsidized in the supply chain [10]. Two manufacturers with different green technologies competing that is sensitive to both price and pollution are also considered, a green target level for improving environmental quality is discussed, and an appropriate subsidy rate is designed [11]. In addition, Meng et al. considered three types of innovation subsidy scenarios and concluded that, when the government subsidizes manufacturers, intra-supply chain incentives can motivate the entire supply chain to implement green innovations [12]. In terms of corporate R&D models, Fu et al. constructs four game models based on the relationship between horizontal competitive cooperation among automakers and R&D models [13]. Yang et al. developed a game model consisting of a government and two competing firms and concluded that joint R&D should be conducted when R&D is more difficult, while individual R&D should be conducted when the profits from increased market size are relatively large [14]. Moreover, two companies may fall into a prisoner’s dilemma when they reach the equilibrium of improving technology. With the development of the Internet, a lot of research has also been done on the strategy of using blockchain in the supply chain: for example, blockchain technology can reduce business risks and transaction costs, but blockchain requires initial implementation investment and variable costs, so the conditions and stochastic situations where blockchain is not worth implementing are identified [15]. Niu et al. studied the impact of blockchain on aggregate and customer surplus and found that blockchain adoption always benefits customers and society; retailers have an incentive to participate in blockchain when competition from manufacturers is mild and demand variance is low [16]. Dong et al. found that core companies should not establish their own original channels when their primary business is selling high-cost products or when the marginal cost of blockchain implementation is large enough [17].
However, most of these studies do not consider the choice of companies’ R&D strategies, blockchain usage strategies and the choice of government subsidy options under different competing environments. The main research questions addressed in this study are as follows:
  • How do consumers’ preferences for green products and the difficulty of research and development affect product pricing and product greenness?
  • How do government technology subsidies and product subsidies work in different competition and cooperation relationships between enterprises? Which decision model is more beneficial to the maximization of social welfare?
  • How do the government’s product subsidies and technology subsidies for enterprises affect the green degree of products and enterprise profits under different R&D models? Does R&D difficulty play a role?
  • In what kind of enterprise relationship is blockchain easier to apply?
Therefore, this paper synthesizes the impact of government subsidy strategies and the choice of different strategies of enterprises on green technology innovation and provides a theoretical research framework for the choice of government subsidy strategy and the choice of enterprise R&D model.
The remainder of this paper is organized as follows. Section 2 provides a literature review. Section 3 describes the basic model setup. Section 4 solves the model. Section 5 explores the impact of government subsidy strategies and firms’ choices of different strategies on green technology innovation. After the detailed numerical study in Section 6, Section 7 concludes the paper.

2. Literature Review

The application of blockchain technology, inter-firm competition and cooperative R&D and green technology innovation subsidy mechanisms have been extensively studied in supply chain management. This section reviews and summarizes the literature related to blockchain technology, inter-firm competition and cooperative R&D and green technology innovation subsidy mechanisms and the application of game theory.

2.1. Green Technology Innovation Subsidy

In the study of subsidy strategies, scholars’ research mainly focuses on the study of different subsidy strategies, and some scholars have discussed which of these two subsidy policies has a greater impact on social welfare [18]. At the same time, some research results show that direct government subsidies are beneficial to enterprises in the short term but hinder the long-term innovation performance of enterprises. [19]. Bian et al. used a game theory approach to compare product subsidies and technology subsidies to two environmental subsidy policies and found that yield subsidies yielded higher social welfare compared to technology subsidies [20]. For an evolving industry, social welfare always improves as the industry grows when the government provides subsidies for green technology development [21]. Some scholars have also established a model based on differential game to explore the optimal production and subsidy rates considering the different objectives of the maximization of government social welfare and the maximization of government utility [22]. Public R&D subsidies are a commonly adopted policy tool to promote exploratory innovation in firms and encourage new knowledge learning [23]. When there is a risk of R&D failure, under the same subsidy expenditure conditions, some scholars have also discussed which subsidy method can maximize social welfare [24]. In addition to firms in general, there are some studies on the impact of government R&D subsidies on green innovation in energy-intensive firms [25]. According to Lee et al.’s studies of market economies that consider environmental factors, the presence of publicly owned firms has encouraged the government to adopt subsidy policies [26]. In the new energy vehicle industry, the Chinese government closely monitors and provides billions in R&D subsidies to help new energy vehicle companies research their common technologies [27]. Dong finds that R&D subsidies can change the direction of technology and thus affect environmental quality, and that different types of R&D subsidies affect the direction of technological change and environmental quality in different ways [28]. Cristian et al. found that increasing R&D subsidies slightly reduces prices [29]. Renewable energy investments are important for achieving green development, but their heavy reliance on government subsidies leads to financial constraints and market inefficiencies that hinder their sustainable development [30].

2.2. Inter-Firm Competition and Cooperative R&D

The existing literature usually assumes that joint R&D is better while ignoring the positive effects of individual R&D. Ishikawa and Shibata. explored the impact of asymmetric spillovers on R&D investments in oligopolistic markets. R&D was found to be affected by spillovers from competitors, and an increase in the degree of market competitiveness can generate social preference for R&D competition [31]. Esenduran et al. developed a Cournot competition model between original equipment manufacturer (OEM) and independent remanufacturer (IR) models to investigate the impact of retraction regulation and provide insights into its effectiveness [32]. As technology advances and information technology becomes more prevalent, product life cycles shorten, R&D costs and product development risks rise, and more and more firms choose to collaborate with other firms in R&D to ensure competitive advantage [33]. However, Minshall et al. found that the shift from traditional in-house R&D to collaborative R&D requires companies to adopt a new mindset and show a strong motivation for change [34]. Weber et al. examined the impact of the intensity of collaboration with different types of partners on corporate innovation. The results show that company cooperation is generally beneficial [35]. Collaboration in concept and product development mainly increases the innovation capacity of the company, while collaboration in the implementation phase mainly increases the innovation success of the company. With respect to the type of collaboration, vertical, horizontal and institutional collaboration significantly increased the innovation capacity and success of the firm. Young et al. explored the impact of collaboration on R&D productivity in the innovation process and showed that firms which collaborate with competitors in R&D during the value creation phase have relatively higher R&D productivity than those that do not collaborate [36]. Carree et al. modeled the breadth of the optimal partnership portfolio and found that small and low R&D-intensive companies benefit more from starting an R&D partnership compared to large and/or R&D-intensive companies [37]. Fan et al. considered an electric vehicle supply chain consisting of a battery supplier, a well-known brand manufacturer (manufacturer A), and a generic brand manufacturer (manufacturer B), and examined the non-collaboration strategy, the collaboration strategy between the battery supplier and manufacturer A, and the collaboration strategy between the battery supplier and manufacturer B. It was found that the vertical collaboration strategy did not always improve the overall profitability of the supply chain capability [38].
In recent years, environmental issues have received much attention and many scholars have started to study competitive cooperation in green R&D activities. Zhang et al. established an oligopoly model to study the green and quality investment choices of two competing companies with different product quality. They found that no company decides to make green investment when green investment and quality investment are substitutes, while when green investment and quality investment are complements, whether a company makes green investment depends on the efficiency of green investment [39]. Zhang et al. examined the dynamics of green innovation by developing a differential game model and found that, in the non-cooperative model, the emissions and profits of the hitchhiking manufacturer are lower than those of the innovative manufacturer, and, in the cooperative model, the green manufacturer’s innovation increases while the green supplier’s innovation decreases [40]. Chen et al. explored the green R&D cooperation behavior of companies in dual supply chains and found that the improvement of R&D cooperation on companies’ economic performance depends mainly on the level of companies’ own green contribution [41]. Dai et al. analyzed two typical cooperative behaviors of two chain members through a game-theoretic approach, both of which are interested in forming R&D cooperation to achieve superior energy-saving performance in their products. Green innovation cooperation between downstream companies and upstream suppliers can achieve higher environmental benefits [42].

2.3. Application of Blockchain Technology

The application of blockchain technology is extensive. For example, some studies have found that blockchain can be used to store pseudonym transaction records in untrusted environments [43]. We classify the current application of blockchain technology in the supply chain into three broad areas: (1) The value of blockchain in the supply chain and the ways to achieve it. Balan et al. identified the key implementation guidelines and issues of blockchain in supply chain management by exploring the needs of blockchain in the industry 4.0 supply chain management environment from the perspective of big data [44]. Some scholars have found that the shipping, manufacturing, finance, technology, energy, healthcare, e-commerce, education, agriculture and food industries can be successfully transformed by applying blockchain technology to enhance visibility and optimize business process management. [45]. Piera et al. proposed an integrated three-tier revisiting framework for designing circular blockchain platforms and highlighted the role of blockchain as a technological capability to improve the control of waste flows and product return management activities [46]. Wamba et al. developed and tested a model in two countries, India and the United States. The findings highlight the importance of supply chain transparency and blockchain transparency, both of which are important prerequisites for supply chain performance [47]. It is shown that blockchain applications can improve supply chain performance. (2) Research content and methods for blockchain adoption in supply chains. Lim et al. reviewed publications related to blockchain-based supply chains between 2017 and 2020, addressing the value of blockchain in supply chains [48]. Liu et al. considered the goodwill of traceability and product freshness supported using blockchain when selling fresh food on e-commerce platforms, exploring whether e-platforms choose to resell or broker fresh food [49]. Competition between the dual channels was found to potentially lead to higher prices for fresh foods and incentivize companies to invest more in product freshness and blockchain-enabled traceability goodwill. Kohler and Massimo used a technology assessment framework to analyze the technologies invested in blockchain in the food supply chain, and the results indicated that, while blockchain-based technologies are expected to have a variety of impacts, only some impacts, such as increased transparency, traceability and trust, can be directly attributed to blockchain elements [50]. In addition, blockchain technology has important applications in cross-border e-commerce supply chains, and its contributions are mainly concentrated on cross-border e-commerce platforms, supply chain operation, data governance and information management [51]. (3) Blockchain Enables Green Supply Chains. Xu et al. explored the best strategies for pricing and “green” investments in green products under different government subsidies and explored the conditions for adopting blockchain technology [9]. Bai et al. proposed a green data supply chain and trust management was developed to record the trust values of sensors in the blockchain [52]. Rane et al. discussed the ranking of critical success factors using the advantages of blockchain and internet of things (IoT) technologies using decision experiments and evaluation lab methods and found that collaboration with buyers to implement green initiatives is most important for green supply chains [53]. Bag et al. used an integrated fuzzy decision-making test and evaluation lab approach to analyze causality and prioritize barriers to the adoption of blockchain technology in green supply chain management [54]. Liu et al. modeled and analyzed the benefits of producers and retailers before and after using big data and blockchain and concluded that the use of big data and blockchain can reap more benefits when the total investment cost paid by producers and retailers is within a certain range [55]. We summarize the differences between these studies and this work from multiple dimensions in Table 1.
In summary, there are many studies on the application of blockchain technology in supply chains and government green R&D subsidy strategies, but few scholars have considered the relationship and choice between the competition and cooperation of companies in the context of blockchain technology and under the influence of government subsidy strategies. Therefore, this paper considers the effects of blockchain technology application platforms, government R&D subsidies, consumer green trust and consumer preferences, and analyzes the effects of blockchain technology application and different R&D models on social welfare and green R&D strategies by comparing manufacturers’ non-cooperation and cooperation before and after blockchain technology application, R&D models and government subsidy strategies in sixteen contexts, so as to provide a basis for blockchain. The impact of blockchain technology application and different R&D models on social welfare and green R&D strategies is analyzed to provide targeted suggestions for governmental low-carbon subsidies in the context of blockchain technology.

3. Problem Description and Basic Assumptions

3.1. Symbol Description

The following are the parameters used in our model, as shown in Table 2

3.2. Problem Description

Cooperative research and development among competing manufacturers has become a common practice in the industry because joint research efforts avoid the duplication of research and development activities and allow learning through sharing knowledge, thereby reducing research and development costs through sharing investment. Since using different components is an important way for companies to differentiate their products, it is costly to jointly develop a component, because customers may think that the product difference is low. For example, BMW is worried that when it forms a research and development alliance with DaimlerChrysler to jointly develop a dual-mode hybrid drive system, it will have a small difference from DaimlerChrysler and General Motors. Therefore, the formation of a research and development alliance may not always be conducive to competition. In some cases, even if the competing companies are supply chain partners, they may choose to carry out their research and development activities independently in order to develop different components. In this paper, we study a two-stage supply chain with two manufacturers M i (i = 1, 2) and one retailer R. Both manufacturers produce green products with competition in price and greenness, and products are substitutable. The government determines green technology subsidy coefficient μ or product subsidy coefficient θ for the manufacturer with the decision objective of maximizing the total social welfare level. The manufacturer M i (i = 1, 2) supplies retailer R at wholesale price w i and the retailer sells the product at retail price P i . Consumers decide their demand for product i based on its greenness e i and price P i .
Suppose the market demand function for two substitutable products is d i = α p i 1 γ + γ p j 1 γ ( i { 1 , 2 } , j = 3 i ) . Since consumers have green preferences, the following demand function d i = α p i 1 γ + γ p j 1 γ + τ ( e i 1 γ - γ e i 1 γ ) is constructed when there is price and greenness competition, and this demand function reflects that consumers’ green preferences are positively related to product demand. The smaller the difference between two products perceived by consumers and the stronger the substitutability, the greater the γ, i.e., the more intense the competition between the two products.
For green technology innovation, the two manufacturers can develop independently or jointly. When jointly conducting R&D, the two products have the same greenness e 0 , and consumers perceive less product differentiation and more substitutability, and the competition between the two products becomes more intense. Using χ to represent the increased competition between products due to joint R&D, the market demand function of the two products when jointly conducting R&D is d i = α p i 1 γ χ + γ χ p j 1 γ χ + τ ( e i 1 γ χ γ χ e i 1 γ χ ) , 0 γ χ < 1 .
There is horizontal non-cooperation or cooperation between the two manufacturers: in the horizontal non-cooperation model, the two manufacturers seek to maximize their respective returns; in the horizontal cooperation model, the two manufacturers seek to maximize their overall returns. In addition, in the cooperative R&D strategy, the product greenness is jointly determined by the two manufacturers, and, in the individual R&D strategy, the product greenness is determined by the two manufacturers separately.
Governments invest in building blockchain platforms and manufacturers improve their green credentials and market demand by purchasing blockchain technology. At the same time, the government encourages manufacturers through different forms of subsidies. The government’s technical subsidies to manufacturers are expressed as μ k ( e 1 2 + e 2 2 ) 2 , and the production subsidies are expressed as θ ( d 1 + d 2 ) . The government implements TS or PS for manufacturers, and monitors manufacturers greenly through the blockchain platform. Consumers enhance green trust through blockchain technology for product traceability. Consumer low-carbon preferences and green trust affect the market demand for low-carbon products. Enterprises need to weigh the relationship between the blockchain platform application cost and profit and make optimal blockchain application decisions and R&D strategies to maximize the profit of manufacturers. The government needs to weigh the relationship between greenness and social welfare and decide on the subsidy method to maximize social profit.
Based on the competing relationships, R&D patterns and government subsidy strategies of manufacturers before and after the application of blockchain technology, sixteen game strategies were formed, as shown in Table 3. The model of this paper is shown in Figure 1.

3.3. Conditional Assumptions

Hypothesis 1.
Manufacturers and retailers have perfectly symmetric information about the market, manufacturers produce low-carbon products in equal quantities to market demand, and the market can be completely cleared.
Hypothesis 2.
Carbon emissions are generated only in the production process, and manufacturers achieve emission reductions through abatement technology inputs and manufacturers’ carbon abatement cost function c r = k e 2 2 .
Hypothesis 3.
Both manufacturers produce green products, so the greenness of the product satisfies e i > 0 .
Hypothesis 4.
Market demand is determined by a combination of product price, carbon reduction rate, consumer low-carbon preference and green trust.
Hypothesis 5.
In addition, we also considered the impact of government decisions on the whole supply chain. Social welfare is similar to Barman et al. [56]; the entire social welfare can be given by: π g = π m 1 + π m 2 + π r k μ ( e 1 2 + e 2 2 ) 2 , or π g = π m 1 + π m 2 + π r θ ( d 1 + d 2 ) when the government subsidized production at that time.

4. Modeling and Solution

4.1. Strategy 1

The decision sequence of strategy 1 is as follows: the government first determines its technology subsidy coefficient based on maximizing social welfare, manufacturers set their wholesale price and product greenness based on maximizing their respective revenue, and retailers then decide the retail price of both products. This game model can be described as
max μ π g = π m 1 + π m 2 + π r k μ ( e 1 2 + e 2 2 ) 2
max w 1 , e 1 π m 1 = ( w 1 c ) ( α p 1 η τ e 1 1 γ + γ p 2 η τ e 2 1 γ ) ( 1 μ ) k e 1 2 2
max w 2 , e 2 π m 2 = ( w 2 c ) ( α p 2 η τ e 2 1 γ + γ p 1 η τ e 1 1 γ ) ( 1 μ ) k e 2 2 2
max p 1 , p 2 π r = ( p 1 w 1 ) ( α p 1 η τ e 1 1 γ + γ p 2 η τ e 2 1 γ ) + ( p 2 w 2 ) ( α p 2 η τ e 2 1 γ + γ p 1 η τ e 1 1 γ )
In strategy 1, the government firstly determines the optimal TS coefficient μ , and then manufacturers determine optimal greenness e i and wholesale price w , while the retailer determines retail price p i . By maximizing social welfare and the revenue of manufacturers and retailer, we obtain
μ = γ 1 2 γ 3 , e 1 = τ η ( 3 - 2 γ ) ( α - c ) 2 k ( 2 - γ ) 2 τ 2 η 2 ( 3 - 2 γ )
w 1 = 2 k ( 2 - γ ) [ α ( 1 - γ ) + c ] + 2 c γ τ 2 η 2 2 k ( 2 - γ ) 2 τ 2 η 2 ( 3 - 2 γ )
π g = k ( 3 - 2 γ ) ( α - c ) 2 2 k ( 2 - γ ) 2 τ 2 η 2 ( 3 - 2 γ )
p 1 = k ( 2 - γ ) [ α ( 3 - 2 γ ) + c ] - c τ 2 η 2 ( 3 - 2 γ ) 2 k ( 2 - γ ) 2 τ 2 η 2 ( 3 - 2 γ )
π m = k ( 2 - γ ) ( α - c ) 2 [ 4 k ( 1 - γ ) ( 2 - γ ) τ 2 η 2 ( 3 - 2 γ ) ] [ 2 k ( 2 - γ ) 2 τ 2 η 2 ( 3 - 2 γ ) ] 2
Proof. 
According to the inverse solution method, first let π r 1 p = 0 obtain
p 1 = α + w 1 + e 1 τ η 2
Substituting Equation (5) into Equation (3), we obtain the Hessian matrix:
H = [ 2 π m w 2 2 π m w e 2 π m w e 2 π m e 2 ] = [ 1 γ 1 τ η 2 ( 1 γ ) τ η 2 ( 1 γ ) k μ 1 ]
When k > τ 2 η 2 ( 1 μ ) 4 ( 1 γ ) , 1 γ 1 < 0 and k ( γ 1 ) ( μ 1 ) > η 2 τ 2 4 ( 1 γ ) 2 , the Hessian matrix is negative definite, and there exists an optimal carbon reduction rate and wholesale price that maximizes the manufacturer’s revenue. Let π m 1 w = 0 , π m 1 e = 0 obtain
w 1 = η τ ( α c ) 2 k ( 1 μ ) ( 2 γ ) η 2 τ 2
e 1 = 2 k ( 1 μ ) ( α + c α γ ) η 2 τ 2 c 2 k ( 1 μ ) ( 2 γ ) η 2 τ 2
Substituting Equations (2–4), (7) and (8) into Equation (1):
π g 1 = k ( α c ) 2 ( 2 k ( 3 2 γ ) ( 1 μ ) 2 η 2 τ 2 ) [ 2 k ( 1 μ ) ( 2 γ ) η 2 τ 2 ] 2
Because 2 π g 1 μ 2 < 0 , there exists an optimal subsidy rate μ that maximizes social welfare. Let π g 1 μ = 0 obtain the optimal subsidy rate μ .
μ = γ 1 2 γ 3
Putting Equation (10) into Equations (5), (7) and (8), we obtain:
e 1 = τ η ( 3 - 2 γ ) ( α - c ) 2 k ( 2 - γ ) 2 τ 2 η 2 ( 3 - 2 γ )
w 1 = 2 k ( 2 - γ ) [ α ( 1 - γ ) + c ] + 2 c γ τ 2 η 2 2 k ( 2 - γ ) 2 τ 2 η 2 ( 3 - 2 γ )
p 1 = k ( 2 - γ ) [ α ( 3 - 2 γ ) + c ] - c τ 2 η 2 ( 3 - 2 γ ) 2 k ( 2 - γ ) 2 τ 2 η 2 ( 3 - 2 γ )
From the above equation, optimal manufacturer profit and optimal social welfare are obtained as follows.
π m = k ( 2 - γ ) ( α - c ) 2 [ 4 k ( 1 - γ ) ( 2 - γ ) τ 2 η 2 ( 3 - 2 γ ) ] [ 2 k ( 2 - γ ) 2 τ 2 η 2 ( 3 - 2 γ ) ] 2
π g = k ( 3 - 2 γ ) ( α - c ) 2 2 k ( 2 - γ ) 2 τ 2 η 2 ( 3 - 2 γ )

4.2. Strategy 2

The decision sequence of strategy 2 is as follows: first, the government determines its technology subsidy coefficient based on maximizing social welfare; secondly, two manufacturers decide on joint or individual R&D, based on maximizing total revenue to determine the common greenness of products e 0 ; the R&D cost of manufacturer 1 is λ ( 1 μ ) k e 0 2 2 , and R&D of manufacturer 2 is ( 1 λ ) ( 1 μ ) k e 0 2 2 . Then, two manufacturers determine the wholesale price based on maximizing their respective revenue. In the end, the retailer determines the retail prices of the two products based on maximizing its own revenue. The game model can be expressed as
max μ π g = π m 1 + π m 2 + π r k μ e 0 2 2
max w 1 π m 1 = ( w 1 c ) ( α p 1 η τ e 0 1 γ χ + γ χ p 2 η τ e 0 1 γ χ ) λ ( 1 μ ) k e 0 2 2
max w 2 π m 2 = ( w 2 c ) ( α p 2 η τ e 0 1 γ χ + γ χ p 1 η τ e 0 1 γ χ ) ( 1 λ ) ( 1 μ ) k e 0 2 2
max p 1 , p 2 π r = ( p 1 w 1 ) ( α p 1 η τ e 0 1 γ χ + γ p 2 η τ e 0 1 γ χ ) + ( p 2 w 2 ) ( α p 2 η τ e 0 1 γ χ + γ p 1 η τ e 0 1 γ χ )
For the solution process, please refer strategy 1; optimal greenness, optimal pricing, optimal manufacturer profit and optimal social welfare are:
p 2 = k ( 2 - χ γ ) [ α ( 3 - 2 χ γ ) + c ] 2 c τ 2 η 2 ( 3 - 2 χ γ ) 2 k ( 2 - χ γ ) 2 2 τ 2 η 2 ( 3 - 2 χ γ )
e 2 = τ η ( 3 - 2 χ γ ) ( α - c ) k ( 2 - χ γ ) 2 τ 2 η 2 ( 3 - 2 χ γ )
π m = k ( 1 - χ γ ) ( α - c ) 2 k ( 2 - χ γ ) 2 τ 2 η 2 ( 3 - 2 χ γ )
π g = k ( 3 - 2 χ γ ) ( α - c ) 2 2 k ( 2 - χ γ ) 2 2 τ 2 η 2 ( 3 - 2 χ γ )

4.3. Strategy 3

The decision sequence of strategy 3 is as follows: the government first determines the technology subsidy coefficient based on maximizing social welfare; the manufacturers then jointly set their respective wholesale prices and product greenness based on maximizing overall revenue; then, the retailers decide the retail prices based on maximizing their own revenue. This game model is
max μ π g = π m 1 + π m 2 + π r k μ ( e 1 2 + e 2 2 ) 2
max w 1 , e 1 , w 2 , e 2 π m = ( w 1 c ) ( α p 1 η τ e 1 1 γ + γ p 2 η τ e 2 1 γ ) ( 1 μ ) k e 1 2 2 + ( w 2 c ) ( α p 2 η τ e 2 1 γ + γ p 1 η τ e 1 1 γ ) ( 1 μ ) k e 2 2 2
max p 1 , p 2 π r = ( p 1 w 1 ) ( α p 1 η τ e 1 1 γ + γ p 2 η τ e 2 1 γ ) + ( p 2 w 2 ) ( α p 2 η τ e 2 1 γ + γ p 1 η τ e 1 1 γ )
In strategy 3, optimal greenness, optimal pricing, optimal manufacturer profit and optimal social welfare are:
e 3 = 3 η τ ( α c ) 8 k - 3 η 2 τ 2
p 3 = 2 k ( 3 α + c ) 3 c η 2 τ 2 8 k 3 η 2 τ 2
π m = 2 k ( α c ) 2 8 k - 3 η 2 τ 2
π g = 3 k ( α c ) 2 8 k 3 η 2 τ 2

4.4. Strategy 4

The decision sequence of strategy 4 is thus: first, the government determines its technology subsidy coefficient based on social welfare maximization; then, two manufacturers jointly conduct R&D, set the same greenness for both products based on the overall revenue maximization e 0 , manufacturer 1 and manufacturer 2 share the R&D cost, and then each sets its respective wholesale price; finally, retailers decide the retail price of both products based on their own revenue maximization principles. This game model is
max μ π g = π m 1 + π m 2 + π r k μ e 0 2 2
max e 0 π m = ( w 1 c ) ( α p 1 η τ e 0 1 γ χ + γ χ p 2 η τ e 0 1 γ χ ) + ( w 2 c ) ( α p 2 η τ e 0 1 γ χ + γ χ p 1 η τ e 0 1 γ χ ) ( 1 μ ) k e 0 2 2
max w 1 , w 2 π m = ( w 1 c ) ( α p 1 η τ e 0 1 γ χ + γ χ p 2 η τ e 0 1 γ χ ) + ( w 2 c ) ( α p 2 η τ e 0 1 γ χ + γ χ p 1 η τ e 0 1 γ χ ) ( 1 μ ) k e 0 2 2
max p 1 , p 2 π r = ( p 1 w 1 ) ( α p 1 η τ e 0 1 γ χ + γ p 2 η τ e 0 1 γ χ ) + ( p 2 w 2 ) ( α p 2 η τ e 0 1 γ χ + γ p 1 η τ e 0 1 γ χ )
In strategy 4, optimal greenness, optimal pricing, optimal manufacturer profit and optimal social welfare are
e 4 = 3 η τ ( α c ) 4 k 3 η 2 τ 2
p 4 = k ( 3 α + c ) - 3 c η 2 τ 2 4 k 3 η 2 τ 2
π m = k ( α c ) 2 4 k 3 η 2 τ 2
π g = 3 k ( α c ) 2 2 ( 4 k 3 η 2 τ 2 )
The difference between Strategies 5–8 and Strategies 1–4 is that Strategies 5–8 transform the technology R&D subsidy μ into product subsidy θ . Strategies 9–16 introduce blockchain technology compared to Strategies 1–8, making the level of consumer green trust η = 1, while increasing the cost of building the blockchain for the government I and the cost of using the blockchain for manufacturers φ. The specific results are shown in the table below. The results of the model are shown in Table 4.

5. Analysis of Results

Proposition 1.
The R&D coefficient k has a negative impact on social welfare, greenness and the price of green products.
Proposition 2.
Green preferences τ have a positive effect on social welfare, greenness and the price of green products.
Proposition 3.
When the supply chain does not adopt blockchain technology, consumer green trust η has a positive impact on social welfare, greenness and the price of green products; when the supply chain adopts blockchain technology, consumers can accurately know the greenness information of low-carbon products, and the green trust coefficient η = 1 , the impact of consumer green trust η on social welfare, and the greenness and selling price of green products reach the maximum.
Proposition 4.
Substitutability γ has a positive effect on social welfare and greenness; the effect of substitutability γ on the price of green products is related to the R&D coefficient k ; when the R&D coefficient k ( k < η 2 τ 2 ( 3 2 γ ) 2 2 ( 2 - γ ) 2 ) is small, substitutability γ has a positive effect on the selling price of green products; otherwise it has a negative effect.
Proposition 5.
The degree of competition χ has a positive effect on social welfare and greenness, and the effect of the degree of competition χ on the price of green products is related to the R&D coefficient. When the R&D coefficient k ( k < η 2 τ 2 ( 3 2 χ γ ) 2 2 ( 2 χ γ ) 2 ) is small, the degree of competition χ has a positive effect on the price of green products; otherwise it has a negative effect.
Conclusion 1.
Social welfare, greenness and selling price decrease as R&D difficulty increases and increase as consumer green preferences increase.
Since green technology innovation is characterized by high costs and long lead times, manufacturers may not increase the price of their products when green R&D is difficult, but rather invest less in green R&D, sell fewer green products, and reduce the price of green products to improve product competitiveness, while the degree of competition among products and increased substitutability will further reduce prices. Meanwhile, according to a consumer survey, 80% of consumers are willing to pay extra to buy low-carbon products (Zhang et al., 2020). Therefore, products with low greenness have difficulty meeting the green demand of consumers and will have a negative impact on social welfare. To improve social welfare the government should increase subsidies to enterprises and promote green R&D.
Proposition 6.
When two firms choose their respective R&D in competition, the output subsidy is always the optimal choice for the government.
Proposition 7.
When manufacturers are not in cooperation and choose joint R&D, when χ γ < 0.5 , or γ χ > 0.5 and k > η 2 τ 2 ( 3 2 χ γ ) χ 2 γ 2 ( 2 χ γ ) 2 ( 1 χ γ ) 2 ), PS is the optimal choice for the government. Otherwise, when η 2 τ 2 ( 3 2 χ γ ) 2 2 ( 2 χ γ ) 2 < k < η 2 τ 2 ( 3 2 χ γ ) χ 2 γ 2 ( 2 χ γ ) 2 ( 1 χ γ ) 2 , TS is the optimal choice for the government.
Proposition 8.
When manufacturers are in cooperation and choose individual R&D, PS is always the optimal choice for the government.
Proposition 9.
When manufacturers are in cooperation and choose joint R&D, PS is always the optimal choice for the government.
Proposition 10.
When manufacturers are not in cooperation and choose individual R&D, PS is always the optimal choice for the government.
Proposition 11.
When manufacturers are not in cooperation and choose joint R&D, when χ γ < 0.5 , or γ χ > 0.5 and k > τ 2 ( 3 2 χ γ ) χ 2 γ 2 ( 2 χ γ ) 2 ( 1 χ γ ) 2 , PS is always the optimal choice for the government. Otherwise, when τ 2 ( 3 2 χ γ ) ( 2 χ γ ) 2 < k < τ 2 ( 3 2 χ γ ) χ 2 γ 2 ( 2 χ γ ) 2 ( 1 χ γ ) 2 , TS is the optimal choice for the government.
Proposition 12.
When manufacturers are in cooperation and choose individual R&D, PS is the optimal choice for the government.
Proposition 13.
When manufacturers are in cooperation and choose joint R&D, PS is the optimal choice for the government.
Conclusion 2.
When manufacturers are in cooperation, PS can help the government obtain higher social welfare. If manufacturers are not in cooperation and choose joint R&D, when τ 2 ( 3 2 χ γ ) ( 2 χ γ ) 2 < k < τ 2 ( 3 2 χ γ ) χ 2 γ 2 ( 2 χ γ ) 2 ( 1 χ γ ) 2 and γ χ > 0.5 , the government can obtain higher social welfare by choosing TS.
The government welfare consists of a combination of consumer surplus, manufacturer profits and subsidy expenditures. Companies will tend to reduce the selling price of their products in a non-cooperation relationship. Furthermore, the increase in product substitutability and the perceived intensity of competition received by consumers will further reduce the selling price of their products, ultimately leading to an increase in product demand and consumer surplus. Companies reduce product costs through joint R&D, which ultimately leads to increased profits for manufacturers. The increase in demand causes the government to favor technology subsidies over PS which both reduce subsidy expenditures, so the government can obtain higher social welfare by choosing TS in this case.
Proposition 14.
PS can obtain higher greenness when manufacturers are not in cooperation and choose individual R&D.
Proposition 15.
When manufacturers are not in cooperation and choose joint R&D, PS achieves a higher degree of greenness when 0 < γ χ < 1 - 2 2 . When 1 - 2 2 < γ χ < 0.5 , TS achieves a higher degree of greenness if k > 2 τ 2 η 2 ( 3 - 2 χ γ ) ( 1 - χ γ ) χ γ ( 2 χ γ ) 2 ( 4 χ γ 2 χ 2 γ 2 1 ) . When γ χ > 0.5 , the TS achieves a higher degree of greenness if k > τ 2 η 2 ( 3 2 γ χ ) ( 2 γ χ ) 2 .
Proposition 16.
PS can obtain a higher degree of greenness when manufacturers are in cooperation and whether or not they opts for joint R&D.
Proposition 17.
PS can obtain a higher degree of greenness when manufacturers are not in cooperation and choose individual R&D.
Proposition 18.
In the blockchain context, when manufacturers are not in cooperation and choose joint R&D, PS achieves a higher degree of greenness when 0 < γ χ < 1 - 2 2 . When 1 - 2 2 < γ χ < 0.5 and k > 2 τ 2 ( 3 - 2 χ γ ) ( 1 - χ γ ) χ γ ( 2 χ γ ) 2 ( 4 χ γ 2 χ 2 γ 2 1 ) , or when γ χ > 0.5 and k > τ 2 ( 3 2 γ χ ) ( 2 γ χ ) 2 , TS can obtain higher greenness.
Proposition 19.
PS can obtain a higher degree of greenness when manufacturers are in cooperation and choose individual R&D.
Proposition 20.
PS can obtain a higher degree of greenness when manufacturers are in cooperation and choose joint R&D.
Conclusion 3.
When manufacturers choose individual R&D, PS can help the government achieve a higher degree of greenness. When manufacturers are not in cooperation and choose joint R&D, if γ χ > 0.5 and k > τ 2 η 2 ( 3 2 γ χ ) ( 2 γ χ ) 2 , or 1 - 2 2 < γ χ < 0.5 and k > 2 τ 2 η 2 ( 3 - 2 χ γ ) ( 1 χ γ ) χ γ ( 2 χ γ ) 2 ( 4 χ γ 2 χ 2 γ 2 1 ) ), TS can achieve higher greenness.
Enterprises will reduce the selling price of products under a competitive relationship; product substitutability and consumers’ perceived increase in the intensity of competition will further reduce the selling price of products, while the increased difficulty of green R&D will prompt enterprises to reduce product costs through joint R&D, while the government will incentivize enterprises to continue green R&D through technology subsidies. Therefore, the government can obtain higher greenness by choosing technology subsidies in this case.
Proposition 21.
When the government chooses TS and manufacturers choose not to use blockchain, if manufacturers are not in cooperation, joint R&D can achieve higher profits.
Proposition 22.
When the government chooses PS and manufacturers choose not to use blockchain, if manufacturers are not in cooperation, individual R&D can achieve higher profits when η 2 τ 2 2 < k < η 2 τ 2 ( 2 + 1 ) 2 2 . Otherwise, when k > η 2 τ 2 ( 2 + 1 ) 2 2 , joint R&D can achieve higher profits.
Proposition 23.
When the government chooses TS and manufacturers choose not to use blockchain, if manufacturers are in cooperation, joint R&D can achieve higher profits.
Proposition 24.
When the government chooses TS manufacturers choose not to use blockchain, if manufacturers are in cooperation, individual R&D can achieve higher profits when η 2 τ 2 2 < k < η 2 τ 2 ( 3 + 1 ) 2 3 . Otherwise, when k > η 2 τ 2 ( 3 + 1 ) 2 3 , joint R&D can achieve higher profits.
Proposition 25.
When the government chooses TS and manufacturers use blockchain, if manufacturers are not in cooperation, joint R&D can achieve higher profits.
Proposition 26.
When the government chooses TS and manufacturers use blockchain, if manufacturers are not in cooperation, when τ 2 2 < k < τ 2 ( 3 + 1 ) 2 3 , individual R&D can achieve higher profits. Otherwise, when k > τ 2 ( 3 + 1 ) 2 3 , joint R&D can achieve higher profits.
Proposition 27.
When the government chooses TS and manufacturers use blockchain, if manufacturers are in cooperation, joint R&D can achieve higher profits.
Proposition 28.
When the government chooses PS and manufacturers use blockchain, if manufacturers are in cooperation, when τ 2 2 < k < 4 τ 2 ( 2 + 1 ) 9 2 , individual R&D can achieve higher profits. Otherwise, when k > 4 τ 2 ( 2 + 1 ) 9 2 , joint R&D can achieve higher profits.
Conclusion 4.
When the government chooses TS, joint R&D can achieve higher profits. When the government chooses PS, if η 2 τ 2 2 < k < η 2 τ 2 ( 2 + 1 ) 2 2 , individual R&D can achieve higher profits. Otherwise, if k > η 2 τ 2 ( 2 + 1 ) 2 2 , joint R&D can achieve higher profits.
When the government chooses TS, it can stimulate manufacturers to conduct green R&D. To reduce R&D costs, manufacturers will actively seek to cooperate with other manufacturers in R&D to obtain higher profits. When the government chooses PS, whether manufacturers choose individual R&D or joint R&D is related to the difficulty of R&D. When the difficulty of R&D is high, manufacturers will choose joint R&D to reduce the cost; when the difficulty of R&D is low, if they continue to choose joint R&D, the transaction cost brought will be greater than the cost reduced by joint R&D, so manufacturers will choose individual R&D.
Proposition 29.
When the government chooses TS, if manufacturers are not in cooperation and choose individual R&D, when k > τ 2 [ ( α c ) 2 η 2 ( α c φ ) 2 ] ( 2 χ γ ) 2 [ ( α c ) 2 ( α c φ ) 2 ] , not using blockchain can achieve higher profits. Otherwise, when τ 2 ( 2 χ γ ) 2 < k < τ 2 [ ( α c ) 2 η 2 ( α c φ ) 2 ] ( 2 χ γ ) 2 [ ( α c ) 2 ( α c φ ) 2 ] , using the blockchain can achieve higher profits.
Proposition 30.
When the government chooses TS, if manufacturers are not in cooperation and choose joint R&D, when k > τ 2 ( 3 2 χ γ ) [ ( α c ) 2 η 2 ( α c φ ) 2 ] ( 2 χ γ ) 2 [ ( α c ) 2 ( α c φ ) 2 ] , not using blockchain can achieve higher profits. Otherwise, when τ 2 ( 3 2 χ γ ) ( 2 χ γ ) 2 < k < τ 2 ( 3 2 χ γ ) [ ( α c ) 2 η 2 ( α c φ ) 2 ] ( 2 χ γ ) 2 [ ( α c ) 2 ( α c φ ) 2 ] , using blockchain can achieve higher profits.
Proposition 31.
When the government chooses TS, if manufacturers are in cooperation and choose individual R&D, when k > 3 τ 2 [ ( α c ) 2 η 2 ( α c φ ) 2 ] 8 [ ( α c ) 2 ( α c φ ) 2 ] , not using blockchain can achieve higher profits. Otherwise, when 3 8 τ 2 < k < 3 τ 2 [ ( α c ) 2 η 2 ( α c φ ) 2 ] 8 [ ( α c ) 2 ( α c φ ) 2 ] , using blockchain can achieve higher profits.
Proposition 32.
When the government chooses TS, if manufacturers are in cooperation and choose joint R&D, when k > 3 τ 2 [ ( α c ) 2 η 2 ( α c φ ) 2 ] 4 [ ( α c ) 2 ( α c φ ) 2 ] , not using the blockchain can achieve higher profits; Otherwise, when 3 4 τ 2 < k < 3 τ 2 [ ( α c ) 2 η 2 ( α c φ ) 2 ] 4 [ ( α c ) 2 ( α c φ ) 2 ] , using blockchain can achieve higher profits.
Proposition 33.
When the government chooses PS, if manufacturers are not in cooperation and choose individual R&D, not using blockchain can achieve higher profits.
Proposition 34.
When the government chooses PS, if manufacturers are not in cooperation and choose joint R&D, not using blockchain can achieve higher profits.
Proposition 35.
When the government chooses PS, if manufacturers are in cooperation and choose individual R&D, not using blockchain can achieve higher profits.
Proposition 36.
When the government chooses PS, if manufacturers are in cooperation and choose joint R&D, not using blockchain can achieve higher profits.
Conclusion 5.
When the government chooses PS, manufacturers can achieve higher profits without blockchain compared with using blockchain; When the government chooses TS, if τ 2 ( 2 χ γ ) 2 < k < τ 2 [ ( α c ) 2 η 2 ( α c φ ) 2 ] ( 2 χ γ ) 2 [ ( α c ) 2 ( α c φ ) 2 ] , using blockchain can achieve higher profits. Otherwise, if k > τ 2 [ ( α c ) 2 η 2 ( α c φ ) 2 ] ( 2 χ γ ) 2 [ ( α c ) 2 ( α c φ ) 2 ] not using blockchain can achieve higher profits.
When the government chooses PS, the relatively high greenness of products becomes the common knowledge of consumers. The role of blockchain becomes less obvious, and manufacturers do not use blockchain to increase their profits. When the government chooses TS, it can stimulate manufacturers to conduct green R&D. Meanwhile, the reduction in R&D difficulty will significantly improve the greenness of products, so enterprises are willing to use the blockchain platform to satisfy the green trust of consumers and gain higher profits. When R&D is difficult, manufacturers may not invest all the subsidies in technology R&D, thus leading to a decrease in product greenness and a reluctance to use the blockchain platform.

6. Analysis of Results

In order to verify the above properties and conclusions, we use matlab 2021a software for digital simulation. The model is analyzed below using arithmetic examples.
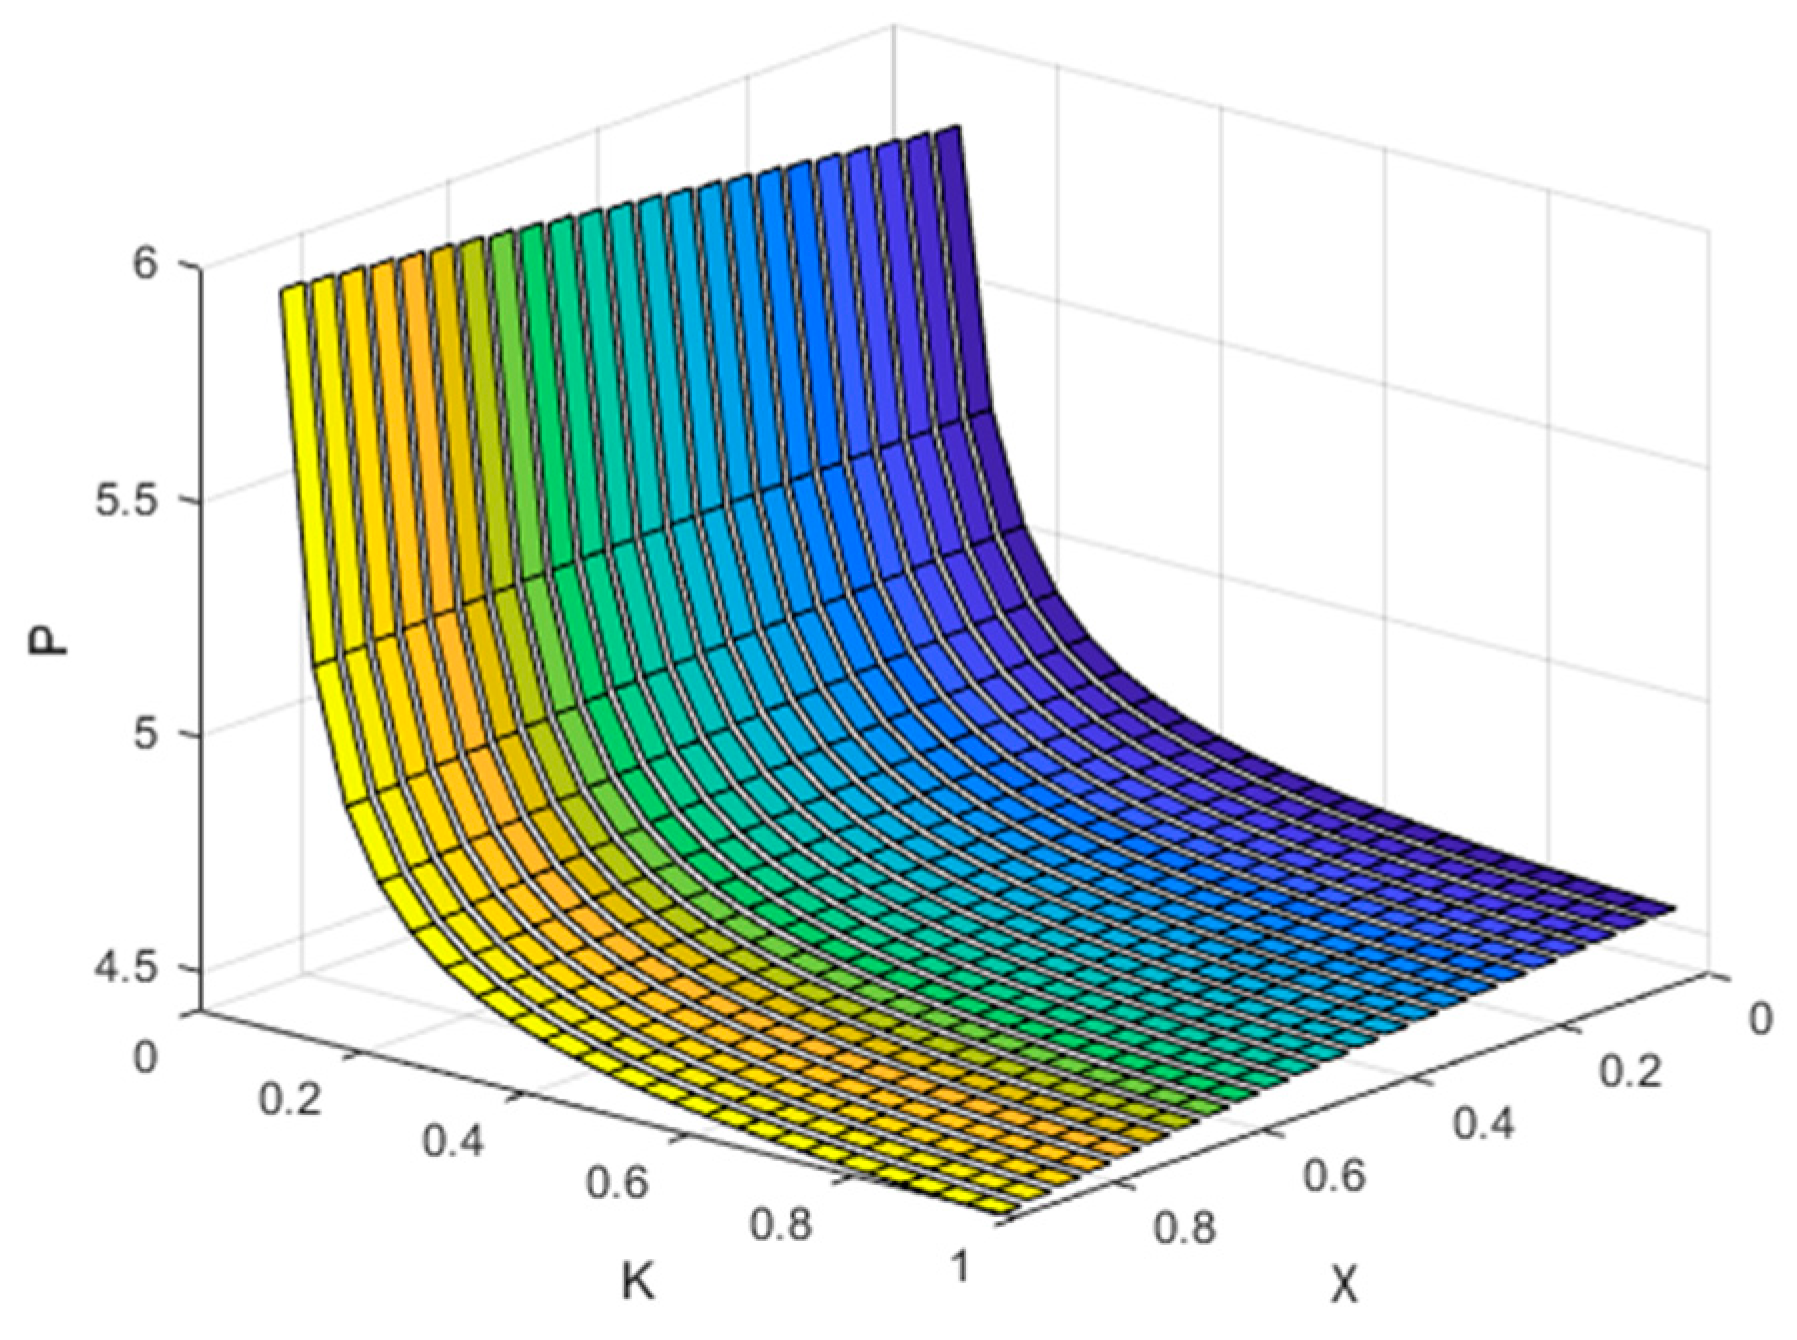
In Figure 2, taking α = 5 , c = 3 , τ = 0.45 , η = 0.45 , φ = 1 , χ = 0.9 , it can be seen that, when k is small ( k < τ 2 η 2 ( 3 2 γ ) 2 ( 2 γ χ ) 2 ), the price of the green product increases as product substitutability increases, and when k is large ( k > τ 2 η 2 ( 3 2 γ ) 2 ( 2 γ χ ) 2 ) the price of the green product decreases as product substitutability increases. In Figure 3, taking α = 5 , c = 3 , τ = 0.5 , η = 0.5 , φ = 1 , γ = 0.5 , it can be seen that the consumer’s perceived level of competition has the same effect on the price of the green product as substitutability. The impact of R&D difficulty on the price of green products is related to the substitutability and competitiveness of products. Because green technology innovation has the characteristics of high cost and long cycle, when green research and development is difficult, manufacturers may not increase the price of products, but instead reduce investment in green research and development, sell products with low green degrees, and reduce the price of green products to improve the competitiveness of products, while the increase in competition and substitutability between products will further reduce the price.
In Figure 4, taking α = 10 , c = 3 , τ = 0.7 , η = 0.7 , φ = 0.5 , γ = 0.7 , I = 2 , χ = 0.7 , there is a roughly negative relationship between R&D difficulty and social welfare. When manufacturing chooses non-cooperation and joint R&D, χ γ = 0.49 , the social welfare obtained from PS is constantly greater than that obtained from TS. In Figure 5, the social welfare obtained from PS is greater than that obtained from TS when χ γ = 0.64 , k > 0.705 is used, and the social welfare obtained from TS is greater than that obtained from PS when 0.6 < k < 0.705 is used. Enterprises reduce product costs through joint research and development, which ultimately leads to increased profits for manufacturers. The increase in demand leads the government to prefer technology subsidies rather than production subsidies, which reduces its subsidy expenditure. Therefore, in this case, the government can choose technology subsidies to obtain higher social welfare.
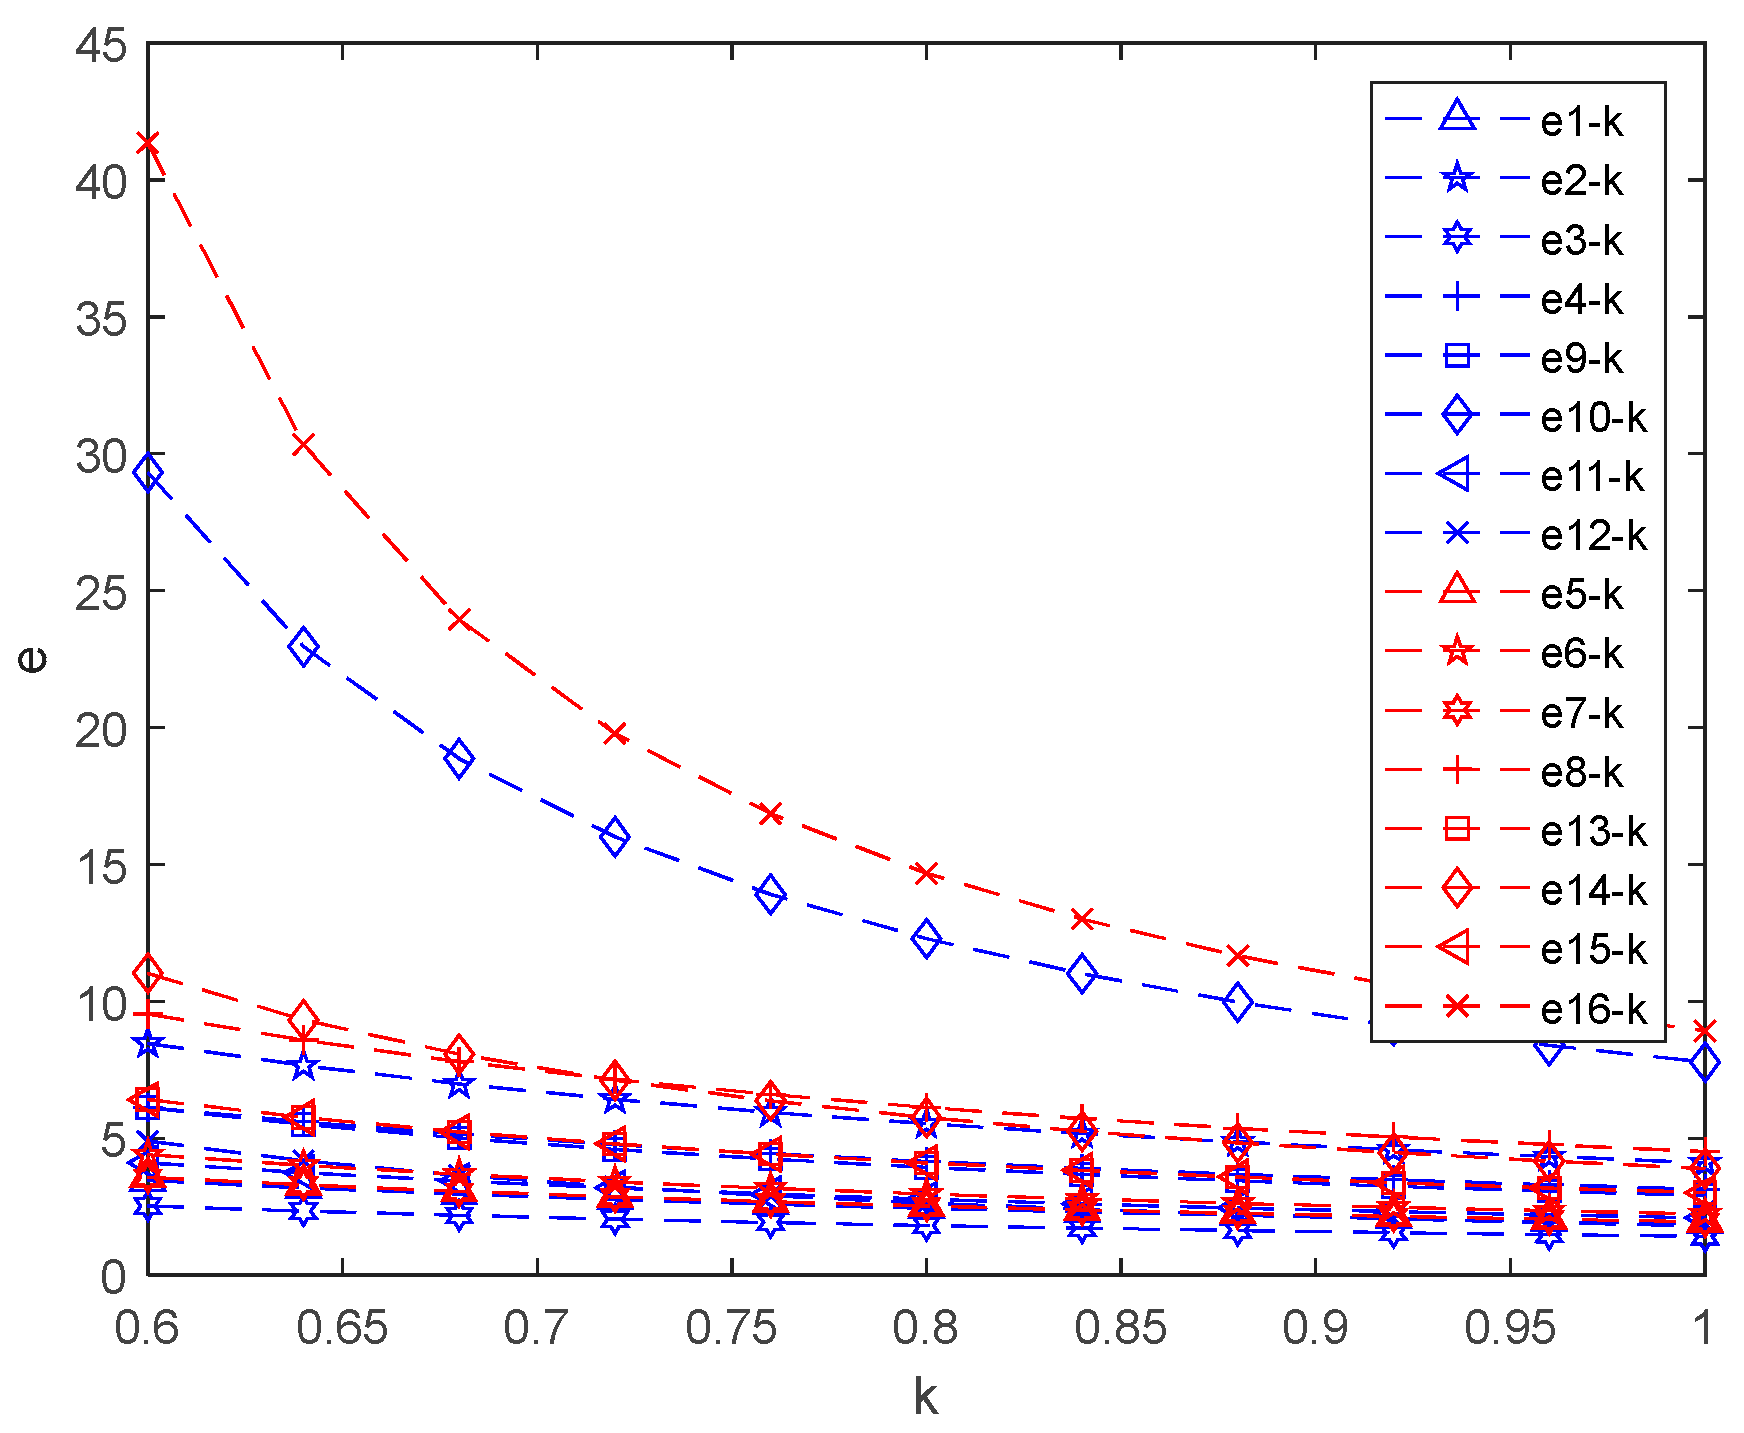
In Figure 6, α = 10 , c = 3 , τ = 0.7 , η = 0.7 , φ = 0.5 , γ = 0.5 , I = 2 , χ = 0.5 , there is a negative relationship between R&D difficulty and product greenness. When manufacturers in non-cooperation choose joint R&D, when γ χ = 0.25 , a higher level of greenness is obtained by subsidizing the yield of the manufacturer. In Figure 7, taking α = 10 , c = 3 , τ = 0.7 , η = 0.7 , φ = 0.5 , γ = 0.8 , χ = 0.8 , γ χ = 0.64 , TS will obtain a higher level of greenness when manufacturers choose joint R&D in non-cooperation, and PS will still achieve higher greenness in other cases.
In Figure 8, taking α = 10 , c = 3 , τ = 0.9 , η = 0.9 , φ = 0.5 , γ = 0.5 , χ = 0.5 , the profit obtained by the manufacturer from joint R&D is constantly greater than the profit obtained from individual R&D. In Figure 9, taking α = 5 , c = 3 , τ = 0.9 , η = 0.9 , φ = 0.5 , γ = 0.5 , χ = 0.5 , 0.6 < k < 0.64 , the profit obtained by individual R&D is greater than that obtained by joint R&D, and when k > 0.64 , joint R&D can obtain a higher profit. In Figure 10, taking α = 5 , c = 3 , τ = 0.9 , η = 0.9 , φ = 1 , γ = 0.2 , χ = 0.2 , 0.5 < k < 0.52 , the profit obtained by individual R&D is greater than that obtained by joint R&D, and when k > 0.52 , joint R&D can obtain a higher profit. This is because, when the government grants technology subsidies, it can stimulate enterprises to carry out green research and development. In order to reduce research and development costs, manufacturers will actively seek to cooperate with other enterprises in research and development to obtain higher profits. In the case of production subsidies, enterprises’ choice of independent research and development or cooperative research and development is related to the difficulty of research and development. When the difficulty of research and development is large, enterprises will choose joint research and development to reduce costs.
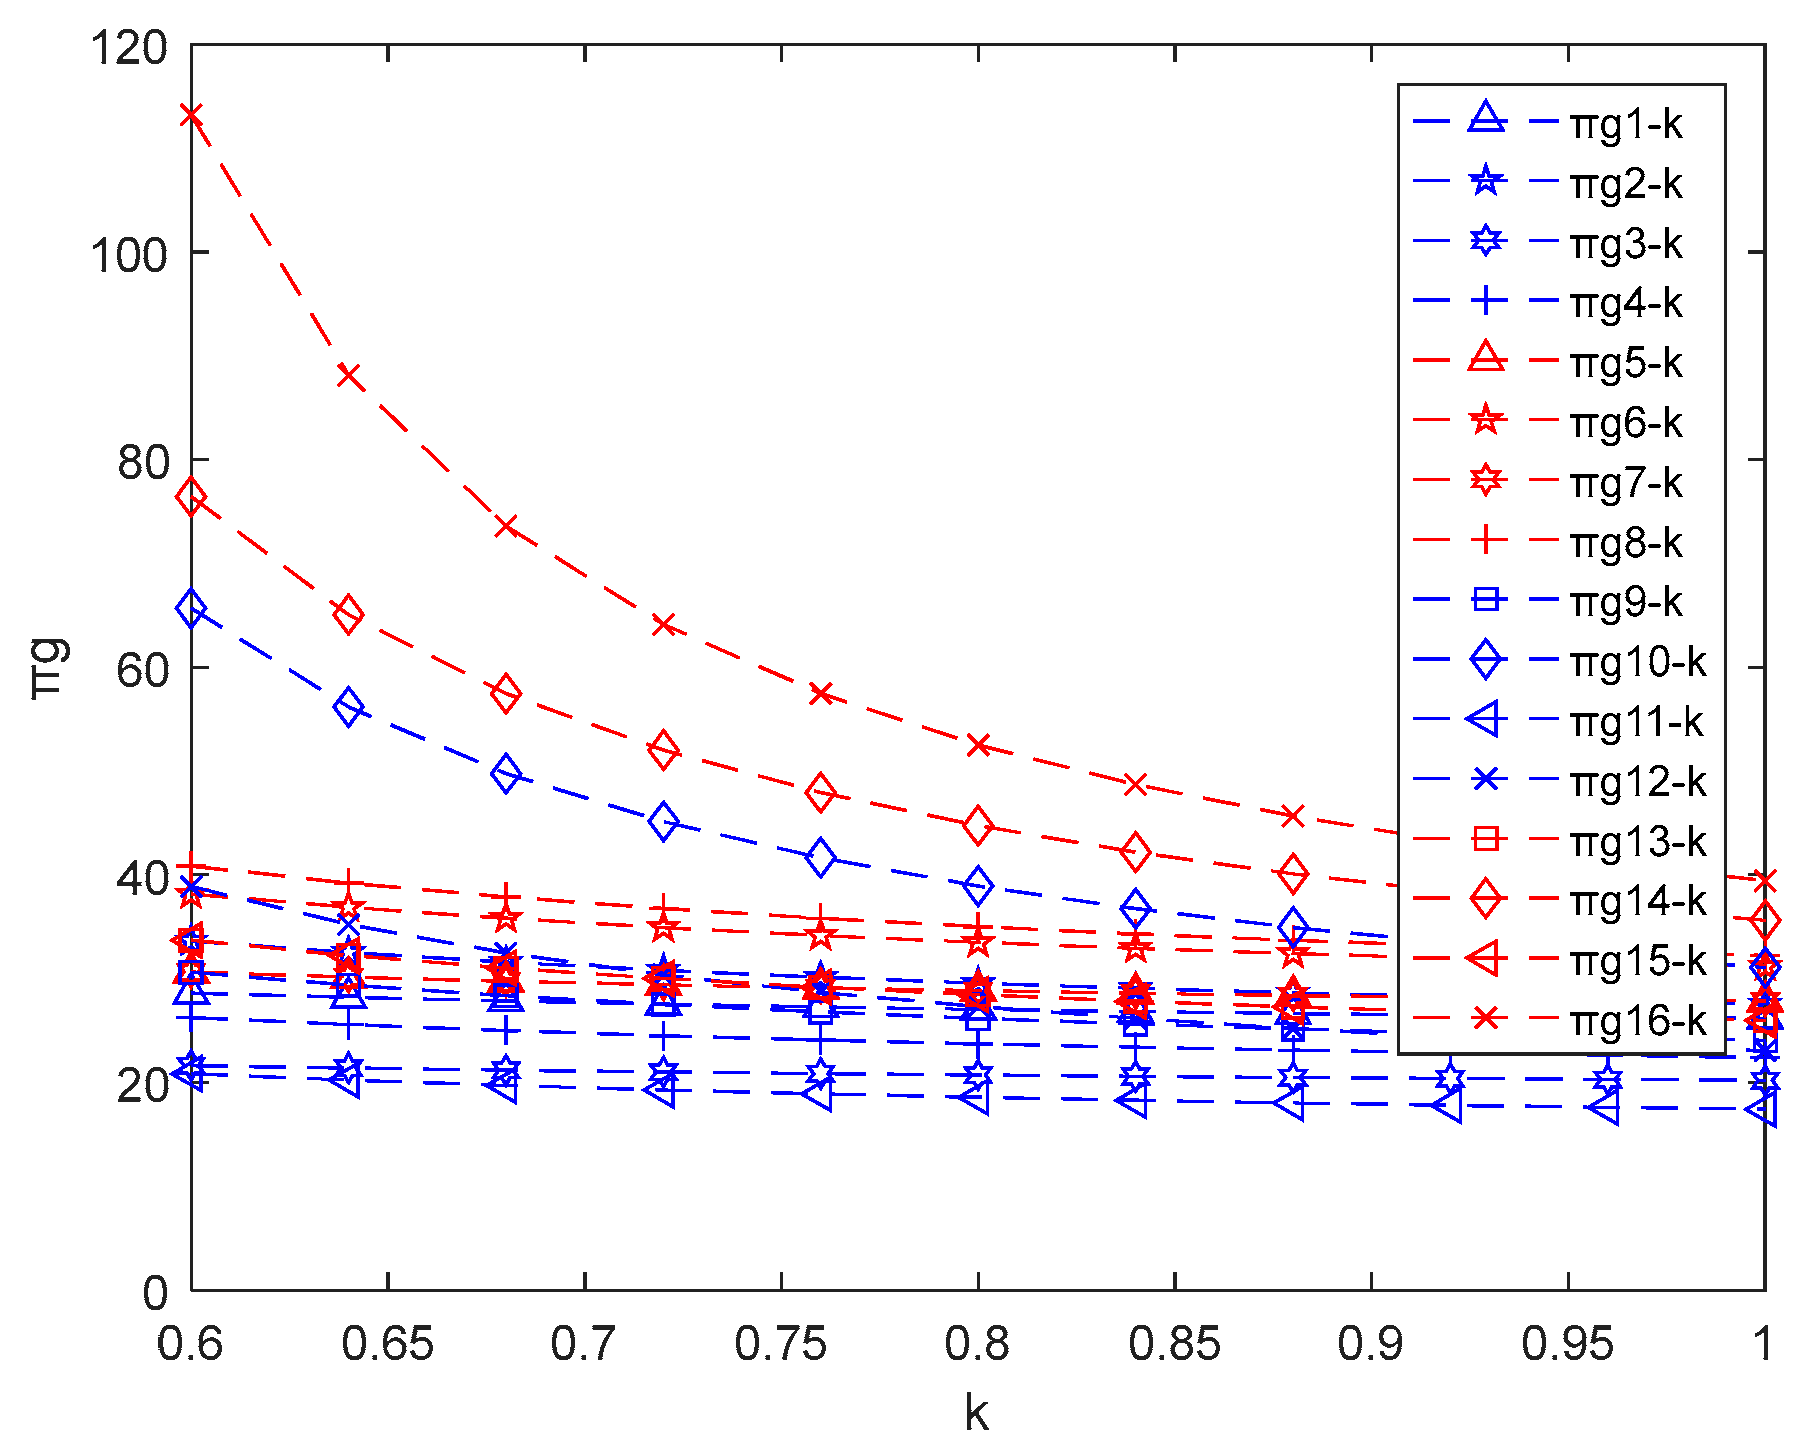
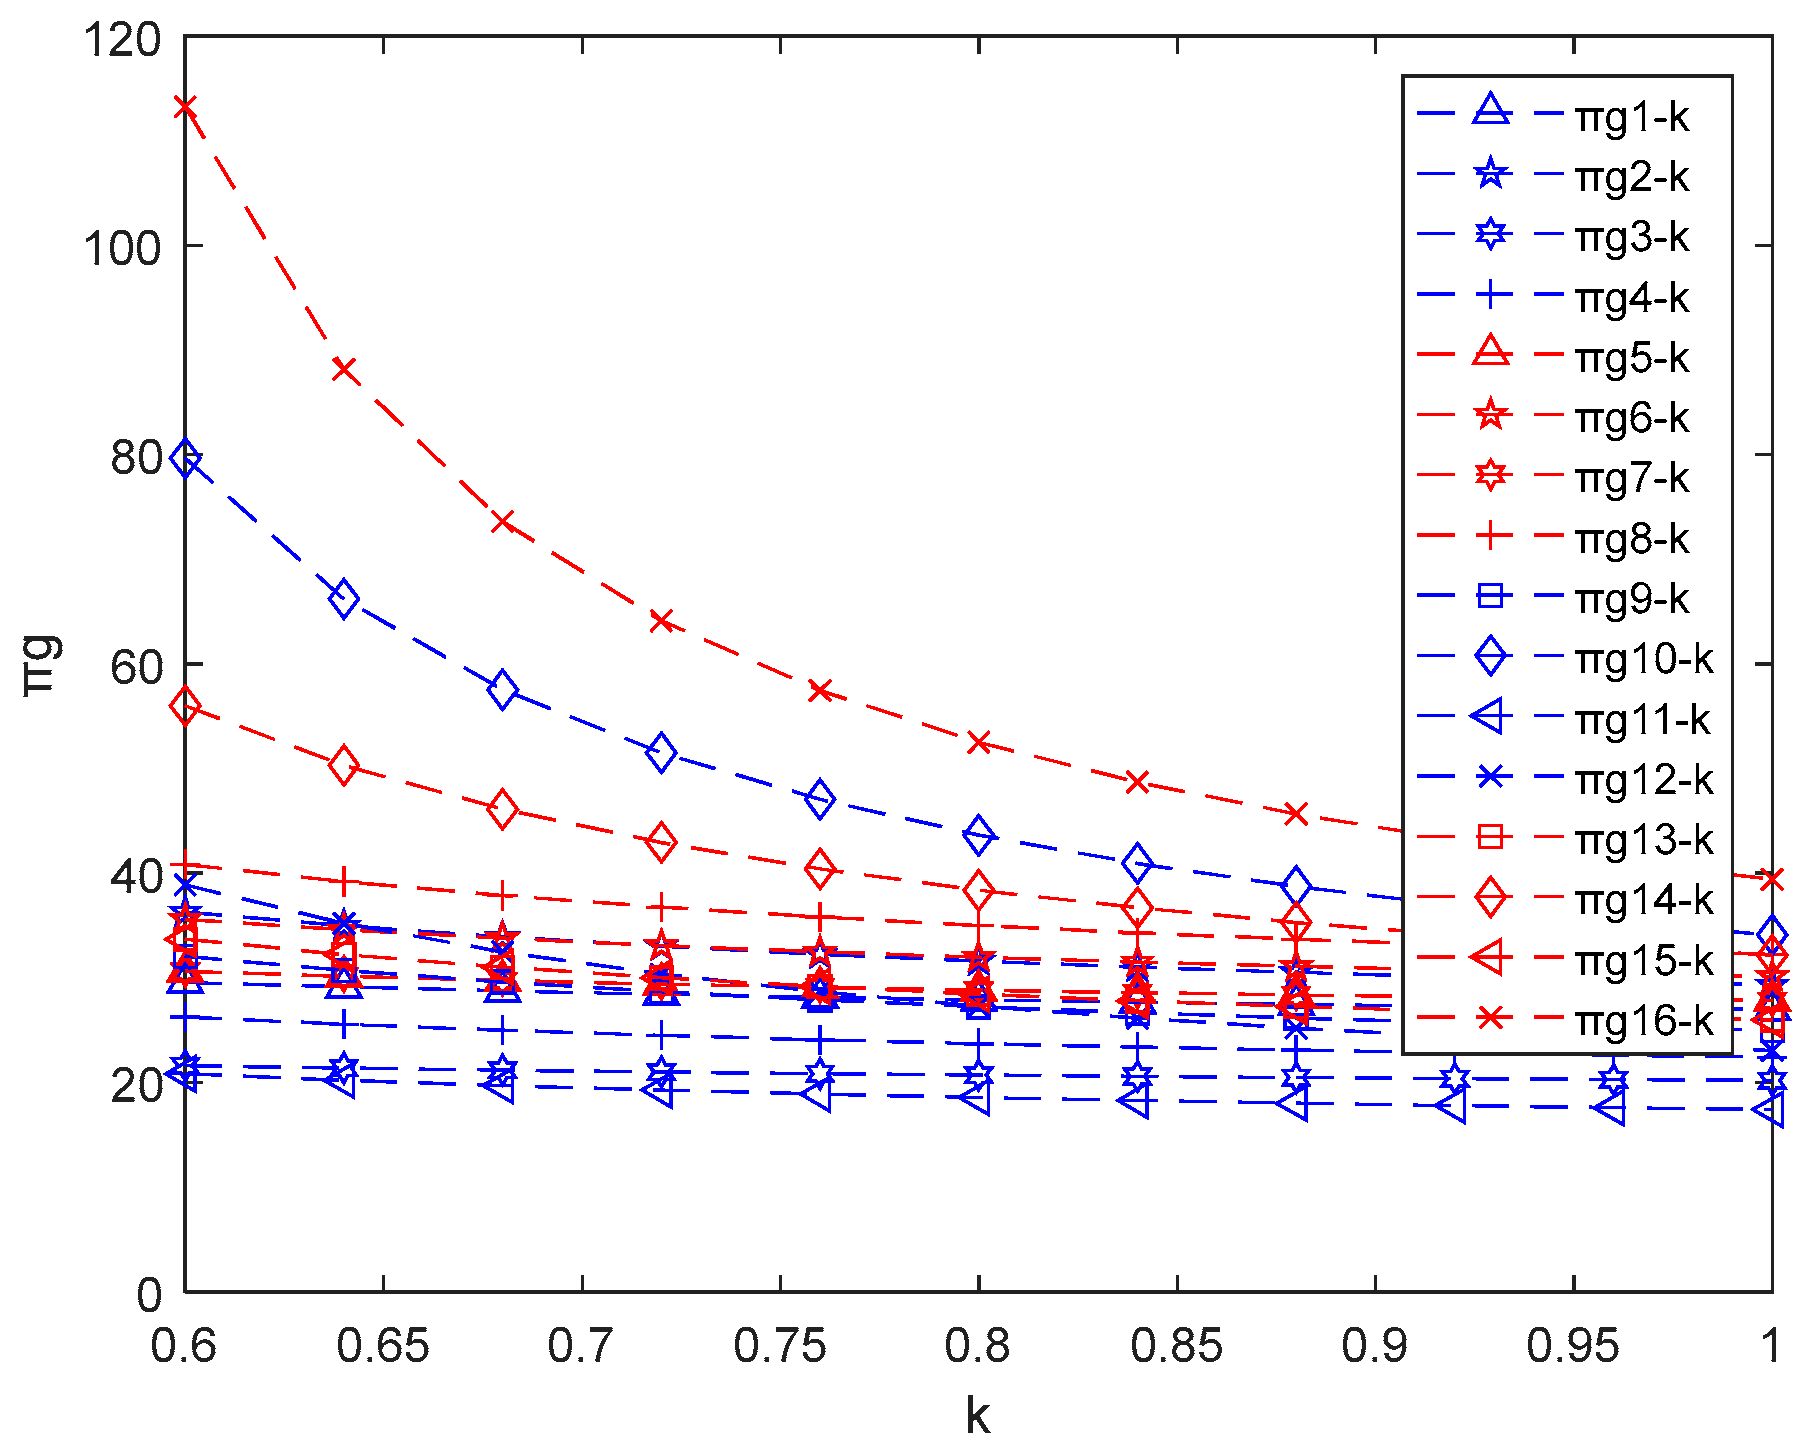
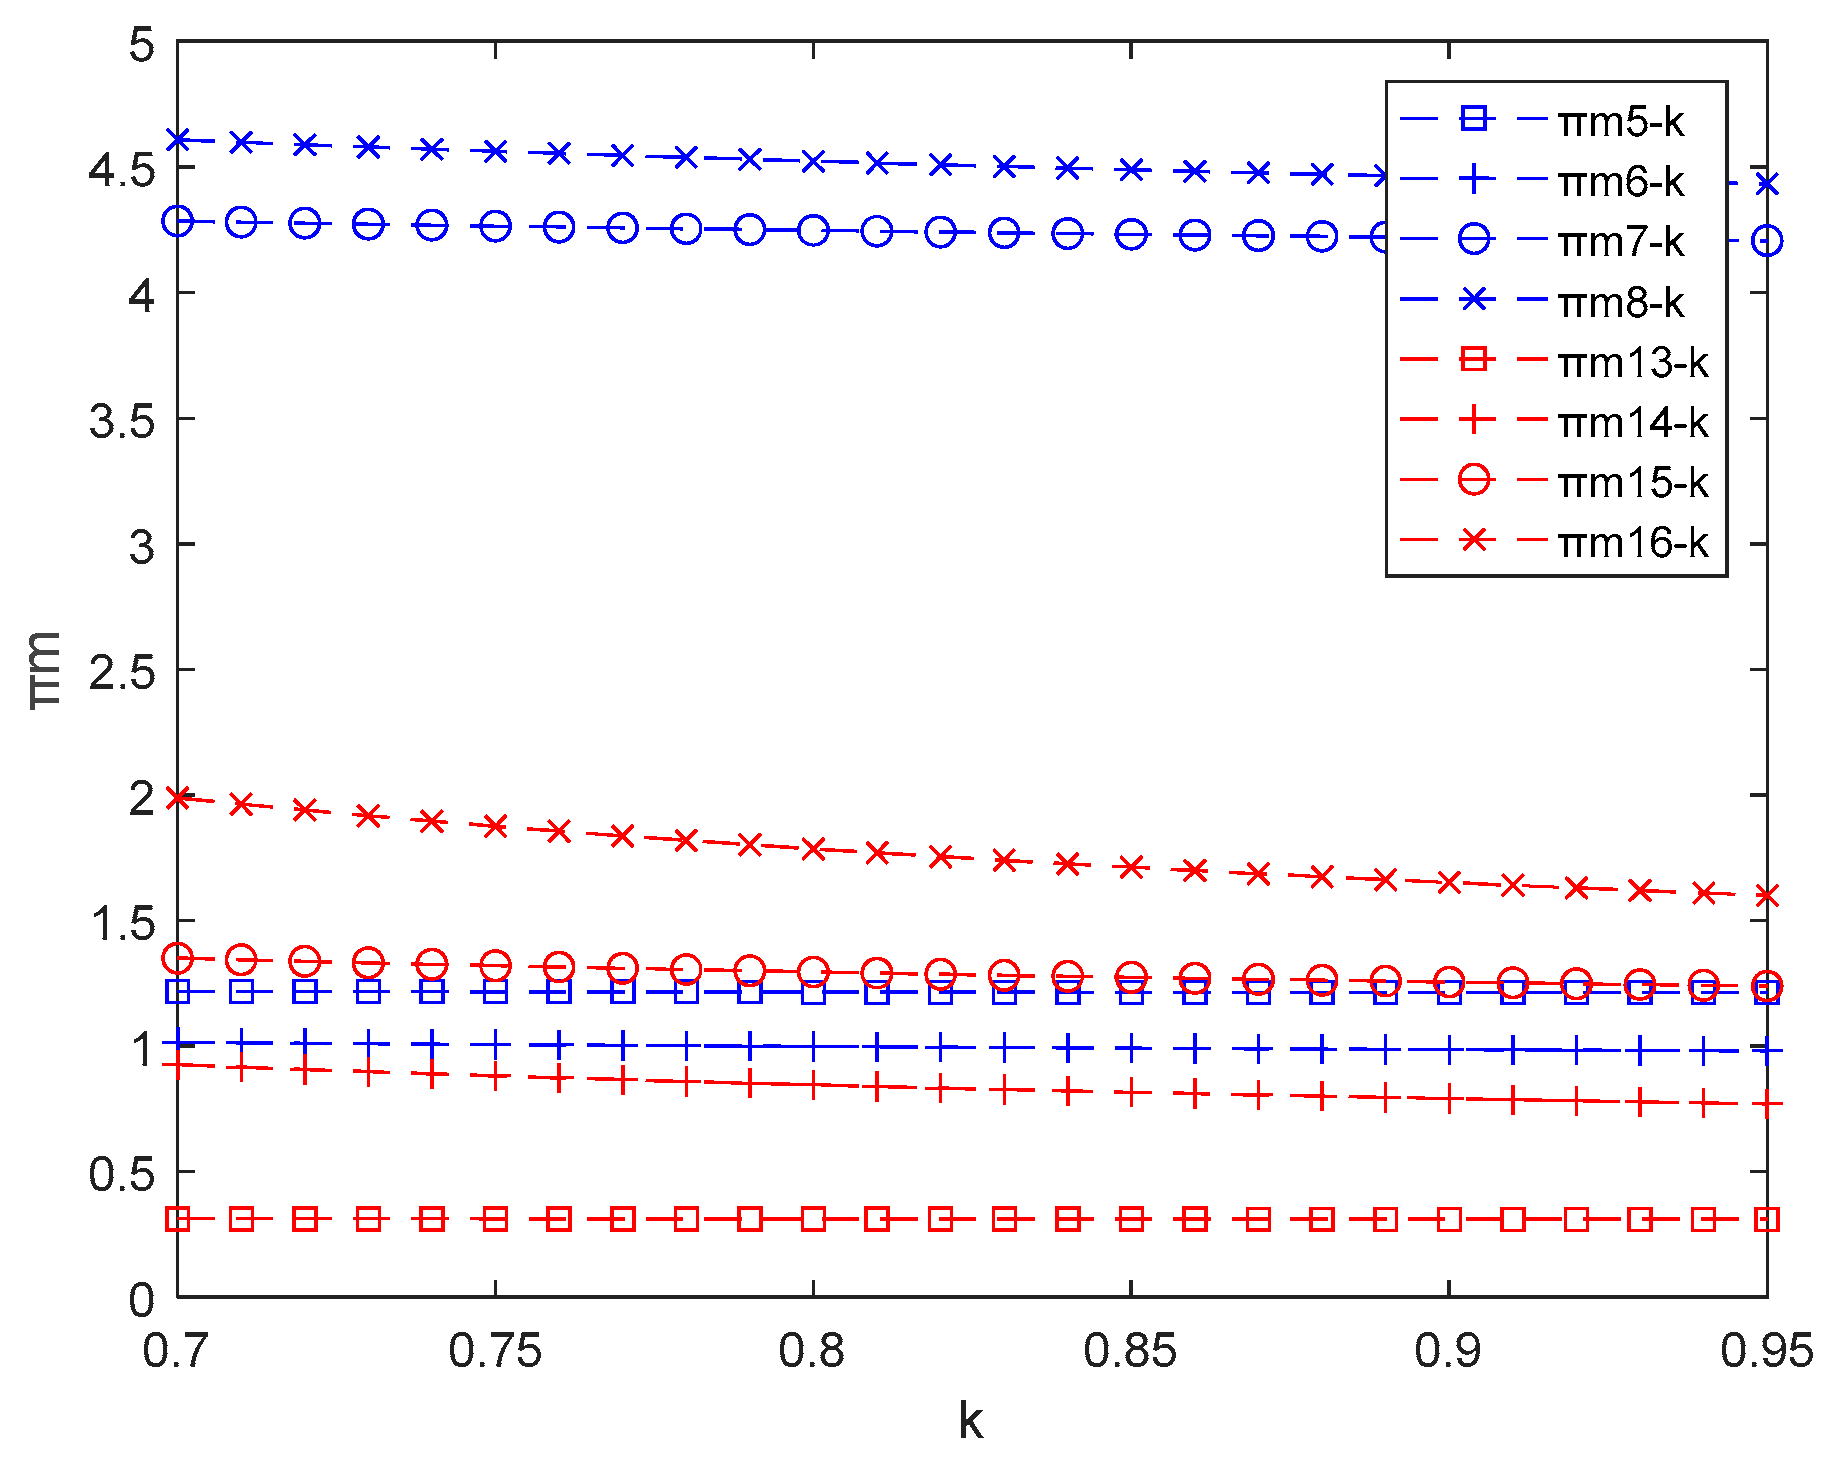
In Figure 11, taking α = 5 , c = 3 , τ = 0.5 , η = 0.5 , φ = 0.2 , γ = 0.35 , χ = 0.35 , 0.25 < k < 0.36 , the platform can obtain a higher profit without using blockchain technology; when k > 0.36 , it can obtain a higher profit using blockchain technology. In Figure 12, taking α = 5 , c = 3 , τ = 0.5 , η = 0.5 , φ = 0.2 , γ = 0.35 , χ = 0.35 . When 0.7 < k < 0.74 , higher profits can be obtained by using blockchain technology; when k > 0.74 , higher profits can be obtained by not using blockchain technology. In Figure 13, taking α = 5 , c = 3 , τ = 0.5 , η = 0.5 , φ = 1 , γ = 0.7 , χ = 0.7 , it can be seen that the profit gained by the firm without using blockchain is constantly greater than the profit gained by using blockchain when the government chooses PS. This is because the relatively high green degree of products becomes the common knowledge of consumers when the production subsidies are given, and the role of blockchain becomes less obvious. Enterprises do not use blockchain to improve profits. When the government subsidizes technology, it can stimulate enterprises to carry out green research and development, and the reduction in the difficulty of research and development will greatly improve the green degree of products. Therefore, enterprises are willing to use the blockchain platform to meet the green trust of consumers and obtain higher profits. When research and development is difficult, enterprises may not invest all subsidies in technology research and development, thus reducing the green degree of products and the willingness to use the blockchain platform.

7. Conclusions

Most of the current research on cooperation issues and R&D approaches in low-carbon supply chains is in the context of taxation or subsidies. Therefore, this study considers the application of blockchain in the supply chain. Sixteen decision models were constructed, and comparative analysis was conducted. In addition, the impact of product substitutability and consumer-perceived competitive intensity on the price of green products under the joint R&D model was analyzed. The results were obtained by theoretical analysis and validated by numerical analysis.
(1)
This study has different findings from the literature regarding the effect of the R&D difficulty coefficient. Mohsin et al. found that increased R&D difficulty of green products decreases the selling price of products [57]; Koh et al. showed that increased product substitutability decreases the selling price of products [58]. However, we demonstrated that increased difficulty in green product R&D reduces product selling prices but decreases social welfare. Furthermore, when R&D is less difficult, green product prices increase with the degree of product substitutability or with the intensity of competition perceived by consumers.
(2)
Regarding the government’s choice of subsidies to obtain higher social welfare, Bian et al. indicated that output subsidies can obtain higher social welfare [20]. However, the difficulty of R&D and the intensity of competition of the product are not considered. In contrast, this paper proposes that the government chooses output subsidies for social welfare optimization and technology subsidies for carbon emission reduction rate optimization when firms with high R&D difficulty and competitive intensity choose co-R&D in competition.
(3)
Regarding which R&D method manufacturers choose to obtain higher profits, Zhou et al. stated that joint R&D can obtain higher social welfare. However, the difficulty of R&D and the intensity of competition of the product are not considered. When the government subsidizes the technology to the firms, joint R&D can gain higher profits compared to the firms’ own R&D; under the output subsidy, independent R&D can gain higher profits when the R&D is less difficult, and joint R&D can gain higher profits when the R&D is more difficult.
(4)
Extending the decision model by including government R&D blockchain for manufacturers to use blockchain for a fee. When the government subsidizes output, firms can earn higher profits without blockchain compared to using blockchain; Under the technology subsidies, firms can earn higher profits by using blockchain for a fee when R&D is less difficult but can earn higher profits without blockchain when R&D is more difficult.
This study has the following key contributions. In theory, first of all, our research expands the existing literature on supply chain horizontal cooperation by observing the impact of existing government subsidies on manufacturers’ strategic and operational decisions, as well as their environmental and economic performance. This is different from most studies in the existing literature that mainly focus on the vertical supply chain cooperation of carbon emission reduction. Secondly, our research discussed the green information trust of consumers and introduced blockchain technology to solve it, which is a supplement to the existing literature. In terms of methodology, our research has demonstrated this game theory method by applying non-cooperative game and cooperative game to study pure competition and cooperative relationship respectively, and expanded the existing cooperative literature by showing how to use this game theory method to explore the business decisions and performance of cooperative companies and different market environments.
This study has several limitations. First, the study model is limited to a low-carbon supply chain consisting of two green manufacturers. In practice, multiple manufacturers can collaborate (including non-green manufacturers), and there may be interactions between these relationships through competition between manufacturers and government concerns about overall profit and carbon reduction rates, so the government’s approach to subsidizing multiple manufacturers needs to be further explored. There is still some work to be done in the future. Second, this study only analyzes the optimal strategy in terms of subsidy approach, R&D approach, competing relationships, and whether to use blockchain in a two-by-two comparison. Further research can consider multiple strategies optimally rather than two. In addition, information asymmetry is more common in practice and may distort the decision making of supply chain parties. Further exploration of information asymmetry will make the findings of studies such as subsidy methods and competing relationships more realistic and meaningful.

Author Contributions

Conceptualization, X.Y. and J.S.; methodology, X.Y.; software, X.Y.; validation, X.Y. and J.S.; formal analysis, X.Y.; investigation, J.S.; resources, X.Y.; data curation, J.S.; writing—original draft preparation, X.Y.; writing—review and editing, X.Y.; visualization, J.S.; supervision, X.Y.; project administration, J.S. All authors have read and agreed to the published version of the manuscript.

Funding

This research received no external funding.

Institutional Review Board Statement

Not applicable.

Informed Consent Statement

Not applicable.

Data Availability Statement

Not applicable.

Acknowledgments

Special thanks to those who participated in the writing of this paper.

Conflicts of Interest

The authors declare no conflict of interest.

References

  1. Merino-Saum, A.; Baldi, M.G.; Gunderson, I.; Oberle, B. Articulating natural resources and sustainable development goals through green economy indicators: A systematic analysis. Resour. Conserv. Recycl. 2018, 139, 90–103. [Google Scholar] [CrossRef]
  2. Li, L. China’s manufacturing locus in 2025: With a comparison of “Made-in-China 2025” and “Industry 4.0”. Technol. Forecast. Soc. Change 2018, 135, 66–74. [Google Scholar] [CrossRef]
  3. Ranjan, A.; Jha, J.K. Pricing and coordination strategies of a dual-channel supply chain considering green quality and sales effort. J. Clean. Prod. 2019, 218, 409–424. [Google Scholar] [CrossRef]
  4. Lou, G.; Lai, Z.; Ma, H.; Fan, T. Coordination in a composite green-product supply chain under different power structures. Ind. Manag. Data Syst. 2020, 120, 1101–1123. [Google Scholar] [CrossRef]
  5. Li, Y.; Tong, Y.; Ye, F.; Song, J. The choice of the government green subsidy scheme: Innovation subsidy vs. product subsidy. Int. J. Prod. Res. 2020, 58, 4932–4946. [Google Scholar] [CrossRef]
  6. Abbas, H.; Tong, S. Green Supply Chain Management Practices of Firms with Competitive Strategic Alliances—A Study of the Automobile Industry. Sustainability 2023, 15, 2156. [Google Scholar] [CrossRef]
  7. Xu, J.; Duan, Y. Pricing and greenness investment for green products with government subsidies: When to apply blockchain technology? Electron. Commer. R. A 2022, 51, 101108. [Google Scholar] [CrossRef]
  8. Saberi, S.; Kouhizadeh, M.; Sarkis, J.; Shen, L. Blockchain technology and its relationships to sustainable supply chain management. Int. J. Prod. Res. 2019, 57, 2117–2135. [Google Scholar] [CrossRef] [Green Version]
  9. Xu, X.; Zhang, M.; Dou, G.; Yu, Y. Coordination of a supply chain with an online platform considering green technology in the blockchain era. Int. J. Prod. Res. 2021, 1–18. [Google Scholar] [CrossRef]
  10. Yu, J.J.; Tang, C.S.; Sodhi, M.S.; Knuckles, J. Optimal subsidies for development supply chains. Manuf. Serv. Oper. Manag. 2020, 22, 1131–1147. [Google Scholar] [CrossRef]
  11. Ling, Y.; Xu, J.; Ülkü, M.A. A game-theoretic analysis of the impact of government subsidy on optimal product greening and pricing decisions in a duopolistic market. J. Clean. Prod. 2022, 338, 130028. [Google Scholar] [CrossRef]
  12. Meng, Q.; Wang, Y.; Zhang, Z.; He, Y. Supply chain green innovation subsidy strategy considering consumer heterogeneity. J. Clean. Prod. 2021, 281, 125199. [Google Scholar] [CrossRef]
  13. Fu, Y.; Wang, X.; Tang, Y.; Li, W.; Gong, Z.; Zhang, W. A Horizontal Competition-Cooperation Game of Technological Innovation in an Automobile Cluster Supply Chain. Sci. Program. 2022, 2022, 2220733. [Google Scholar] [CrossRef]
  14. Yang, R.; Tang, W.; Zhang, J. Technology improvement strategy for green products under competition: The role of government subsidy. Eur. J. Oper. Res. 2021, 289, 553–568. [Google Scholar] [CrossRef]
  15. De Giovanni, P. Blockchain and smart contracts in supply chain management: A game theoretic model. Int. J. Prod. Econ. 2020, 228, 107855. [Google Scholar] [CrossRef]
  16. Niu, B.; Dong, J.; Liu, Y. Incentive alignment for blockchain adoption in medicine supply chains. Transp. Res. Part E Logist. Transp. Rev. 2021, 152, 102276. [Google Scholar] [CrossRef]
  17. Dong, C.; Chen, C.; Shi, X.; Ng, C.T. Operations strategy for supply chain finance with asset-backed securitization: Centralization and blockchain adoption. Int. J. Prod. Econ. 2021, 241, 108261. [Google Scholar] [CrossRef]
  18. Hong, I.H.; Chiu, A.S.; Ganda, L. Impact of subsidy policies on green products with consideration of consumer behaviors: Subsidy for firms or consumers? Resour. Conserv. Recycl. 2021, 173, 105669. [Google Scholar] [CrossRef]
  19. Zhang, J.J.; Guan, J. The time-varying impacts of government incentives on innovation. Technol. Forecast. Soc. Change 2018, 135, 132–144. [Google Scholar] [CrossRef]
  20. Bian, J.; Zhang, G.; Zhou, G. Manufacturer vs. consumer subsidy with green technology investment and environmental concern. Eur. J. Oper. Res. 2020, 287, 832–843. [Google Scholar] [CrossRef]
  21. Jung, S.H.; Feng, T. Government subsidies for green technology development under uncertainty. Eur. J. Oper. Res. 2020, 286, 726–739. [Google Scholar] [CrossRef]
  22. Chen, S.; Su, J.; Wu, Y.; Zhou, F. Optimal production and subsidy rate considering dynamic consumer green perception under different government subsidy orientations. Comput. Ind. Eng. 2022, 168, 108073. [Google Scholar] [CrossRef]
  23. Gao, Y.; Hu, Y.; Liu, X.; Zhang, H. Can public R&D subsidy facilitate firms’ exploratory innovation? The heterogeneous effects between central and local subsidy programs. Res Policy. 2021, 50, 104221. [Google Scholar]
  24. Wang, W.; Zhang, R. Green Supply Chain Operations Decision and Government Subsidy Strategies under R & D Failure Risk. Sustainability 2022, 14, 15307. [Google Scholar] [CrossRef]
  25. Bai, Y.; Song, S.; Jiao, J.; Yang, R. The impacts of government R&D subsidies on green innovation: Evidence from Chinese energy-intensive firms. J. Clean. Prod. 2019, 233, 819–829. [Google Scholar]
  26. Lee, S.H.; Park, C.H. Environmental regulations in private and mixed duopolies: Taxes on emissions versus green R&D subsidies. Econ. Syst. 2021, 45, 100852. [Google Scholar]
  27. Zuo, W.; Li, Y.; Wang, Y. Research on the optimization of new energy vehicle industry research and development subsidy about generic technology based on the three-way decisions. J. Clean. Prod. 2019, 212, 46–55. [Google Scholar] [CrossRef]
  28. Dong, Z.; He, Y.; Wang, H. Dynamic effect retest of R&D subsidies policies of China’s auto industry on directed technological change and environmental quality. J. Clean. Prod. 2019, 231, 196–206. [Google Scholar]
  29. Mardones, C.; Velásquez, A. Macroeconomic, intersectoral, and environmental effects of R&D subsidies in Chile: An input-output approach. Technol. Forecast. Soc. Change 2021, 173, 121112. [Google Scholar]
  30. Wu, T.; Yang, S.; Tan, J. Impacts of government R&D subsidies on venture capital and renewable energy investment—An empirical study in China. Resour. Policy 2020, 68, 101715. [Google Scholar]
  31. Ishikawa, N.; Shibata, T. R&D competition and cooperation with asymmetric spillovers in an oligopoly market. Int. Rev. Econ. Financ. 2021, 72, 624–642. [Google Scholar]
  32. Esenduran, G.; Kemahlıoğlu-Ziya, E.; Swaminathan, J.M. Impact of take-back regulation on the remanufacturing industry. Prod. Oper. Manag. 2017, 26, 924–944. [Google Scholar] [CrossRef]
  33. Gernsheimer, O.; Kanbach, D.K.; Gast, J. Coopetition research-A systematic literature review on recent accomplishments and trajectories. Ind. Mark. Manag. 2021, 96, 113–134. [Google Scholar] [CrossRef]
  34. Ahn, J.M.; Minshall, T.; Mortara, L. Understanding the human side of openness: The fit between open innovation modes and CEO characteristics. R D Manag. 2017, 47, 727–740. [Google Scholar] [CrossRef] [Green Version]
  35. Weber, B.; Heidenreich, S. When and with whom to cooperate? Investigating effects of cooperation stage and type on innovation capabilities and success. Long Range Plan. 2018, 51, 334–350. [Google Scholar] [CrossRef]
  36. Ko, Y.; Chung, Y.; Seo, H. Coopetition for Sustainable Competitiveness: R&D Collaboration in Perspective of Productivity. Sustainability 2020, 12, 7993. [Google Scholar]
  37. Carree, M.; Lokshin, B.; Alvarez, H.A. Technology partnership portfolios and firm innovation performance: Further evidence. J. Eng. Technol. 2019, 54, 1–11. [Google Scholar] [CrossRef]
  38. Fan, Z.P.; Huang, S.; Wang, X. The vertical cooperation and pricing strategies of electric vehicle supply chain under brand competition. Comput. Ind. Eng. 2021, 152, 106968. [Google Scholar] [CrossRef]
  39. Zhang, F.; Zhang, Z.; Xue, Y.; Zhang, J.; Che, Y. Dynamic green innovation decision of the supply chain with innovating and free-riding manufacturers: Cooperation and spillover. Complexity 2020, 2020, 8937847. [Google Scholar] [CrossRef]
  40. Zhang, X.; Chen, T.; Shen, C. Green investment choice in a duopoly market with quality competition. J. Clean. Prod. 2020, 276, 124032. [Google Scholar] [CrossRef]
  41. Chen, X.; Wang, X.; Zhou, M. Firms’ green R&D cooperation behaviour in a supply chain: Technological spillover, power and coordination. Int. J. Prod. Econ. 2019, 218, 118–134. [Google Scholar]
  42. Dai, R.; Zhang, J.; Tang, W. Cartelization or Cost-sharing? Comparison of cooperation modes in a green supply chain. J. Clean. Prod. 2017, 156, 159–173. [Google Scholar] [CrossRef]
  43. Zheng, Z.; Xie, S.; Dai, H.N.; Chen, X.; Wang, H. Blockchain challenges and opportunities: A survey. Int. J. Web Grid Serv. 2018, 14, 352–375. [Google Scholar] [CrossRef]
  44. Sundarakani, B.; Ajaykumar, A.; Gunasekaran, A. Big data driven supply chain design and applications for blockchain: An action research using case study approach. Omega 2021, 102, 102452. [Google Scholar] [CrossRef]
  45. Dutta, P.; Choi, T.M.; Somani, S.; Butala, R. Blockchain technology in supply chain operations: Applications, challenges and research opportunities. Transp. Res. Part E Logist. Transp. Rev. 2020, 142, 102067. [Google Scholar] [CrossRef] [PubMed]
  46. Centobelli, P.; Cerchione, R.; Del Vecchio, P.; Oropallo, E.; Secundo, G. Blockchain technology for bridging trust, traceability and transparency in circular supply chain. Inf. Manag. 2021, 59, 103508. [Google Scholar] [CrossRef]
  47. Wamba, S.F.; Queiroz, M.M.; Trinchera, L. Dynamics between blockchain adoption determinants and supply chain performance: An empirical investigation. Int. J. Prod. Econ. 2020, 229, 107791. [Google Scholar] [CrossRef]
  48. Lim, M.K.; Li, Y.; Wang, C.; Tseng, M.L. A literature review of blockchain technology applications in supply chains: A comprehensive analysis of themes, methodologies and industries. Comput. Ind. Eng. 2021, 154, 107133. [Google Scholar] [CrossRef]
  49. Liu, Y.; Ma, D.; Hu, J.; Zhang, Z. Sales mode selection of fresh food supply chain based on blockchain technology under different channel competition. Comput. Ind. Eng. 2021, 162, 107730. [Google Scholar] [CrossRef]
  50. Köhler, S.; Pizzol, M. Technology assessment of blockchain-based technologies in the food supply chain. J. Clean. Prod. 2020, 269, 122193. [Google Scholar] [CrossRef]
  51. Zhou, F.; Liu, Y. Blockchain-Enabled Cross-Border E-Commerce Supply Chain Management: A Bibliometric Systematic Review. Sustainability 2022, 14, 15918. [Google Scholar] [CrossRef]
  52. Bai, Y.; Fan, K.; Zhang, K.; Cheng, X.; Li, H.; Yang, Y. Blockchain-based trust management for agricultural green supply: A game theoretic approach. J. Clean. Prod. 2021, 310, 127407. [Google Scholar] [CrossRef]
  53. Rane, S.B.; Thakker, S.V.; Kant, R. Stakeholders’ involvement in green supply chain: A perspective of blockchain IoT-integrated architecture. Manag. Environ. Qual. 2020, 32, 1166–1191. [Google Scholar] [CrossRef]
  54. Bag, S.; Viktorovich, D.A.; Sahu, A.K.; Sahu, A.K. Barriers to adoption of blockchain technology in green supply chain management. J. Glob. Oper. Strateg. Source 2020, 14, 104–133. [Google Scholar] [CrossRef]
  55. Liu, P.; Long, Y.; Song, H.C.; He, Y.D. Investment decision and coordination of green agri-food supply chain considering information service based on blockchain and big data. J. Clean. Prod. 2020, 277, 123646. [Google Scholar] [CrossRef]
  56. Barman, A.; Das, R.; De, P.K.; Sana, S.S. Optimal Pricing and Greening Strategy in a Competitive Green Supply Chain: Impact of Government Subsidy and Tax Policy. Sustainability 2021, 13, 9178. [Google Scholar] [CrossRef]
  57. Mohsin, A.K.M.; Hossain, S.F.A.; Tushar, H.; Iqbal, M.M.; Hossain, A. Differential game model and coordination model for green supply chain based on green technology research and development. Heliyon 2021, 7, e07811. [Google Scholar] [CrossRef]
  58. Koh, K.; Jeon, S.; Lee, J. The effects of price competition on firms’ operations and market price: Evidence from a retail gasoline market. Energy. Econ. 2022, 108, 105889. [Google Scholar] [CrossRef]
Figure 1. Low-carbon supply chain model based on blockchain technology.
Sustainability 15 03633 g001
Figure 2. Effect of substitutability γ on product prices.
Sustainability 15 03633 g002
Figure 3. Consumer-perceived level of competition χ Impact on product price.
Sustainability 15 03633 g003
Figure 4. Effect of R&D difficulty on optimal social welfare ( χ γ = 0.49 ).
Sustainability 15 03633 g004
Figure 5. Effect of R&D difficulty on optimal social welfare ( χ γ = 0.64 ).
Sustainability 15 03633 g005
Figure 6. Effect of R&D difficulty on optimal greenness ( γ χ = 0.25 ).
Sustainability 15 03633 g006
Figure 7. Effect of R&D difficulty on optimal greenness ( γ χ = 0.64 ).
Sustainability 15 03633 g007
Figure 8. Impact of R&D difficulty on manufacturers’ profits.
Sustainability 15 03633 g008
Figure 9. Impact of R&D difficulty on manufacturers’ profits ( γ χ = 0.25 ).
Sustainability 15 03633 g009
Figure 10. Impact of R&D difficulty on manufacturers’ profits ( γ χ = 0.04 ).
Sustainability 15 03633 g010
Figure 11. Impact of R&D difficulty on manufacturers’ profits.
Sustainability 15 03633 g011
Figure 12. Impact of R&D difficulty on manufacturers’ profits ( γ χ = 0.1225 ).
Sustainability 15 03633 g012
Figure 13. Impact of R&D difficulty on manufacturers’ profits ( γ χ = 0.49 ).
Sustainability 15 03633 g013
Table 1. Comparison between this paper and previous studies.
LiteratureGreen Product Supply ChainGovernment Subsidy PolicyR&D RelationshipCompetition And Cooperation RelationshipBlockchain Technology
Ling et al. (2022) [11]
Yang et al. (2021) [14]
Wu et al. (2021) [30]
Xu et al. (2021) [9]
Liu et al. (2021) [49]
Zhang et al. (2020) [39]
Bai et al. (2021) [52]
Liu et al. (2020) [55]
Zhang et al. (2020) [40]
Chen et al. (2019) [41]
Bian et al. (2020) [20]
This paper
Table 2. Parameters and descriptions.
NotationDescription
α Basic market demand
kCarbon reduction factor
γThe degree of substitutability between products, i.e., the intensity of competition, 0 < γ < 1
τ Consumer greenness sensitivity coefficient, i.e., consumer greenness preference, 0 < τ < 1
χ The degree of increased competition among products as perceived by consumers, 0 < χ < 1
λ Cost-sharing ratio of manufacturer 1 in case of joint R&D, 0 < λ < 1
η Consumer green trust. 0 < η 1
w i Wholesale price of product i, the manufacturer’s decision variable
e i Greenness of product i, the manufacturer’s decision variable
e 0 Greenness of products under joint R&D, decision variables for manufacturers
p i Retail price of product i, the retailer’s decision variable
d i Market demand of manufacturer i
π m 1 , π m 2 Manufacturer 1, 2 benefits
π r Retailer benefits
π g Government benefits
c Product production cost
μ the carbon emission reduction allowance factor 0 μ < 1
θ Unit low-carbon product subsidy amount
φ Blockchain unit costs for manufacturers
I Government building blockchain costs
Table 3. Sixteen gaming strategies.
Technology SubsidyProduction Subsidy
Not using
Blockchain
Individual R&DJoint R&D Individual R&DJoint R&D
Non-cooperation12Non-cooperation56
Cooperation34Cooperation78
Using Blockchain Individual R&DJoint R&D Individual R&DJoint R&D
Non-cooperation910Non-cooperation1314
Cooperation1112Cooperation1516
Table 4. Results of the model.
Technology SubsidyProduction Subsidy
Individual R&DJoint R&D Individual R&DJoint R&D
Blockchain not usedNon-cooperation e 1 = τ η ( 3 - 2 γ ) ( α c ) 2 k ( 2 - γ ) 2 τ 2 η 2 ( 3 - 2 γ )
p 1 = k ( 2 - γ ) [ α ( 3 - 2 γ ) + c ] c τ 2 η 2 ( 3 - 2 γ ) 2 k ( 2 - γ ) 2 τ 2 η 2 ( 3 - 2 γ )
π m 1 = k ( 2 - γ ) ( α - c ) 2 [ 4 k ( 1 - γ ) ( 2 - γ ) - τ 2 η 2 ( 3 - 2 γ ) ] [ 2 k ( 2 - γ ) 2 τ 2 η 2 ( 3 - 2 γ ) ] 2
π g 1 = k ( 3 - 2 γ ) ( α - c ) 2 2 k ( 2 - γ ) 2 τ 2 η 2 ( 3 - 2 γ ) k
e 2 = τ η ( 3 - 2 χ γ ) ( α c ) k ( 2 - χ γ ) 2 τ 2 η 2 ( 3 - 2 χ γ )
p 2 = k ( 2 - χ γ ) [ α ( 3 - 2 χ γ ) + c ] 2 c τ 2 η 2 ( 3 - 2 χ γ ) 2 k ( 2 - χ γ ) 2 2 τ 2 η 2 ( 3 - 2 χ γ )
π m 2 = k ( 1 χ γ ) ( α c ) 2 k ( 2 χ γ ) 2 τ 2 η 2 ( 3 2 χ γ )
π g 2 = k ( 3 2 χ γ ) ( α c ) 2 2 k ( 2 χ γ ) 2 2 τ 2 η 2 ( 3 2 χ γ )
Non-cooperation e 5 = τ η ( α c ) 2 k η 2 τ 2
p 5 = k ( α + c ) c η 2 τ 2 2 k η 2 τ 2
π m 5 = k ( α c ) 2 [ 4 k ( 1 γ ) η 2 τ 2 ] ( 2 k η 2 τ 2 ) 2
π g 5 = k ( α c ) 2 2 k η 2 τ 2
e 6 = 2 η τ ( α c ) ( 1 γ χ ) ( 2 γ χ ) k ( 2 γ χ ) 2 4 η 2 τ 2 ( 1 γ χ )
p 6 = k ( α + c ) ( 2 γ χ ) 2 4 η 2 τ 2 ( 1 γ χ ) [ γ χ ( α c ) + 2 c ] 2 [ k ( 2 γ χ ) 2 4 η 2 τ 2 ( 1 γ χ ) ]
π m 6 = k ( α c ) 2 ( 1 γ χ ) [ k ( 2 γ χ ) 2 2 η 2 τ 2 ( 1 γ χ ) ] [ k ( 2 γ χ ) 2 4 η 2 τ 2 ( 1 γ χ ) ] 2
π g 6 = k ( α c ) 2 ( 2 γ χ ) 2 2 [ k ( 2 γ χ ) 2 4 η 2 τ 2 ( 1 γ χ ) ]
Cooperation e 3 = 3 η τ ( α c ) 8 k 3 η 2 τ 2
p 3 = 2 k ( 3 α + c ) 3 c η 2 τ 2 8 k 3 η 2 τ 2
π m 3 = 2 k ( α c ) 2 8 k 3 η 2 τ 2
π g 3 = 3 k ( α c ) 2 8 k 3 η 2 τ 2
e 4 = 3 η τ ( α c ) 4 k 3 η 2 τ 2
p 4 = k ( 3 α + c ) 3 c η 2 τ 2 4 k 3 η 2 τ 2
π m 4 = k ( α - c ) 2 4 k 3 η 2 τ 2
π g 4 = 3 k ( α c ) 2 2 ( 4 k 3 η 2 τ 2 )
Cooperation e 7 = η τ ( α c ) 2 k η 2 τ 2
p 7 = k ( α + c ) c η 2 τ 2 2 k η 2 τ 2
π m 7 = k ( 4 k η 2 τ 2 ) ( α c ) 2 ( 2 k η 2 τ 2 ) 2
π g 7 = k ( α c ) 2 2 k η 2 τ 2
e 8 = η τ ( α c ) k η 2 τ 2
p 8 = k ( α + c ) 2 c η 2 τ 2 2 ( k η 2 τ 2 )
π m 8 = k ( 2 k η 2 τ 2 ) ( α c ) 2 2 ( k η 2 τ 2 ) 2
π g 8 = k ( α c ) 2 2 ( k η 2 τ 2 )
Using BlockchainNon-cooperation e 9 = τ ( 3 2 γ ) ( α c φ ) 2 k ( 2 γ ) 2 τ 2 ( 3 2 γ )
p 9 = k ( 2 γ ) [ α ( 3 2 γ ) + c + φ ] ( c + φ ) ( 3 2 γ ) τ 2 2 k ( 2 γ ) 2 τ 2 ( 3 2 γ )
π m 9 = k ( 2 γ ) ( α c φ ) 2 [ 4 k ( 1 γ ) ( 2 γ ) ( 3 2 γ ) τ 2 ] [ 2 k ( 2 γ ) 2 τ 2 ( 3 2 γ ) ] 2
π g 9 = k ( 3 2 γ ) ( α c φ ) 2 2 k ( 2 γ ) 2 τ 2 ( 3 2 γ ) I
e 10 = τ ( 3 2 γ χ ) ( α c φ ) k ( 2 γ χ ) 2 τ 2 ( 3 2 γ χ )
p 10 = k ( 2 χ γ ) [ α ( 3 2 χ γ ) + c + φ ] 2 ( c + φ ) ( 3 2 χ γ ) τ 2 2 k ( 2 χ γ ) 2 2 τ 2 ( 3 2 χ γ )
π m 10 = k ( 1 γ χ ) ( α c φ ) 2 k ( 2 γ χ ) 2 τ 2 ( 3 2 γ χ )
π g 10 = k ( 3 2 γ χ ) ( α c φ ) 2 2 [ k ( 2 γ χ ) 2 τ 2 ( 3 2 γ χ ) ] I
Non-cooperation e 13 = τ ( α c φ ) 2 k τ 2
p 13 = k ( α c φ ) τ 2 ( c + φ ) 2 k τ 2
π m 13 = k ( α c φ ) 2 [ 4 k ( 1 γ ) τ 2 ] ( 2 k τ 2 ) 2
π g 13 = k ( α c φ ) 2 2 k τ 2 I
e 14 = 2 τ ( 1 γ χ ) ( α c φ ) ( 2 γ χ ) k ( 2 γ χ ) 2 4 τ 2 ( 1 γ χ )
p 14 = k ( 2 γ χ ) 2 ( α + c + φ ) 4 τ 2 ( 1 γ χ ) [ ( 2 γ χ ) φ + α γ χ ] 2 [ k ( 2 γ χ ) 2 4 τ 2 ( 1 γ χ ) ]
π m 14 = k ( 1 χ γ ) ( 2 χ γ ) 2 ( α c φ ) 2 [ k ( 2 γ χ ) 2 2 τ 2 ( 1 γ χ ) ] [ k ( 2 γ χ ) 2 4 τ 2 ( 1 γ χ ) ] 2
π g 14 = k ( 2 γ χ ) 2 ( α c φ ) 2 2 [ k ( 2 γ χ ) 2 4 τ 2 ( 1 γ χ ) ] I
Cooperation e 11 = 3 τ ( α c φ ) ( 8 k 3 τ 2 )
p 11 = 2 k ( 3 α + c + φ ) 3 τ 2 ( c + φ ) ( 8 k 3 τ 2 )
π m 11 = 2 k ( α c φ ) 2 ( 8 k 3 τ 2 )
π g 11 = 3 k ( α c φ ) 2 ( 8 k 3 τ 2 ) I
e 12 = τ ( α c φ ) ( 4 k 3 τ 2 )
p 12 = 4 k ( 3 α + c + φ ) 9 τ 2 ( c + φ ) 4 ( 4 k 3 τ 2 )
π m 12 = k ( α c φ ) 2 ( 4 k 3 τ 2 )
π g 12 = 3 k ( α c φ ) 2 2 ( 4 k 3 τ 2 ) I
Cooperation e 15 = τ ( α c φ ) 2 k τ 2
p 15 = k ( α + c + φ ) τ 2 ( c + φ ) 2 k τ 2
π m 15 = k ( α c φ ) 2 ( 4 k τ 2 ) ( 2 k τ 2 ) 2
π g 15 = k ( α c φ ) 2 2 k τ 2 I
e 16 = τ ( α c φ ) k τ 2
p 16 = α k + ( 1 2 τ 2 ) ( c + φ ) 2 ( k τ 2 )
π m 16 = k ( 2 k τ 2 ) ( α c φ ) 2 2 ( k τ 2 ) 2
π g 16 = k ( α c φ ) 2 2 ( k τ 2 ) I
Disclaimer/Publisher’s Note: The statements, opinions and data contained in all publications are solely those of the individual author(s) and contributor(s) and not of MDPI and/or the editor(s). MDPI and/or the editor(s) disclaim responsibility for any injury to people or property resulting from any ideas, methods, instructions or products referred to in the content.