Article

Spatio-Temporal Differentiation and Driving Factors of Carbon Storage in Cultivated Land-Use Transition

School of Public Administration and Law, Northeast Agricultural University, Harbin 150030, China
*
Author to whom correspondence should be addressed.
Sustainability 2023, 15(5), 3897; https://doi.org/10.3390/su15053897
Submission received: 2 February 2023 / Revised: 15 February 2023 / Accepted: 19 February 2023 / Published: 21 February 2023

Abstract

:
Revealing the response of carbon storage to cultivated land-use transition (CLUT) and identifying its driving factors are of great significance for maintaining ecosystem stability and promoting regional carbon peak and carbon neutrality goals. Given the knowledge gap regarding the driving factors of carbon storage in CLUT, this study takes the Songhua River Basin in the black soil region of China as the case study area. The study aimed to reveal the spatial–temporal heterogeneity of carbon storage in CLUT based on the grid element method and carbon storage density. In addition, the driving factors were demonstrated using the geodetector model. The results show that the cultivated land area gradually decreased from 1990 to 2020, and the transition between cultivated and construction land was the most significant. The carbon storage in cultivated land-use transitions showed a substantial decreasing trend. The conversion of cultivated land to construction land resulted in the loss of 130,443,200 tons of carbon reserves. Moreover, the transformation from unused land to cultivated land led the highest increase in carbon storage, which increased by 29,334,600 tons. The gravity center of carbon storage was stable, moving 28.77 km to the northeast between 1990 and 2020. Conversely, the spatial structure of carbon storage showed a transformation trend from multicore fragmentation to mononuclear agglomeration, with obvious regional accumulation, a weakened degree of fragmentation, and uniform distribution. Carbon reserves increased by 388,600 tons from 1990 to 2000, and carbon reserves lost 60,121,700 tons from 2010 to 2020, nearly 155.700 times. The mean annual rainfall was the main carbon storage factor. The interaction between mean annual rainfall and land-use intensity had strong explanatory power, and the spatial heterogeneity of carbon storage resulted from multiple factors.

1. Introduction

Global warming is caused by the massive emission of greenhouse gases (CO2 and CH4), which hinders food security and crop production and has become a hot topic of academic research [1,2,3,4]. The terrestrial ecosystem, one of the three major carbon pools of the earth, directly affects regional climate regulation and the material energy cycle [5]. Carbon storage is key to assessing its productivity and ecological resilience to climate change [6]. However, changes in land-use/cover type are often accompanied by a large amount of carbon conversion, which influences the carbon storage of terrestrial ecosystems [7]. The Land Administration Law of the People’s Republic of China in 2021 pointed out that “the national and provincial (district, city) cultivated land retention, basic farmland protection area, total scale of construction land and other indicators should be adjusted”. However, with the rapid development of industrialization, urbanization, and social economy, the contradiction between supply and demand of land resources has become increasingly obvious, and the structure of land use has changed significantly, leading to a series of problems such as large reduction in cultivated land area, climate warming, etc. [8]. According to the Special Report on Climate Change and Land issued by the Intergovernmental Panel on Climate Change in 2019, countries using sustainable land is the best way to ensure carbon sequestration and emission reductions (IPCC, 2019). In addition, at the 26th session of the Conference of the Parties to the United Nations Framework Convention on Climate Change (UNFCCC) in 2021, the conference proposed the common compliance of all countries; it is necessary for each country to formulate phased goals according to its own actual conditions, implement them as specific actions, and finally achieve the goals of carbon peak and carbon neutrality [9]. Cultivated soil organic carbon pools are the most active carbon pools in the terrestrial ecosystem [10,11], meaning that their transition can change the terrestrial ecosystem’s carbon cycle and affect its carbon storage [12]. In recent years, with the rapid development of industrialization and urbanization, the spatial layout and regional form of urban and rural areas have changed rapidly [13]. The rapid flow of rural elements has led to changes in the cultivated land’s quantity, quality, and ecological function, thus changing the scale of carbon emission and carbon absorption of cultivated land [14]. Therefore, exploring the carbon storage response to the CLUT is a prerequisite for reducing cultivated land emissions and increasing sink and sustainable use.
Research on carbon storage is an important issue [15]. Focusing on global warming, researchers have conducted research on carbon storage [16,17,18,19]. First, field sampling and physicochemical analysis have been used to explore the impact of different land-use patterns or certain land-use types on soil carbon storage [17]. Second, the effect of land-use changes on different types of carbon storage has been revealed by remote sensing and geographic information system software [18,19]. Third, the influence of social economy and population development level on carbon storage was analyzed using an econometric model and carbon storage module [20,21]. In recent years, CLUT has been placed at the forefront of research, influenced by construction land expansion and cultivated land protection policies [22]. CLUT is manifested by the changes in dominant morphology, cultivated land quantity and spatial structure, and changes in recessive morphology, such as cultivated land quality, property rights, and output capacity [23,24]. This has made cultivated land an important unit of carbon sequestration, and the global soil carbon pool is about twice that of the atmospheric carbon pool [25]. Accordingly, the CLUT will inevitably alter the carbon-sequestration capacity of land, which will lead to changes in cultivated land fertility and affect grain productivity.
At present, scientific research papers highlight the effects of CLUT and focus on the coupling relationship between CLUT and economic growth [26], increases in farmers’ income [27,28], grain yield [29], ecosystem service value, etc. [30,31]. The research on carbon storage and land-use variation focuses on carbon storage estimation methods [32], spatio-temporal variation characteristics [33,34], and future predictions [35]. Among them, cultivated land carbon storage studies mainly focus on the effects of different tillage methods on soil carbon storage. For example, the utilization of paddy fields contributes to soil carbon sequestration [36]. These studies focus on the impact of a single aspect on carbon storage or the impact of changes in the area of land-use types on carbon storage. Against this background, we found that the current research results are relatively mature.
However, it is difficult explore the gain/loss of carbon storage, as CLUT is still limited and inadequately understood in the studies of other scholars. The specific issues are as follows: (1) There are relatively few studies on how the CLUT affects the temporal and spatial distribution of carbon storage. (2) The driving factors of the carbon storage response to CLUT have not been developed, and the driving factors of the gain/loss of carbon storage have not been identified. (3) The present investigation focuses on carbon storage in urban agglomerations, river basins, and other large-scale areas. However, less attention is paid to the (whole) black soil area, China’s dominant grain-production area. In order to make up for the above deficiencies, (1) barycenter analysis, exploratory spatial data analysis, and kernel density analysis tools were combined in a novel way to reveal the spatial distribution pattern of carbon reserves. (2) The geographic detector model explored the factors of spatial variations in carbon storage and their influence intensity, and judged influence after the interaction and whether the influence force is weakened or strengthened. (3) This present study takes the Songhua River basin in the black soil region as the study area. This study aimed to: (1) analyze spatio-temporal differentiation of carbon storage in CLUT from 1990 to 2020; and (2) explore the driving factors of carbon storage to alleviate the ecological environment deterioration and improve the cultivated land protection policy to provide a scientific reference.

2. Materials and Methods

2.1. Study Area

The Harbin section of the Songhua River basin, located in the core of the black soil region of Heilongjiang Province, China, is located between 125°42′~30°10′ E and 44°04′~46°40′ N (Figure S1). It is an important grain production advantage area and commercial grain production base in China, and also an important region of the “Northeast Revitalization” and “One Belt and One Road” strategy [37]. The land area of the study area is 7067 km2. Cultivated land accounts for about 59.35% of the total land area. The average annual temperature is 5.34 °C, yearly sunshine duration reaches 2180.8 h, and annual rainfall is 569.1 mm [38].

2.2. Data Sources

The land-use data were collected from the Resources and Environment Data Cloud Platform of the Chinese Academy of Sciences (http://www.resdc.cn/ (accessed on 15 July 1990, 2000, 2010, 2020)). Four types of driving factors were considered in this study, namely terrain factors, climatic factors, distance factors, and social and economic factors. Terrain factors include elevation (X1), slope (X2), and relief amplitude (X3), in which the elevation data were obtained from the Geospatial Data Cloud (http://www.gscloud.cn/ (accessed on 20 June 2022)). In contrast, the slope data and relief amplitude were extracted from the elevation data through the ArcGIS analysis tool. Mean annual rainfall (X4) and mean annual temperature (X5) were taken from the China meteorological data-sharing service system (http://data.cma.cn (accessed on 10 August 2022)). Temperature and precipitation conditions determine the geographical distribution and production level of cultivated land and are the most sensitive to changes in carbon storage. Distance factors include vector data of the urban center (X6), roads above the township level (X7), and waters (X8). Road data were provided by OSM (Open Street Map, https://www.openstreetmap.org, accessed on 12 August 2022), which includes roads, highways, and railways. Societal and economic factors include average GDP (X9), population density (X10), land average labor force (X11), urbanization rate (X12), and land use degree (X13). All of these data were set at 30 m resolution in ArcGIS 10.6, using the Albers projection (Table S1).
To accurately and quantitatively describe the spatio-temporal evolution of carbon storage in response to the CLUT, the sample area was divided by an equal square product regular grid with the help of ArcGIS 10.6 software. After repeated debugging, 9175 grid cells were obtained by taking the 900 m × 900 m square grid as the research unit, combined with the study area, research purpose, and computing efficiency, and transferring the required research data to the corresponding grid cells.

2.3. Research Methods

2.3.1. Invest Model

In this study, the land-use structure was divided into six land-use classes using the Chinese Academy of Sciences’ method for reclassifying land-use status: cultivated land, forest land, grassland, water, construction land, and unused land.
The InVEST model is often used to study ecosystem services. It has the advantages of flexible parameters, simple operation, dynamic and spatial elements, and improves the disadvantages of traditional estimation methods such as high operating cost and complex parameters [38,39,40]. Based on land-use/land-cover data, ecosystem carbon storage was estimated, and the InVEST model was divided into four basic carbon pools: aboveground, belowground, soil organic matter, and dead organic matter [39]. According to the research of relevant scholars [40], because the proportion of litter carbon density is small, it is defaulted to 0 [41].
The CLUT data and their three basic carbon pools served as the basic input data for estimating carbon stocks for each grid cell and the entire study area:
C t o t a l = C a b o v e + C b e l o w + C s o i l + C d e a d
where C t o t a l —total carbon storage of ecosystem; C a b o v e —aboveground carbon density of land-use type; C b e l o w —belowground carbon density of land-use type; C s o i l —soil organic carbon density of land-use type; C d e a d —dead organic carbon density of land-use type ( C d e a d = 0).
Δ C E = S i Δ C t o t a l = S i C t o t a l t C t o t a l t 1
where Δ C E is the change in total carbon storage in CLUT; S i —the land area corresponding to the transformation between cultivated land and other land-use types; Δ C t o t a l —the change in carbon density corresponding to the interconversion of cultivated land and different land-use types; C t o t a l t —carbon density value of land use in t period; C t o t a l t 1 —carbon density value of land use in t 1 period.
The basic assumption of the carbon storage module of the InVEST model is that the carbon density of a certain land type is regarded as a constant, and the carbon density of different vegetation types is multiplied by the corresponding area to calculate the regional vegetation carbon storage. Although the carbon density parameter represented data for a single time point, several results have shown that the effect of land use and cover change (LUCC) on changes in carbon storage can be well evaluated even if the change in carbon density is ignored [42,43].
Carbon density data were collected from a dataset of carbon density in Chinese terrestrial ecosystems (2010s) of the National Ecosystem Science Data Center (NESDC, https://www.cern.ac.cn, accessed on 5 August 2022). The dataset was established by combining carbon density in Chinese terrestrial ecosystems with relevant experimental data between 2004 and 2014 [44]. This was a comprehensive and systematic dataset of vegetation and soil organic carbon density in China. The dataset included grassland, shrub, forest, cropland, and wetland ecosystems in China, and encompassed carbon density data of main components such as aboveground biomass, belowground biomass, and soil organic carbon density for different soil depths (0–100 cm). The dataset provided basic data for regional carbon storage. Typical soil samples around the study area were selected to construct a density database. For the experimental data, the carbon density coefficient was mainly determined by using the field sampling test data of relevant research groups and according to the geographical location (longitude and latitude) provided by the database. These were used in combination with vegetation [45], soil type [46], climate, physical conditions [47], etc., to calculate the carbon density in the study area (Table 1). The results in this study showed that the carbon storage density data of the study area are all within a reasonable range, as similar results were reported in previous studies [42,43].

2.3.2. Geographic Detector Model

The geographical detector model can quantitatively assess the factors of spatial variations in carbon storage and their influence intensity. There is also literature on the application procedure and principle of the geodetector [48]. The formula is as follows:
q = 1 h = 1 L N h σ h 2 N σ 2
where q is the explanatory power of driving factors, the range is [0, 1]; L —number of partitions; N h —number of surface h ; N —number of the whole area; σ h 2 —variation variance of carbon emissions in layer h ; and σ 2 —variation variance of carbon storage in the whole region.
Interaction detection is mainly used to judge whether each factor has an independent influence on the dependent variable or has an influence after the interaction, and whether the influence force is weakened or strengthened. The relationship between the two factors can be divided into the following categories:
(1) q(X1∩X2) < Min(q(X1), q(X2)), attenuation of nonlinearity; (2) Min(q(X1), q(X2))q(X1∩X2) < Max(q(X1),q(X2)), the single-factor nonlinearity is weakened; (3) q(X1∩X2) > Max(q(X1), q(X2)), two-factor enhancement; (4) q(X1∩X2) = q(X1) + q(X2), independent; (5) q(X1∩X2) > q(X1) + q(X2), non-linear enhancement.

3. Results

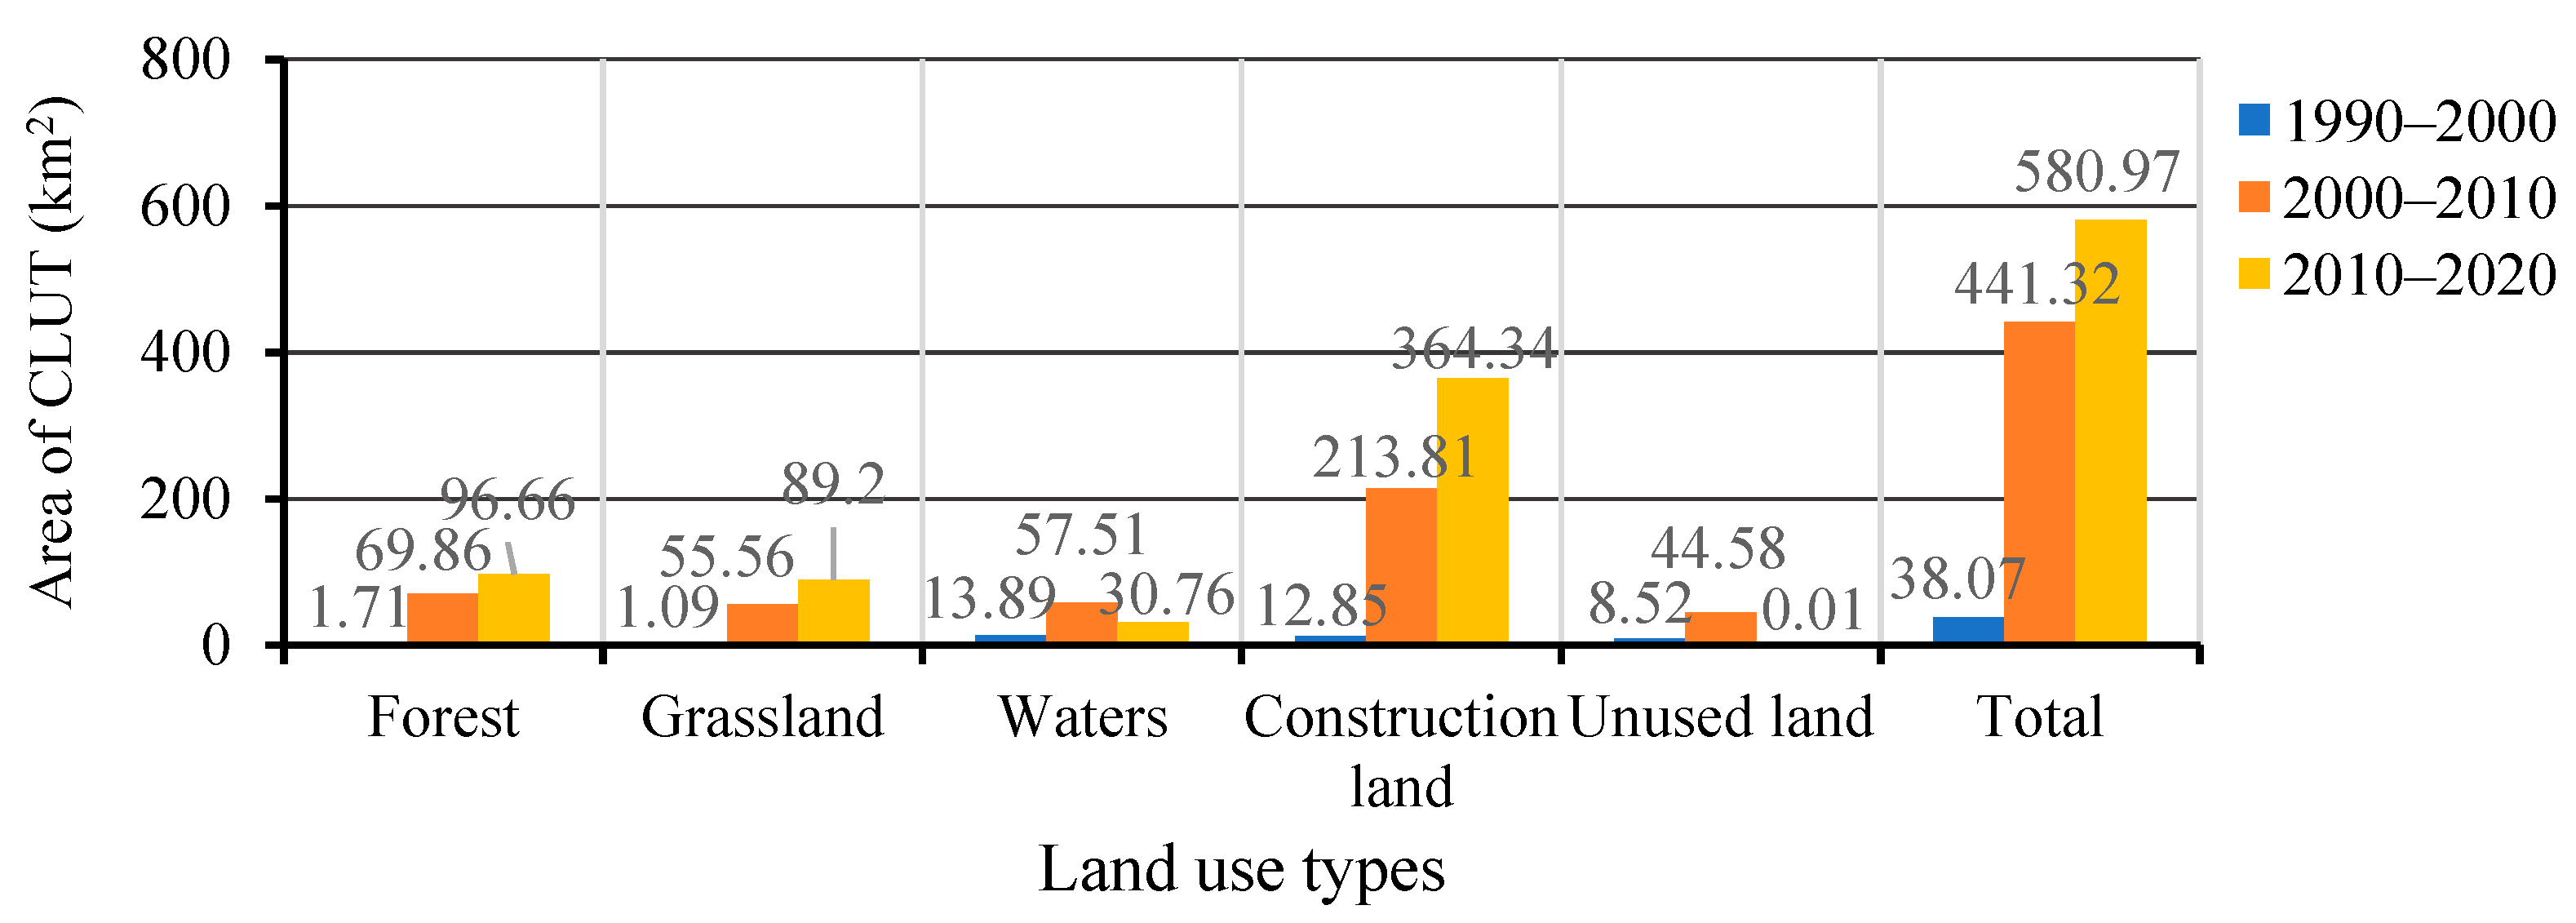
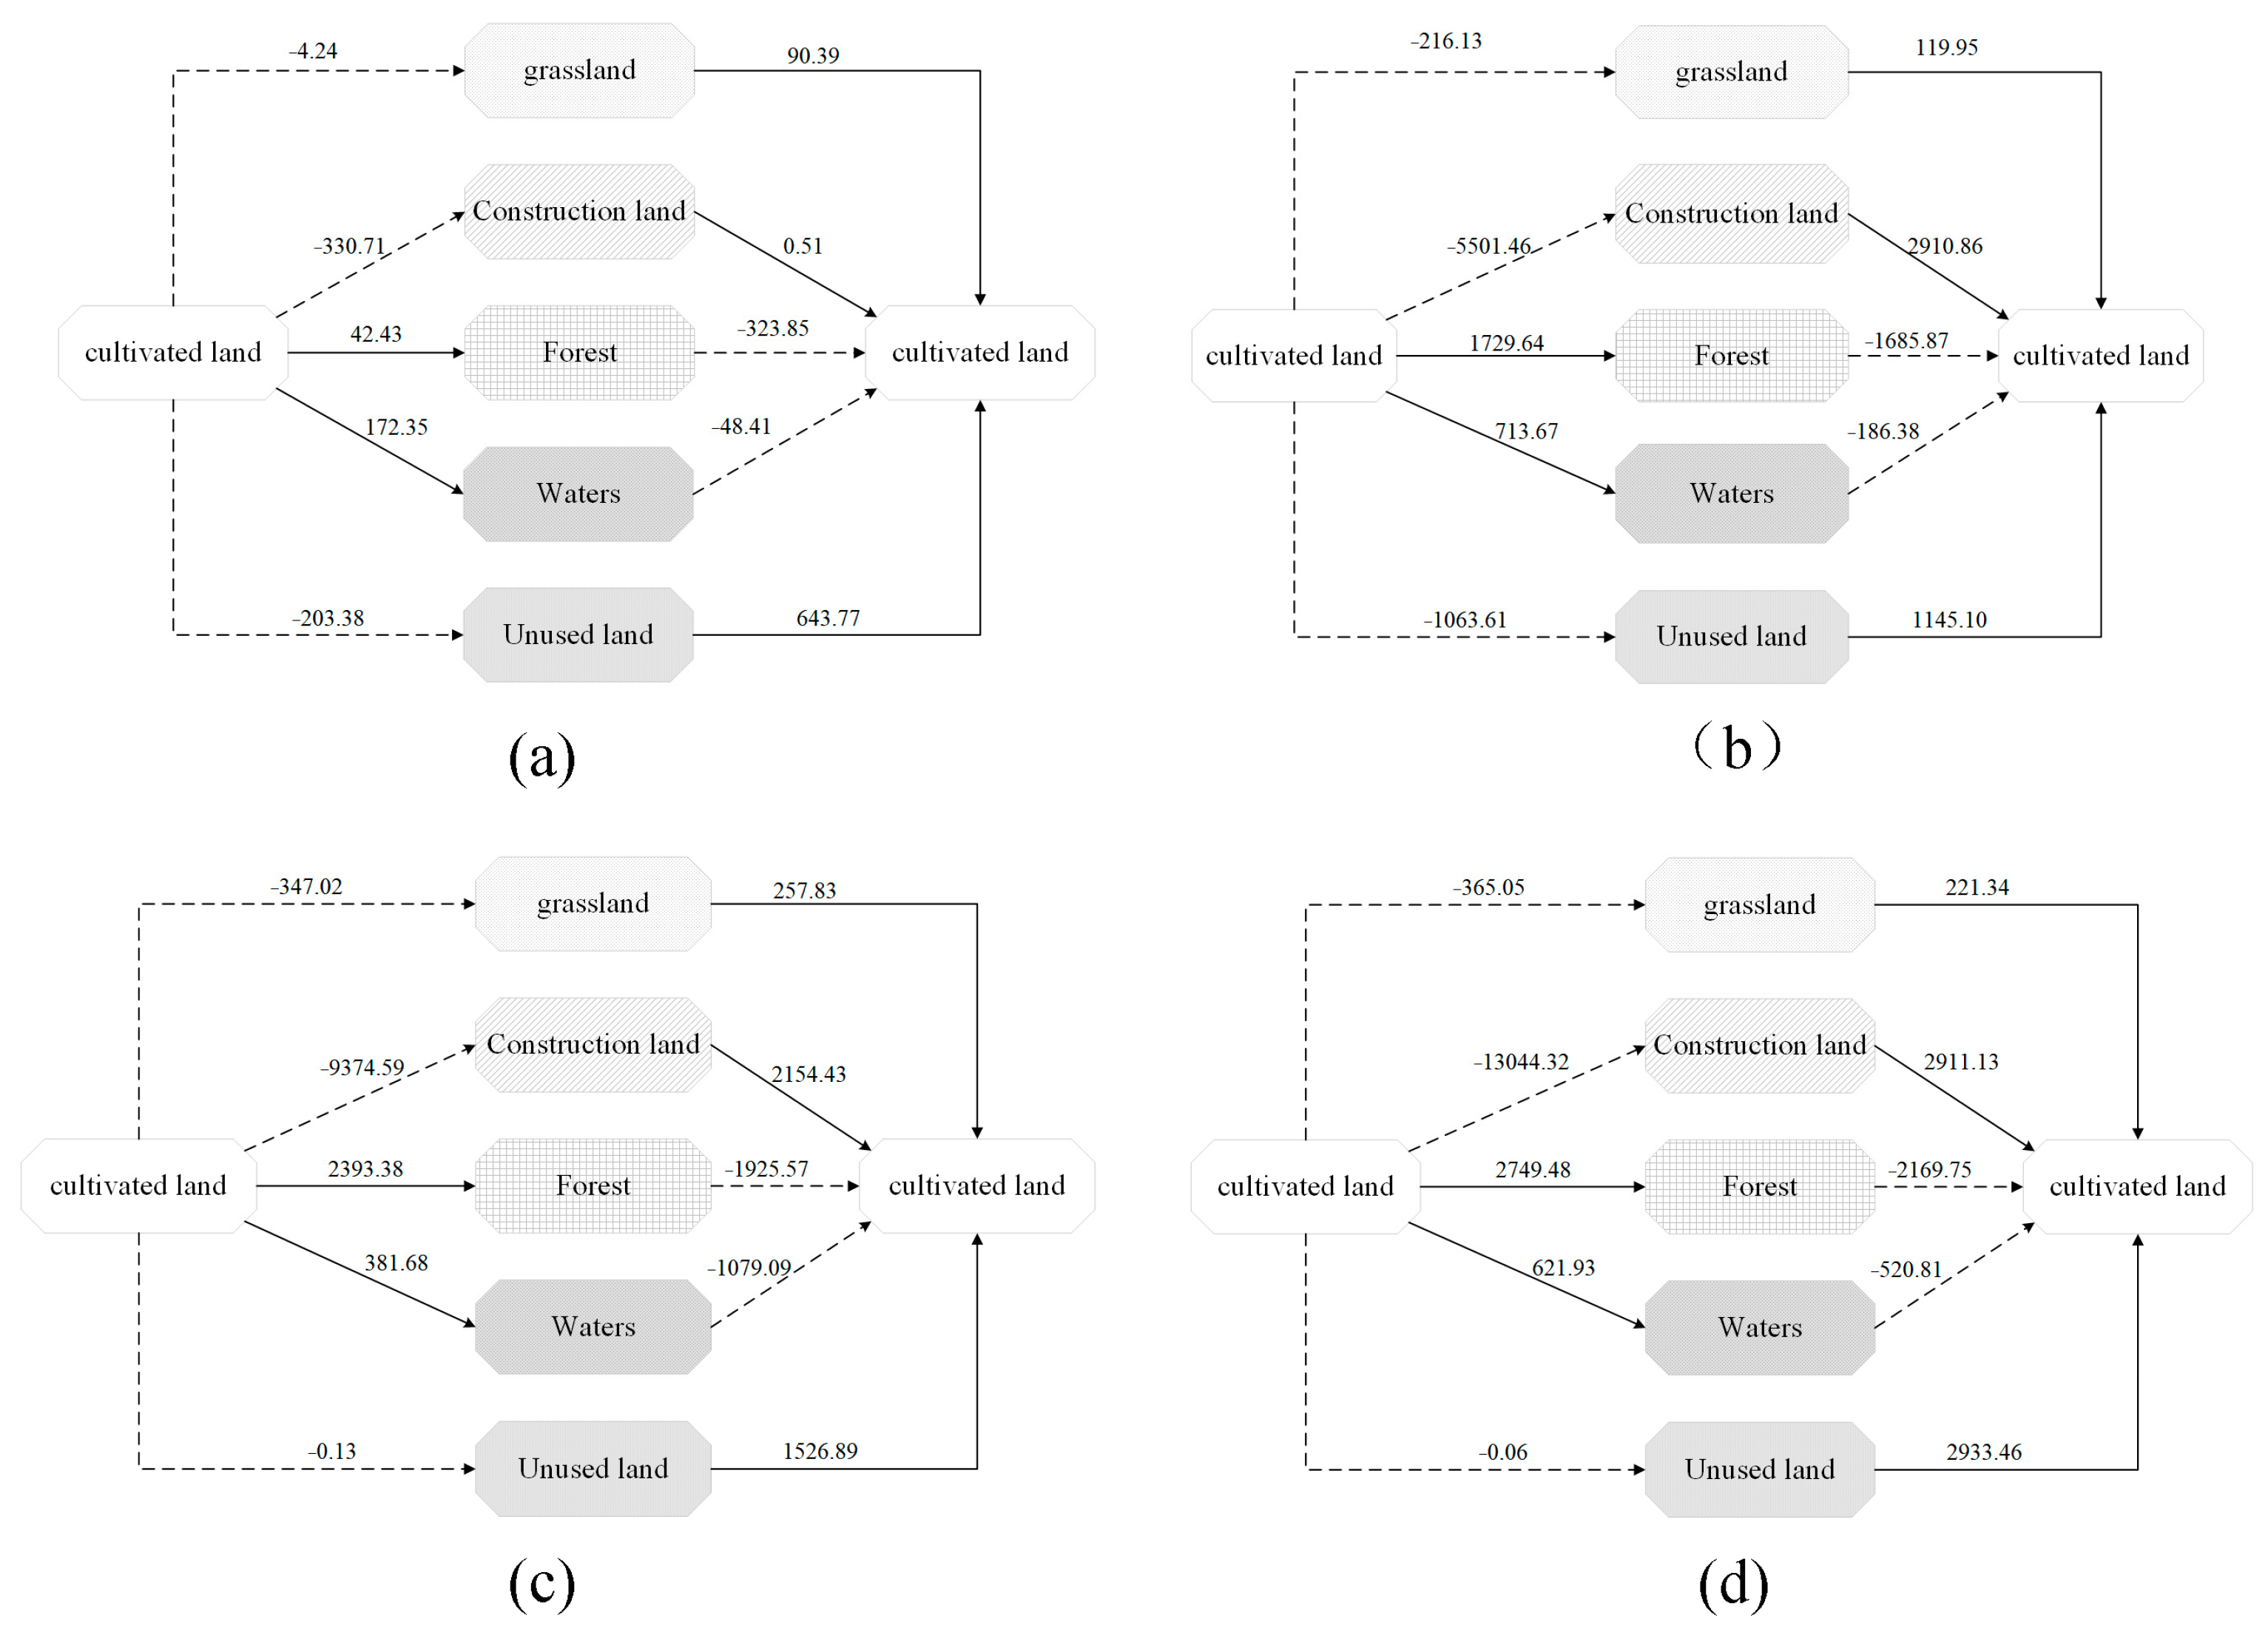
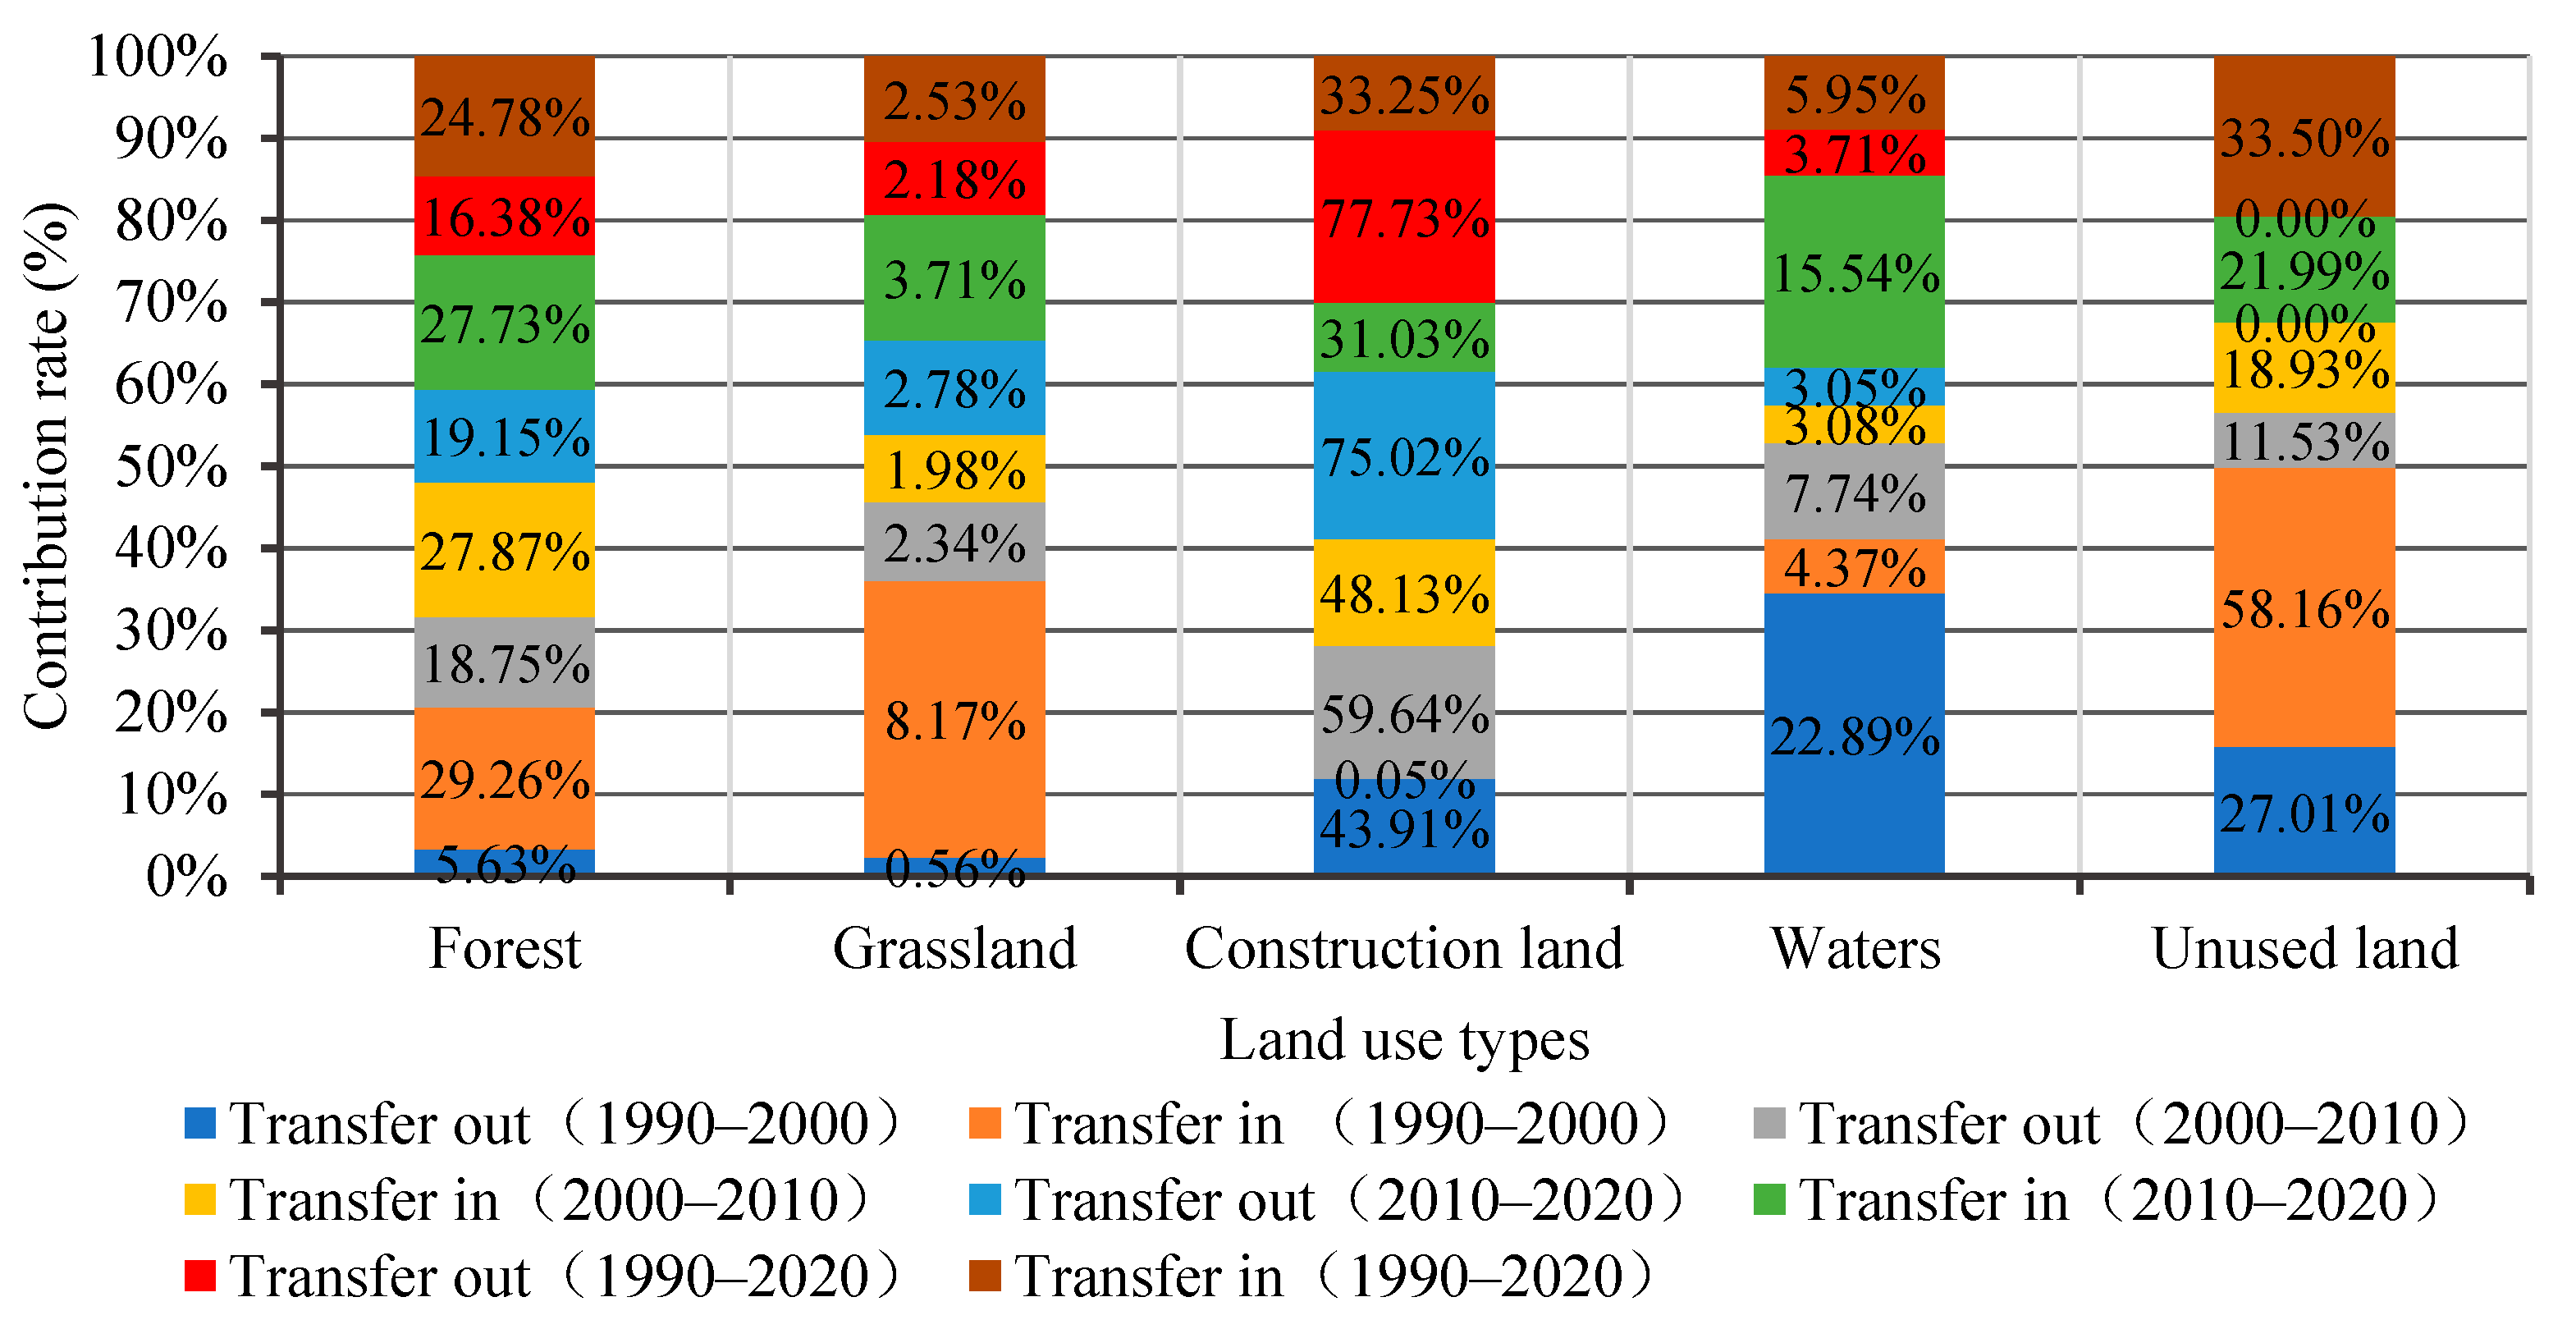
3.1. Structure Change Characteristics of Cultivated Land-Use Transition

Based on the superposition analysis tool of ArcGIS10.6 software (Figure 1), the area of other land-use types that was converted to cultivated land showed an upward trend between 1990 and 2020. It increased from 67.22 km2 in 1990–2000 to 378.72 km2 in 2010–2020. In 1990–2000, the unused land and grassland that were converted to cultivated land were 26.98 km2 and 23.24 km2, respectively. During 2000–2010, the transfer area of construction land was the largest (113.13 km2). In contrast, from 2010 to 2020, the transfer area of other land-use types to cultivated land was insignificant (63 km2~87 km2).
As shown in Figure 2, the cultivated land area converted to other land-use types also showed an upward trend from 1990 to 2020, increasing from 38.07 km2 in 1990–2000 to 580.97 km2 in 2010–2020. Among them, the cultivated land area converted to construction land was the largest, and the area in the late stage was more than 28 times that in the early stage. Then it was converted to forest land and grassland, and the transformation area gradually increased, reaching 96.66 km2 and 89.20 km2 in 2010–2020, respectively. Moreover, the conversion of land area from cultivated land to water and unused land showed a fluctuating trend. The conversion from cultivated land to unused land was relatively insignificant, representing only 0.01 km2 in 2010–2020.
From 1990 to 2020, the area of cultivated land that was transferred was more extensive than that transferred to cultivated land, and the net area of cultivated land conversion was approximately −339.40 km2. In that setting, we found that the cultivated land area decreased during this period. The conversion between cultivated and construction land was the most significant.

3.2. Temporal Variation Characteristics of Carbon Storage in Response to Cultivated Land-Use Transition

From 1990 to 2000 (Figure 3), the carbon storage of cultivated land that was transferred was less than that of cultivated land in the study area, resulting in an increase in carbon storage. The main reason for this is that a large amount of unused land was converted to cultivated land, and the carbon storage increased by 6,437,700 tons; this was followed by land transferred to grassland, and the carbon storage increased by 903,900 tons. The loss of carbon storage was the largest when cultivated land was converted to construction or unused land, which led to losses of 3,337,100 tons and 2,033,800 tons, respectively; the conversion of forest land to cultivated land also resulted in a loss of carbon storage of 3,238,500 tons.
From 2000 to 2010, the transformation of cultivated land use led to a large loss of carbon storage, which showed that the conversion of cultivated land to construction land, unused land, and grassland all resulted in different degrees of carbon storage loss. The conversion of cultivated land to construction land caused the largest loss of carbon storage, which was 55,014,600 tons, followed by unused land (10,636,100 tons). The conversion of forest land to cultivated land also resulted in the loss of 16,858,700 tons of carbon storage. Conversely, the conversion of construction land and unused land to cultivated land, cultivated land to forest land, and water area increased carbon storage, but the overall increase in carbon storage area was far less than the loss of carbon storage.
From 2010 to 2020, the transformation of cultivated land use resulted in a significant carbon storage loss, nearly three times that of the previous period. Specifically, the loss of carbon storage due to cultivated land being converted to construction land reached 93,745,900 tons, and carbon storage lost from forest land and water area being converted to cultivated land exceeded 10,000,000 tons. However, the mutual transformation between cultivated and unused or forest land resulted in increased carbon storage. Overall, the carbon storage of cultivated land-use transitions showed a downward trend from 1990 to 2020. The carbon storage loss was mainly due to the conversion of cultivated land to construction land.
The transformation of cultivated land and construction land dominated the change in carbon storage in the study area from 1990 to 2020 (Figure 4). In the conversion of cultivated land use, leading to an increase in carbon storage, the contribution from the conversion from unused and construction land to cultivated land was the highest, which became the core factor of the increase in carbon storage, followed by the conversion of cultivated land to forest land, accounting for a total contribution rate of 83.13%. In the transformation of cultivated land use leading to the loss of carbon storage, the conversion of cultivated land to construction land accounted for the largest contribution (77.73%), followed by the conversion of forest land and water area to cultivated land.

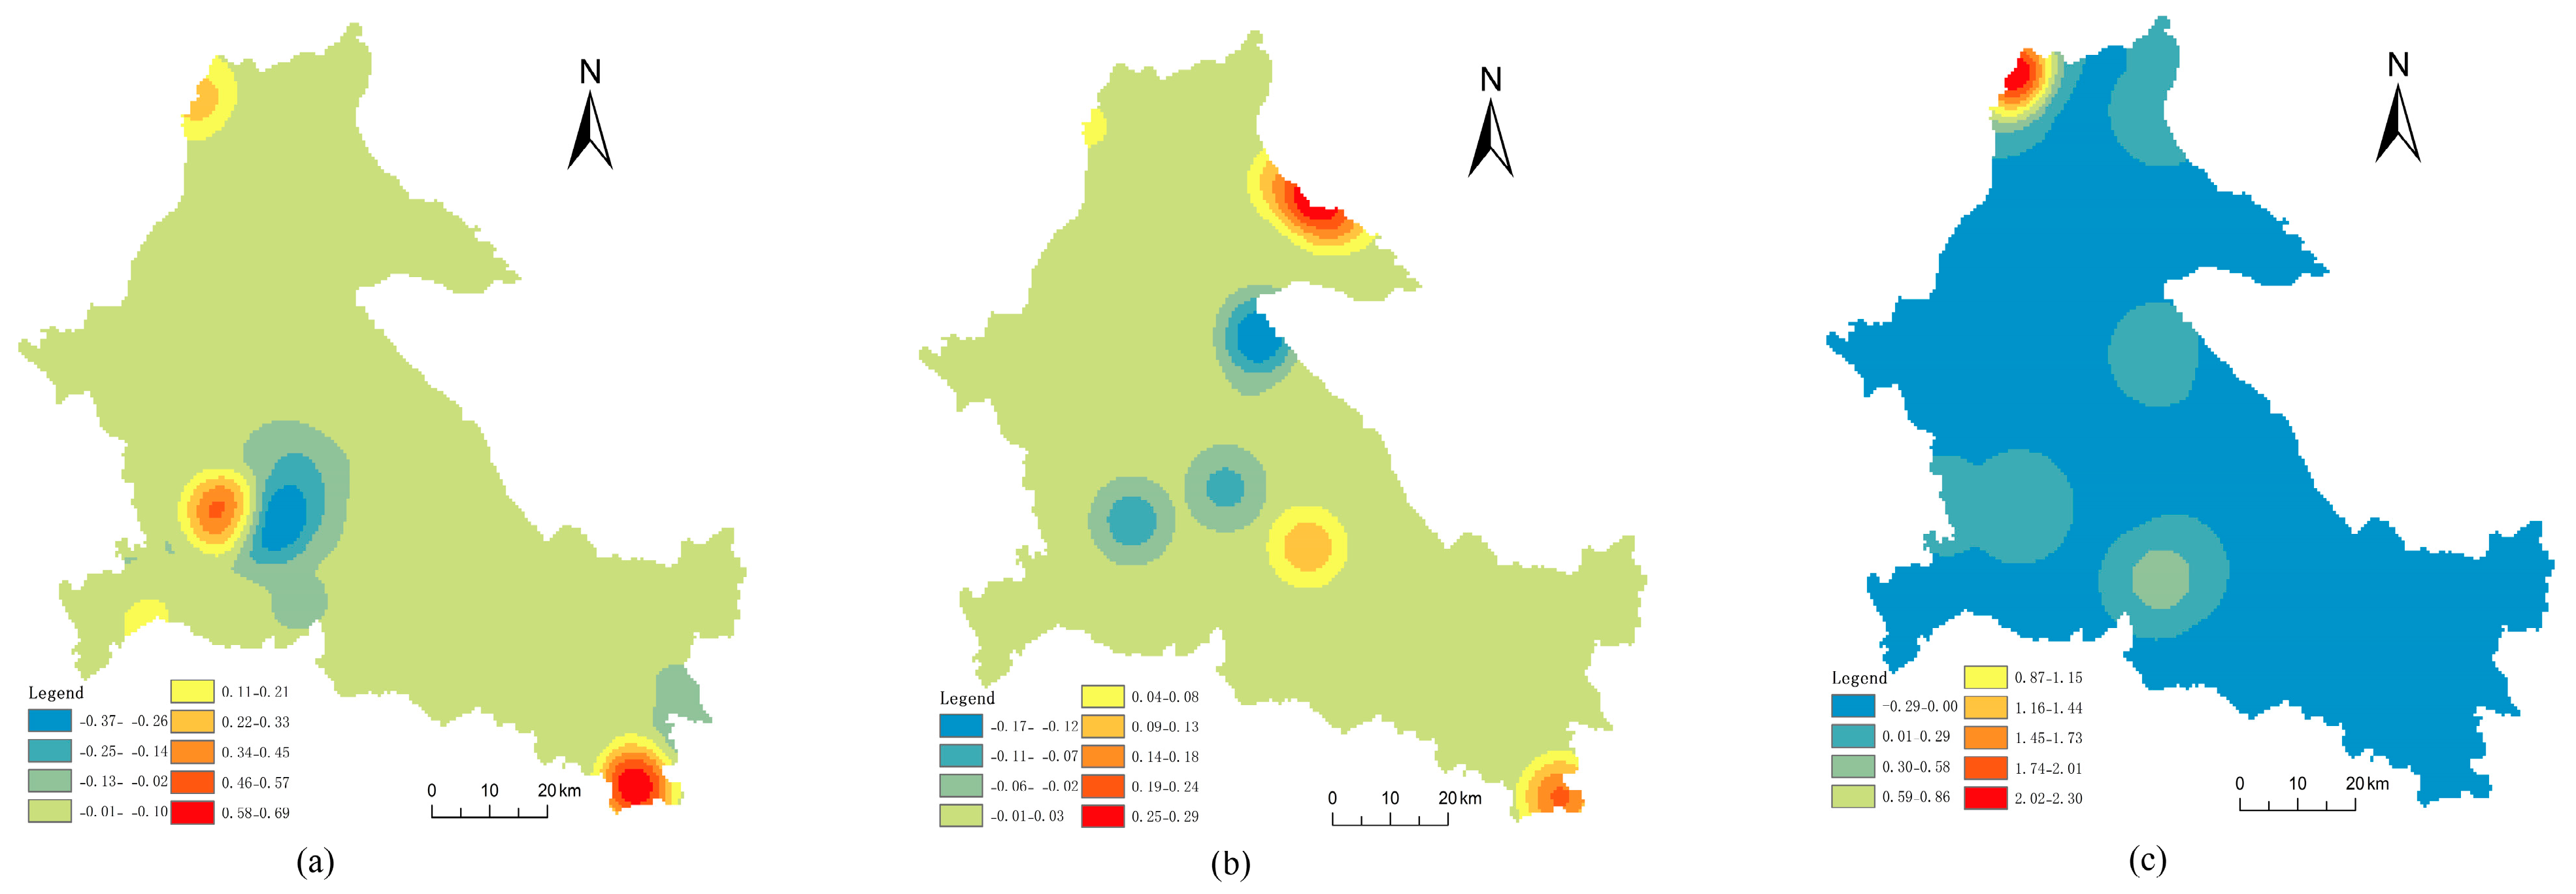
3.3. Spatial Characteristics of Carbon Storage of Cultivated Land-Use Transition

Using the grid element method and the standard deviation ellipse analysis tool of ArcGIS10.6, the spatial distribution of carbon reserves in the study area is illustrated in Figure 5, showing its primary direction and distance. In 1990–2000, 2000–2010, and 2010–2020, the spatial distribution characteristics of the response of carbon storage to the transformation of cultivated land use showed the distribution pattern of northwest–southeast, and the carbon storage in the northwest–southeast direction was more concentrated than that in the southwest–northeast direction.
From 1990 to 2020, the standard deviations of the main axis and auxiliary axis of carbon storage generally decreased by 12.33 km and 0.81 km, respectively, indicating that the centripetal force of carbon storage gradually weakened due to the transformation of cultivated land (Table 2). During 1990 to 2000, the dispersion degree of carbon storage was the smallest, the flatness was the largest, and the shape index was the smallest, showing that the distribution characteristics of carbon storage were obvious, and the directionality was the strongest. The reverse was true from 2000 to 2010. From 1990 to 2020, the ellipse area of carbon storage decreased by 1274.25 km2, suggesting a great change in the carbon storage during the CLUT, and its spatial distribution was gradually reduced. The carbon storage center of CLUT was located in the southeast part of the geometric center of gravity of the study area. As a reference point, the center of gravity of transitional carbon storage in 2000–2010 shifted in the northwestern direction by 18.34 km compared with that in 1990–2000, and the center of carbon storage in 2010–2020 shifted to the southeast by 15.82 km. Between 2010 and 2020, the carbon storage of CLUT shifted to the northeast by 28.77 km compared with 1990–2000.
Using ArcGIS 10.6 software’s core density analysis model, the distribution density center of carbon storage was analyzed to reveal the spatial heterogeneity of carbon storage in response to the CLUT (Figure 6). Between 1990 and 2020, the core density difference of carbon storage was significant in different regions, showing a distribution pattern of “dense at the edge and sparse at the middle”. The spatial agglomeration effect was significantly enhanced from the low- to the high-value area. High-density areas were mainly distributed in the north and south, the maximum value of nuclear density showed an upward trend, and the aggregation gradually increased. In contrast, low-density areas were mainly concentrated in the central part, and the minimum nuclear density demonstrated an upward trend. Given the minimum or maximum kernel density, the aggregation was enhanced. During 1990–2000, the core density of carbon storage was relatively low, showing a dot spatial distribution pattern of “multi-core agglomeration”. A’cheng and Daoli zones formed a high agglomeration area, and Hulan zone was a secondary agglomeration area. The study results also highlighted, from 2000 to 2010, that the core density of carbon storage decreased, showing a punctate spatial differentiation characteristic of “multicore distribution”. In addition to the first-level core agglomeration area, several fragmentary patchy sub-level agglomeration cores were formed. The high-concentration area gradually moved to the northern part, mainly distributed in the Hulan and A’cheng sectors, and affected the surrounding areas’ core radiation. In addition, from 2010 to 2020, carbon storage showed a point-like distribution pattern of “single-core agglomeration,” with the Hulan zone in the north as the high-agglomeration area. The maximum value of nuclear density significantly increased, and the value of nuclear density significantly decreased compared with that in the previous period. These results indicated that carbon storage showed an obvious regional agglomeration phenomenon, and the overall degree of agglomeration significantly decreased. Overall, the spatial distribution pattern of carbon storage showed a transitional trend from multicore fragmentation to mononuclear accumulation. The spatial distribution pattern showed obvious regional accumulation compared to the previous period. The degree of fragmentation weakened, and the distribution tended to be uniform.

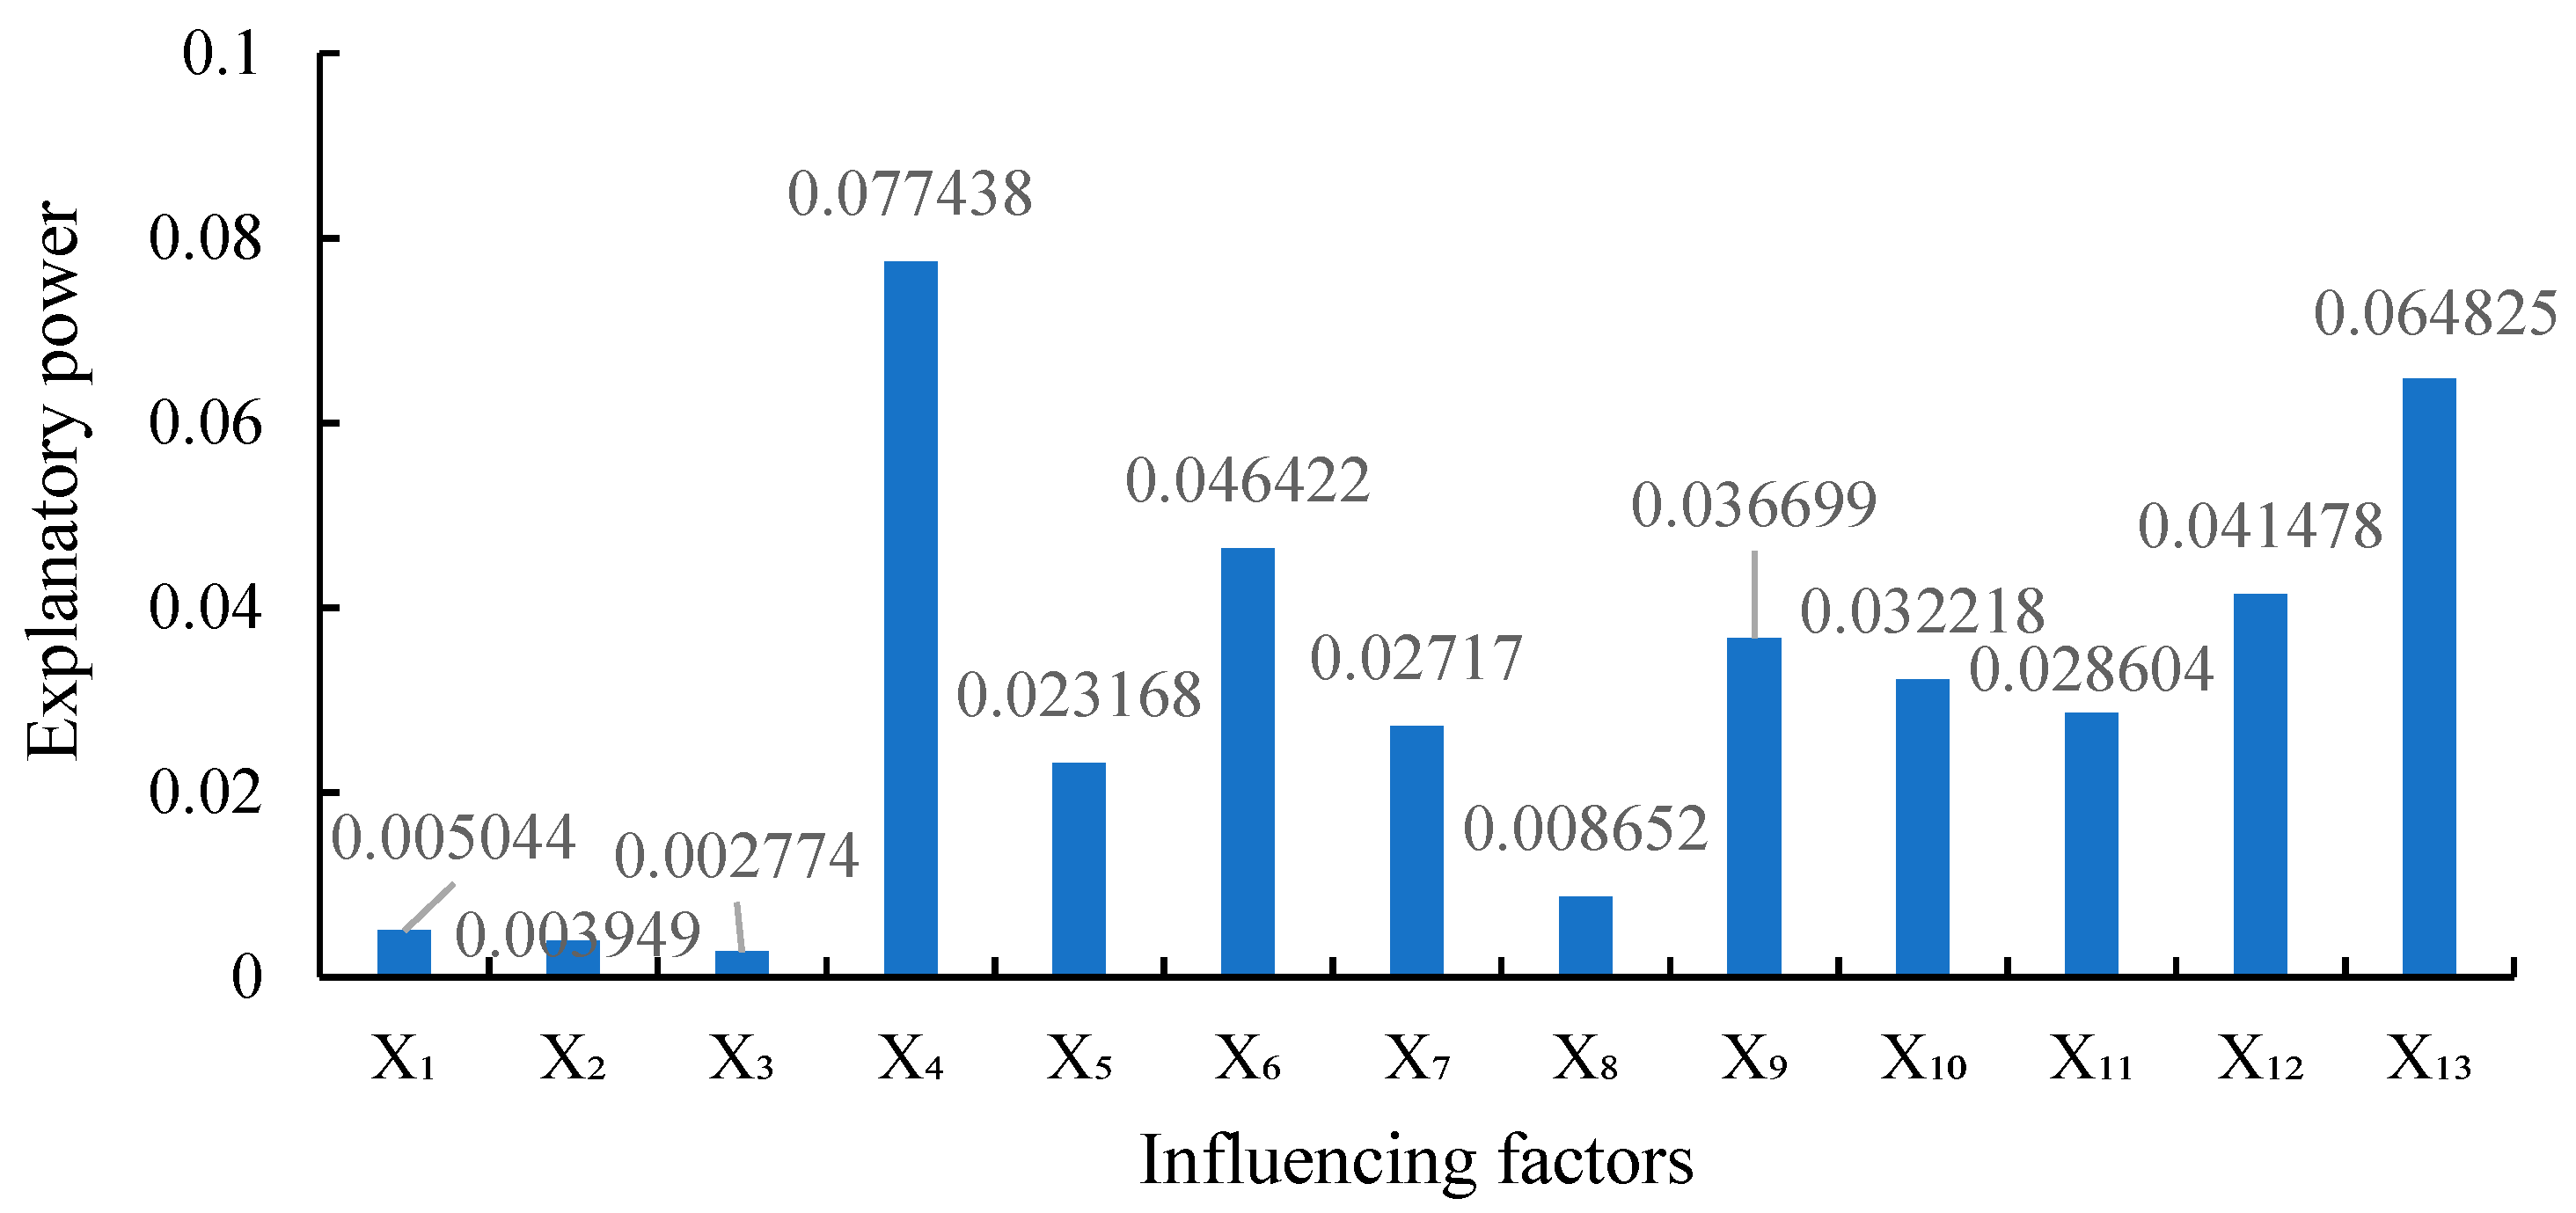
3.4. Driving Factors of Carbon Storage Response to Cultivated Land-Use Transition

Given that the same factor had similar explanatory power on carbon storage in different periods, the driving factors of carbon storage were analyzed by taking 2010–2020 as the reference period. The factor detection method in the geographic detector model was used to quantitatively evaluate the factors affecting carbon storage in the study area and their influence intensity. Hence, from 2010 to 2020, the influencing factors of carbon storage in descending order were annual average rainfall (0.0774), land-use degree (0.0648), distance from the urban center (0.0464), and urbanization rate (0.0415). In the same sense, these factors were followed by average land GDP (0.0367), population density (0.0322), land average labor force (0.0286), distance from roads above township level (0.0272), annual average temperature (0.0232), distance from water area (0.0087), elevation (0.0050), slope (0.0039), and topographic relief (0.0028). Among these factors, we note that the annual average rainfall was the main controlling factor for carbon storage, followed by the degree of land use. However, the influence of elevation, slope, and topographic relief on carbon storage was relatively low, indicating that annual average rainfall and land-use degree greatly influenced carbon storage (Figure 7).
From 2010 to 2020, the spatial heterogeneity of carbon storage in response to CLUT originated from the multi-interaction of factors. A single factor cannot fully explain the spatial differentiation characteristics of carbon storage in response to CLUT. According to the interactive detection method of the geographic detector model, the interaction between different factors can have a stronger effect, and its action modes include nonlinear enhancement and dual-factor enhancement. The interaction of the influencing factors of carbon storage on the response of CLUT was dominated by dual-factor enhancement (Table 3). The interaction between land-use degree and annual average rainfall was the largest (0.1164), followed by the interaction between land-use degree and distance from the urban center (0.1163) and average yearly rainfall and distance from the urban center (0.1110). The interaction between land-use degree and distance from the urban center (0.1163) showed a nonlinear enhancement.
In contrast, the interaction between land-use degree and annual average rainfall, average yearly rainfall, and distance from urban center showed an effect of double-factor enhancement, suggesting that the interaction between climate and socioeconomic factors is dominated by dual-factor enhancement. Globally, the interaction between the annual average rainfall and other factors was significantly stronger than other factors. Rainfall determines the water–heat conditions in different geographical locations. Through the impact on net primary productivity of vegetation photosynthesis, this regulateds the spatial distribution of regional vegetation. As the only source of soil moisture, rainfall was the main factor limiting vegetation productivity. Therefore, the interaction intensity between the annual average rainfall and other factors was the most complex. The interaction between climate, distance, social, and economic factors was more substantial than the internal interaction of factors, demonstrating that the spatial differentiation of carbon storage in response to CLUT was not the result of a single factor acting alone but of a synergistic interaction.

4. Discussion

Previous research reported that CLUT directly caused the spatial changes in carbon storage in terrestrial ecosystems. In this study, the results showed that CLUT led to the spatial changes in carbon storage, and the driving factors affected the shift in carbon storage, which may provide a scientific basis for ensuring food security and achieving the goal of low carbon peak carbon neutralization.
Firstly, recent CLUT research mainly focused on solving the contradiction between the non-agricultural CLUT and food safety and rarely involved CLUT’s impact on carbon storage [49]. Consistent with previous research, this study’s results showed that the mutual transformation between cultivated land and other land types changed the carbon storage of aboveground/belowground biology and soil carbon storage. Due to the acceleration of urban expansion, the marginalization and isolation of cultivated land and the carbon storage of cultivated land were far higher than that of construction land, resulting in a large loss of carbon storage. Carbon storage will increase when cultivated land is converted into forest land and water area with relatively high carbon storage. However, during CLUT in the study area, the loss of carbon storage was greater than the increase in carbon reserves. The loss of carbon storage was caused by the occupation of construction land. The increase in carbon storage was mainly due to the transition between unused land and cultivated land. The second is forest; although China has introduced forest land protection policies and laws, there is still a certain transformation between cultivated land and forest land from 1990 to 2020. Due to the large carbon density coefficient between cultivated land and forest land, the carbon storage value of the transformation between them is large, and especially the strong implementation of the policy of returning farmland to forest and the protection of the red line of 1.8 billion mu of cultivated land, the carbon storage change between cultivated land and forest land is large.
Secondly, the spatial distribution of carbon storage changed during CLUT. This study found that carbon storage in the study area was distributed in the northwest–southeast, and carbon storage in this direction was more concentrated. Compared with the initial stage, carbon storage shifted to the northeastern region, showing a trend from multi-nucleus fragmentation to single-nucleus agglomeration. Due to the acceleration of urbanization and industrialization in the study area, the continuous development and increase in built-up area in the central region occupied a large amount of cultivated land, which led to CLUT. Consequently, this situation led to a serious loss of carbon storage and a lack of obvious hot carbon storage areas. The regions with significant CLUT in the study area were mainly the central and southern regions, with serious carbon storage loss. Relevant studies also showed that the central and southern parts of the regions had low altitudes, and human activities and construction land expansion were intense. The northern region has rich water resources, and the effect of returning farmland to the forest and grassland project was remarkable, consistent with this study’s results. Therefore, the hotspot analysis of carbon storage was mainly concentrated in the northern part of our study area. It can be seen that the CLUT involved two aspects of carbon storage: carbon storage data transformation and space transformation.
Thirdly, this study found that average annual rainfall (X4) was the main control factor in carbon storage. The main factor of vegetation growth and development is soil moisture derived from rainfall. Vegetation biomass carbon density increases in areas with higher rainfall. Previous studies showed that climate (mean annual rainfall and mean annual temperature) have different degrees of influence on the spatial pattern of carbon density in different carbon pools, among which climate is the main factor [50]. Moreover, the mean annual temperature (X5) also has a relatively high impact on carbon storage. Soil carbon storage has an inverse relationship with temperature when the mean annual temperature is less than or equal to 10 °C [51]. Elevation (X1), slope (X2), and relief amplitude (X3) factors on carbon storage were relatively small in this study, because the terrain of the study area is relatively flat and the altitude is relatively low. Previous studies found that carbon storage was heterogeneous at different altitudes, and the carbon storage was mainly concentrated between 1300 and 1400 m [52]. Hence, climatic factors largely determine vegetation productivity and biotic community composition, affecting vegetation growth and soil organic carbon mineralization, and regulating the spatial pattern of terrestrial ecosystem biological carbon.
The second largest impact of carbon storage was land-use degree (X13) in this study. With the increase in land-use degree, the more drastic the CLUT, and the more obvious the soil carbon density and above-/belowground biological carbon density were. Relevant studies have found that land use change can lead to the loss of carbon storage by increasing cultivated land and construction land, and carbon storage can increase through the return of farmland to forest or grassland [53]. The influence of distance from urban center (X6) on carbon storage is relatively high. The closer the distance was to the urban center, the greater was the probability of conversion of cultivated land into construction land, and the soil carbon storage decreased significantly [54]. In addition, distance from roads above township level (X7) and distance from water area (X8) also have different degrees of influence, because the distance factor determines whether the land-use type changes to a certain extent, and the change of land-use type has a significant impact on soil carbon storage [55]. Specifically, the impact of urbanization rate (X12), average GDP (X9), population density (X10), and land average labor force (X11) on carbon storage showed a moderate level. Given that a large number of laborers/population pour into urban areas, population size increases could lead to the expansion of urban and rural areas, resulting in the fragmentation of ecological land and the reduction of carbon storage, directly/indirectly affecting the carbon storage of the terrestrial ecosystem [56]. The impact of average GDP (X9) on carbon reserves ranked fifth. Current studies demonstrated that improving the rural economy could enhance vegetation restoration effectiveness [57]. Interestingly, the interaction between different factors had a stronger impact on carbon storage, and the interaction between mean annual rainfall (X4) and land use degree (X13) had the strongest explanatory power, which also confirms the results that the stronger two factors on carbon storage were X4 and X13, considering a single factor.
Although this study explored the spatial differentiation characteristics and driving factors of carbon storage in response to CLUT, it still had some limitations. First, the carbon storage coefficient data were mainly obtained through the carbon density correction formula at the national level and were not measured using experimental methods. Second, policy factors were not considered in the analysis. The present study focused only on the topography, climate, distance, and social and economic variables. In that setting, it is important to note that this does not mean that the influence of policy factors on carbon storage is insignificant. The change in carbon storage varies with the degree of CLUT under different policy directions.

5. Conclusions

The impact of cultivated land-use transition on carbon storage was analyzed in the study area from 1990 to 2020 using the unit grid method and InVEST model. The spatial pattern of the response of carbon storage to the cultivated land-use transition was conducted using barycenter analysis, exploratory spatial data analysis, and kernel density analysis tools. The geographic detector model explored the driving factors of carbon storage.
The response of carbon storage to cultivated land-use transition in the study area varied. First, the cultivated land area that was transferred out was larger than the area transferred in from 1990 to 2020. The net area of cultivated land transformed was about −339.40 km2. It is worth noting that the cultivated land area showed a diminishing tendency, and the conversion between cultivated land and construction land was the most intense. Secondly, carbon storage also showed a downward trend, and the mutual conversion of cultivated land and construction land dominated the change in carbon storage in the study area. In the cultivated land-use transition leading to the increase in carbon storage, the contribution rate of the transformation from unused land/construction land to cultivated land was the highest. In the conversion of cultivated land use that resulted in the loss of carbon storage, the contribution rate of cultivated land converted to construction land was the largest, reaching 77.73%. Third, the spatial repartition of carbon storage was concentrated in the northwest–southeast part. From 1990 to 2000, carbon storage had the smallest dispersion, the largest oblateness, the smallest shape index, and obvious distribution characteristics with multiple directions. Compared with the initial stage, the late-stage carbon storage change shifted by 28.77 km to the northeast. Fourth, the average annual rainfall and land-use intensity were the most important factors affecting the spatial morphology of carbon storage. The interaction between climate factors and other factors mainly showed two-factor enhancement. As a result, the study’s conclusions showed that the spatial differentiation characteristics of carbon storage in response to cultivated land-use transition resulted from multiple factors.
In order to reduce the impact of cultivated land-use transformation on carbon storage, the following countermeasures could be considered in the future:
(1)
Strengthen the protection of cultivated land and the economical and intensive use of construction land to reduce the impact of construction land expansion on carbon storage. Simultaneously, idle and abandoned construction land should be actively utilized or reclaimed into forest or cultivated land to guide the moderately intensive development of cultivated land;
(2)
Forest land has a high carbon density, which could effectively increase the level of carbon sink. Therefore, the stability of forest land ecosystems should be maintained as far as possible, and the scale of forest land should be continuously increased. Under the premise of ensuring China’s food security, the policy of returning farmland to forest should be vigorously implemented.
(3)
Actively implement ecological protection and restoration projects, and continuously explore the systematic restoration of ecological corridors, river systems, and important ecological functional areas, and explore restoration and treatment measures.
(4)
Strengthen the measurement and monitoring of carbon emissions from land-use type conversion, so as to develop land-use patterns conducive to carbon sinks.

Supplementary Materials

The following supporting information can be downloaded at: https://www.mdpi.com/article/10.3390/su15053897/s1, Figure S1: Location and topography of the study area; Table S1: Index system of formation mechanism analysis.

Author Contributions

Conceptualization, Z.G. and Y.X.; methodology, Z.G.; validation, Z.G., Y.X. and G.D.; formal analysis, G.D.; resources, Y.X. and Z.G.; data curation, Y.X.; writing—original draft preparation, Y.X.; writing—review and editing, Z.G. and G.D.; visualization, Y.X. and G.D.; supervision, Z.G.; project administration, Z.G.; acquisition of funding, Z.G. All authors have read and agreed to the published version of the manuscript.

Funding

This research was funded by the National Key R&D Program of China, grant number 2021YFD1500101, and the Youth Talent Project of the Northeast Agricultural University of China, grant number 19QC37.

Institutional Review Board Statement

Not applicable.

Informed Consent Statement

Informed consent was obtained from all subjects involved in the study.

Data Availability Statement

Not applicable.

Acknowledgments

We would like to express our gratitude to the professionals of the Northeast Agricultural University who encouraged us to make this project a success.

Conflicts of Interest

The authors declare no conflict of interest.

References

  1. Elahi, E.; Khalid, Z.; Tauni, M.Z.; Zhang, H.; Lirong, X. Extreme weather events risk to crop-production and the adaptation of innovative management strategies to mitigate the risk: A retrospective survey of rural Punjab, Pakistan. Technovation 2022, 117, 102255. [Google Scholar] [CrossRef]
  2. Abbas, A.; Waseem, M.; Ahmad, R.; Khan, K.A.; Zhao, C.; Zhu, J. Sensitivity analysis of greenhouse gas emissions at farm level: Case study of grain and cash crops. Environ. Sci. Pollut. Res. 2022, 29, 82559–82573. [Google Scholar] [CrossRef]
  3. Abbas, A.; Zhao, C.; Waseem, M.; Khan, K.A.; Ahmad, R. Analysis of Energy Input–Output of Farms and Assessment of Greenhouse Gas Emissions: A Case Study of Cotton Growers. Front. Environ. Sci. 2022, 9, 725. [Google Scholar] [CrossRef]
  4. Elahi, E.; Khalid, Z.; Zhang, Z. Understanding farmers’ intention and willingness to install renewable energy technology: A solution to reduce the environmental emissions of agriculture. Appl. Energy 2022, 309, 118459. [Google Scholar] [CrossRef]
  5. Liu, M.; Dong, X.; Wang, X.-C.; Zhao, B.; Fan, W.; Wei, H.; Zhang, P.; Liu, R. Evaluating the future terrestrial ecosystem contributions to carbon neutrality in Qinghai-Tibet Plateau. J. Clean. Prod. 2022, 374, 133914. [Google Scholar] [CrossRef]
  6. Xiang, S.; Wang, Y.; Deng, H.; Yang, C.; Wang, Z.; Gao, M. Response and multi-scenario prediction of carbon storage to land use/cover change in the main urban area of Chongqing, China. Ecol. Indic. 2022, 142, 129205. [Google Scholar] [CrossRef]
  7. Dinakaran, J.; Chandra, A.; Chamoli, K.; Deka, J.; Rao, K. Soil organic carbon stabilization changes with an altitude gradient of land cover types in central Himalaya, India. Catena 2018, 170, 374–385. [Google Scholar] [CrossRef]
  8. Zhang, M.; Al Kafy, A.; Xiao, P.; Han, S.; Zou, S.; Saha, M.; Zhang, C.; Tan, S. Impact of urban expansion on land surface temperature and carbon emissions using machine learning algorithms in Wuhan, China. Urban Clim. 2023, 47, 101347. [Google Scholar] [CrossRef]
  9. Chen, H.; Qi, S.; Zhang, J. Towards carbon neutrality with Chinese characteristics: From an integrated perspective of economic growth-equity-environment. Appl. Energy 2022, 324, 119719. [Google Scholar] [CrossRef]
  10. Ansari, M.A.; Choudhury, B.U.; Mandal, S.; Jat, S.L.; Meitei, C.B. Converting primary forests to cultivated lands: Long-term effects on the vertical distribution of soil carbon and biological activity in the foothills of Eastern Himalaya. J. Environ. Manag. 2021, 301, 113886. [Google Scholar] [CrossRef]
  11. Benbi, D.K.; Brar, K.; Toor, A.S.; Singh, P. Total and labile pools of soil organic carbon in cultivated and undisturbed soils in northern India. Geoderma 2015, 237–238, 149–158. [Google Scholar] [CrossRef]
  12. Das, S.; Bhattacharyya, R.; Das Saha, N.; Ghosh, A.; Khan, S.; Ahmed, N.; Dey, A.; Bhatia, A.; Pramanik, P.; Kumar, S.N.; et al. Soil aggregate-associated carbon and organic carbon pools as affected by conversion of forest lands to agriculture in an acid soil of India. Soil Tillage Res. 2022, 223, 105443. [Google Scholar] [CrossRef]
  13. Wu, J.; Bai, Z. Spatial and temporal changes of the ecological footprint of China’s resource-based cities in the process of urbanization. Resour. Policy 2022, 75, 102491. [Google Scholar] [CrossRef]
  14. Zhang, H.; Li, S. Carbon emissions’ spatial-temporal heterogeneity and identification from rural energy consumption in China. J. Environ. Manag. 2021, 304, 114286. [Google Scholar] [CrossRef]
  15. Morkner, P.; Bauer, J.; Creason, C.; Sabbatino, M.; Wingo, P.; Greenburg, R.; Walker, S.; Yeates, D.; Rose, K. Distilling data to drive carbon storage insights. Comput. Geosci. 2021, 158, 104945. [Google Scholar] [CrossRef]
  16. Zheng, J.; Duan, H.; Yuan, Y. Perspective for China’s carbon capture and storage under the Paris agreement climate pledges. Int. J. Greenh. Gas Control 2022, 119, 103738. [Google Scholar] [CrossRef]
  17. Ferreiro-Domínguez, N.; Palma, J.; Paulo, J.; Rigueiro-Rodríguez, A.; Mosquera-Losada, M. Assessment of soil carbon storage in three land use types of a semi-arid ecosystem in South Portugal. Catena 2022, 213, 106196. [Google Scholar] [CrossRef]
  18. Li, W.; Jia, S.; He, W.; Raza, S.; Zamanian, K.; Zhao, X. Analysis of the consequences of land-use changes and soil types on organic carbon storage in the Tarim River Basin from 2000 to 2020. Agric. Ecosyst. Environ. 2021, 327, 107824. [Google Scholar] [CrossRef]
  19. Dargains, A.; Cabral, P. A GIS-based methodology for sustainable farming planning: Assessment of land use/cover changes and carbon dynamics at farm level. Land Use Policy 2021, 111, 105788. [Google Scholar] [CrossRef]
  20. Tang, L.; Ke, X.; Zhou, Q.; Wang, L.; Koomen, E. Projecting future impacts of cropland reclamation policies on carbon storage. Ecol. Indic. 2020, 119, 106835. [Google Scholar] [CrossRef]
  21. Zhou, J.; Zhao, Y.; Huang, P.; Zhao, X.; Feng, W.; Li, Q.; Xue, D.; Dou, J.; Shi, W.; Wei, W.; et al. Impacts of ecological restoration projects on the ecosystem carbon storage of inland river basin in arid area, China. Ecol. Indic. 2020, 118, 106803. [Google Scholar] [CrossRef]
  22. Doe, B.; Amoako, C.; Adamtey, R. Spatial expansion and patterns of land use/land cover changes around Accra, Ghana—Emerging insights from Awutu Senya East Municipal Area. Land Use Policy 2021, 112, 105796. [Google Scholar] [CrossRef]
  23. Wang, B.; Tian, J.; Wang, S. Process and mechanism of transition in regional land use function guided by policy: A case study from Northeast China. Ecol. Indic. 2022, 144, 109527. [Google Scholar] [CrossRef]
  24. Wang, H.; Lu, S.; Lu, B.; Nie, X. Overt and covert: The relationship between the transfer of land development rights and carbon emissions. Land Use Policy 2021, 108, 105665. [Google Scholar] [CrossRef]
  25. Xu, Q.; Yang, R.; Dong, Y.-X.; Liu, Y.-X.; Qiu, L.-R. The influence of rapid urbanization and land use changes on terrestrial carbon sources/sinks in Guangzhou, China. Ecol. Indic. 2016, 70, 304–316. [Google Scholar] [CrossRef]
  26. Liu, J.; Guo, Q. A spatial panel statistical analysis on cultivated land conversion and chinese economic growth. Ecol. Indic. 2015, 51, 20–24. [Google Scholar] [CrossRef]
  27. Li, D.; Yang, Y.; Du, G.; Huang, S. Understanding the contradiction between rural poverty and rich cultivated land resources: A case study of Heilongjiang Province in Northeast China. Land Use Policy 2021, 108, 105673. [Google Scholar] [CrossRef]
  28. Shen, F.; Yang, L.; Zhang, L.; Guo, M.; Huang, H.; Zhou, C. Quantifying the direct effects of long-term dynamic land use intensity on vegetation change and its interacted effects with economic development and climate change in jiangsu, China. J. Environ. Manag. 2023, 325, 116562. [Google Scholar] [CrossRef]
  29. Xia, F.; Yang, Y.; Zhang, S.; Li, D.; Sun, W.; Xie, Y. Influencing factors of the supply-demand relationships of carbon sequestration and grain provision in China: Does land use matter the most? Sci. Total Environ. 2022, 832, 154979. [Google Scholar] [CrossRef] [PubMed]
  30. Li, B.; Yang, Z.; Cai, Y.; Xie, Y.; Guo, H.; Wang, Y.; Zhang, P.; Li, B.; Jia, Q.; Huang, Y.; et al. Prediction and valuation of ecosystem service based on land use/land cover change: A case study of the Pearl River Delta. Ecol. Eng. 2022, 179, 106612. [Google Scholar] [CrossRef]
  31. Kankam, S.; Osman, A.; Inkoom, J.N.; Fürst, C. Implications of Spatio-Temporal Land Use/Cover Changes for Ecosystem Services Supply in the Coastal Landscapes of Southwestern Ghana, West Africa. Land 2022, 11, 1408. [Google Scholar] [CrossRef]
  32. Chen, S.; Arrouays, D.; Angers, D.A.; Chenu, C.; Barré, P.; Martin, M.P.; Saby, N.P.; Walter, C. National estimation of soil organic carbon storage potential for arable soils: A data-driven approach coupled with carbon-landscape zones. Sci. Total Environ. 2019, 666, 355–367. [Google Scholar] [CrossRef] [PubMed]
  33. Chen, L.-C.; Guan, X.; Li, H.-M.; Wang, Q.-K.; Zhang, W.-D.; Yang, Q.-P.; Wang, S.-L. Spatiotemporal patterns of carbon storage in forest ecosystems in Hunan Province, China. For. Ecol. Manag. 2019, 432, 656–666. [Google Scholar] [CrossRef]
  34. Wang, S.; Xu, L.; Zhuang, Q.; He, N. Investigating the spatio-temporal variability of soil organic carbon stocks in different ecosystems of China. Sci. Total Environ. 2020, 758, 143644. [Google Scholar] [CrossRef]
  35. Pechanec, V.; Purkyt, J.; Benc, A.; Nwaogu, C.; Štěrbová, L.; Cudlín, P. Modelling of the carbon sequestration and its prediction under climate change. Ecol. Inform. 2018, 47, 50–54. [Google Scholar] [CrossRef]
  36. Zhao, H.; Qin, J.; Gao, T.; Zhang, M.; Sun, H.; Zhu, S.; Xu, C.; Ning, T. Immediate and long-term effects of tillage practices with crop residue on soil water and organic carbon storage changes under a wheat-maize cropping system. Soil Tillage Res. 2021, 218, 105309. [Google Scholar] [CrossRef]
  37. Chen, W.; Lei, Y.; Wu, S.; Li, L. Opportunities for low-carbon socioeconomic transition during the revitalization of Northeast China: Insights from Heilongjiang province. Sci. Total Environ. 2019, 683, 380–388. [Google Scholar] [CrossRef]
  38. Zhang, Y.; Zhao, F.; Zhang, J.; Wang, Z. Fluctuation in the transformation of economic development and the coupling mechanism with the environmental quality of resource-based cities—A case study of Northeast China. Resour. Policy 2021, 72, 102128. [Google Scholar] [CrossRef]
  39. Wang, Y.; Deng, L.; Wu, G.; Wang, K.; Shangguan, Z. Estimates of carbon storage in grassland ecosystems on the Loess Plateau. Catena 2018, 164, 23–31. [Google Scholar] [CrossRef]
  40. Zhang, P.-P.; Li, Y.-H.; Yin, H.-R.; Chen, Q.-T.; Dong, Q.-D.; Zhu, L.-Q. Spatio-temporal variation and dynamic simulation of ecosystem carbon storage in the north-south transitional zone of China. J. Nat. Resour. 2022, 37, 1183–1197. [Google Scholar] [CrossRef]
  41. Babbar, D.; Areendran, G.; Sahana, M.; Sarma, K.; Raj, K.; Sivadas, A. Assessment and prediction of carbon sequestration using Markov chain and InVEST model in Sariska Tiger Reserve, India. J. Clean. Prod. 2020, 278, 123333. [Google Scholar] [CrossRef]
  42. Zhuo, Z.; Chen, Q.; Zhang, X.; Chen, S.; Gou, Y.; Sun, Z.; Huang, Y.; Shi, Z. Soil organic carbon storage, distribution, and influencing factors at different depths in the dryland farming regions of Northeast and North China. Catena 2022, 210, 105934. [Google Scholar] [CrossRef]
  43. Wang, S.; Zhou, C.; Liu, J.; Tian, H.; Li, K.; Yang, X. Carbon storage in northeast China as estimated from vegetation and soil inventories. Environ. Pollut. 2001, 116, S157–S165. [Google Scholar] [CrossRef] [PubMed]
  44. Li, K.; Wang, S.; Cao, M. Vegetation and soil carbon storage in China. Sci. China Ser. D Earth Sci. 2004, 47, 49–57. [Google Scholar] [CrossRef]
  45. Alam, S.; Starr, M.; Clark, B. Tree biomass and soil organic carbon densities across the Sudanese woodland savannah: A regional carbon sequestration study. J. Arid. Environ. 2013, 89, 67–76. [Google Scholar] [CrossRef]
  46. Chen, G.; Yang, Y.; Xie, J.; Du, Z.; Zhang, J. The allocation of underground carbon in China’s forests. Acta Ecol. Sin. 2007, 27, 5148–5157. [Google Scholar] [CrossRef]
  47. Zhang, H.; Song, T.; Wang, K.; Yang, H.; Yue, Y.; Zeng, Z.; Peng, W.; Zeng, F. Influences of stand characteristics and environmental factors on forest biomass and root–shoot allocation in southwest China. Ecol. Eng. 2016, 91, 7–15. [Google Scholar] [CrossRef]
  48. Zhang, M.; Kafy, A.-A.; Ren, B.; Zhang, Y.; Tan, S.; Li, J. Application of the Optimal Parameter Geographic Detector Model in the Identification of Influencing Factors of Ecological Quality in Guangzhou, China. Land 2022, 11, 1303. [Google Scholar] [CrossRef]
  49. Zhu, X.-J.; Qu, F.-Y.; Fan, R.-X.; Chen, Z.; Wang, Q.-F.; Yu, G.-R. Effects of ecosystem types on the spatial variations in annual gross primary productivity over terrestrial ecosystems of China. Sci. Total Environ. 2022, 833, 155242. [Google Scholar] [CrossRef]
  50. Lyu, H.; Watanabe, T.; Kilasara, M.; Hartono, A.; Funakawa, S. Soil organic carbon pools controlled by climate and geochemistry in tropical volcanic regions. Sci. Total Environ. 2020, 761, 143277. [Google Scholar] [CrossRef]
  51. Jian, J.; Bahn, M.; Wang, C.; Bailey, V.L.; Bond-Lamberty, B. Prediction of annual soil respiration from its flux at mean annual temperature. Agric. For. Meteorol. 2020, 287, 107961. [Google Scholar] [CrossRef]
  52. Li, K.; Cao, J.; Adamowski, J.F.; Biswas, A.; Zhou, J.; Liu, Y.; Zhang, Y.; Liu, C.; Dong, X.; Qin, Y. Assessing the effects of ecological engineering on spatiotemporal dynamics of carbon storage from 2000 to 2016 in the Loess Plateau area using the InVEST model: A case study in Huining County, China. Environ. Dev. 2021, 39, 100641. [Google Scholar] [CrossRef]
  53. Chang, X.; Xing, Y.; Wang, J.; Yang, H.; Gong, W. Effects of land use and cover change (LUCC) on terrestrial carbon stocks in China between 2000 and 2018. Resour. Conserv. Recycl. 2022, 182, 106333. [Google Scholar] [CrossRef]
  54. Zong, S.; Hu, Y.; Zhang, Y.; Wang, W. Identification of land use conflicts in China’s coastal zones: From the perspective of ecological security. Ocean Coast. Manag. 2021, 213, 105841. [Google Scholar] [CrossRef]
  55. Zhu, L.; Song, R.; Sun, S.; Li, Y.; Hu, K. Land use/land cover change and its impact on ecosystem carbon storage in coastal areas of China from 1980 to 2050. Ecol. Indic. 2022, 142, 109178. [Google Scholar] [CrossRef]
  56. Feng, Y.; Chen, S.; Tong, X.; Lei, Z.; Gao, C.; Wang, J. Modeling changes in China’s 2000–2030 carbon stock caused by land use change. J. Clean. Prod. 2019, 252, 119659. [Google Scholar] [CrossRef]
  57. Wang, C.; Zhen, L.; Dui, B.Z.; Sun, C.Z. Assessment of the impact of grain for green project on farmers’ livelihood in the Loess plateau. Chin. J. Eco-Agric. 2014, 22, 850–858. [Google Scholar] [CrossRef]
Figure 1. Other land-use types converted to cultivated land.
Sustainability 15 03897 g001
Figure 2. Cultivated land conversion to other land-use types.
Sustainability 15 03897 g002
Figure 3. Schematics showing (a) changes in carbon storage in CLUT from 1990 to 2000, (b) changes in carbon storage in CLUT from 2000 to 2010, (c) changes in carbon storage in CLUT from 2010 to 2020, (d) changes in carbon storage in CLUT from 1990 to 2020. Dotted lines represent a decrease in carbon stocks, while solid lines represent an increase (10,000 tons).
Sustainability 15 03897 g003
Figure 4. Contribution rate of carbon storage in CLUT.
Sustainability 15 03897 g004
Figure 5. Carbon storage center of gravity shift trajectory.
Sustainability 15 03897 g005
Figure 6. Distribution of nuclear density of carbon storage in the study area (a) 1990−2000; (b) 2000–2010; (c) 2010–2020.
Sustainability 15 03897 g006
Figure 7. Action intensity of influencing factors from 2010 to 2020.
Sustainability 15 03897 g007
Table 1. Carbon density by land-use type in the study area (kg/m2).
Land-Use Type C a b o v e C b e l o w C s o i l C t o t a l
Cultivated land3.8714.9020.6639.43
Forest12.2721.9030.0264.19
Grassland2.9310.5822.0335.54
Construction land2.522.758.4313.70
Water8.9014.6428.3051.84
Unused land0.910.0014.6615.57
Table 2. Standard deviation elliptical statistics of carbon storage from 1990 to 2020.
PeriodsCenter of GravityStandard Deviation of X axis/kmStandard Deviation of Y axis/kmOblateness/kmShape IndexSpindle Angle/°CElliptical Area/km2
1990–2000126°49′58″ E28.9173.260.610.39136.786650.35
45°38′46″ N
2000–2010126°56′29″ E28.0652.380.460.54157.064615.12
45°47′31″ N
2010–2020126°48′54″ E28.1060.930.540.46141.15376.10
45°54′13″ N
Table 3. Interaction of influencing factors in 2010–2020.
X1X2X3X4X5X6X7X8X9X10X11X12X13
X10.0050
X20.008 +0.0039
X30.0074 +0.0064 +0.0028
X40.0893 *0.0844 *0.0827 *0.0774
X50.0316 *0.0289 *0.0283 *0.0848 +0.0232
X60.0527 *0.0522 *0.0526 *0.111 +0.0734 *0.0464
X70.0312 +0.0314 *0.031 *0.0991 +0.0506 +0.0617 +0.0272
X80.0164 *0.0165 *0.0162 *0.0988 *0.0331 *0.0665 *0.0359 +0.0087
X90.0456 *0.0401 +0.0392 +0.0977 +0.065 *0.0713 +0.0565 +0.0523 *0.0367
X100.0438 *0.0364 +0.0348 +0.093 +0.063 *0.065 +0.0502 +0.0445 *0.0411 +0.0322
X110.0394 *0.0339 *0.033 *0.0893 +0.0596 *0.086 *0.0507 +0.0431 *0.0666 *0.058 +0.0286
X120.0498 *0.0477 *0.0459 *0.0883 +0.0569 +0.0901 *0.0698 *0.0584 *0.0813 *0.0739 +0.0632 +0.0415
X130.0815 *0.0743 *0.0764 *0.1164 +0.0808 +0.1163 *0.0803 +0.0781 *0.0961 +0.0892 +0.084 +0.0853 +0.0648
Note: * means that the interaction between two factors is a nonlinear enhancement; + means double-factor enhancement.
Disclaimer/Publisher’s Note: The statements, opinions and data contained in all publications are solely those of the individual author(s) and contributor(s) and not of MDPI and/or the editor(s). MDPI and/or the editor(s) disclaim responsibility for any injury to people or property resulting from any ideas, methods, instructions or products referred to in the content.

