Article

Measuring Residential Satisfaction in Historic Areas Using Actual–Aspiration Gap Theory: The Case of Famagusta, Northern Cyprus

1
Faculty of Design, Department of Architecture, Arkin University of Creative Arts, Kyrenia 99300, North Cyprus
2
Faculty of Architecture, Eastern Mediterranean University, via Mersin 10, Famagusta 99450, Turkey
*
Author to whom correspondence should be addressed.
Sustainability 2023, 15(5), 3917; https://doi.org/10.3390/su15053917
Submission received: 10 January 2023 / Revised: 10 February 2023 / Accepted: 16 February 2023 / Published: 21 February 2023

Abstract

:
Although historical areas have significant unique architectural, historical and cultural values, and urban patterns, the physically degraded/damaged and deteriorated urban fabric of historical environments does not completely fulfill the contemporary needs of residents, which leads to low levels of resident satisfaction. As a result, this study examines the factors affecting residential satisfaction in a historic area to enhance satisfaction. Toward this objective, the present study selects the historical area of Famagusta, North Cyprus, and conducts a comprehensive survey among 129 households. Furthermore, the present study assesses residential satisfaction by incorporating socio-demographic, household environment, local historic housing renovation rules, and sense-of-place factors as well as applying the logit regression approach to find reliable results. Moreover, this study performs bootstrap Least Absolute Shrinkage and Selection Operator (LASSO) logistic regression to rank the importance of variables instead of relying on the size of estimated coefficients. To the best of our knowledge, this is among the first studies to conduct this nexus and the results could significantly contribute to the literature. Remarkably, the results reveal that the residential environment, local historical housing renovation rules, and sense of place have significant and positive effects on residential satisfaction, implying that these factors have a significant role in raising residents’ satisfaction levels.

1. Introduction

There has been increasing interest in residential satisfaction (RS) among scholars in recent years, with this concept being a focus of housing research and urban studies [1,2]. It is often used to evaluate residents’ perceptions of whether their housing and environmental needs, expectations, and desires are being met. For example, Campbell [3] defined RS as the perception of the gap between residential expectation and reality, while Morris and Winter [4] argued that it depends on the compatibility between real housing satisfaction and housing norms. Galster [5] suggested that residential conditions among households are influenced by individuals’ needs and desires, and Amérigo and Aragonés [6] emphasized the role of physical and social characteristics in measuring RS in housing and neighborhood studies. On the other hand, Hunt [7] argued that satisfaction is not an emotion, but rather an assessment of emotion. Ibem and Amole [8] also reported that RS is often used to evaluate residents’ perceptions of whether their needs, expectations, and aspirations are being met by their housing units and the surrounding environment.
Consequently, a great deal of research has been conducted on residential satisfaction (RS) in the past few years, with many scholars focusing on three main theories: “housing needs,” “housing deficit,” and “psychological construct” [1,9,10,11,12,13]. These theories have been explored both theoretically and empirically. Empirical studies have found that factors, such as socio-economic characteristics, housing features, neighborhood environment, social environment, and housing support services, are significant predictors of RS [9,14,15,16]. In addition, more recent research has shown that the sense of place and the actions of local authorities, such as housing policymakers and urban planners, can also impact RS [17,18,19]. There is a considerable body of literature on the determinants of RS in various countries and contexts, such as private housing [20], neighborhood [21,22,23], public housing [19,24,25,26], and mass housing [27], but limited attention has been paid to investigating RS in historic environments, particularly in emerging countries. This study aims to fill this gap by examining the factors that influence RS in a historic area.
The historic environment is characterized by the intersection of intangible elements, such as memories, with tangible elements, such as buildings, and represents the tangible evidence of past human activity and cultural heritage. However, the physical degradation or deterioration of the urban fabric in these environments can have a negative impact on residential satisfaction (RS). This is particularly true in the case of historical residential areas, which may have unique and distinctive cultural characteristics that could otherwise contribute to higher levels of satisfaction among residents. Old buildings in historic environments may also have poor structural conditions and outdated living environments, which can further decrease RS. Vehbi and Hoskara [28] argued that historical areas have suffered from significant decay in physical, social, and economic terms due to declining economic activity, leading to lower levels of RS, reduced ownership and rental rates, and, ultimately, mobility of residents. It is also important to note that the aspired residential environment of residents in historic areas may differ from that of other groups, and the effects of various factors on RS may be different for this particular group of residents living in historical environments.
This study aims to investigate the factors that impact residential satisfaction (RS) in the historic environment of the Walled City of Famagusta in North Cyprus, an area that has received little attention from researchers to date. The unique characteristics of this historic environment and the lack of empirical research in this area are the primary motivations for conducting this study. To the best of the authors’ knowledge, this study is among the first to specifically examine the predictors of RS in the Walled City of Famagusta. While Davoodi and Dağlı [29] identified important factors related to the sustainability of the Walled City through a “Marginal improvement priority” approach, they did not measure the gap between actual reality and aspirations through the level of satisfaction of residents, which this study intends to do. The Walled City of Famagusta has distinctive characteristics, including its organic urban pattern with narrow streets and low-rise dwellings that were developed over various historical periods and still show evidence of its history [30]. In the past two decades, the municipality and the United Nations Development Project (UNDP) have worked to revitalize the Walled City in an effort to protect its cultural heritage, prevent deterioration, and sustain its livability and economy.
To create an empirical satisfaction model for the historical area of the Walled City, this study applies the actual–aspiration gap theory, as proposed by Galster [5], and follows prior empirical studies using “the residential environment,” “local historical housing renovation rules,” and “sense of place” (SOP) as the four pillars of residential satisfaction (RS). Additionally, “the neighborhood facilities,” “the environmental features,” “the social environment,” “the housing conditions,” “the housing features,” and “the housing support services” are used as sub-pillars to measure the “residential environment” pillar. Similarly, “the place,” “the place attachment,” and “the place dependence” sub-pillars are employed to measure the SOP pillar. The selection of these pillars is based on the specific and unique characteristics of historical areas, which distinguish historical environments from other residential areas, with the following objectives in mind:
  • How do the residential environment, local historical housing renovation rules, and SOP pillars impact RS?
  • How do the sub-pillars of the residential environment and SOP pillars impact RS?
  • How do the components of the residential environment, local historical housing renovation rules, and SOP pillars impact RS?
The present study aims to shed light on how the various aspects of the pillars impact RS in the historical area of the Walled City through the use of an empirical satisfaction model.
The authors believe that this study can contribute to the existing research on the topic in several ways. First, the present study examines the factors of residential satisfaction (RS) in a historic environment, which is an area that has been understudied in the literature. Second, this study comprehensively examines the predictors of RS, including those that have not been used in recent RS estimation models, such as socio-demographic, residential environment, local historical housing renovation rules, and sense of place (SOP). Third, this study uses the appropriate methodology of logit models because the estimated results via multiple linear regression (OLS technique) in the presence of a binary dependent variable are not robust [31]. Lastly, the distinctive contribution of this study is that it employs a bootstrap LASSO logistic regression to rank the importance of determinants, rather than using the magnitude of coefficients [32,33]. The findings of this study also provide some insights into the RS literature for further studies in other historical areas and the outcomes may also be useful for housing policy decision makers, urban planners, and municipalities as they work to better understand the needs and expectations of residents in historic environments and help to reconcile any discrepancies between these needs and expectations. Furthermore, it can be considered a crucial step in the process of sustainable development. Reinforcing the positive elements and eliminating the negative elements of RS play significant roles in enhancing the sustainability of the Walled City.
The remainder of the article is organized as follows: In Section 2, a review of the related literature is provided. The conceptualization of the study is presented in Section 3 with hypotheses. Section 4 describes the models and methodology for the study, along with a description of the study area, and the results are presented in Section 5, followed by the discussion and conclusion in Section 6 and Section 7. Additionally, Figure 1 illustrates the research process of this study.

2. Literature Review

Residential satisfaction (RS) has been widely debated by scholars and researchers in the fields of sociology, planning, urban studies, geography, and psychology [34,35,36,37,38]. In a seminal study, Galster [5] highlighted that most studies of RS are based on two opposing empirical approaches: the “purposive” approach and the “actual-aspiration gap” approach. The purposive approach views RS as a measure of the extent to which a residential environment helps residents achieve their goals [5,34,39,40]. In this approach, researchers have mainly focused on goals or activities related to the attributes of the physical environment. However, in the actual–aspiration gap approach, RS is viewed as an indicator of the gap between what residents want and aspire to have and what they currently have in terms of their housing conditions [5]. Some authors, such as Ibem and Abole [8] and Chaudhury and Rowles [41], also noted that RS is a measure of residents’ perception of the adequacy of their residential environment in meeting their needs, expectations, and aspirations. In the literature, studies have used both objective and subjective measurements to assess RS [35,42]. Furthermore, Amole [43] pointed out that objective attributes of the residential environment, when evaluated by residents, become subjective. Objective measurement of RS involves the actual physical characteristics, facilities, services, and environment, while subjective measurement is linked to the psychological aspect of humans and measures perception, emotions, attitudes, and aspirations [5,44].
Multiple studies have explored the relationship between RS and residential mobility. Speare [45] argued that satisfaction plays a mediating role between individual and residential variables and residential mobility. In the literature, studies suggest that RS with regard to the house and neighborhood can impact mobility behaviors and a higher actual–aspiration gap between residents’ needs and expectations may lead to relocating and mobility of residents. For example, Diaz-Serrano and Stoyanova [46] found that RS has a strong mediating effect on mobility propensity. Other studies [47,48,49] found that RS is an important factor that affects residents’ intention to move. Findings of many studies highlighted that dissatisfaction with social problems impact the mobility of residents, as well as residential satisfaction [50]. Similarly, Jia and Lei [51] found that RS affects the intentions to move among both locals and migrants. However, Zhang and Lu [52] found that lower RS does not necessarily lead to high residential mobility.
Additionally, a portion of the literature has examined the significant determinants of RS empirically. For instance, Savasdisara et al. [53] found that residents are generally more satisfied with their dwelling units than with environmental facilities. Fang [54] found that unit size has a positive effect on RS. In contrast, Kaitilla [55] and Nurizan [56] found that residents are dissatisfied with the size of houses. On the other hand, Husna and Nurijan [57] found that residents are dissatisfied with dwelling unit characteristics, while Ha [58] found the opposite. Oh [59] and Jiboye [60] found that residents were dissatisfied with public facilities and management policies, respectively. In recent studies, researchers have found the impact of different determinants of RS in different countries. For example, Addo [61] found that dwelling characteristics have a negative influence on the RS of respondents in Ghana. Cao and Wang [62] suggested that improving parks and open spaces, neighborhood safety, and neighborhood appearance is important for enhancing RS of existing residents in Twin Cities. Gan and Zuo [63] found that factors in the domains of dwelling features, dwelling facilities, and housing policies had a positive contribution to residential satisfaction, while factors in the domains of public facilities and neighborhood environment had a negative contribution in Chongqing.
Furthermore, Appendix A, Table A1, presents a summary of empirical studies on residential satisfaction (RS). As shown in Table A1 and explained here, RS has been extensively studied in the context of public housing [19,25,64], urban housing [17], planned communities [18], private low-cost housing [20], and double-story terraces [9]. These studies have generally examined RS in terms of various dimensions, such as socio-demographic factors and residential environment (including neighborhood facilities, housing features, environmental features, rules, and sense of place), and have been conducted in a variety of countries, including Nigeria [40,64], Malaysia [20,44], Turkey [17,65,66], Italy [67], Australia [18], and Iran [19,25].
According to the studies summarized, housing characteristics and neighborhood environments have consistently been found to be significant factors in determining residential satisfaction (RS) [8,15,68,69]. Additionally, research has shown that neighborhood facilities [9,20,44], socio-economic and demographic profiles [69], local authorities [17], social environment [17,44], accessibility [65], residence comparison and public housing allocation schemes [15], and housing services [20,40] all impact RS. Some studies have also found that sense of place can affect RS [18,19].
Several studies have focused specifically on examining the determinants of residential satisfaction (RS) in old buildings and historical areas. Phillips et al. [70] found that ventilation and sunshine are important factors impacting RS for older dwellings in Hong Kong. Furthermore, Erdogan et al. [17] found that social and environmental living conditions have a positive effect on overall housing satisfaction in historic neighborhoods in Edirne, Turkey. Temelová and Dvořáková, [71] showed that elderly residents are moderately satisfied with their residential environment in the historic core of Prague city center. Zhang and Lu [52] found that, despite lower dwelling conditions, residents in traditional neighborhoods were generally more satisfied with their physical environment compared to residents in redeveloped neighborhoods. Li and Song [72] found opposite results.
While there is a large body of literature on RS, there are relatively few studies that have specifically focused on examining RS in historical areas. This study aims to contribute to this body of research by investigating the determinants of RS in the historical area of the Walled City of Famagusta, North Cyprus. In developing the conceptual framework for this study, the following dimensions were identified.

3. Conceptualization

3.1. Determinants of RS

After a thorough review, this study chooses and presents the factors of RS that are used in this study, and these are listed in Table 1. In line with the previous studies listed in Table A1, this study selected the pillars of RS as socio-demographic characteristics, residential environment, and SOP. Given the specific characteristics of the historic environment, this study also included the local historical housing renovation rules pillar. As shown in Table 1, the residential environment pillar is divided into the sub-pillars of neighborhood facilities, environmental features, social environment, housing conditions, housing features, and housing support services. Additionally, SOP is broken down into the sub-pillars of place identity (hereafter referred to as PI), place attachment (hereafter referred to as PA), and place dependence (hereafter referred to as PD). Table 1 also lists the specific components of each pillar and sub-pillar that are used in this study.

3.1.1. Socio-Demographic Characteristics

Demographic and socio-economic characteristics have been shown to significantly impact RS [73]. In a seminal study, Adriaanse [69] found that characteristics of households, such as age, marital status, gender, race, and household size, influence the level of RS. Similarly, Newman et. al [74] and Lu [75] found that factors, such as age, home ownership, income, and duration of residence, impacted RS. Numerous studies have also shown that factors, such as gender, income [20,76], age [8,77], marital status and education level [20,78], and length of stay [79], impact RS. According to the literature review, socio-demographic determinants, such as age, reflects the way people view their roles in society; gender significantly affects an individual’s way of thinking; marital status creates many shared opportunities and obligations; individuals with different income levels may display different residential satisfaction on similar accommodation environments; higher income might provide greater security, more freedom, and financial advantage; length of stay affects resident preferences to stay in the community and, therefore, their responses to the surveys. In this study, the effect of socio-demographic characteristics is measured using variables, such as gender, age, monthly income, home ownership, length of residency, ethnicity, household size, marital status, education, employment sector, and number of bedrooms. Based on the reviewed literature, it is expected that socio-demographic characteristics will impact RS.
H1: 
There is a positive or negative significant relationship between socio-demographic characteristics and RS.

3.1.2. Residential Environment

RS can be explained through factors such as the physical and social environment surrounding the home, including neighbors, the neighborhood, the quality of housing, and green areas [5]. RS is a dynamic process of interaction between residents and the social and physical factors of the environment [5]. Many studies have attempted to measure the degree of satisfaction with the residential environment among residents [20,44]. Canter and Rees [34] found that the three components of the residential environment—the house, neighbors, and neighborhood—explain RS. Other studies have also argued that the concept of home extends beyond the walls of the house and encompasses elements, such as noise and traffic density [80], the physical appearance of the neighborhood [81], relations with neighbors [82], and green areas or parks [83], when considering RS.
There is a significant body of research that has examined the relationship between residential environment and residential satisfaction. For example, studies have found that poor housing conditions [64] and a lack of neighborhood facilities [20] can lead to dissatisfaction among residents. On the other hand, a well-maintained residential environment [65] and good housing features [44] can contribute to satisfaction. Additionally, factors such as the social environment [84] can impact residents’ satisfaction with their living situation. Based on this literature, this study investigates the impact of several sub-factors of the residential environment on residential satisfaction, including neighborhood facilities, environmental features, social environment, housing conditions, housing features, and housing support services.
  • Neighborhood facilities [9];
  • Environmental features of housing [65];
  • Social environment [44];
  • Housing conditions [64];
  • Housing features [40];
  • Housing support services [2].
This study also measures the impact of each sub-pillar of the residential environment on RS by selecting several components, as shown in Table 1. According to the literature review, it is expected that the residential environment will have an impact on RS.
H2: 
There is a positive or negative significant relationship between residential environment and RS.

3.1.3. Local Historical Housing Renovation Rules

A number of studies suggested that residential satisfaction (RS) can be understood from cognitive, affective, and conative perspectives [42]. In particular, Francescato [42] noted that management policies, rules, and practices, in addition to the physical environment and housing complex, can impact satisfaction. Erdogan et al. [17] also found that local authorities, such as housing policy makers and urban planners, can significantly impact housing satisfaction through the implementation of effective regulations and strategies. Mohit et al. [44] similarly argued that local authorities have a significant role to play in improving RS through the determination and implementation of suitable management policies. Based on the literature, this study expects that local historical housing renovation rules will have an impact on RS. In a historic urban quarter of the Walled City, specific local historical housing renovation rules have been implemented in order to preserve the characteristics of historical houses and environments. These rules may restrict the flexibility of local residents in terms of housing renovations, leading to either satisfaction or dissatisfaction. To examine the effect of local historical housing renovation rules on RS, this study collected information on existing housing renovation rules of the Walled City from the department of Antiquities law in the Turkish Republic of North Cyprus (TRNC). As shown in Table 2, local historical housing renovation rules include components, such as the height of houses, percentage of land used for construction, proportions (height and width) of openings, types of façade materials, and the renovation approval process.
H3: 
There is a positive or negative significant relationship between local historical housing and RS within the walled city.

3.1.4. Sense of Place (SOP)

Definition of SOP

Norberg-Schulz [85] introduced us to a phenomenological understanding (how people receive sensory materials about the physical world and consciously process this material to find meaning) of place and the Roman Concept of Genuis-Loci, or the guardian spirit of the place. According to Norberg-Schulz [85], the concept of place is examined through our ability to connect with the physical character of a geographic setting, thereby bestowing the place with identity and meaning and states that “the spaces where life occurs are places”. Many researchers after Norberg-Schulz also explored the concept of place and proposed various definitions, which do not change much in their meanings. Canter [86] defined place as an environmental experience, and later added that people’s awareness of these experiences influences their behavior. Other researchers, such as Jorgensen and Stedman [87], Shamai and Ilatoy [88], and Tonts and Atherley [89], argued that people’s feelings toward a place or the people in a particular place are the main factors in sense of place (SOP). In their research, Jorgensen and Stedman [87] identified three constructs of SOP: place identity (PI), place attachment (PA), and place dependence (PD). PI refers to the cognitive relationship that individuals have with the physical environment and individuals experience in their daily interaction with the urban area surrounding them [90]. As mentioned in Zurchi and Nafa [85], cultural heritage tangible elements of PI can be identified as the physical form and functionality of the place, whereas intangible elements refer to the socio-cultural factors (i.e., activities that occur in the historical places with regards to the traditions), which this study emphasizes. Furthermore, as Proshansky stated [91], PI develops through a pattern of tendencies, including beliefs, preferences, ideals, emotions, personal objectives, and behaviours. PA, on the other hand, refers to the affective association that people have with their environment, which goes beyond cognition or judgment and also emotionally connects individuals to the past [92,93,94]. PD, however, is a conative link between individuals and specific spatial settings, reflecting how well a place serves an individual’s needs compared to other possible places. In summary, place identity (PI), place attachment (PA), and place dependence (PD) are important components of sense of place (SOP). PI is a cognitive relationship that individuals have with their physical environment, characterized by beliefs, preferences, ideals, emotions, and behaviors. PA is an affective association with the environment, encompassing emotional responses and behavioral commitments to a place. Many researchers have argued that PI, PD, and PA overlap and may be seen as sub-dimensions of PA. If the reaction is positive, it can lead to attachment to that place. Similarly, Kyle et al., [95] identified both physical and social environments as causes of emotional responses to a specific place. Lastly, PD is determined by the link between humans and specific spatial settings [96]. The PD construct is influenced by people’s needs or personal objectives. Jorgensen and Stedman [87] and Williams et al. [93] stated that PD is an indication of how well a specific spatial setting meets individuals’ needs compared to other accessible and potential places.
In summary, place identity (PI), place attachment (PA), and place dependence (PD) are important components of sense of place (SOP). PI is a cognitive relationship that individuals have with their physical environment, characterized by beliefs, preferences, ideals, emotions, and behaviors. PA is an affective association with the environment, encompassing emotional responses and behavioral commitments to a place. PD is a conative link (i.e., behavioral intentions) between individuals and specific spatial settings, reflecting how well a place serves an individual’s needs compared to other possible places.

Linkage between SOP and RS

Based on the literature review, this study expects that SOP (consisting of PI, PA, and PD) has a significant impact on RS. In order to measure the effect of SOP on RS, this study will use the components of SOP, as shown in Table 2. These components include place identity, place attachment, and place dependence, which are sub-dimensions of SOP. The specific components of each sub-dimension will be used to measure the effect of SOP on RS in the historic urban quarter of the Walled City.
In previous research [19,87,97], it has been shown that using a multi-dimensional approach to measure sense of place (SOP) is effective. This approach allows researchers to better understand the complexity of SOP and its cognitive, conative, and affective aspects. Studies have also shown that a multi-dimensional framework leads to more reliable results and is the best fit for the data [87]. In this approach, each component of SOP is treated as a separate construct. This approach is useful for capturing the cognitive (PI), affective (PA), and conative (PD) dimensions of people’s relationships with their environment [87]. Based on the research of [87], a 12-item scale was selected to examine the impact of PI, PA, and PD on residential satisfaction (RS).
This study hypothesizes that SOP impacts residential satisfaction (RS). This hypothesis is supported by the historical context of the Walled City, which is being preserved as cultural heritage through the UNDP-PFF (see Section 4). Previous research [98,99,100,101,102] has indicated that the protection of cultural heritage can affect residents’ SOP. For instance, Smith [98] argued that heritage both reflects the past and shapes current experiences, influencing how people perceive their environment. This, in return, can result in a sense of identity and belonging for certain individuals or groups. Similarly, Davis et al. [100] found that some communities establish their identity through cultural heritage in order to enhance people’s associated SOP. When examining the relationship between historic places and locals’ SOP, Davis et al. [99] discovered that adult residents had stronger SOP when living in areas with more historic environments. These environments were found to have significant and positive relationships with locals’ SOP [99]. Schofield and Szymanski [102] also demonstrated this relationship between cultural heritage and SOP. Additionally, Hawke’s research [101] indicated that self-esteem, distinctiveness, and continuity are reinforced by cultural heritage, and these elements together inspire the formation of place identity (PI) [103].
H4: 
There is a correlation between SOP and RS.

3.2. A Conceptual Framework of RS

Residential satisfaction (RS) is often measured by the gap between residents’ actual experiences and their aspirations or expectations. Previous research has demonstrated the impact of socio-demographic characteristics and residential environment on RS [2,40,44]. However, the impact of local historical rules and sense of place on RS has received relatively little attention in the literature. Only a few studies have examined the effect of local authorities [17] and sense of place [17,19] on RS. It is important to consider these factors in the context of historical environments, as specific renovation rules can help to preserve the characteristics of historical houses/buildings and environments [29]. Therefore, the conceptual framework for this study, shown in Figure 2, includes local historical renovation rules and sense of place, in addition to socio-demographic characteristics and residential environment.

4. Model and Methodology

4.1. Study Area

Cyprus is the third largest island in the Mediterranean Sea, located 60 km south of Turkey, 322 km from Greece, and 96 km west of the Syrian coast [104]. The Walled City of Famagusta is a historic residential district situated on the eastern coast of the island. It is encircled by fortifications, consisting of Venetian-era masonry walls that have been well preserved over the years. This area is an important cultural and historical site, with a rich history dating back to medieval times (Figure 3). The Walled City of Famagusta developed throughout various historical periods (Lusignan, Venetian, Ottoman) and, during each period, it was characterized by significant development. These diverse historical backgrounds enabled the Walled City to acquire some distinctive characteristics in housing form and urban pattern. Figure 4 illustrates the locations and periods of construction of some important historic monuments (cultural heritage) of the Walled City in specific detail. Over the last two decades, there have been efforts to protect these historical houses and preserve the cultural heritage of the Walled City. For instance, local historical housing renovation rules were established by the department of Antiquities law in the Turkish Republic of North Cyprus (TRNC). These local rules aim to renovate historical houses while preserving their traditional characteristics. Figure 5 shows samples of some historical houses by comparing images before and after renovation. The rules consist of height limitations for buildings (Figure 5a), limits on the application of façade material (Figure 5b), and proportions of openings (Figure 5c).

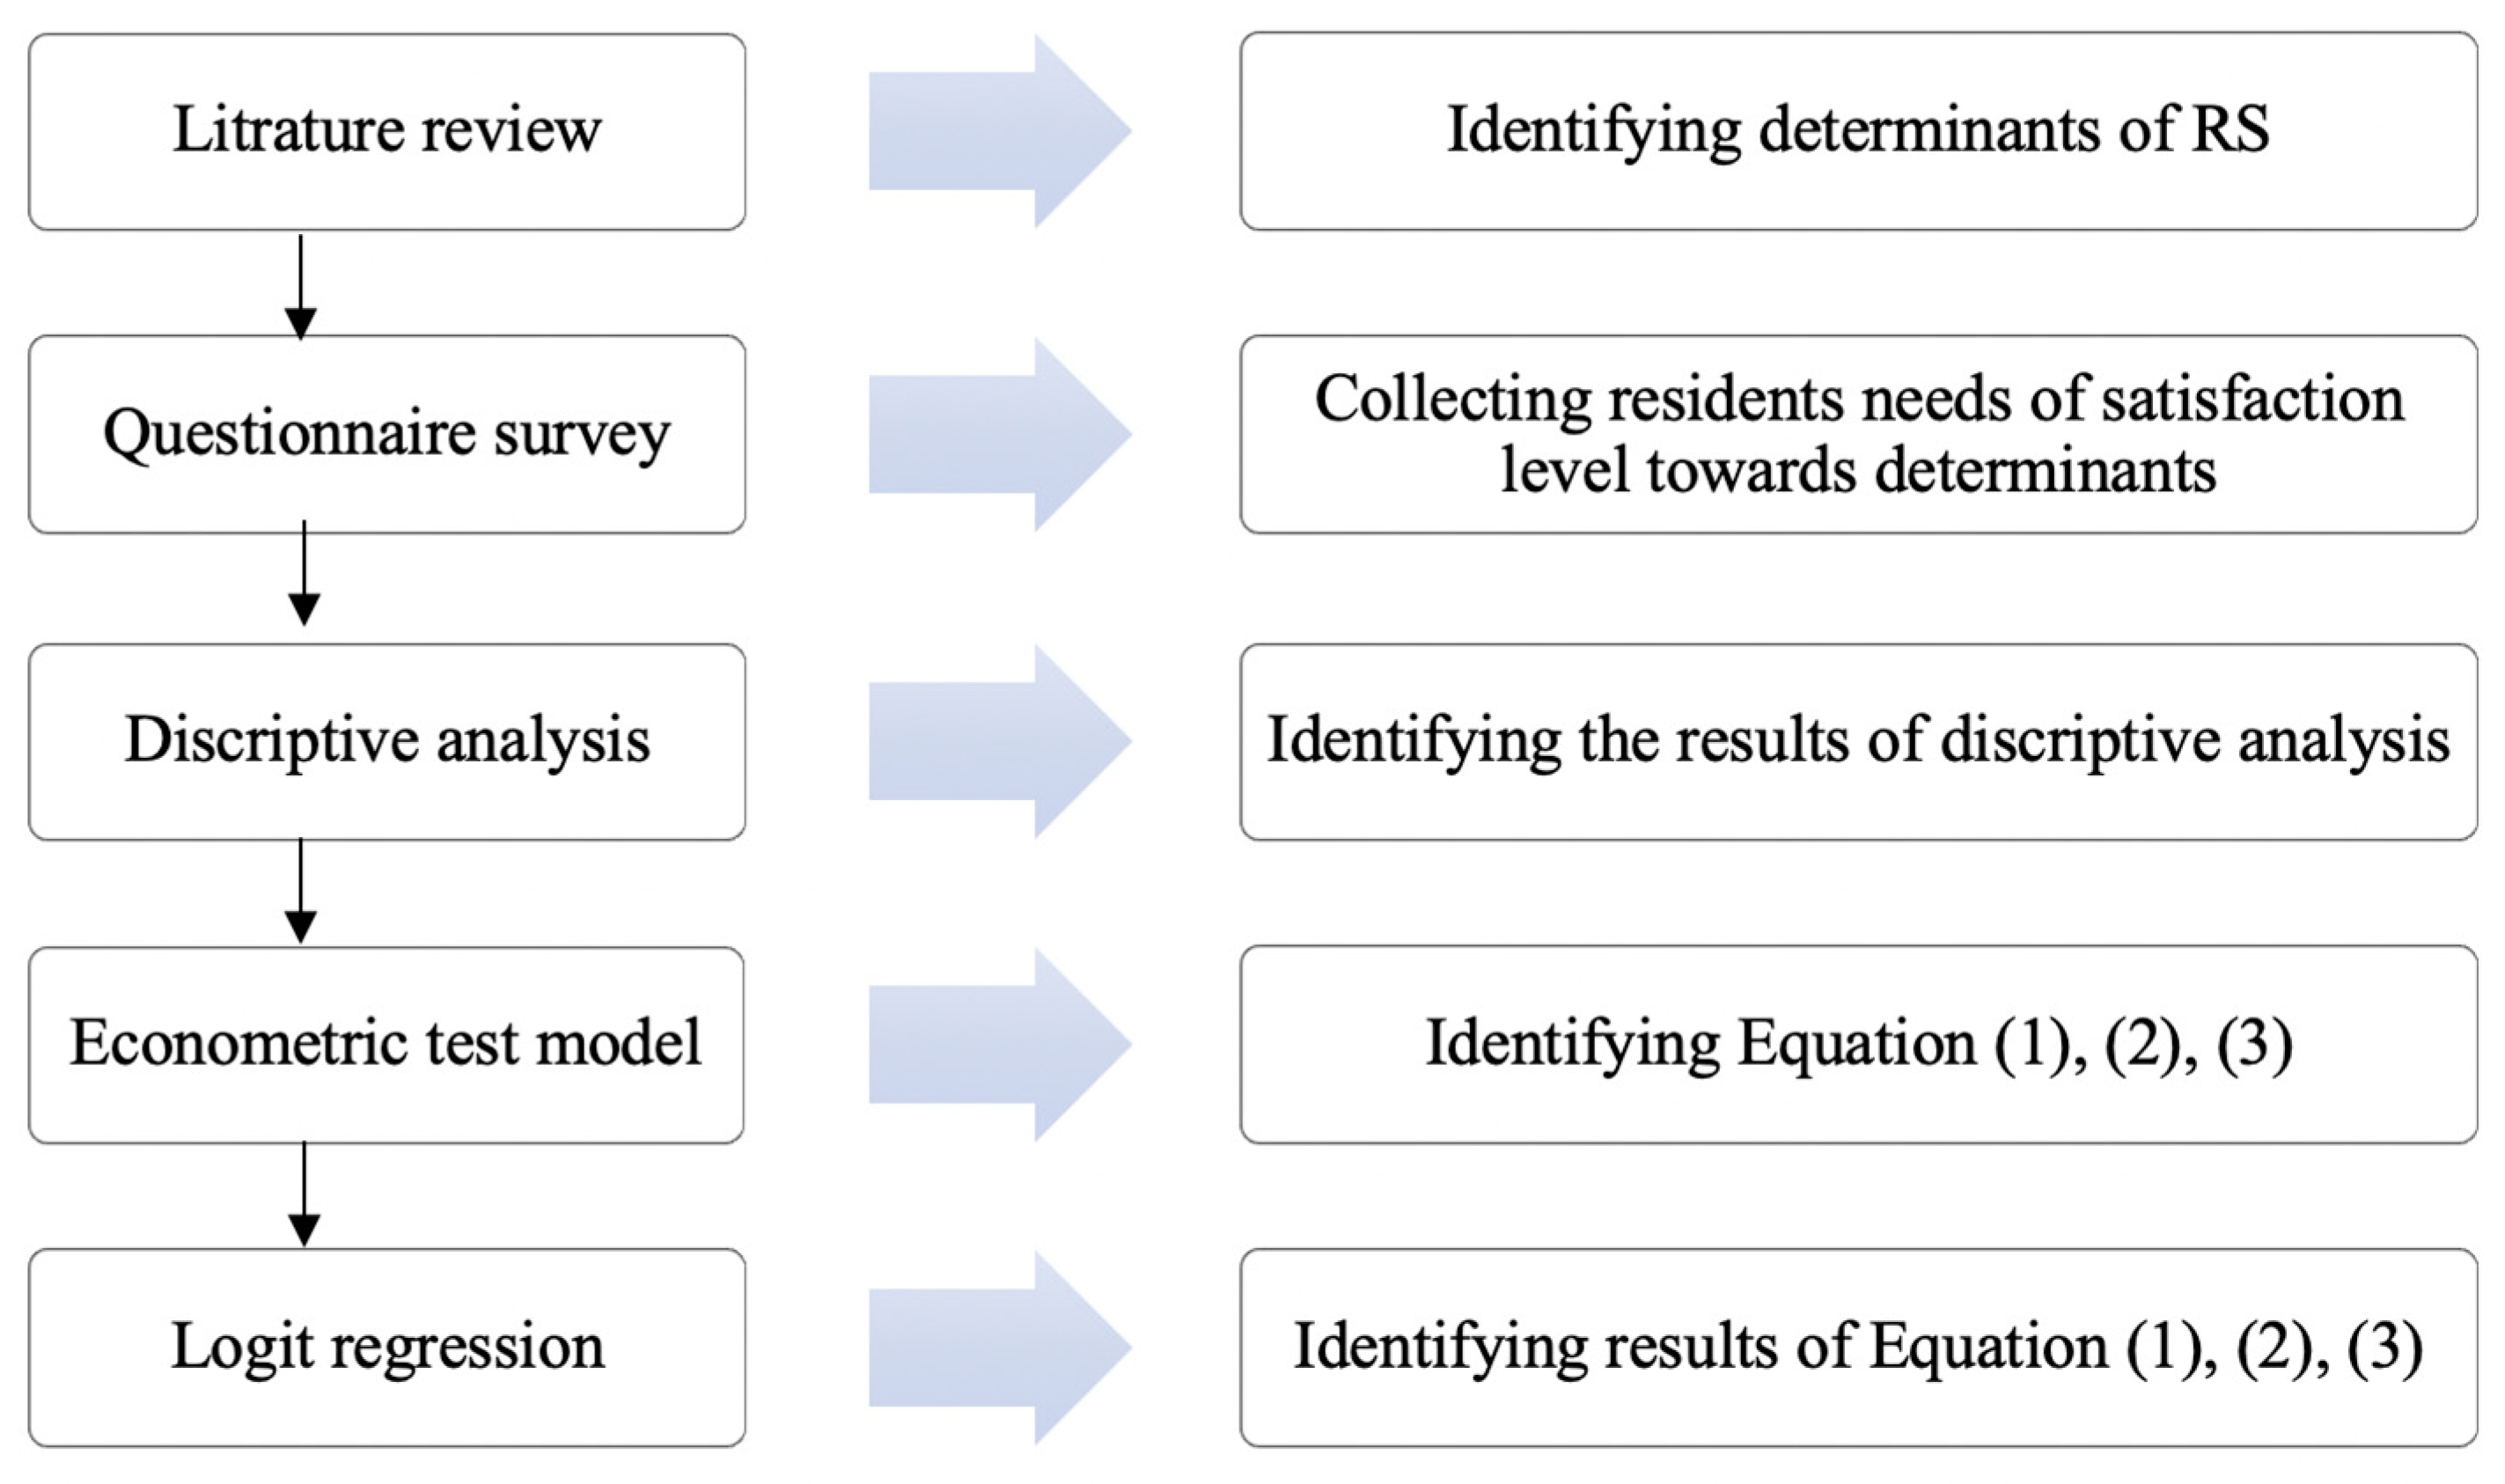
4.2. Data Collection and Methodology

To select the pilot participants, this study uses the convenience sampling technique. Administering a survey in convenience sampling is aimed at willing, geographical proximity and accessible participants, and it is best used for testing as part of hypothesis generation, gaining a sense of opinions or even as an initial pilot before further research [106]. This technique is suitable where adequate information on population size is lacking. Therefore, findings drawn may not be generalizable; however, using more respondents, the findings can be representative [106]. The data for this study were collected through the distribution of questionnaires to the residents of the Walled City. A sample of 129 households, living in different historical buildings, was determined based on the total population of the Walled City and a 95% confidence level. The total number of habitable historical houses is estimated to be 200 [107]. Participants were randomly selected through either personal visits to explain the aim of the questionnaire or by scheduling individual appointments for those who were unavailable. The survey was conducted in the evenings during the summer months of August and September 2018. The questionnaire was initially written in Turkish as it is the primary language in Northern Cyprus, but an English version was also provided for foreign non-Turkish participants. Only closed-ended questions were used in the survey. The questionnaire was divided into four main sections based on the research hypotheses previously mentioned. The first section concerned socio-demographics and included 11 components. The second section pertained to the residential environment and included 25 components for neighborhood facilities, 5 components for environmental features, 5 components for social environment, 8 components for housing conditions, 22 components for housing features, and 6 components for housing support services. The third section focused on local historical housing renovation rules, which had five components. The fourth section concerned sense of place, which was broken down into three sub-sections, place identity, place attachment, and place dependence, and had four items for each sub-section, as shown in Appendix A, Table A2.
Before conducting the technical modeling analysis, principal component analysis was used to derive all indexes. The internal reliability of all questions was also assessed using Cronbach’s alpha. In general, the average measurement was found to be above 0.85, indicating the reliability of the scale. Unlike previous residential satisfaction studies that used multiple regression analysis [9], this study utilized logit models due to the presence of a binary dependent variable. Multiple linear regression (e.g., OLS technique) can produce predictive values outside a range of 0 and 1 in such cases, but logit models provide more robust results through the use of logistic regression methodology [39]. Additionally, unlike earlier studies [8,9] that relied on the magnitude of coefficients to rank determinants, this study employed a bootstrap ranking LASSO logistic regression to rank determinants by importance for prediction and to reduce overfitting. According to Courville and Thompson [32], relying on the magnitude of coefficients is not reliable due to the presence of inter-correlation between determinants.

4.3. Descriptive Analysis

Table 2 illustrates the socio-demographic profile of respondents. In the study, 51.94% of the respondents were male and 48.06% were female. Most of the respondents were between the ages of 31 and 61 (53.49%), followed by those between 19 and 30 years old (27.91%), those over 61 (15.50%), and those under 18 (3.10%). The monthly income for 41.09% of respondents was between TRY 2000 and 3000, 23.26% earned between TRY 3000 and 4000, 19.38% earned less than TRY 2000, 10.08% earned between 4000 and 6000 lira, and 6.19% earned more than TRY 6000. Further, 51.16% of respondents were renters, while 48.84% were owners. The length of time respondents had lived in the housing area varied, with 21.71% living there for 10–20 years, 19.38% living there for 20–40 years, 13.95% living there for 5–10 years, and 20.16% living there for more than 40 years. The ethnic composition of the area was 65.12% Turkish-Cypriot and 34.88% non-Turkish-Cypriot. The household sizes of respondents varied, with 3.88% having one resident, 24.81% having two residents, 23.26% having three residents, 29.46% having four residents, and 18.59% having more than four residents. Most of the respondents were married (62.01%), while 37.99% were single. The highest education levels for the respondents were university degree (33.34%) and high school (33.33%), while some had only attended primary school (17.83%) or middle school (15.50%). The majority of respondents were employed in the public sector (87.60%), while 12.40% worked in the private sector. The most common number of bedrooms in respondents’ houses was three (41.86%), while the least common was over four (1.55%). Overall, the descriptive analysis shows that the most satisfied respondents were female (54.22%), between 31 and 61 years old (55.42%), with monthly income between TRY 2000 and 3000 (43.37%), home ownership (57.83%), and length of residency between 10 and 20 years (24.10%). They were also Turkish-Cypriot (68.67%), with a household size of four residents (30.12%), married (63.85%), holding a university degree (36.14%), working in public employment (85.54%), and living in houses with three bedrooms (38.55%).
The descriptive analysis in Table 3 shows that residents’ overall satisfaction with neighborhood facilities, environmental features, social environment, housing condition, local historical housing renovation rules, and sense of place was lower than the moderate level (3.14, 2.85, 3.08, 3.14, 2.91, and 3.42, respectively). Meanwhile, residents’ satisfaction with overall housing features was at a moderate level (3.50) and satisfaction with overall housing support services was below the moderate level (3.03). This is consistent with previous studies [9,14,83]. The present study used a point of 3.5 as the moderate level of satisfaction, similar to previous studies [9,14].

4.4. Econometrical Test Models

This study uses the actual–aspiration gap conceptual approach to build the econometrical test model because it allows researchers to measure the gap between the actual experiences or needs of residents and their aspirations or expectations. By examining this gap, researchers can better understand how satisfied residents are with their living situation and identify any areas where improvements could be made. The use of this approach helps the study to gain a more comprehensive understanding of residential satisfaction and its determinants. The model includes four variables: socio-demographics, the residential environment index, the local historical housing renovation rules index, and the SOP index. The dependent variable, satisfaction, is measured by using a dummy variable that takes on a value of 1 if the respondent is satisfied and 0 if they are not. The other variables are measured using a 5-point Likert scale, with 1 representing the lowest level of satisfaction or agreement and 5 representing the highest. The model is represented by Equation (1), where α represents the coefficients for each variable and ε represents the error term.
S a t i s f a c t i o n = α 0 + α 1 S o c i o   d e m o g r a p h i c + α 2 R e s i d e n t i a l   e n v i r o n m e n t   i n d e x + α 3 H i s t o r i c a l   h o u s i n g   r e n o v a t i o n   r u l e s   i n d e x + α 4 S O P   i n d e x + ε  
In addition, the present study performs Equation (2) to test the effect of both sub-pillars of residential environment and SOP on RS. Therefore, this study replaces the residential environment index with the sub-indices of neighborhood facilities, environmental features, social environment, housing conditions, housing features, and housing support services. It also replaced the SOP index with PI, PA, and PD sub-indices.
S a t i s f a c t i o n = α 0 + α 1 S o c i o   d e m o g r a p h i c + α 2 R e s i d e n t i a l   e n v i r o n m e n t   s u b   i n d e x + α 3 H i s t o r i c a l   h o u s i n g   r e n o v a t i o n   r u l e s   i n d e x + α 4 S O P   s u b   i n d e x   + ε
This study also performs Equation (3) to examine the effect of components of each pillar on RS.
S a t i s f a c t i o n = α 0 + α 1 S o c i o   d e m o g r a p h i c + α 2 R e s i d e n t i a l   e n v i r o n m e n t   c o m p o n e n t s + α 3 H i s t o r i c a l   h o u s i n g   r e n o v a t i o n   r u l e s   c o m p o n e n t s + α 4 S O P   c o m p o n e n t s + ε  
Similar to Equation (1), the present study also uses a dummy variable for measuring satisfaction in both Equations (2) and (3). In addition, it measures the determinants using the above-mentioned 5-point Likert scales.

5. Empirical Results

Before performing the technical modeling analysis, all indexes were derived using principal component analysis (PCA). Cronbach’s alpha was examined for the internal reliability of all questions. In general, we found that the average of this measurement is above 0.85, which shows the scale reliability.

Estimation Results

The results of the logit regression analysis, presented in Table 4, indicate that the residential environment, local historical housing renovation rules, and sense of place (SOP) pillars have a statistically significant positive impact on residents’ satisfaction (RS). The marginal effects of the logit regression show that an increase of one unit in the residential environment, local historical housing renovation rules, and SOP pillars leads to a 13%, 9%, and 36% increase, respectively, in the likelihood of residents’ satisfaction. Model 2 of the analysis supports previous studies [9,65] in finding that the sub-pillars of the residential environment, specifically environmental features, social environment, and housing support services, significantly determine RS. Additionally, the results confirm earlier research [108,109] in showing that the sub-pillars of SOP, particularly place identity (PI) and place attachment (PA), have a significant impact on RS. These findings are not surprising given that the historic urban quarter of the Walled City has been preserved by cultural heritage programs. Studies have shown that the protection of cultural heritage can enhance residents’ sense of place ([100,102].
Examining the socio-demographic characteristics of the respondents, the results suggest that length of residency and household size have a negative effect on predicting RS. These findings are consistent with recent studies [23,25] that found negative and significant effects for these variables. The results also indicate that ethnicity and marital status have a negative and positive impact on RS, respectively. This suggests that Turkish-Cypriot and married residents are more satisfied compared to non-Turkish and single residents. The results also reveal that the predictor variables explain 76% of the variance in resident satisfaction (RS). As emphasized by Fang [54], it is important for local authorities, housing policy decision makers, and urban planners to identify the essential elements of RS in order to improve residential environments that meet the current needs of residents.
According to Figure 6, the order of importance of variables on RS in this study was determined using a bootstrap LASSO logistic regression model (the variable importance order results are extracted after 10,000 times bootstrapping with the binomial kernel function. In the LASSO estimation, the optimal Lambda (0.068) is defined using k-fold cross-validation. We set number of folds to 8 with deviance as a measure of loss to use for cross-validation.). The results show that housing support services are the most important factor for RS, followed by PA, PI, gender, employment sector, and so on. The remaining variables, listed in order of importance, are social environment, PD, local historical housing renovation rules, household size, home ownership, marital status, environmental features, number of bedrooms, age, housing conditions, ethnicity, housing features, length of residency, neighborhood facilities, education, and income. These findings suggest that among the various factors studied, housing support services have the greatest influence on residents’ satisfaction.
Table 5 shows the logit regression results of Equation (3). However, for the sake of brevity, only the significant results are presented here. The results suggest that 27 of the components significantly contributed to predicting RS. Among the components, eight components with negative signs and nineteen components with positive signs impact RS. Overall, nineteen of these significant components are linked to the residential environment, followed by one component for local historical housing renovation rules, and seven components for SOP pillars. In addition, Table 5 shows that the residential environment sub-pillars (three components of neighborhood facilities; eight components of environmental features, social environment, housing conditions, and housing support services; and eight components of housing features) significantly impact RS. The findings support a study by Vehbi and Hoskara [28], which showed that the current needs of the residents are not fulfilled by physical conditions in the historic urban quarters.

6. Discussion

To the best of the authors’ knowledge, this study is among the first to specifically ex-amine the predictors of RS in the Walled City of Famagusta. While Davoodi and Dağlı [29] identified important factors related to the sustainability of the Walled City through a “Marginal improvement priority” approach, they did not measure the gap between actual reality and aspirations through resident satisfaction levels, which this study tried to achieve. To create an empirical satisfaction model for the historical area of the Walled City, this study applies the actual–aspiration gap theory, as proposed by Galster [5], which allows researchers to measure the gap between the actual experiences or needs of residents and their aspirations or expectations.
The descriptive findings show that, although residents are just over slightly satisfied with the neighborhood facilities, social environment, housing conditions, housing support services, and SOP, they are slightly dissatisfied with the environmental features and local historical housing renovation rules. Further, findings show that residents are moderately satisfied with housing features. Focusing on the empirical findings, the logit estimation results reveal that the residential environment, local historical housing renovation rules, and SOP have statistically significant and positive impacts on RS. Results suggest that improvements in RS in the historic urban quarters depend not only on the residential environment, as historical housing renovation rules and SOP are also significant pillars of RS. More specifically, empirical results show that the betterment of environmental features, social environment, housing support services, PI, and PA can significantly enhance resident satisfaction. The findings also indicate that length of residency, household size, and ethnicity with negative signs and marital status with a positive sign significantly impact RS. Moreover, the results of the bootstrap LASSO logistic regression model suggest that housing support services are the essential factor of RS. This is followed by PA, PI, gender, and employment sector.
Additionally, there are some shortcomings of the research because of the methodology chosen to collect the data. As mentioned earlier in the Data Collection and Methodology section, the conveying sampling method used minimizes the generalization of the findings to other locations. Furthermore, using a very unique location as a case study reduces the external validity of the study, which adds to the problem of generalization. Consequently, if similar research is conducted in areas with similar attitudes, such as the Walled City of Nicosia and the old quarters of cities, the external validity of the results could have been increased.

7. Conclusions

Although several studies have empirically investigated the predictors of RS in public and private housing, there is less attention in the empirical literature on investigating the determinants of RS, specifically in the historic environment of cities in developing countries. Therefore, this study, by considering the specific and distinguishing characteristics of historical areas, attempted to provide an empirical satisfaction model for exploring the determinants of RS in a historical area of the Walled City, Famagusta. This study has a distinctive contribution by the inclusion of different determinants of RS and employing a bootstrap ranking LASSO logistic regression for ranking the importance of determinants.
This study also provides valuable insight into the needs and expectations of residents in historic urban quarters and may be useful to housing policy decision makers, urban planners, and municipalities in improving the residential environment to better meet these needs in historic areas. The results of this study also contribute to the literature on residential satisfaction and provide a foundation for further research on applying the empirical satisfaction model used in this study to other historical areas in order to identify determinants of residential satisfaction. Furthermore, we believe that RS in historical areas can be important for sustainability. The results can be considered as a crucial step in the sustainable development process, and identifying the significant determinants of RS helps to completely fulfill the contemporary needs of residents in other physically degraded and urban-fabric-deteriorated historical environments. High levels of residential satisfaction can help to foster a sense of community and social cohesion, which can, in turn, support efforts to promote sustainable behaviors and practices within the community. Furthermore improving residential satisfaction in historical areas can also help to support the preservation and revitalization of these areas, which can be important for maintaining the cultural and historical character of a city or region.
Although this paper provides empirical findings for modeling the predictors of RS in historic urban quarters, further studies should be conducted in more historical environments to achieve generalization of the findings of this research to other locations.

Author Contributions

Conceptualization, T.D., B.Y. and U.U.D.; methodology, T.D.; software, T.D.; validation, T.D., B.Y. and U.U.D.; formal analysis, T.D.; investigation, T.D.; resources, T.D.; data curation, B.Y.; writing—original draft preparation, T.D.; writing—review and editing, B.Y.; visualization, T.D. and B.Y. All authors have read and agreed to the published version of the manuscript.

Funding

This research received no external funding.

Institutional Review Board Statement

Not applicable.

Informed Consent Statement

Not applicable.

Data Availability Statement

The data that support the findings of this study are available from the corresponding author upon reasonable request.

Conflicts of Interest

The authors declare no conflict of interest.

Appendix A. Summary of Existing Literature on RS and Questionnaire

Table A1. Summary of residential satisfaction studies.
AuthorsCase StudiesSelected Factors Findings
[69]Households sampled
(Wooster, Ohio)
Context of dwelling and neighborhood, characteristics of households.Characteristics of households and contextual characteristics of the dwellings and neighborhood have significant effect on residential satisfaction.
[64]Public housing units
(Abuja, Nigeria)
Structure types, building features, housing condition, neighborhood facilities, public housing management.Residents are dissatisfied with all the factors except for the neighborhood facilities.
[17]Modern and
old neighborhood
(Edirne, Turkey)
Perceived living conditions, physical surrounding, social relations, local authorities, quality of the facilities.Perceived attitude toward residential satisfaction with social relations, and the local authorities are relatively higher in a modern neighborhood.
[65]Mass housing areas
(Istanbul, Turkey)
Accessibility, inhabited residential environment, various facilities in the inhabited environment, environmental security, neighbor relationships, appearance of housing environment.Accessibility to open areas is statistically significant with positive signs and has the highest impact on housing and environmental quality satisfaction.
[20]Private low-cost housing (Terengganu, Malaysia)Dwelling unit features, housing services, neighborhood facilities and environment.Degrees of residential satisfaction are higher with dwelling units and services provided by the developers than neighborhood facilities and environment.
[22]Neighborhoods (Prenestino-Labicano,
Torre Angela, Rome)
Physical attributes of the environment, cognitive perceptions and affective appraisals of residents, urban activities, socio-demographic.Cognitive, affective, and urban activities are significant predictors of residential satisfaction.
[44]Newly designed public low-cost housing (Kuala Lumpur, Malaysia)Dwelling unit features, dwelling unit support services, public facilities, social environment, neighborhood facilities.Residents moderately satisfied with neighborhood facilities, support services, and public facilities more than dwelling unit features and social environment.
[18]Planned community (Elenbrook, Western Australia)Sense of community, sense of belonging, and sense of place.Sense of community, sense of belonging, and sense of place have a positive nexus with residential satisfaction.
[40]Public housing
(Ogun, Nigeria)
Dwelling unit features, dwelling unit support services, neighborhood environment, management of housing estates, housing acquisition process, social environment.Level of residential satisfaction is comparatively higher with dwelling unit features than neighborhood facilities and services and respondents are dissatisfied with the housing conditions.
[8]Public core housing (Abeokuta, Ogun State, Nigeria)Socio-economic characteristics, housing unit characteristics, neighborhood facilities and environment, management and services.Socio-economic characteristics, housing unit characteristics, neighborhood facilities and environment, management and services are significant predictors of residential satisfaction.
[66] Squatter houses, and apartment buildings
(Dikmen, Ankara)
Architectural features, interior and economic features of the house, functionality and location of the house, and social features of the housing environment.Housing satisfaction is a multidimensional phenomenon containing physical, social and economic dimensions.
[15] Public housing
(Hangzhou, China)
Housing characteristic, neighborhood characteristic, public facilities, social environment, residence comparison, housing allocation scheme, residents’ characteristics.Neighborhood characteristic, public facilities, housing characteristics, public housing allocation scheme, socio-economic, and residence comparison factors impact on residential satisfaction.
[9] Double-storey terrace housing (Kuala Lumpur, Malaysia)Public facilities, social environment, neighborhood facilities, housing support services, physical features.Improvements of housing design and neighborhood elements can significantly enhance the residents’ overall housing satisfaction.
[25] Public housing
(Shiraz, Iran)
Physical features, public facilities, public services, social participation and cohesion.Physical features variable is the main determinants of overall residential satisfaction.
[19]Public housing
(Tehran, Iran)
Place identity, place dependence, place attachment (sense of place components).Sense of place components are positive predictive factors for residential satisfaction.
Note: This table shows the summary of previous residential satisfaction studies.
Table A2. The sample questionnaires of sense of place.
A: Place identity
Everything about my residential area (Walled city) is a reflection of me.
Strongly disagreeDisagreeDo not knowAgreeStrongly agree
My residential area (walled city) says very little about who I am.
Strongly disagreeDisagreeDo not knowAgreeStrongly agree
I feel that I can really be myself at my residential area (Walled city).
Strongly disagreeDisagreeDo not knowAgreeStrongly agree
My residential area (Walled city) reflects the type of person I am.
Strongly disagreeDisagreeDo not knowAgreeStrongly agree
B: Place attachment
I feel relaxed when I’m at my residential area (Walled city).
Strongly disagreeDisagreeDo not knowAgreeStrongly agree
I feel happiest when I’m at my residential area (Walled city).
Strongly disagreeDisagreeDo not knowAgreeStrongly agree
My residential area (Walled city) is my favorite place to be
Strongly disagreeDisagreeDo not knowAgreeStrongly agree
I really miss my residential area (Walled city) when I’m away from it for too long.
Strongly disagreeDisagreeDo not knowAgreeStrongly agree
C: Place dependence
My residential area (Walled city) is the best place for doing the things that I enjoy most.
Strongly disagreeDisagreeDo not knowAgreeStrongly agree
For doing the things that I enjoy most, no other place can compare to my residential area (Walled city).
Strongly disagreeDisagreeDo not knowAgreeStrongly agree
My residential area (Walled city) is not a good place to do the things I most like to do.
Strongly disagreeDisagreeDo not knowAgreeStrongly agree
As far as I am concerned, there are better places to be than at my residential area (Walled city).
Strongly disagreeDisagreeDo not knowAgreeStrongly agree

References

  1. Makinde, O.O. Influences of socio-cultural experiences on residents’ satisfaction in Ikorodu low-cost housing estate, Lagos state. Environ. Dev. Sustain. 2014, 17, 173–198. [Google Scholar] [CrossRef] [Green Version]
  2. Lin, S.; Li, Z. Residential satisfaction of migrants in Wenzhou, an ‘ordinary city’ of China. Habitat Int. 2017, 66, 76–85. [Google Scholar] [CrossRef]
  3. Campbell, A.; Converse, P.E.; Rodgers, W.L. The Quality of American Life: Perceptions, Evaluations, and Satisfactions; Russell Sage Foundation: New York, NY, USA, 1976. [Google Scholar]
  4. Morris, E.W.; Winter, M. Housing, Family, and Society; John Wiley and Sons: New York, NY, USA, 1978. [Google Scholar]
  5. Galster, G. Identifying the Correlates of Dwelling Satisfaction. Environ. Behav. 1987, 19, 539–568. [Google Scholar] [CrossRef]
  6. Amérigo, M.; Aragonés, J.I. Residential satisfaction in council housing. J. Environ. Psychol. 1990, 10, 313–325. [Google Scholar] [CrossRef]
  7. Hunt, H.K. CS/D Overview and Future Research Directions. In Conceptualization and Measurement of Consumer Satisfaction and Dissatisfaction; Hunt, K., Ed.; Marketing Science Institute: Cambridge, MA, USA, 1977; pp. 455–488. [Google Scholar]
  8. Ibem, E.O.; Amole, D. Residential Satisfaction in Public Core Housing in Abeokuta, Ogun State, Nigeria. Soc. Indic. Res. 2012, 113, 563–581. [Google Scholar] [CrossRef]
  9. Mohit, M.A.; Mahfoud, A.-K.A. Appraisal of residential satisfaction in double-storey terrace housing in Kuala Lumpur, Malaysia. Habitat Int. 2015, 49, 286–293. [Google Scholar] [CrossRef]
  10. Jiang, W.; Feng, T.; Timmermans, H.; Li, H. A gap-theoretical path model of residential satisfaction and intention to move house applied to renovated historical blocks in two Chinese cities. Cities 2017, 71, 19–29. [Google Scholar] [CrossRef]
  11. Riazi, M.; Emami, A. Residential satisfaction in affordable housing: A mixed method study. Cities 2018, 82, 1–9. [Google Scholar] [CrossRef]
  12. Galster, G.C. Evaluating indicators for housing policy: Residential satisfaction vs. marginal improvement priorities. Soc. Indic. Res. 1985, 16, 415–448. [Google Scholar] [CrossRef]
  13. Satsangi, M.; Kearns, A. The Use and Interpretation of Tenant Satisfaction Surveys in British Social Housing. Environ. Plan. C Gov. Policy 1992, 10, 317–331. [Google Scholar] [CrossRef]
  14. Mohit, M.A.; Nazyddah, N. Social housing programme of Selangor Zakat Board of Malaysia and housing satisfaction. J. Hous. Built Environ. 2011, 26, 143–164. [Google Scholar] [CrossRef] [Green Version]
  15. Huang, Z.; Du, X. Assessment and determinants of residential satisfaction with public housing in Hangzhou, China. Habitat Int. 2015, 47, 218–230. [Google Scholar] [CrossRef]
  16. Brolin, R.; Rask, M.; Syrén, S.; Baigi, A.; Brunt, D.A. Satisfaction with Housing and Housing Support for People with Psychiatric Disabilities. Issues Ment. Health Nurs. 2014, 36, 21–28. [Google Scholar] [CrossRef] [PubMed]
  17. Erdogan, N.; Akyol, A.; Ataman, B.; Dokmeci, V. Comparison of Urban Housing Satisfaction in Modern and Traditional Neighborhoods in Edirne, Turkey. Soc. Indic. Res. 2006, 81, 127–148. [Google Scholar] [CrossRef]
  18. Smith, K. The Relationship between Residential Satisfaction, Sense of Community, Sense of Belonging and Sense of Place in a Western Australian Urban Planned Community. Ph.D. Thesis, Edith Cowan University, Perth, Australia, 2011. Available online: http://ro.ecu.edu.au/cgi/viewcontent.cgi?article=1460&context=theses (accessed on 15 September 2022).
  19. Ghafourian, M.; Hesari, E. Evaluating the Model of Causal Relations Between Sense of Place and Residential Satisfaction in Iranian Public Housing (The Case of Mehr Housing in Pardis, Tehran). Soc. Indic. Res. 2017, 139, 695–721. [Google Scholar] [CrossRef]
  20. Salleh, A.G. Neighbourhood factors in private low-cost housing in Malaysia. Habitat Int. 2008, 32, 485–493. [Google Scholar] [CrossRef]
  21. Türkoğlu, H. Residents’ satisfaction of housing environments: The case of Istanbul, Turkey. Landsc. Urban Plan. 1997, 39, 55–67. [Google Scholar] [CrossRef]
  22. Aiello, G.; De Luca, P.; Spatareanu, M. Analysis of residential satisfaction in the city of Rome. Cities 2010, 27, 168–175. [Google Scholar]
  23. Boschman, S. Individual differences in the neighbourhood level determinants of residential satisfaction. Hous. Stud. 2018, 33, 1127–1143. [Google Scholar] [CrossRef] [Green Version]
  24. Huang, X.; Du, J. The influence of individual and environmental factors on residential satisfaction in public rental housing: A case study of Shanghai. Habitat Int. 2015, 48, 1–9. [Google Scholar]
  25. Etminani-Ghasrodashti, R.; Majedi, H.; Paydar, M. Assessment of Residential Satisfaction in Mehr Housing Scheme: A Case Study of Sadra New Town, Iran. Hous. Theory Soc. 2016, 34, 323–342. [Google Scholar] [CrossRef]
  26. Jun, H.J.; Jeong, H. Residential satisfaction among public housing residents living in social-mix housing com-plexes: The case of the Seoul Metropolitan Area, Korea. Urban Policy Res. 2018, 36, 319–335. [Google Scholar]
  27. Dinç, P.; Özbilen, E.; Bilir, M.B. A multi-dimensional scale for measuring residential satisfaction (rs) in mass housing projects. Indoor Built Environ. 2013, 23, 864–880. [Google Scholar] [CrossRef]
  28. Vehbi, B.O.; Hoşkara, Ö. A Model for Measuring the Sustainability Level of Historic Urban Quarters. Eur. Plan. Stud. 2009, 17, 715–739. [Google Scholar] [CrossRef]
  29. Davoodi, T.; Dağlı, F. Exploring the determinants of residential satisfaction in historic urban quarters: Towards sustainability of the Walled City Famagusta, North Cyprus. Sustainability 2019, 11, 6261. [Google Scholar] [CrossRef] [Green Version]
  30. Mason, R.; Fund, W.M.; Tumer, E.U.; Ünlü, A.K.; Silman, R.; Schmid, W. The Walled City of Famagusta: A Compendium of Preservation Studies, 2008–2012; World Monuments Fund: New York, NY, USA, 2012. [Google Scholar]
  31. Pohlmann, J.T.; Leitner, D.W. A comparison of ordinary least squares and logistic regression. Ohio J. Sci. 2003, 103, 118–125. [Google Scholar]
  32. Courville, T.; Thompson, B. Use of Structure Coefficients in Published Multiple Regression Articles: β is not Enough. Educ. Psychol. Meas. 2001, 61, 229–248. [Google Scholar] [CrossRef] [Green Version]
  33. Saliminezhad, A.; Lisaniler, F.G. Validity of unbalanced growth theory and sectoral investment priorities in Indonesia: Application of feature ranking methods. J. Int. Trade Econ. Dev. 2017, 27, 521–540. [Google Scholar] [CrossRef]
  34. Canter, D.; Rees, K. A multivariate model of housing satisfaction. Appl. Psychol. 1982, 31, 185–207. [Google Scholar] [CrossRef]
  35. Weidemann, S.; Anderson, J.R. A Conceptual Framework for Residential Satisfaction. Home Environ. 1985, 8, 153–182. [Google Scholar] [CrossRef]
  36. Levy-Leboyer, C.; Ratiu, E. The need for space and residential satisfaction. Archit. Comport./Archit. Behav. 1993, 9, 475–490. [Google Scholar]
  37. Ge, J.; Hokao, K. Research on residential lifestyles in Japanese cities from the viewpoints of residential preference, residential choice and residential satisfaction. Landsc. Urban Plan. 2006, 78, 165–178. [Google Scholar] [CrossRef]
  38. Hur, M.; Morrow-Jones, H. Factors That Influence Residents’ Satisfaction With Neighborhoods. Environ. Behav. 2008, 40, 619–635. [Google Scholar] [CrossRef]
  39. Canter, D. The Purposive Evaluation of Places. Environ. Behav. 1983, 15, 659–698. [Google Scholar] [CrossRef]
  40. Ibem, E.O.; Aduwo, E.B. Assessment of residential satisfaction in public housing in Ogun State, Nigeria. Habitat Int. 2013, 40, 163–175. [Google Scholar] [CrossRef]
  41. Chaudhury, H.; Rowles, G.D. Between the shores of recollection and imagination: Self, aging, and home. In Home Identity Late Life International Perspectives; Springer: Berlin/Heidelberg, Germany, 2005; pp. 3–18. [Google Scholar]
  42. Francescato, G.; Weidemann, S.; Anderson, J.R. Evaluating the Built Environment from the Users’ Point of View: An Attitudinal Model of Residential Satisfaction. In Building Evaluation; Preiser, W.F.E., Ed.; Springer: Boston, MA, USA, 1989; pp. 181–189. [Google Scholar] [CrossRef]
  43. Amole, D. Residential satisfaction in students’ housing. J. Environ. Psychol. 2009, 29, 76–85. [Google Scholar] [CrossRef]
  44. Mohit, M.A.; Ibrahim, M.; Rashid, Y.R. Assessment of residential satisfaction in newly designed public low-cost housing in Kuala Lumpur, Malaysia. Habitat Int. 2010, 34, 18–27. [Google Scholar] [CrossRef]
  45. Speare, A. Residential satisfaction as an intervening variable in residential mobility. Demography 1974, 11, 173–188. [Google Scholar] [CrossRef] [PubMed]
  46. Diaz-Serrano, L.; Stoyanova, A.P. Mobility and housing satisfaction: An empirical analysis for 12 EU countries. J. Econ. Geogr. 2009, 10, 661–683. [Google Scholar] [CrossRef]
  47. Earhart, C.C.; Weber, M.J. Attachment-to-Home: A Contributing Factor to Models of Residential Mobility Intentions. Fam. Consum. Sci. Res. J. 1996, 24, 422–437. [Google Scholar] [CrossRef]
  48. Oh, J.-H. Social Bonds and the Migration Intentions of Elderly Urban Residents: The Mediating Effect of Residential Satisfaction. Popul. Res. Policy Rev. 2003, 22, 127–146. [Google Scholar] [CrossRef]
  49. He, S.J.; Qi, X.L. Determinants of relocation satisfaction and relocation intention in Chinese cities: An empirical investigation on three types of residential neighborhood in Guangzhou. Sci. Geogr. Sin. 2014, 34, 1327–1336. [Google Scholar]
  50. Andersen, H.S. Why do residents want to leave deprived neighbourhoods? The importance of residents’ subjective evaluations of their neighbourhood and its reputation. J. Hous. Built Environ. 2008, 23, 79–101. [Google Scholar] [CrossRef]
  51. Jia, X.; Lei, J. Residential Mobility of Locals and Migrants in Northwest Urban China. Sustainability 2019, 11, 3507. [Google Scholar] [CrossRef] [Green Version]
  52. Zhang, C.; Lu, B. Residential satisfaction in traditional and redeveloped inner city neighborhood: A tale of two neighborhoods in Beijing. Travel Behav. Soc. 2016, 5, 23–36. [Google Scholar] [CrossRef]
  53. Savasdisara, T.; Tips, W.E.; Suwannodom, S. Residential satisfaction in private estates in Bangkok: A comparison of low-cost housing estates and determinant factors∗. Habitat Int. 1989, 13, 65–73. [Google Scholar] [CrossRef]
  54. Fang, Y. Residential satisfaction, moving intention and moving behaviours: A study of redeveloped neighbourhoods in inner-city Beijing. Hous. Stud. 2006, 21, 671–694. [Google Scholar] [CrossRef]
  55. Kaitilla, S. Satisfaction with public housing in Papua New Guinea: The case of West Taraka housing scheme. Environ. Behav. 1993, 25, 514–545. [Google Scholar] [CrossRef]
  56. Nurizan, Y. Space deficit in low-cost household of Peninsular Malaysia. Kaji. Malays. 1993, 11, 56–75. [Google Scholar]
  57. Sulaiman, H.; Yahaya, N. Housing provision and satisfaction of low-income households in Kuala Lumpur. Habitat Int. 1987, 11, 27–38. [Google Scholar] [CrossRef]
  58. Ha, S.-K. Social housing estates and sustainable community development in South Korea. Habitat Int. 2008, 32, 349–363. [Google Scholar] [CrossRef]
  59. Oh, L.S. Housing Satisfaction of Middle Income Households in Bandar Baru Bangi, Selangor. Ph.D. Thesis, Universiti Pertanian Malaysia, Serdang, Malaysia, 2000. [Google Scholar]
  60. Jiboye, A.D. Correlates of public housing in Lagos, Nigeria. J. Geogr. Reg. Plan. 2010, 3, 17–28. [Google Scholar]
  61. Addo, I. Assessing residential satisfaction among low income households in multi-habited dwellings in selected low income communities in Accra. Urban Stud. 2015, 53, 631–650. [Google Scholar] [CrossRef]
  62. Cao, X.J.; Wang, D. Environmental correlates of residential satisfaction: An exploration of mismatched neigh-borhood characteristics in the Twin Cities. Landsc. Urban Plan. 2016, 150, 26–35. [Google Scholar] [CrossRef] [Green Version]
  63. Gan, X.; Zuo, J.; Baker, E.; Chang, R.; Wen, T. Exploring the determinants of residential satisfaction in public rental housing in China: A case study of Chongqing. J. Hous. Built Environ. 2019, 34, 869–895. [Google Scholar] [CrossRef]
  64. Ukoha, O.M.; Beamish, J.O. Assessment of residents’ satisfaction with public housing in Abuja, Nigeria. Habitat Int. 1997, 21, 445–460. [Google Scholar] [CrossRef]
  65. Berkoz, L.; Turk, Ş.Ş.; Kellekci, Ö.L. Environmental Quality and User Satisfaction in Mass Housing Areas: The Case of Istanbul. Eur. Plan. Stud. 2009, 17, 161–174. [Google Scholar] [CrossRef]
  66. Ezgi, Z.; Kahraman, H. Dimensions of Housing Satisfaction: A Case Study Based on Perceptions of Rural Migrants Living in Dikmen. METU J. Fac. Arch. 2013, 30, 1–27. [Google Scholar] [CrossRef]
  67. Aiello, A.; Ardone, R.G.; Scopelliti, M. Neighbourhood planning improvement: Physical attributes, cognitive and affective evaluation and activities in two neighbourhoods in Rome. Eval. Program Plan. 2010, 33, 264–275. [Google Scholar] [CrossRef] [PubMed]
  68. Adriaanse, C.C.M. Measuring residential satisfaction: A residential environmental satisfaction scale (RESS). J. Hous. Built Environ. 2007, 22, 287–304. [Google Scholar] [CrossRef] [Green Version]
  69. Galster, G.C.; Hesser, G.W. Residential Satisfaction. Environ. Behav. 1981, 13, 735–758. [Google Scholar] [CrossRef]
  70. Phillips, D.R.; Siu, O.-L.; Yeh, A.G.-O.; Cheng, K.H.C. Ageing and the urban environment. In Ageing and Place; Andrews, G.J., Phillips, D.R., Eds.; Routledge: Oxon, UK, 2005; pp. 147–164. [Google Scholar]
  71. Temelová, J.; Dvořáková, N. Residential satisfaction of elderly in the city centre: The case of revitalizing neighbourhoods in Prague. Cities 2011, 29, 310–317. [Google Scholar] [CrossRef]
  72. Li, S.-M.; Song, Y.-L. Redevelopment, Displacement, Housing Conditions, and Residential Satisfaction: A Study of Shanghai. Environ. Plan. A Econ. Space 2009, 41, 1090–1108. [Google Scholar] [CrossRef]
  73. Lee, E.; Park, N.-K. Housing Satisfaction and Quality of Life Among Temporary residents in the United States. Hous. Soc. 2010, 37, 43–67. [Google Scholar] [CrossRef]
  74. Newman, S.J.; Greg, J.D. Residential problems, dissatisfaction, and mobility. J. Am. Plan. Assoc. 1979, 45, 154–166. [Google Scholar] [CrossRef]
  75. Lu, M. Determinants of Residential Satisfaction: Ordered Logit vs. Regression Models. Growth Change 1999, 30, 264–287. [Google Scholar] [CrossRef]
  76. Varady, D.P.; Carrozza, M.A. Toward a Better Way to Measure Customer Satisfaction Levels in Public Housing: A Report from Cincinnati. Hous. Stud. 2000, 15, 797–825. [Google Scholar] [CrossRef]
  77. Pinquart, M.; Burmedi, D. Correlates of residential satisfaction in adulthood and old age: A meta-analysis. Annu. Rev. Gerontol. Geriatr. 2003, 23, 195–222. [Google Scholar] [CrossRef]
  78. Jaafar, M.; Hasan, N.L.; Mohamad, O.; Ramayah, T. The determinants of housing satisfaction level: A study on residential development project by Penang Development Corporation (PDC). Kemanusiaan 2005, 3, 1–20. [Google Scholar]
  79. Ogu, V.I. Urban Residential Satisfaction and the Planning Implications in a Developing World Context: The Example of Benin City, Nigeria. Int. Plan. Stud. 2002, 7, 37–53. [Google Scholar] [CrossRef]
  80. Lipsetz, D.A. Residential Satisfaction: Identifying the Differences between Suburbanites and Urbanites; Ohio State University: Columbus, OH, USA, 2000. [Google Scholar]
  81. Sirgy, M.J.; Cornwell, T. How neighborhood features affect quality of life. Soc. Indic. Res. 2002, 59, 79–114. [Google Scholar] [CrossRef]
  82. Brower, S. Designing for Community; University of Maryland Press: College Park, MD, USA, 2003. [Google Scholar]
  83. Mohit, M.A.; Azim, M. Assessment of Residential Satisfaction with Public Housing in Hulhumale’, Maldives. Procedia—Soc. Behav. Sci. 2012, 50, 756–770. [Google Scholar] [CrossRef] [Green Version]
  84. Canter, D. Putting situations in their place: Foundations for a bridge between social and environmental psychology. In Social Behaviour in Context; Furnham, A., Ed.; Allyon and Bacon: London, UK, 1986; pp. 208–239. [Google Scholar]
  85. Schulz, C.N. Genius Loci: Towards a Phenomenology of Architecture; Academy Editions: London, UK, 1980. [Google Scholar]
  86. Canter, D. Understanding, assessing and acting in places: Is an integrative framework possible? In Environmental Cognition and Action: An Integrated Approach; Garling, T., Evans, G., Eds.; Plenum: New York, NY, USA, 1991. [Google Scholar]
  87. Jorgensen, B.S.; Stedman, R.C. Sense of place as an attitude: Lakeshore owners attitudes toward their properties. J. Environ. Psychol. 2001, 21, 233–248. [Google Scholar] [CrossRef]
  88. Shamai, S.; Ilatov, Z. Measuring sense of place: Methodological aspects. Tijdschr. Voor Econ. Soc. Geogr. 2005, 96, 467–476. [Google Scholar] [CrossRef]
  89. Tonts, M.; Atherley, K. Competitive sport and the construction of place identity in rural Australia. Sport Soc. 2010, 13, 381–398. [Google Scholar] [CrossRef]
  90. Rooney, D.; Paulsen, N.; Callan, V.J.; Brabant, M.; Gallois, C.; Jones, E. A New Role for Place Identity in Managing Organizational Change. Manag. Commun. Q. 2009, 24, 44–73. [Google Scholar] [CrossRef] [Green Version]
  91. Proshansky, H.M. The City and Self-Identity. Environ. Behav. 1978, 10, 147–169. [Google Scholar] [CrossRef]
  92. Riley, R.B. Attachment to the Ordinary Landscape. Place Attach. 1992, 12, 13–35. [Google Scholar] [CrossRef]
  93. Williams, D.R.; Patterson, M.E.; Roggenbuck, J.W.; Watson, A.E. Beyond the commodity metaphor: Examining emotional and symbolic attachment to place. Leis. Sci. 1992, 14, 29–46. [Google Scholar] [CrossRef]
  94. Brocato, E.D. Place Attachment: An Investigation of Environments and Outcomes in a Service Context. Ph.D. Thesis, University of Texas—Arlington, Arlington, TX, USA, 2007. Available online: http://hdl.handle.net/10106/244 (accessed on 19 September 2022).
  95. Kyle, G.; Graefe, A.; Manning, R. Testing the Dimensionality of Place Attachment in Recreational Settings. Environ. Behav. 2005, 37, 153–177. [Google Scholar] [CrossRef] [Green Version]
  96. Stokols, D.; Shumaker, S.A. People in places: A transactional view of settings. In Cognition, Social Behavior, and the Environment; Harvey, J.H., Ed.; Lawrence Erlbaum Associates: Hillsdale, NJ, USA, 1981. [Google Scholar]
  97. Lewicka, M. What makes neighborhood different from home and city? Effects of place scale on place attachment. J. Environ. Psychol. 2010, 30, 35–51. [Google Scholar] [CrossRef]
  98. Smith, L. Uses of Heritage; Routledge: London, UK; New York, NY, USA, 2006. [Google Scholar]
  99. Davies, J.; Whimster, R.; Clayton, L. (Eds.) Heritage Count 2009; English Heritage: London, UK, 2009. [Google Scholar]
  100. Davis, P.; Huang, H.Y.; Liu, W.C. Heritage, local communities and the safeguarding of ‘Spirit of Place’ in Taiwan. Mus. Soc. 2010, 8, 80–89. [Google Scholar]
  101. Hawke, S.K. Belonging: The contribution of heritage to sense of place. In Heritage 2010: Proceedings of the 2nd International Conference on Heritage and Sustainable Development, Evora, Portugal, 22–26 June 2010; Amoêda, R., Lira, S., Pinheiro, C., Eds.; Green Lines Institute for Sustainable Development: Barcelos, Portugal, 2010; pp. 1331–1339. [Google Scholar]
  102. Schofield, J.; Szymanski, R. (Eds.) Local Heritage, Global Context: Cultural Perspectives on Sense of Place; Ashgate Publishing, Ltd.: Farnham, UK, 2011. [Google Scholar]
  103. Breakwell, G.M. (Ed.) Social Psychology of Identity and the Self Concept. (Surrey Seminars in Social Psychology); Surrey University Press in association with Academic Press: London, UK, 1992. [Google Scholar]
  104. Rustem, K. North Cyprus Almanac; Contact Type Setting Systems Ltd.: London, UK, 1987. [Google Scholar]
  105. Photo Gallery of Famagusta Municipality. Old Famagusta. 2021. Available online: https://magusasurici.com/gallery (accessed on 21 December 2021).
  106. Sekaran, U.; Bougie, R. Research Methods for Business: A Skill Building Approach, 5th ed.; John Wiley and Sons: Hoboken, NJ, USA, 2010. [Google Scholar]
  107. Starkweather, H. Endangered Site: Famagusta Walled City, Cyprus. The Smithsonian Magazine. March 2009. Available online: https://www.smithsonianmag.com/travel/endangered-site-famagusta-walled-city-cyprus-54478493 (accessed on 5 February 2023).
  108. Lalli, M. Urban-related identity: Theory, measurement, and empirical findings. J. Environ. Psychol. 1992, 12, 285–303. [Google Scholar] [CrossRef]
  109. Veasna, S.; Wu, W.-Y.; Huang, C.-H. The impact of destination source credibility on destination satisfaction: The mediating effects of destination attachment and destination image. Tour. Manag. 2013, 36, 511–526. [Google Scholar] [CrossRef]
Figure 1. Research process.
Sustainability 15 03917 g001
Figure 2. Conceptual framework of this study.
Sustainability 15 03917 g002
Figure 3. Location of Walled City; source: extracted and modified from Google Earth (2022).
Sustainability 15 03917 g003
Figure 4. Locations and the periods of historical monuments; source: authors (2022).
Sustainability 15 03917 g004
Figure 5. Comparing historical houses before and after renovation. Source: photo gallery of Famagusta Walled City [105] before renovation, authors (2022) after renovation.
Sustainability 15 03917 g005
Figure 6. Variable selection using Bootstrap ranking LASSO logistic regression model. Note: Variable definitions: Housing Support Services (HSS), Place Attachment (PA), Place Identity (PI), Employment Sector (ES), Social Environment (SE), Place Dependence (PD), Local Historical Housing Renovation Rules (HHR), Household Size (HHS), Home Ownership (HO), Marital Status (MS), Environmental Features (EF), Number of Bedrooms (NB), Housing Conditions (HC), Housing Features (HF), Length of Residency (LR), Neighborhood Facilities (NF).
Sustainability 15 03917 g006
Table 1. Residential satisfaction determinants.
PillarSub-PillarComponentsSource
Socio-demographic characteristics--------Gender; Age; Monthly income; Home ownership; Length of residency; Ethnicity; Household size; Marital status; Education, Employment sector; Number of bedrooms[8,9,24,25,38,44,64]
Residential environmentNeighborhood facilities:
(Accessibility to function area and public facilities)
Accessibility to centrality (shopping center, city center (Namik Kemal Square, Salamis Road), Job, market); Accessibility to education (kindergarten, primary schools, high schools); Accessibility to open areas (public and private parking areas, walking areas, sport center, green space and views, sea); Accessibility to health center; Accessibility to public transport (bus, taxi); Accessibility to public facilities (Park, place of worship, police station, firefighting station, bank, recreational areas, closed sport center)[9,15,20,44,63,65]
Environmental features Maintenance of the environment (open areas, green areas); Night lighting; Traffic density; Cleanliness [1,65]
Social environmentNeighborhood relations; Community cohesion/relations; Level of crime; Level of security; Noise[15,44]
Housing conditionsWater pressure; Quality of doors; Quality of floors; Quality of walls; Quality of windows; Quality of interior painting; Quality of exterior painting; Lighting of stairwell[64]
Housing featuresDesign/layout of the interior space; Design of bath and toilet; Location and size (living room, kitchen, bathroom, toilet); Number (bedroom, bathroom, toilet); Natural lighting and ventilation; Materials; Privacy; Thermal insulation[20,40,44,64,69]
Housing support servicesPipe and electrical repair services; Garbage collection; Internet; Fire system; Street lighting [2,9,40,44]
Local historical housing renovation rules----Height of building; Percentage of land use for construction; Proportion of openings; Types of the facade materials; Renovation approval process[17,42,44]
Sense of placePlace identityIdentity 1; Identity 2; Identity 3; Identity 4[19]
Place attachmentAttachment 1; Attachment 2; Attachment 3; Attachment 4
Place dependenceDependence 1; Dependence 2; Dependence 3; Dependence 4
Note: This table presents the determinants of residential satisfaction used in this study.
Table 2. Respondents’ demographic and socio-economic characteristics from Field Survey in 2022.
Socio-Demographic CharacteristicsVariableFrequency
(n = 129)
%Overall SatisfiedOverall Dissatisfied
Frequency
(n = 129)
%Frequency
(n = 129)
%
GenderMale6751.943845.782963.04
Female6248.064554.221736.96
Age<1843.1033.6112.17
19–303627.912226.511430.43
31–616953.494655.422350.00
>612015.501214.46817.39
Monthly income
(Turkish lira ₺)
<2000 ₺2519.381619.28919.57
2000–3000 ₺5341.093643.371736.96
3000–4000 ₺3023.261416.871634.78
4000–6000 ₺1310.08910.8448.70
>6000 ₺86.1989.64------
Home ownershipOwner6348.844857.831532.61
Rental6651.163542.173167.39
Length of residency<5 Years3224.812024.101226.09
5–101813.95910.84919.57
10–202821.712024.10817.39
20–402519.381518.071021.74
>402620.161922.89715.22
EthnicityTurkish-Cypriot8465.125768.672758.70
Non-Turkish-Cypriot4534.882631.331941.3
Household size
(people per house)
153.8833.6124.35
23224.812327.71919.57
33023.262024.101021.74
43829.462530.121328.26
>42418.591214.461226.09
Marital statusSingle4937.993036.151941.30
Married8062.015363.852758.70
EducationPrimary school2317.831416.87919.57
Middle school2015.501315.66715.22
High school4333.332631.331736.96
University degree4333.343036.141328.26
Employment sectorPrivate1612.401214.4648.70
Public11387.607185.544291.30
Number of bedrooms11511.631214.4636.52
24131.782428.921736.96
35441.863238.552247.83
41713.181315.6648.70
>421.5522.41---
Table 3. Overall satisfaction.
Overall Satisfaction Very Dissatisfied (%)Dissatisfied (%)Slightly Satisfied (%)Satisfied (%)Very Satisfied (%)MeanSD
Neighborhood facilities0.000.7837.9855.815.433.140.11
Environmental features 4.6521.7126.3639.537.752.850.19
Social environment4.6512.4025.5846.5110.853.080.19
Housing conditions 1.5512.4029.4640.3116.283.140.19
Housing features 0.003.1020.1660.4716.283.500.14
Housing support services 3.109.3037.9844.195.433.030.16
Local historical housing renovation rules3.888.5349.6132.565.432.910.16
Sense of place0.000.7825.7862.5010.943.420.11
Table 4. Pillars and sub-pillars of residential satisfaction.
VariablesModel 1Model 2
Coefficient EstimatesMarginal EffectsCoefficient
Estimates
Marginal
Effects
Socio-demographic characteristics
Gender0.69
(1.24)
0.13
(1.29)
1.62
(1.17)
0.11
(1.25)
Age−0.40
(−0.76)
−0.08
(−0.74)
−1.36
(−1.18)
−0.09
(−1.28)
Monthly income−0.12
(−0.38)
−0.02
(−0.38)
−0.10
(−0.08)
−0.006
(−0.07)
Home ownership−0.47
(−0.72)
−0.09
(−0.72)
1.40
(1.49)
0.09
(0.78)
Length of residency−0.24
(−1.14)
−0.04
(−1.17)
−0.81 **
(−2.44)
−0.05 ***
(−1.75)
Ethnicity−0.34
(−0.70)
−0.06
(−0.70)
−2.39 **
(−2.14)
−0.15 *
(−2.67)
Household size−0.30
(−0.98)
−0.06
(−1.02)
−1.55 ***
(−1.95)
−0.10 *
(−2.31)
Marital status0.20
(0.26)
0.04
(0.26)
2.34 ***
(1.65)
0.15 *
(2.23)
Education0.21
(0.81)
0.03
(0.78)
0.31
(0.63)
0.02
(0.57)
Employment sector−0.50
(−0.52)
−0.08
(−0.57)
−1.34
(−0.72)
−0.06
(−0.52)
Number of bedrooms0.51
(1.27)
0.10
(1.36)
0.59
(0.71)
0.03
(0.65)
Residential environment0.67 **
(2.47)
0.13 **
(2.35)
------
Neighborhood facilities --- 1.14
(1.17)
0.07
(1.15)
Environmental features ------1.10 *
(2.19)
0.07 ***
(1.69)
Social environment ------1.19 ***
(1.67)
0.08 ***
(1.87)
Housing conditions -------−0.81
(−0.92)
−0.05
(−1.13)
Housing features -------0.70
(1.05)
0.04
(1.54)
Housing support services -------3.76 ***
(1.75)
0.25 *
(2.12)
Local historical housing renovation rules 0.47 ***
(1.65)
0.09 ***
(1.69)
2.10 *
(2.71)
0.14 *
(2.01)
Sense of place 1.86 *
(4.88)
0.36 *
(5.45)
------
Place identity ------2.47 **
(2.21)
0.16 *
(3.13)
Place attachment ------2.47 ***
(1.65)
0.15 *
(2.15)
Place dependence ------0.27
(0.26)
0.01
(0.20)
Pseudo R20.44 *---0.76 *---
Note: All the pillars and sub-pillars are indexed-based. In this table: * Significant at 0.01 level. ** Significant at 0.05 level. *** Significant at 0.10 level.
Table 5. Components of residential satisfaction.
ComponentsModel 3
Coefficient Estimatest-ValueMarginal Effectst-Value
Shopping center−0.66 ***(−1.94)−0.14 *(−2.09)
Namik Kemal Square1.09 *(3.48)0.23 *(3.40)
Public parking0.93 *(2.74)0.19 *(2.93)
Traffic density−0.45 **(−2.36)−0.10 **(−2.40)
Night lighting−0.34 ***(−1.67)−0.07 ***(−1.67)
Neighborhood relations0.30 ***(1.75)0.07 ***(1.67)
Security0.27 **(2.15)0.06 ***(1.65)
Quality of windows0.64 **(2.04)0.13 **(2.03)
Lighting of stairwell0.46 **(2.02)0.09 **(2.04)
Location of kitchen1.14 *(2.83)0.24 **(2.57)
Location of toilet−1.07 **(−2.10)−0.23 **(−2.03)
Size of living room−0.70 ***(−1.86)−0.15 ***(−1.79)
Size of kitchen0.96 **(2.55)0.20 **(2.50)
Natural light of living room0.59 ***(1.68)0.13 ***(1.75)
Natural light of kitchen−1.20 **(−2.26)−0.25 **(−2.25)
Natural ventilation of bedroom1.25 **(2.43)0.27 **(2.21)
Thermal isolation−0.77 *(−3.09)−0.16 *(−3.13)
Electrical repairs0.64 **(2.07)0.14 **(2.07)
Internet0.79 *(2.82)0.17 *(2.77)
Height of building0.31 ***(1.96)0.07 ***(1.65)
Identity 11.04 *(3.62)0.211 *(4.15)
Identity 41.13 *(3.78)0.23 *(3.82)
Attachment 11.11 *(2.77)0.22 *(2.80)
Attachment 31.16 *(2.89)0.23 *(2.80)
Dependence 10.50 **(2.25)0.09 **(2.33)
Dependence 20.47 **(2.11)0.09 **(2.11)
Dependence 4−0.94 *(−3.86)−0.18 *(−2.17)
Note: This table presents only the significant components of residential satisfaction. * Significant at 0.01 level. ** Significant at 0.05 level. *** Significant at 0.10 level.
Disclaimer/Publisher’s Note: The statements, opinions and data contained in all publications are solely those of the individual author(s) and contributor(s) and not of MDPI and/or the editor(s). MDPI and/or the editor(s) disclaim responsibility for any injury to people or property resulting from any ideas, methods, instructions or products referred to in the content.

