Abstract
The energy sector has been the main economic hub in everyone’s lives and in world geopolitics. Consequently, oil, gas, electricity and energy from renewable sources (wind and solar) are traded on the stock market, and all interconnected around the world. On the other hand, a global health crisis, such as COVID-19, can produce a great economic catastrophe. In this scenario, a robust statistical analysis will be performed here with respect to the concept of interdependence and contagion effect. For this project, we chose to study the relationship between the main source of energy (crude oil, WTI and Brent) and two (Gold and Silver) precious metals (which are a safe haven for investment). Therefore, with the novelty of the application of and coefficients before and during the COVID-19 crisis (announced by the World Health Organization), the interdependence and the contagion effect were calculated. We verified that COVID-19 had no influence on contagion effect between crude oil in its indexes, WTI and Brent, since they have already shown to be highly interdependent, both before and after the World Health Organization COVID-19 decree. Likewise, COVID-19 had a significant influence on the crude oil and precious metal sectors, which was evident as we identified an increase in its interdependence, with a clearly positive contagion. These results show that COVID-19 imposed a restructuring in the relationship between energy (crude oil) and precious metals. More details will be presented throughout this article.
1. Introduction
Globalization has led to the destruction of barriers to international investment in many countries in recent decades, this has caused greater integration, which led to a greater correlation (interdependence) between the stock markets of different countries. This interdependence is often useful during periods of calm, but in periods of crisis, it can make it difficult to diversify portfolios efficiently [1,2]. Economic crises generate difficulties in the maintenance and sustainability of social structures, leading in the majority of cases to unemployment, shortages, inflation and hunger, among other things [3]. Therefore, the benefits of diversifying international financial portfolios have been put to the test, mainly due to various crises in the financial markets [2,4,5,6]. The correlation and transmission of crises has been discussed frequently in recent decades, especially after the 2008 financial crisis [7,8,9]. In this sense, knowledge concerning the form and the intensity of the interdependence between different financial markets is vital for efficient decision making, the assessment of the financial health of a market and the identification of diversification opportunities to minimize the adverse effect of uncertainty on the expected return on investments. The relationship between interdependence and the contagion effect (caused by crises) is determined in this paper through an auto-correlation and cross-correlation analysis [9,10,11], which can also be measured.
We all know that oil, gas, electricity and energy from renewable sources (wind and solar) are traded on the stock market and are interconnected around the world. A global health crisis, such as COVID-19, can have drastic effects on the economy. Recent studies have analyzed the contagion effect caused by the COVID-19 pandemic, as can be seen in [12,13,14,15,16]. Therefore, a statistical analysis will be performed below with respect to the concept of interdependence and contagion effect. We chose to study the relationship between the main sources of energy (crude oil, WTI and Brent) and two (Gold and Silver) precious metals, because these are good economic indicators of a country’s well-being. With these indexes, we applied and coefficients, and thus measure the interdependence and the contagion effect caused by COVID-19.
2. Literature Review
Since the mid-2000s, international financial markets have been subject to a series of significant financial crises, including the subprime crisis (USA in 2008) and the sovereign debt crisis (Europe in 2010) [7]. Assessing the current state of financial integration and shocks between markets is also relevant from a point of view of cost versus benefit. The literature agrees that financial integration is beneficial in good times. However, in times of crisis, high financial integration increases the likelihood of contagion, due to the close interrelationships between financial markets caused by their proximity. In general, the benefits of financial integration are expected to outweigh the long-term costs [17].
Andriosopoulos et al. [18] investigated whether or not events during the European financial crisis affected energy prices. The authors studied contagion effects for energy/commodity prices, examined the nature of energy price volatility and investigated whether or not the volatility of European Union stock markets spilled over, subsequently affecting the volatility of other energy/commodity markets. The authors show the existence of significant contagion effects in these stock markets, as well as significant changes in the nature of energy/commodity volatility during the 2010 financial crisis. Gunay [19] studied the influence of the 2020 global pandemic on six stock markets, noting the existence of contagion and structure breaks in most markets between the 19th and 21st of February 2020, while in the Chinese stock market, the break occurred on the 30th of January. Fang et al. [20] analyzed the contagion in emerging stock markets, during the period 2000–2016, using the impulse response method and dynamic conditional correlation (MGARCH) model. The authors show that the level of volatility in emerging stock markets was higher than in developed stock markets. Complementary, they suggest that emerging stock markets are significantly subjected to residual contagion during the US subprime mortgage crisis and Europe’s protracted debt crisis. Moreover, the residual contagion effects of these two crises are noticeably heterogeneous in emerging markets. Ghorbel and Jeribi [21] analyzed the contagion among the energy index, crude oil, gas prices and financial assets during the 2020 global pandemic crisis. Using the model ARMA-EGARCH, Ozturk and Cavdar [12] analyzed the contagion effect between Bitcoin, Gold and oil prices and exchange rates, as well as the connections between the volatilities of these variables during the COVID-19 pandemic. In a complementary way, Ghorbel and Jeribi [22] investigated the relationship between the volatilities of cryptocurrencies and other financial assets. In this case, the results of the BEKK-GARCH model show evidence of a higher volatility spillover between cryptocurrencies and lower volatility spillover between cryptocurrencies and financial assets. The results of the DCC-GARCH model identify an important effect of writing Bitcoin futures. During the period of stability, the overarching implications of the results are that there is a persistent high positive value of correlation between cryptocurrencies and low dynamic conditional correlations between cryptocurrencies and financial assets. For these authors, Bitcoin and Gold were considered hedges for US investors before the COVID-19 crisis. Furthermore, the authors show that cryptocurrencies can offer diversification benefits for investors and are diversified during the stability period. Malik et al. [23] measured the contagion effect during COVID-19 by considering the volatility spillovers of BRIC countries and using a diagonal BEKK approach.
More recently, Rastogi et al. [13] studied the contagion effect among Gold, crude oil and interest rates to investigate the volatility integration of Gold and crude oil prices with the interest rates in India, in the period from 30 November 2015 to 16 November 2020. The authors show the existence of long-term conditional correlations between Gold and interest rates, but there is no evidence of the spillover volatility of Gold and crude oil on interest rates. Marwanti and Robiyanto [14] analyzed the oil and Gold price volatility on the Indonesian stock market during the COVID-19 pandemic using the GARCH (1,1) model. The results showed that Gold was a safe haven during the 2020 pandemic. Mishra et al. [15] analyzed the causal relationships between spot and future prices of crude oil and Gold by applying tests of rolling, recursive evolving and asymmetric causality. The authors show that there are causal relationships for both crude oil and Gold prices. Saijai et al. [16] examined the contagion effects among stock markets, treasury bills, oil, Gold, and Cryptocurrency during the COVID-19 crisis. The authors used multivariate models based on dynamic conditional correlations. Many other recent studies of financial contagion have been carried out.
3. Methods
The calculations in this paper are based on Detrended Fluctuation Analysis (DFA) [24] and Detrended Cross-Correlation Analysis (DCCA) [25]. These applications are justified by the fact that they can quantify the level of cross-correlation between two non-stationary time series (as in our case). The algorithm for implementing the DFA and DCCA methods is described below. Initially, for two non-stationary time series, and (price of the commodity), where (time series length), we perform the following computational steps.
Algorithm for DCCA computation:
- a
- Compute the integrated time series: and , with . Here, and are the means of x and y, respectively.
- b
- Divide the entire time series into overlapping boxes that each contain values.
- c
- For both time series, in each box that starts at i and ends at , compute the local trend, and , with , as the ordinate of a linear least-squares fit.
- d
- The covariance function in each box is calculated as follows:;
- e
- The detrended covariance function is computed as follows:;
- f
- Finally, steps b, c, d and e are repeated for the following time scales, .
As is the generalization of for two distinct time series ([25]), we can write:
Therefore, with the fluctuation function , it is possible to determine whether or not auto-correlation exists in time series with power-law between and the time scale n; in other words:
In this case, is defined as a self-affinity parameter that represents the long-range auto-correlation (see Table 1 below and [26]):

Table 1.
exponent and types of signals.
The DFA method is also able to identify seasonal components [27,28,29], and the amplitude of can be applied to classify or distinguish different types of signals [30].
To quantify the level of cross-correlation, the DCCA cross-correlation coefficient can be defined as the ratio between the detrended covariance function, , and the detrended variance function, [31]:
The value of has the following range:
In this case, means there is no cross-correlation, and it splits the level of cross-correlation between the positive case and the negative case. This coefficient has been tested on selected time series [32,33] and proved to be quite robust, mainly for the statistical analysis of non-stationary time series [34,35,36,37] and specifically for climatology [38,39], turbulent fluids [40,41] and geology [42], among other fields. For more information about the algorithm for DCCA computation, see the following YouTube video (in Portuguese): https://www.youtube.com/watch?v=RQL7Db74yG0&t=394s, accessed on 10 January 2023. With , it is possible to define the interdependence between two financial indexes (see [8]). However, if we want to measure the effect that a crisis has had on a financial market (and therefore on its index), the difference between the values of , separated by an amount of time (for example, the duration of crisis), is an excellent candidate. This difference will be defined here as follows:
where the values are separated by a given moment (e.g., crisis) denoted by :
- ✓
- is the value of the DCCA cross-correlation coefficient after;
- ✓
- is the value of the DCCA cross-correlation coefficient before.
With , it is possible to evaluate the transmission of contagion effects, both locally and globally, based on the assessment of values before and after a critical event () [9]. Therefore, by definition, can be positive or negative:
For more details, see [9,33,43].
Now, in order to measure the interdependence and the contagion effect (due to COVID-19) between crude oil (WTI and Brent) and precious metals (Gold and Silver), we present the data, results and discussion below.
4. Data, Results and Discussion
Here, we present the data used and the results obtained to discuss the interdependence between crude oil and precious metal indexes, as well as the contagion effect generated by COVID-19.
4.1. Data
We used the opening daily price indexes (in USD) for a barrel of West Texas Intermediate oil (WTI), a barrel of oil from Shell (Brent), a troy ounce of Gold and a troy ounce of Silver; these indexes are traded on the New York Stock Exchange (NYSE) in the United States of America and are described in Table 2.
Table 2.
Commodities and unit price (in USD).
The indexes were collected for the period from 2 January 2018 to 23 May 2022, from the public Yahoo finance database: https://finance.yahoo.com/, accessed on 24 June 2022. The classic behavior of these indexes during the referred period of study can be seen in Figure 1.
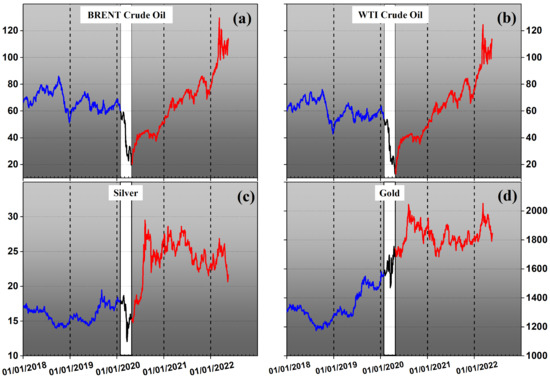
Figure 1.
Price (USD) as a function of time for: (a) Brent crude oil (barrel); (b) WTI crude oil (barrel); (c) Silver (troy ounce); and (d) Gold (troy ounce).
Considering the COVID-19 statement made by the World Health Organization (WHO) on 11 March 2020, we deliminate three time periods, which are represented by the blue, black and red curves in Figure 1:
- Period I from 2 January 2018 to 9 February 2020 (before the WHO COVID-19);
- Period II from 10 February 2020 to 10 March 2020 ( with 61 days);
- Period III from 11 March 2020 to 23 May 2022 (after the WHO COVID-19).
Our decision to consider these time periods was due to the fact that this COVID-19 announcement was a worldwide event, with the effects of this announcement propagating throughout the world in a few days. With these time periods defined, we have an amount of quotations equal to before (Period I) and after (Period III), with 519 working days. From Figure 1, it is possible to see the performance of these indexes, before and after the announcement concerning COVID-19. With this structure in place, we can now ask the following questions:
- Is there interdependence between Brent, WTI, Silver and Gold?
- How did the contagion effect caused by COVID-19 impact this interdependence?
These two questions are answered below.
4.2. Results
First, we performed an auto-correlation analysis, using the DFA method, for the entire study period, which we will refer to from here on as All, for Period I (before the COVID-19 announcement) and for Period III (after the COVID-19 announcement). As we performed a comparison among the indexes, we applied the returns, defined as follows:
where is the price of the commodity on day t. A brief descriptive statistic of the return was calculated, see Appendix A. These results show that the mean values are close to zero (as expected), whereas for the Period III, the standard deviation (sd), Kurtosis and Skewness, are more distant from stationary case, if compared with Period I.
Then, we calculated for each commodity (Gold, Silver, WTI and Brent), and we checked the relation . The values of for this case are presented in Table 3.
Table 3.
DFA exponents for Gold, Silver, WTI and Brent. These results are reported for three time periods surrounding the WHO announcement of the COVID-19 pandemic: Before (Period I), After (Period III) and All (entire time period). The error found for is at most .
From the auto-correlation results presented in Table 3, we can see that there is a clear change in the value of the exponent depending on the time period. The value of increased from Period I to Period III for precious metals (within the margin of error of ). In the case of crude oil, this value decreased from Period I (∼0.50) to Period III (∼0.38) for both WTI and Brent. In the last column of Table 3, for the entire time period is shown; it indicates a great proximity between WTI and Brent, with a little persistence. For precious metals, during this time period, there is an anti-persistence condition, with Gold being the smallest one. We can see that the exponent changed depending on the time period being analyzed. However, this exponent cannot be used to verify the interdependence or the contagion effect caused by COVID-19.
To determine the degree of interdependence, we will now calculate the DCCA cross-correlations between all indexes. Therefore, the six possible combinations of the four commodities are presented below:
| (a) Brent × WTI | (b) Gold × Silver | (c) Brent × Silver |
| (d) WTI × Silver | (e) Brent × Gold | (f) WTI × Gold |
The main objective of this paper is to measure the contagion effect caused by COVID-19, in addition to the aforementioned combinations of commodities and the results for each of the considered time intervals, namely, the entire time period (All), the time period before the WHO COVID-19 announcement (Before, Period I) and the time period after the WHO COVID-19 announcement (After, Period III). Initially, if there is interdependence between commodity pairs, , there can be positive (one commodity follows the other) or negative interdependence (one commodity is contrary to the other).
The results for the DCCA cross-correlation coefficient between commodities are shown in Figure 2, which shows as a function of n (days) for the six possible commodity pairs.
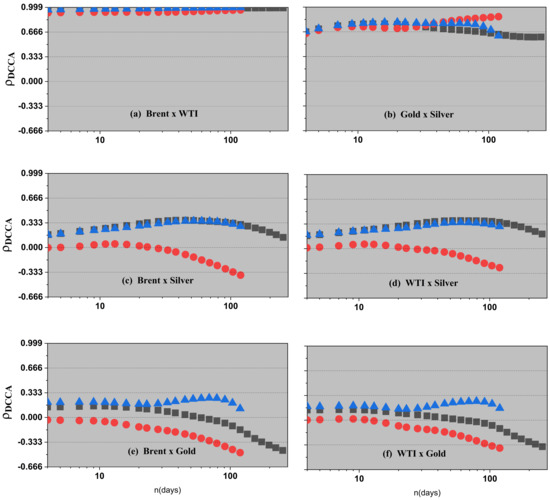
Figure 2.
as a function of n for: (a) Brent × WTI, (b) Gold × Silver, (c) Brent × Silver, (d) WTI × Silver, (e) Brent × Gold and (f) WTI x Gold. The black symbols (■) correspond to the entire time period, the red symbols (●) correspond to Period I, and blue symbols (▴) correspond to Period III. The horizontal dotted lines correspond to the level of DCCA cross-correlation (weak, medium or strong), which can be positive or negative.
From Figure 2, for the entire time period (All, ■), we can see that interdependence between commodities exists, because . For WTI × Brent (Figure 2a), , which represents a perfect DCCA cross-correlation (maximum interdependence). In the case of Gold × Silver (Figure 2b), there is strong positive interdependence up to the time scale of approximately 90 days, where there is a small decrease to a medium level of cross-correlation. The cross-correlation between crude oil and precious metals, presented in Figure 2c–f, are particularly interesting: Brent × Silver (Figure 2c) and (WTI × Silver Figure 2d): The DCCA cross-correlation coefficient is in the following range: . Brent × Gold (Figure 2e) and WTI × Gold (Figure 2f): We can identify the same type of behavior that is shown between crude oil and Silver for small time scales, but for large time scales, tends to have negative values.
To assess the contagion effect of COVID-19 for these commodities, we applied to each pair of indexes for Period I (●) and Period III (▴); this can be seen in Figure 2. It can be seen that, for most commodity pairs, there was an increase in the DCCA cross-correlation if we compare Period I with Period III. To measure the contagion effect caused by COVID-19, we can apply Equation (3) to calculate by dividing the total time into two intervals and comparing the values. Figure 3 shows the values of .
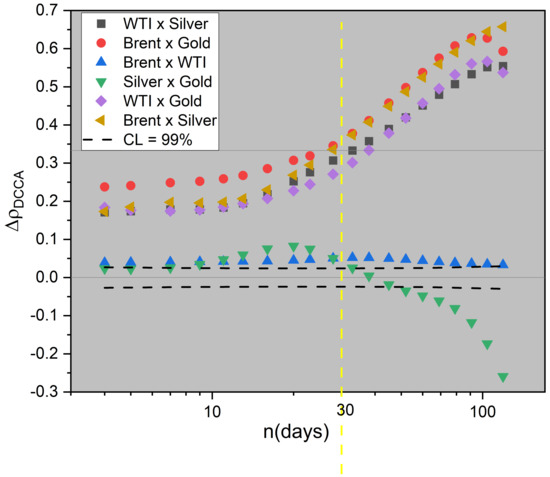
Figure 3.
as a function of the time scale n. Based on [33], dash lines denote the rejection limits of the null hypotheses at 99% of confidence level.
It can be seen that for most commodity pairs, there is an increase in the DCCA cross-correlation, because . This fact indicates that the contagion effect related to COVID-19 exists; in addition, the DCCA coefficient can be used to quantify its level. An exception (negative ) is found for the cross-correlation between Gold and Silver and time scales days (see the vertical dashed line in Figure 3). The values for:
showed similar dynamics, that is, for all time scales, and indicates a positive change from , which is highlighted by the yellow dashed vertical line. Notably, the relationship between Brent and WTI shows for all time scales, indicating that there was no contagion effect. This is because these commodities already had and continued to have an approximately perfect DCCA cross-correlation, regardless of COVID-19. The time scale (days) in this context is associated with some type of stock market behavior that occurs on this time scale.
4.3. Discussion
Economic and financial crises, such as the one caused by COVID-19, have had significant impacts on economic, social and environmental systems due to the many connections between these systems [44]. In view of this increase in globalization, financial markets have become increasingly narrow and dependent on each other, with connections between the economic sector and other sectors. The analysis of energy stock markets, with an emphasis on crude oil (WTI and Brent), and traditional stock markets with an emphasis on precious metals (Gold and Silver), can help us to understand the interactive dynamics of financial transactions, serving as a reference for extrapolating this context, in addition to presenting the possibility of metals being safe havens compared to crude oil. Figure 1 shows the similarities in the behavior of crude oil price indexes.
The DFA method is suitable for auto-correlation analysis in non-stationary time series, and its exponent, , measures the persistence of these time series. For the returns, we confirm that , and the values of the auto-correlation exponent are shown in Table 3.
However, these dynamics cannot be used to determine the level of interdependence or the contagion effect between pairs of commodities. We need a deeper and more robust evaluation metric, such as the DCCA cross-correlation coefficient, , which is presented in Figure 2. In general, this coefficient indicated that the interdependence increased after the COVID-19 crisis began, except for the commodity pair containing both precious metals.
Regarding the contagion effect caused by COVID-19, which was also analyzed in [12,21], in this paper, it was clearly measured using , as shown in Figure 3. Therefore, based on and , we can now answer the questions posed in Section 4.1:
(i) We can make the following statements about the interdependence:
- There is maximum interdependence between Brent and WTI, because .
- There is strong interdependence between Gold and Silver, because .
- There is weak interdependence between Brent and Silver and WTI and Silver, because .
- There is no interdependence between Brent and Gold and WTI and Gold, because for time scales (days).
(ii) We can make the following statements about the contagion effect caused by COVID-19 by comparing Period I and Period III:
- Generally, , which indicates that there is a contagion effect between the considered commodities.
- For Brent × WTI, the contagion effect proved to be null, as ; this is because these commodities had a maximum interdependence.
- For Gold × Silver, the contagion effect is null for time scales .
5. Conclusions
The main types of energy are oil, gas, electricity and energy from renewable sources (wind and solar). These energies, for the most part, are traded on the stock market and are interconnected around the world. With a global health COVID-19 crisis, at the start of 2020, the stock market was faced with a disastrous crisis. In this scenario, in this paper, we have performed a statistical analysis with respect to the concept of interdependence and also contagion effect. For this project, we chose to study the relationship between the main source of energy (crude oil) and two precious metals. Therefore, with the novelty of the application of the and coefficients before and during the COVID-19 crisis, the interdependence and the contagion effect were calculated. By using and , it is possible to assess the interdependence and the contagion effect between crude oil and precious metals against the backdrop of the economic crisis caused by COVID-19. In this paper, we verified that COVID-19 had no contagion effect on the interdependence of the crude oil indexes, WTI and Brent, since they were already highly interdependent. Likewise, COVID-19 had a significant influence on the crude oil and precious metal sectors, which was evident as we identified an increase in interdependence, with a clearly positive contagion. These results show that COVID-19 imposed a restructuring in the relationship between energy (crude oil) and precious metals. Finally, our results show that COVID-19 imposed a restructuring in the relationship between the energy and precious metals sectors, that is, there is an increase in interdependence between these commodities, measured with a positive contagion using the coefficient. As a future application, this project can be an important basis for questions related to government policies and energy security issues, such as the war between Russia and Ukraine.
Author Contributions
All authors have contributed equally. All authors have read and agreed to the published version of the manuscript.
Funding
The APC was funded by CEFAGE (University of Évora).
Institutional Review Board Statement
Not applicable.
Informed Consent Statement
Not applicable.
Data Availability Statement
The data is found in: https://finance.yahoo.com/.
Acknowledgments
G. F. Zebende thanks the Brazilian agency CNPq (Conselho Nacional de Desenvolvimento Científico e Tecnológico) (Grant 310136/2020-2). Rui Dias is pleased to acknowledge the financial support from Fundação para a Ciência e a Tecnologia (Grant UIDB/04007/2020). We would also like to thank Chico Mendes, rubber tapper, political activist and Brazilian environmentalist (in memoriam).
Conflicts of Interest
The authors declare no conflict of interest.
Abbreviations
The following abbreviations are used in this manuscript:
| MDPI | Multidisciplinary Digital Publishing Institute |
| DOAJ | Directory of open access journals |
| WHO | World Health Organization |
| DFA | Detrended Fluctuation Analysis |
| DCCA | Detrended Cross-Correlation Analysis |
| NYSE | New York Stock Exchange |
| COVID-19 | Coronavirus disease 2019 |
Appendix A. Descriptive Statistic
In Figure A1, we have a brief descriptive statistic of the returns for: WTI, Brent, Gold and Silver commodities traded on the New York Stock Exchange.

Figure A1.
Descriptive statistic of the return for WTI, Brent, Gold and Silver.
Figure A1.
Descriptive statistic of the return for WTI, Brent, Gold and Silver.

References
- Alvarez-Ramirez, J.; Alvarez, J.; Rodriguez, E. Short-term predictability of crude oil markets: A detrended fluctuation analysis approach. Energy Econ. 2008, 30, 2645–2656. [Google Scholar] [CrossRef]
- Dias, R.; Alexandre, P.; Heliodoro, P.; Santos, H.; Farinha, A.; Santos, M. The 2020 Oil Price War Has Increased Integration Between G7 Stock Markets and Crude Oil WTI. In 7th ERAZ Selected Papers (Part of ERAZ Conference Collection); Association of Economists and Managers of the Balkans: Belgrade, Serbia, 2021; pp. 13–25. [Google Scholar] [CrossRef]
- COVID-19 Job and Income Loss Leading to More Hunger and Financial Hardship. Available online: https://www.brookings.edu/blog/up-front/2020/07/13/COVID-19-job-and-income-loss-leading-to-more-hunger-and-financial-hardship/ (accessed on 5 October 2022).
- Dias, R.; Da Silva, J.; Dionisio, A. Financial markets of the LAC region: Does the crisis influence the financial integration? Int. Rev. Financ. Anal. 2019, 63, 160–173. [Google Scholar] [CrossRef]
- Dias, R.; Pereira, J.; Carvalho, L. Are African Stock Markets Efficient? A Comparative Analysis Between Six African Markets, the UK, Japan and the USA in the Period of the Pandemic. Nase Gospod. Econ. 2022, 68, 35–51. [Google Scholar] [CrossRef]
- Zebende, G.; Santos Dias, R.; De Aguiar, L. Stock market efficiency: An intraday case of study about the G-20 group. Heliyon 2022, 8, e08808. [Google Scholar] [CrossRef] [PubMed]
- Wong, D.; Li, K.W. Comparing the performance of relative stock return differential and real exchange rate in two financial crises. Appl. Financ. Econ. 2010, 20, 137–150. [Google Scholar] [CrossRef]
- Reboredo, J.C.; Rivera-Castro, M.A.; Zebende, G.F. Oil and US dollar exchange rate dependence: A detrended cross-correlation approach. Energy Econ. 2014, 42, 132–139. [Google Scholar] [CrossRef]
- Da Silva, M.F.; Pereira, É.J.d.A.L.; da Silva Filho, A.M.; de Castro, A.P.N.; Miranda, J.G.V.; Zebende, G.F. Quantifying the contagion effect of the 2008 financial crisis between the G7 countries (by GDP nominal). Phys. A Stat. Mech. Its Appl. 2016, 453, 1–8. [Google Scholar] [CrossRef]
- Forbes, K.; Rigobon, R. Measuring Contagion: Conceptual and Empirical Issues. In International Financial Contagion; Claessens, S., Forbes, K.J., Eds.; Springer: Boston, MA, USA, 2001; pp. 43–66. [Google Scholar] [CrossRef]
- Guedes, E.; Ferreira, P.; Dionísio, A.; Zebende, G. An econophysics approach to study the effect of BREXIT referendum on European Union stock markets. Phys. A Stat. Mech. Its Appl. 2019, 523, 1175–1182. [Google Scholar] [CrossRef]
- Ozturk, M.; Cavdar, S. The Contagion of COVID-19 Pandemic on The Volatilities of International Crude Oil Prices, Gold, Exchange Rates and Bitcoin. J. Asian Financ. Econ. Bus. 2021, 8, 171–179. [Google Scholar] [CrossRef]
- Rastogi, S.; Doifode, A.; Kanoujiya, J.; Singh, S. Volatility integration of gold and crude oil prices with the interest rates in India. South Asian J. Bus. Stud. 2021. ahead-of-print. [Google Scholar] [CrossRef]
- Marwanti, M.; Robiyanto, R. Oil and Gold Price Volatility on Indonesian Stock Market in the Period of COVID-19 Pandemic. J. Manaj. Dan Kewirausahaan 2021, 23, 129–137. [Google Scholar] [CrossRef]
- Mishra, A.; Ghate, K.; Renganathan, J.; Kennet, J.; Rajderkar, N. Rolling, recursive evolving and asymmetric causality between crude oil and gold prices: Evidence from an emerging market. Resour. Policy 2022, 75, 102474. [Google Scholar] [CrossRef]
- Saijai, W.; Maneejuk, P.; Sriboonchitta, S. Contagion Effects Among Stock Markets, Treasury Bill, Petroleum, Gold, and Cryptocurrency During the COVID-19 Pandemic: A Dynamic Conditional Correlation Approach. In Prediction and Causality in Econometrics and Related Topics; Springer International Publishing: Cham, Switzerland, 2022; Volume 983, pp. 514–529. [Google Scholar] [CrossRef]
- Babecky, J.; Komarek, L.; Komarkova, Z. Financial Integration at Times of Crisis and Recovery. In Economic Imbalances and Institutional Changes to the Euro and the European Union; Emerald Publishing Limited: Bingley, UK, 2017; pp. 173–191. [Google Scholar] [CrossRef]
- Andriosopoulos, K.; Galariotis, E.; Spyrou, S. Contagion, Volatility Persistence, and Volatility Spill-Overs: The Case of Energy Markets During the European Financial Crisis. SSRN Electron. J. 2016. [Google Scholar] [CrossRef]
- Gunay, S. A New Form of Financial Contagion: COVID-19 and Stock Market Responses. SSRN Electron. J. 2020. [Google Scholar] [CrossRef]
- Fang, M.; Yang, S.; Lei, Y. Residual contagion in emerging markets: Herd and alarm effects in informatization. Electron. Commer. Res. 2021, 21, 787–807. [Google Scholar] [CrossRef]
- Ghorbel, A.; Jeribi, A. Volatility spillovers and contagion between energy sector and financial assets during COVID-19 crisis period. Eurasian Econ. Rev. 2021, 11, 449–467. [Google Scholar] [CrossRef]
- Ghorbel, A.; Jeribi, A. Investigating the relationship between volatilities of cryptocurrencies and other financial assets. Decis. Econ. Financ. 2021, 44, 817–843. [Google Scholar] [CrossRef]
- Malik, K.; Sharma, S.; Kaur, M. Measuring contagion during COVID-19 through volatility spillovers of BRIC countries using diagonal BEKK approach. J. Econ. Stud. 2021, 49, 227–242. [Google Scholar] [CrossRef]
- Peng, C.K.; Buldyrev, S.V.; Havlin, S.; Simons, M.; Stanley, H.E.; Goldberger, A.L. Mosaic organization of DNA nucleotides. Phys. Rev. E 1994, 49, 1685–1689. [Google Scholar] [CrossRef]
- Podobnik, B.; Stanley, H.E. Detrended Cross-Correlation analysis: A new method for analyzing two nonstationary time series. Phys. Rev. Lett 2008, 100, 1–4. [Google Scholar] [CrossRef]
- Walleczek, J. Self-organized Biological Dynamics and Nonlinear Control; Cambridge University: Cambridge, UK, 2000. [Google Scholar] [CrossRef]
- Zebende, G.; Filho, A.M. Cross-correlation between time series of vehicles and passengers. Phys. A Stat. Mech. Its Appl. 2009, 388, 4863–4866. [Google Scholar] [CrossRef]
- Zebende, G.F.; Fernandez, B.F.; Pereira, M.G. Analysis of the variability in the sdB star KIC 10670103: DFA approach. Mon. Not. R. Astron. Soc. 2017, 464, 2638–2642. [Google Scholar] [CrossRef]
- Filho, A.M.; da Silva, M.; Zebende, G. Autocorrelation and cross-correlation in time series of homicide and attempted homicide. Phys. A Stat. Mech. Its Appl. 2014, 400, 12–19. [Google Scholar] [CrossRef]
- Oliveira Filho, F.; Cruz, J.L.; Zebende, G. Analysis of the EEG bio-signals during the reading task by DFA method. Phys. A Stat. Mech. Its Appl. 2019, 525, 664–671. [Google Scholar] [CrossRef]
- Zebende, G. DCCA cross-correlation coefficient: Quantifying level of cross-correlation. Phys. A Stat. Mech. Its Appl. 2011, 390, 614–618. [Google Scholar] [CrossRef]
- Zebende, G.; Da Silva, M.; Machado Filho, A. DCCA cross-correlation coefficient differentiation: Theoretical and practical approaches. Phys. A Stat. Mech. Its Appl. 2013, 392, 1756–1761. [Google Scholar] [CrossRef]
- Guedes, E.; Brito, A.; Oliveira Filho, F.; Fernandez, B.; de Castro, A.; da Silva Filho, A.; Zebende, G. Statistical test for ΔρDCCA cross-correlation coefficient. Phys. A Stat. Mech. Its Appl. 2018, 501, 134–140. [Google Scholar] [CrossRef]
- Podobnik, B.; Jiang, Z.Q.; Zhou, W.X.; Stanley, H.E. Statistical tests for power-law cross-correlated processes. Phys. Rev. E 2011, 84, 066118. [Google Scholar] [CrossRef]
- Kristoufek, L. Measuring cross-correlation between non-stationary series with DCCA coefficient. Phys. A Stat. Mech. Its Appl. 2014, 402, 291–298. [Google Scholar] [CrossRef]
- Zebende, G.; Brito, A.; Castro, A. DCCA cross-correlation analysis in time-series with removed parts. Phys. A Stat. Mech. Its Appl. 2019, 545, 123472. [Google Scholar] [CrossRef]
- Cao, G.; He, C.; Xu, W. Effect of Weather on Agricultural Futures Markets on the Basis of DCCA Cross-Correlation Coefficient Analysis. Fluct. Noise Lett. 2016, 15, 1650012. [Google Scholar] [CrossRef]
- Vassoler, R.; Zebende, G. DCCA cross-correlation coefficient apply in time series of air temperature and air relative humidity. Phys. A Stat. Mech. Its Appl. 2012, 391, 2438–2443. [Google Scholar] [CrossRef]
- Zebende, G.; Brito, A.; Silva Filho, A.; Castro, A. ρDCCA applied between air temperature and relative humidity: An hour/hour view. Phys. A Stat. Mech. Its Appl. 2018, 494, 17–26. [Google Scholar] [CrossRef]
- Santos, F.R.; Brito, A.; de Castro, A.; Almeida, M.; da Cunha Lima, A.; Zebende, G.; da Cunha Lima, I. Detection of the persistency of the blockages symmetry influence on the multi-scale cross-correlations of the velocity fields in internal turbulent flows in pipelines. Phys. A Stat. Mech. Its Appl. 2018, 509, 294–301. [Google Scholar] [CrossRef]
- Brito, A.; Santos, F.R.; de Castro, A.; da Cunha Lima, A.; Zebende, G.; da Cunha Lima, I. Cross-correlation in a turbulent flow: Analysis of the velocity field using the ρ DCCA coefficient. EPL Europhys. Lett. 2018, 123, 20011. [Google Scholar] [CrossRef]
- Marinho, E.; Sousa, A.; Andrade, R. Using Detrended Cross-Correlation Analysis in geophysical data. Phys. A Stat. Mech. Its Appl. 2013, 392, 2195–2201. [Google Scholar] [CrossRef]
- Inacio, C.M.C.; David, S.A. Price Dynamics and Measuring the Contagion between Brent Crude and Heating Oil (US-Diesel) Pre and Post COVID-19 Outbreak. In Proceedings of the ITISE 2022; MDPI: Basel, Switzerland, 2022. [Google Scholar] [CrossRef]
- Paitan, C.P.; Verburg, P. Methods to Assess the Impacts and Indirect Land Use Change Caused by Telecoupled Agricultural Supply Chains: A Review. Sustainability 2019, 11, 1162. [Google Scholar] [CrossRef]


Disclaimer/Publisher’s Note: The statements, opinions and data contained in all publications are solely those of the individual author(s) and contributor(s) and not of MDPI and/or the editor(s). MDPI and/or the editor(s) disclaim responsibility for any injury to people or property resulting from any ideas, methods, instructions or products referred to in the content. |
© 2023 by the authors. Licensee MDPI, Basel, Switzerland. This article is an open access article distributed under the terms and conditions of the Creative Commons Attribution (CC BY) license (https://creativecommons.org/licenses/by/4.0/).