Article

Experimental Study on the Mechanical Behavior of Sandy Soil Reinforced by Disposable Face Mask Chips under Different Stress Paths

School of Resources and Safety Engineering, Central South University, Changsha 410083, China
*
Author to whom correspondence should be addressed.
Sustainability 2023, 15(5), 4059; https://doi.org/10.3390/su15054059
Submission received: 8 February 2023 / Revised: 21 February 2023 / Accepted: 21 February 2023 / Published: 23 February 2023
(This article belongs to the Special Issue Construction Materials for Safe and Sustainable Built Structures)

Abstract

:
Since 2020, with the global spread of major respiratory infectious diseases, such as COVID–19, the demand and consumption of personal protective equipment, such as masks, have increased dramatically worldwide. The environmental pollution caused by numerous waste disposable face masks has gradually attracted people’s attention. In this study, the mechanical properties of mask–chip–reinforced soil are evaluated from a new perspective, through the uniaxial, biaxial, conventional triaxial, and true triaxial compression tests on reshaped sandy soil samples mixed with different contents of mask chips. The experimental results show that the mechanical properties of the sandy soil can be improved by the mask chips. With the proper content of mask chips, the failure strength is substantially improved, and the failure of soil is delayed. Meanwhile, the strength and stiffness are significantly affected by the stress path and the content of mask chips, even if the soil samples with the same mask–chip content can also show different mechanical properties under different stress paths. Additionally, the mechanical properties of soil are not necessarily improved constantly with the increasing content of mask chips. The failure strength of sandy soil samples under conventional and true triaxial stress paths decreases when the mass content of mask chips exceeds 0.3% and 0.5%, respectively. This study confirms the potential of mask chips applied to subgrade, slope, and other engineering construction fields in a sustainable way.

1. Introduction

In recent years, with the growth of the economy and acceleration of the industrialization process in developing countries, air pollution caused by toxic and harmful gases, such as industrial fumes, motor vehicle exhaust and waste incineration gas, has become more and more serious. Masks have become one of the main personal protective equipment for residents. Especially since the COVID–19 pandemic in 2020, in order to stop the spread of the pandemic, many countries and governments have formulated a series of strict epidemic prevention measures, including mandatory wearing of masks in public places and the consumption of personal protective equipment, such as disposable masks, has surged worldwide. It is estimated that 129 billion face masks are consumed globally every month, and the large number of discarded masks can easily cause secondary pollution if not handled properly [1]. Disposable masks can degrade into microplastic particles under the action of environmental factors, endangering the ecological balance and biological life safety [2,3,4]. More importantly, improper disposal methods can also lead to other solid waste being contaminated by pathogens carried on masks, thereby increasing the risk of epidemic spread [5,6].
At present, there are two main recycling methods for waste masks: one is high–temperature incineration, which burns waste masks together with other urban domestic wastes. However, the toxic substances released during the burning may cause environmental pollution, and the chemical energy stored in masks cannot be utilized. The other one is landfilling degradation, which decomposes the mask polymer through microorganisms in the soil, but this process is relatively slow and it is easy to cause secondary pollution of the soil [7,8]. To sum up, the existing recycling methods of disposable medical masks have their own limitations, and none of them can properly dispose of discarded disposable masks. Therefore, it is of great significance to accelerate the development and promotion of a novel safe and green recycling technology for disposable masks to reduce the environmental pollution and promote sustainable development.
Using recycled masks as composite materials in civil and traffic engineering construction is a good way to reduce environmental pollution and resource waste caused by discarded masks [9,10]. The main component of disposable medical mask fabric is polypropylene microfiber non–woven fabric, and the properties of polypropylene and other fiber materials can strengthen soil and building materials, which has been confirmed by extensive research and provides the possibility of recycling discarded masks as reinforcement materials [11,12,13,14]. Idrees et al. [15] mixed the waste mask fiber with concrete aggregate and pointed out that the compressive strength and durability of concrete can be improved when the content of waste mask is in the range of 0.5–1.0% by volume. Zhang et al. [16] performed a series of monotonic and cyclic triaxial tests on the mask–chip (MC) reinforced granular soil. The research indicated that the addition of mask chips (MCs) can improve the shear strength and energy absorption capacity of granular soil and reduce its dilatancy and stiffness. Xu et al. [17] conducted a series of consolidated–drained (CD) triaxial tests at different confining pressures on samples mixed with complete decomposed granite and mask chips, and observed the samples with scanning electron microscopy (SEM). The research found that the soil strength was improved significantly when the volumetric content of mask chips was between 0.3% and 1.0% at high confining pressure. Scanning electron microscopy images showed that the interlocking structure between mask fibers and soil particles limited the displacement of soil particles.
However, previous studies on MC reinforced soil are mainly based on unconfined compression tests and conventional triaxial compression tests, and the corresponding experimental conditions are all axisymmetric (σ2 = σ3) stress states, which cannot fully reproduce the mechanical behavior of MC reinforced soil in practical engineering. To date, the mechanical properties of MC reinforced soil under biaxial and true triaxial stress have been rarely reported. In addition, the tested soil adopted in previous studies is mostly fine–grained soil or clay. Due to the differences between sandy soil and fine–grained soil in terms of particle size gradation, particle strength, permeability, and other physical and mechanical properties [18], the strengthening effect of MCs on sandy soil remains to be evaluated.
In this study, a true triaxial testing system is used to conduct a series of uniaxial, biaxial, conventional triaxial and true triaxial compression tests on the reinforced soil samples with different MCs contents (i.e., 0%, 0.1%, 0.3%, 0.5%, and 0.7% by mass) for the first time, focusing on the evolution characteristics of stress–strain, strength, deformation, and energy absorption of the sandy soil samples under different stress paths. Subsequently, the potential of MCs as the reinforcement material is evaluated and the optimal mass content of MCs is explored in the hope of providing reference for the application of MC reinforcement technology in the field of geotechnical engineering, such as roadbed construction, foundation reinforcement, and slope treatment.

2. Materials and Methods

2.1. Tested Materials

The soil sample adopted in this study is air–dried sandy soil sampled from a brick factory in Meishan, Sichuan Province, China. It is a brown–yellow color. The grading curve of the soil was measured by the screening method shown in Figure 1. The basic physical properties of the sandy soil are listed in Table 1. According to the standard of ASTM D2487 [19], the sandy soil is classified as well–graded sand (SW).
The disposable medical surgical face masks used in this study are consisted of mask bodies (including nose clip) and ear bands, produced by HenanTijian Medical Equipment Co., LTD, in Changyuan, China. The mask body is a three–layer structure. The middle layer is a filter layer made of polypropylene melt–blown cloth, and the other layers are made of spunbonded hot–rolled nonwovens. The size of the whole mask after unfolding is 175 mm × 95 mm. Considering the relatively large size of the whole mask compared with the sample size, to ensure the mask fiber having a good contact with the soil particles and to maintain an approximate aspect ratio relative to the fully unfolded mask, we cut the masks removing ear bands and nose clips into MCs with a cross–section size of 10 mm × 5 mm as suggested by Ghadr et al. [20]. Since disposable medical surgical face masks produced in mainland China are all subject to YY 0469–2011 [21], their specifications and physical properties are similar. According to the test results of Bi et al. [22], the specific gravity, water absorption rate, tensile strength, and elongation at break of disposable medical face masks are 0.93, 9.5%, 4.52 MPa, and 20.6%, respectively.

2.2. Sample Preparation

The sandy soil particles went through a 2-mm sieve and put into a basin, then water was evenly sprayed on the soil surface. The water content of soil was set to 15%, and its dry density was set to 1.74 g/cm3 corresponding to 90% of the maximum dry density. The masses of the soil particles and the added water were controlled by an electronic balance. After adding water, the soil basin was covered with plastic wrap and then sealed. Finally, the soil basin was put into a constant temperature and humidity box for curing about 24 h to ensure that the water was evenly distributed in the soil sample. According to the study of Garg et al. [27], the strength of polypropylene fiber reinforced soil is most sensitive to the water content. In order to ensure that the difference of water content among samples does not have a significant impact on the test results, the water content of soil should be tested before sample preparation. If the deviation exceeds 0.1%, the water content should be adjusted until it meets the requirement. To avoid the influence of moisture contained in the reinforcement material on the water content of sample, the mask chips used in this study had been dried in the oven at 105 °C for 24 h in advance.
Figure 2 shows the process of sample preparation. The prepared soil was mixed with MCs of a certain mass, and the MCs were evenly and randomly distributed in the soil sample through visual inspection. The content of mask–chip fibers (fm) included in a sample is defined as:
f m   ( % ) = m f m s × 100
where mf and ms are the mass of fiber and dry soil, respectively. Regarding to the optimal content of reinforced fiber, An et al. [28] believed that the optimal mass content of polypropylene fiber was 0.5% based on the results of the direct shear test and disintegration test of reinforced loess. Chen et al. [29] pointed out that the unconfined compressive strength of fiber reinforced soil reached the peak value when the mass content of polypropylene fiber reached 0.5%. The triaxial test results of Lei et al. [30] showed that when the mass content of polypropylene fiber exceeded 1%, its strengthening effect decreased significantly. Accordingly, in this study we selected five levels of fm, i.e., 0%, 0.1%, 0.3%, 0.5%, and 0.7%. The MC reinforced soil was pressed into a cubic mold with the dimension of 100 mm × 100 mm × 100 mm in length, width, and height, respectively. To ensure compaction, following the standard of ASTM D2850 [31], the sample was compacted in 6 layers at a uniform speed. Afterwards, the sample was put into a constant temperature and humidity box for curing for 24 h.
All the samples are numbered, and their details are shown in Table 2. “C” and “P” in the sample name represent MC mass content and stress path, respectively. For example, C01PⅠ refers to the sample with fm of 0.1% under the uniaxial stress path.

2.3. Testing System

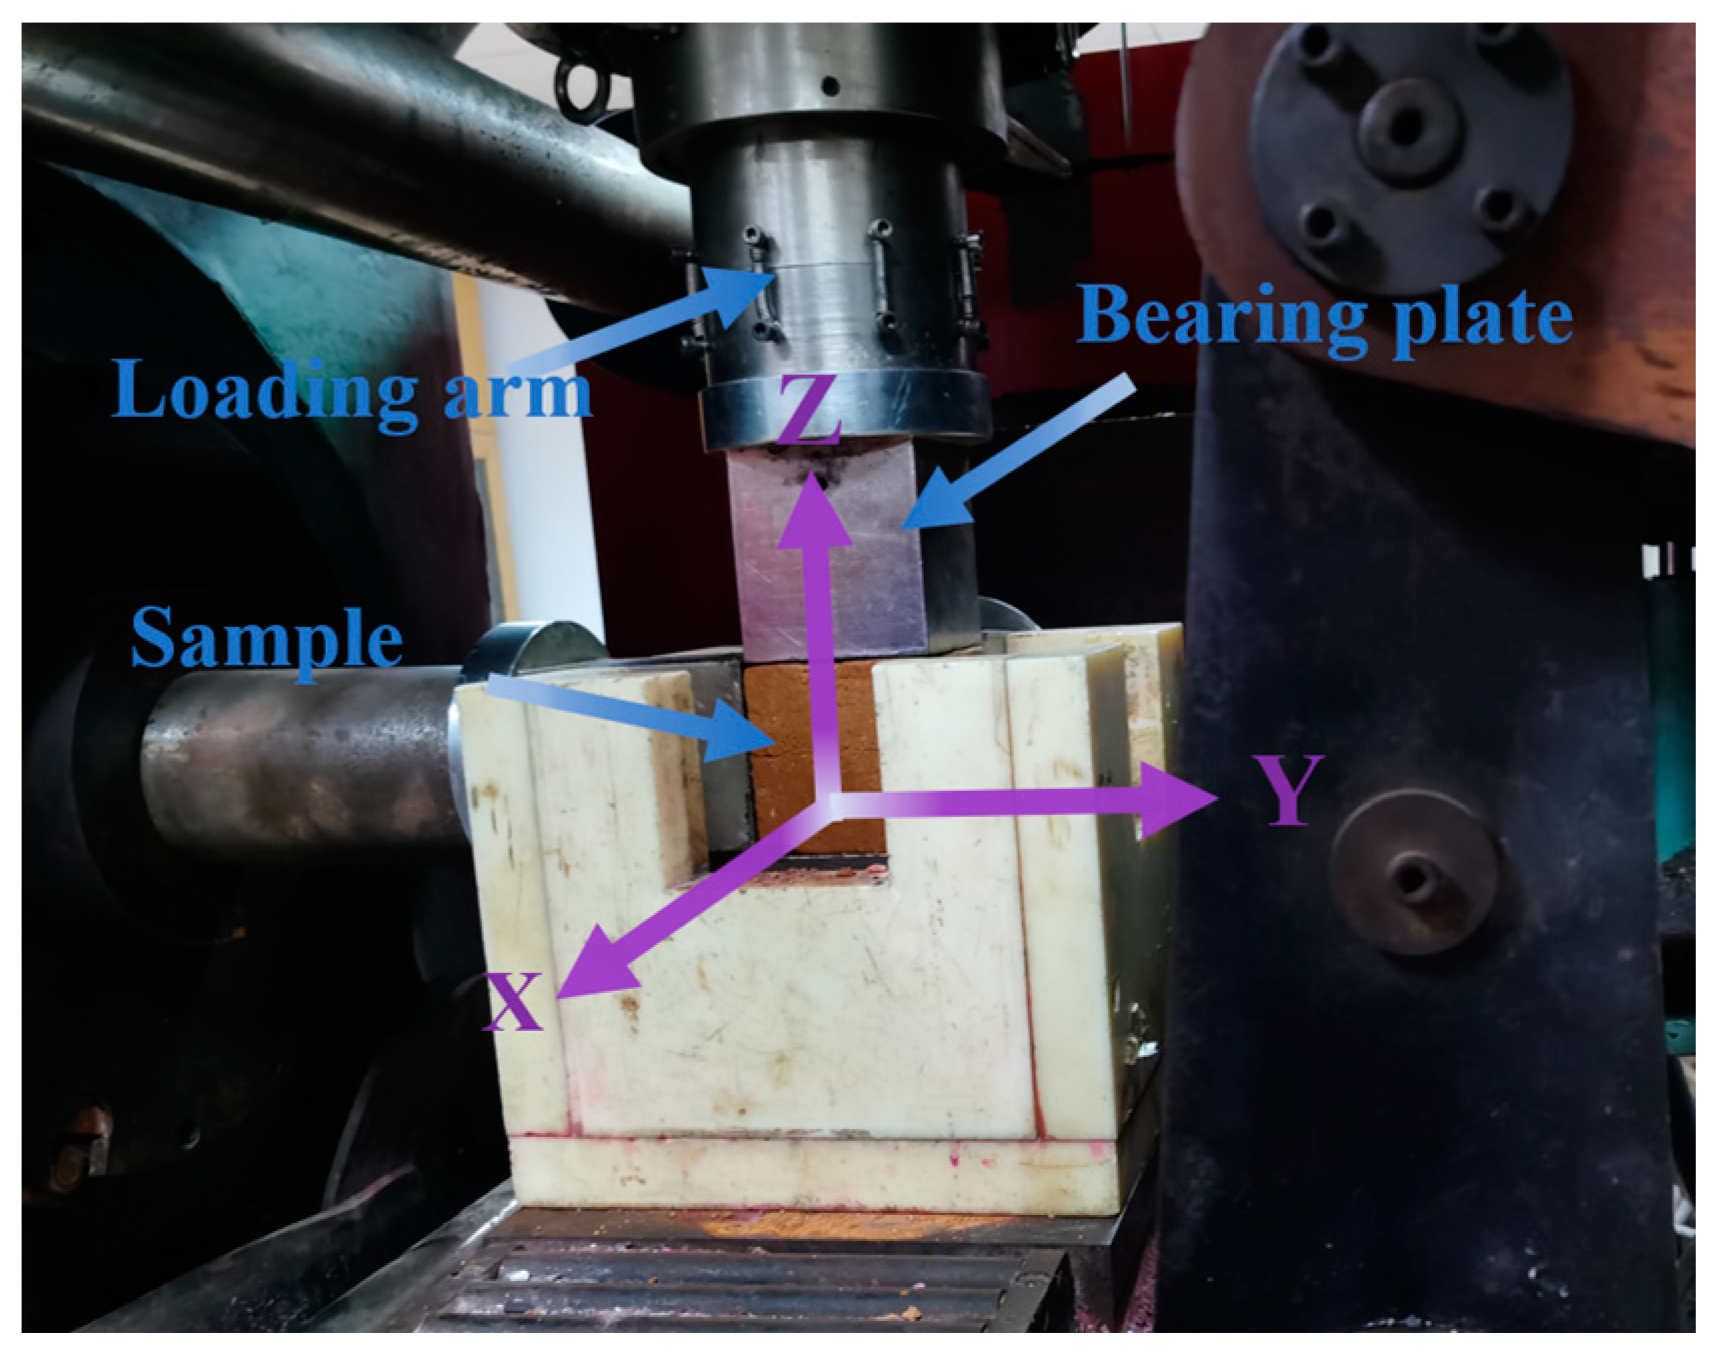
The self–developed TRW–3000 true triaxial test system at Central South University as shown in Figure 3 was used to conduct the compression tests under different stress paths. TRW–3000 test system is composed of main frame and servo control system. The loading modes in X, Y, and Z directions are independent hydraulic servo loading. The maximum loads in X, Y, and Z directions are 2000 kN, 2000 kN, and 3000 kN, respectively, and the loading rate varies in the range of 10 N/s to 10 kN/s. The force or displacement loading mode can be flexibly adjusted through the loading control software.
To prevent the collision between loading plates due to excessive deformation of the sample during loading, the cross–section area of the selected bearing plate is slightly smaller than that of the sample. Before the test, vaseline was smeared evenly on the bearing plate to reduce the friction between the sample and the bearing plate and to help unload the sample from the testing machine after loading.

2.4. Testing Procedure

The compression tests were carried out on MC–reinforced soil samples with five levels of fm. Four stress paths, such as uniaxial, biaxial, conventional triaxial, and true triaxial stress paths, were adopted to simulate the mechanical behaviors of MC reinforced soil under various working conditions. It is noted that if there is no obvious peak strength occurring, the axial stress corresponding to the axial strain of 15% is regarded as the failure strength of sample. The loading procedure and stress path of sample under uniaxial, biaxial, conventional triaxial, and true triaxial compression tests are described as follows.
(1)
Path I: uniaxial stress path
Following the standard of ASTM D2166 [32], the sample was only loaded in the Z direction, which was in an unconfined state as shown in Figure 4. However, different from the standard, the force control mode was adopted in the Z direction, and the sample was loaded at a speed of 10 N/s until failure. This uniaxial stress path can be used to study the strength and deformation behaviors of MC reinforced soil under unconfined conditions.
(2)
Path II: biaxial stress path
The sample in X, Y, and Z directions was simultaneously loaded at a speed of 10 N/s to 100 kPa, then in the X direction the loading mode was switched to the displacement control and the displacement velocity was adjusted to be zero (fixed) to simulate the plane strain state. Finally, the sample in the Y direction was unloaded and in the Z direction was loaded at a speed of 10 N/s until failure happened. The stress path of sample under the biaxial compression test is shown in Figure 5. Some geotechnical structures, such as slopes, retaining walls, and strip foundations, are usually subjected to the plane strain condition [33], which can be simulated by the biaxial stress path. Therefore, the Path II test results have reference significance to the application of MC–reinforced soil technology in practical engineering.
(3)
Path III: conventional triaxial stress path
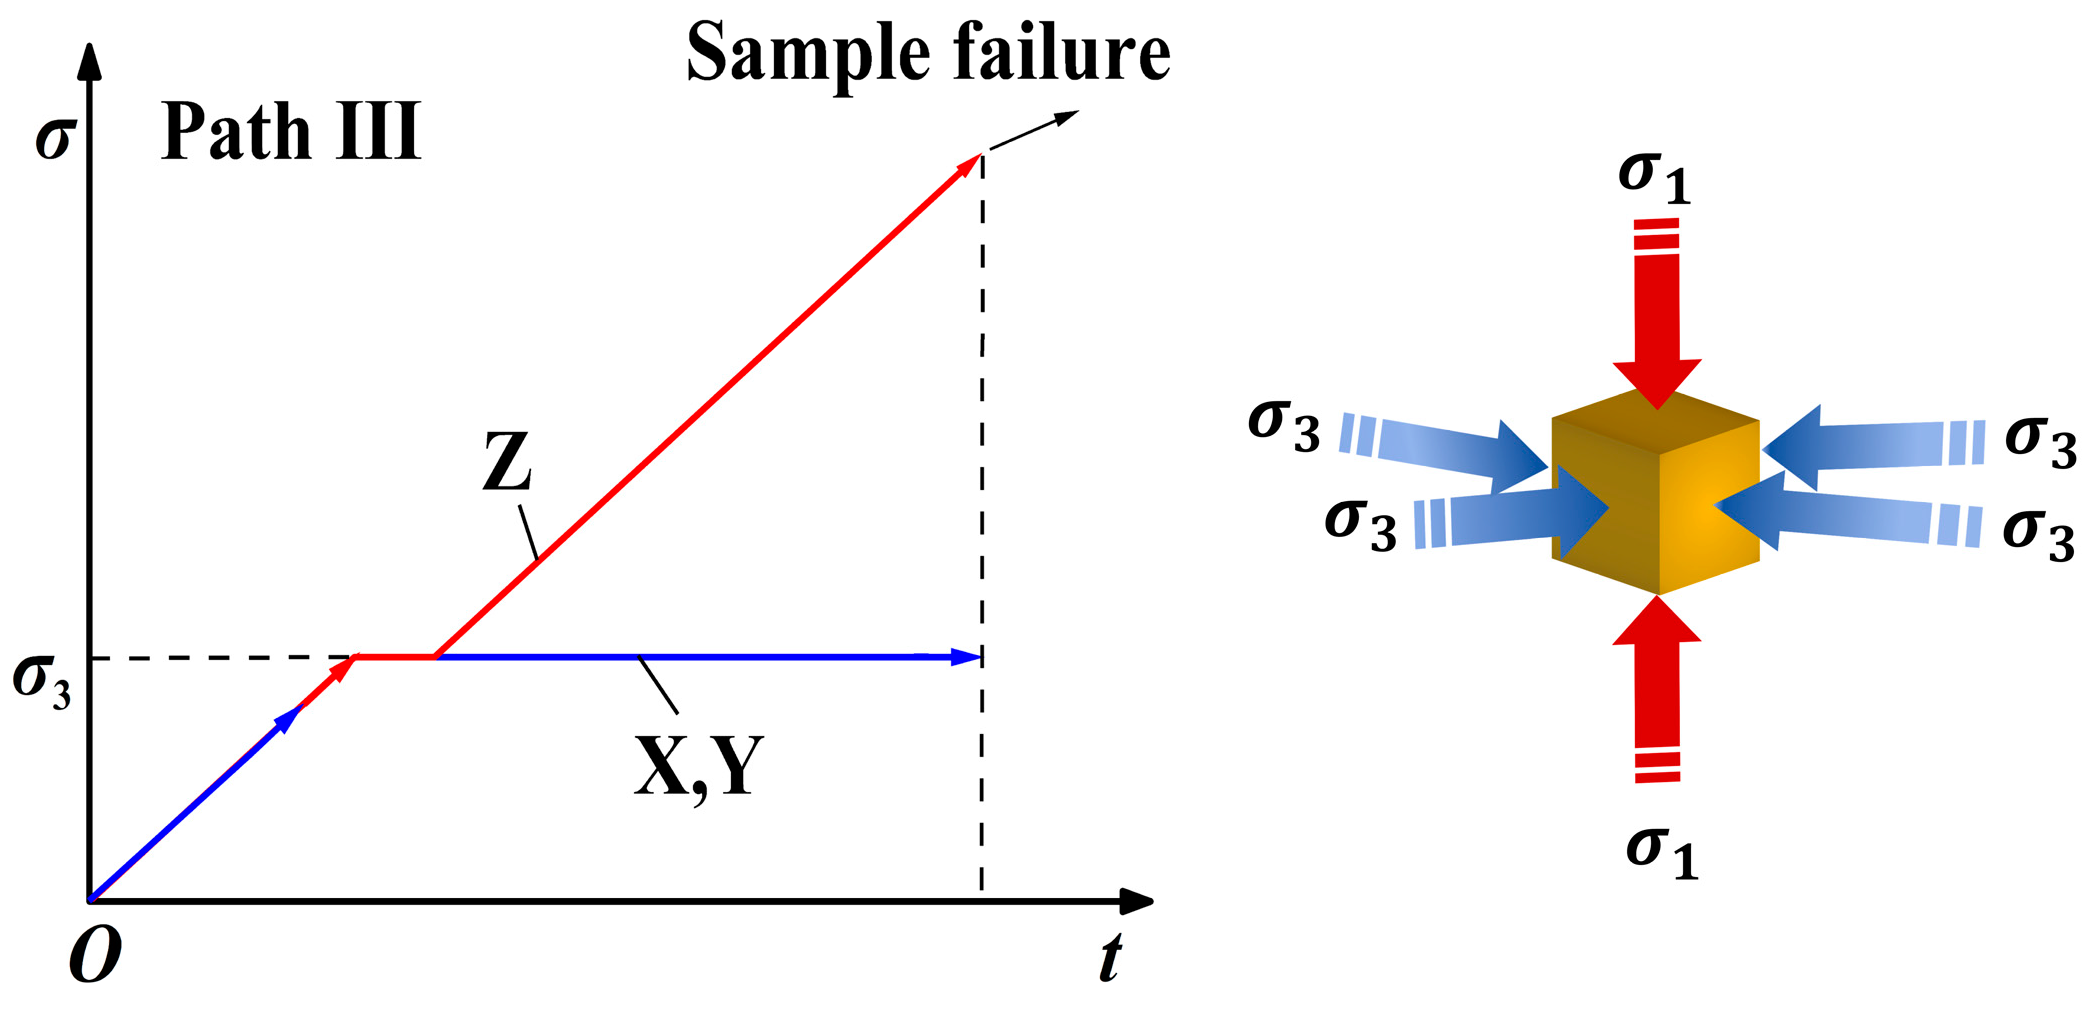
As shown in Figure 6, the sample in X, Y, and Z directions was simultaneously loaded to the confining pressure of 100 kPa at a speed of 10 N/s, then loads in X and Y directions were kept constant, and the sample in the Z direction was continued to be loaded at a speed of 10 N/s until failure happens. This conventional triaxial stress path is similar to the triaxial compression test, which can be used to study the strength and deformation behaviors of MC reinforced soil subjected to a large load under lateral confinement.
(4)
Path IV: true triaxial stress path
It can be seen in Figure 7 that the sample in X, Y, and Z directions was simultaneously loaded to the confining pressure of 100 kPa at a speed of 10 N/s and then in the Y and Z directions was further loaded to 200 kPa at the same speed. Finally, the sample was loaded to failure at a speed of 10 N/s in the Z direction. When the soil mass is buried deeply, it is usually in a stress state of three unequal pressures [34]. Through this true triaxial stress path, the mechanical behaviors of soil under the above stress state can be well revealed. In this true triaxial stress path, σ 2 σ 3 = 2, and the role of the intermediate principal stress σ2 is considered.

3. Results and Discussion

3.1. Stress–Strain Behavior

Figure 8 presents the stress––strain relationships of samples under uniaxial, biaxial, conventional triaxial, and true triaxial stress paths, where εa refers to the axial strain.
It can be seen from Figure 8a that under uniaxial stress path, the initial strength of the sample without MCs is high, but after reaching the peak, the stress decreases rapidly with the increase of strain, showing obvious brittle failure characteristics, and the residual strength loss is large. When the fm of the sample is relatively low (0.1%~0.3%), the addition of MCs reduces the peak strength of the sample. However, in the strain softening stage after the peak strength, the softening curves rise with the increase of fm, and the loss of residual strength gradually decreases, which indicates that the failure mode of samples change from brittle failure to ductile failure. When the content of MCs is relatively high (0.5%~0.7%), the strain softening process disappears, replaced by the weak strain hardening state, the corresponding failure mode is transformed into ductile failure, and the peak strength is still not reached when the strain is 15%. This phenomenon indicates that the strengthening effect of MCs has an obvious late effect. Bi et al. [22] and Liu et al. [35] obtained similar results from the unconfined compressive test on fiber reinforced soil. Regarding the formation mechanism of the late effect of fiber reinforcement, Gao et al. [36] pointed out that as soil particles around the fiber are continuously compacted, the normal force and the friction between fiber and soil particles increase significantly, resulting in constraining the displacement of soil particles under the action of external forces. The strength of samples reaches a high and relatively stable value in the late loading period.
Three typical failure patterns of samples with different levels of fm under the uniaxial stress path are shown in Figure 9. The sample without MCs is seriously damaged. Soil blocks are peeled from the sample, but shear bands distributed on both sides of the sample can be clearly distinguished. The sample with an fm of 0.1% presents the continuous cracking characteristics. The three cracks distributed in the center and both sides of the sample indicate that the failure mode of the sample belongs to a tension––shear mixed failure. The sample with an fm of 0.7% is failed by the lateral expansion at the lower part without obvious shear bands.
The stress––strain relationship under biaxial stress path presents a different state from that under the uniaxial stress path as shown in Figure 8b. At the initial stage of loading, the slope of the stress––strain curve decreases slowly with the increase of strain, and the hardening stage changes from strong to weak strain hardening. At the middle stage of loading, the slope of stress––strain curve tends to increase with the increase of strain, which indicates that the sample is in the transition stage from weak to strong strain hardening. Moreover, this trend is weakened by the increase of fm. For instance, samples with high levels of fm (0.5%~0.7%) do not present the strong strain hardening characteristic even when the axial strain reaches 15%, implying that the addition of MCs delays the strain hardening process and improves the later strength of the soil sample. It is noted that the strength of the sample has a positive relationship with fm under the biaxial stress path.
The stress––strain curves of samples under conventional triaxial stress path exhibit the strain hardening characteristics as illustrated in Figure 8c. Due to the confinement effect of lateral stress, the failure strength of the sample under the conventional triaxial stress path is greater than that under the uniaxial or biaxial stress path. Moreover, different from that under the biaxial stress path, the failure strength of the sample increases first and then decreases with the increase of fm. The strength of the sample with an fm of 0.3% reaches the highest value. The strength values of samples with an fm of 0.5% and 0.7% decrease obviously, but they are still higher than that of the sample without MCs. Accordingly, the compressive strength and fm of the sample present a non–monotonic relationship under conventional triaxial stress path, and there is an optimal content of MCs for the improvement of soil strength. This non–monotonic relationship has also been observed in previous studies of fiber reinforced soils. Jiang et al. [37] pointed out that an excessive fiber content can cause mutual adhesion between fibers to form agglomerates destroying the integrity of the sample and thus reduce the contact force between fibers and soil particles, resulting in the decrease of the fiber reinforcement effect.
As shown in Figure 8d, the stress––strain curves of samples under the true triaxial stress path are the strain–hardening type, similar to that under the conventional triaxial stress path. The intermediate principal stress further inhibits the Poisson effect, so the overall strength of samples is improved. Due to the compression and hardness characteristics of soil, the increased average stress from the increase of intermediate principal stress induces the increase of the strength of the soil sample [38]. Furthermore, in the late loading period, the slope of the stress––strain curve of the sample without MCs slowly decreases with axial strain. The sample transits from weak strain hardening to strain softening. However, the addition of MCs weakens this transition, further confirming the late effect of MCs on the reinforced soil. Additionally, the strength of sample increases first and then decreases with the increase of fm. It is similar to that under the conventional stress path, but the failure strength of the sample with an fm of 0.5% attains the highest level under the true triaxial stress path.
In addition, Figure 10 shows the failure patterns of samples with different levels of fm under the true triaxial stress path. Under the action of confining pressure and intermediate principal stress, failure patterns of all the samples are ductile failure without obvious cracks. This indicates that the inclusion of MCs does not change the failure pattern of the sample under true triaxial stress state.

3.2. Failure Strength

Figure 11 summarizes the variations of failure strength of the sample with an fm under the four stress paths. It is found that the stress path is a key factor affecting the soil strength. With the increase of the number of principal stresses involved in loading and the intermediate principal stress under true triaxial stress path, the overall strength of the samples has been significantly improved. Furthermore, the reinforcement effect of different contents of MCs is sensitive to the stress path. Specifically, the failure strength of the sample under the uniaxial stress path shows a variation trend of decreasing first and then increasing with the increase of fm; the failure strength of the sample under the biaxial stress path increases monotonically with fm; and the failure strength of the sample under both conventional triaxial stress and true triaxial stress paths increases first and then decreases with fm, but the optimal contents of MCs for samples under these two paths are different.
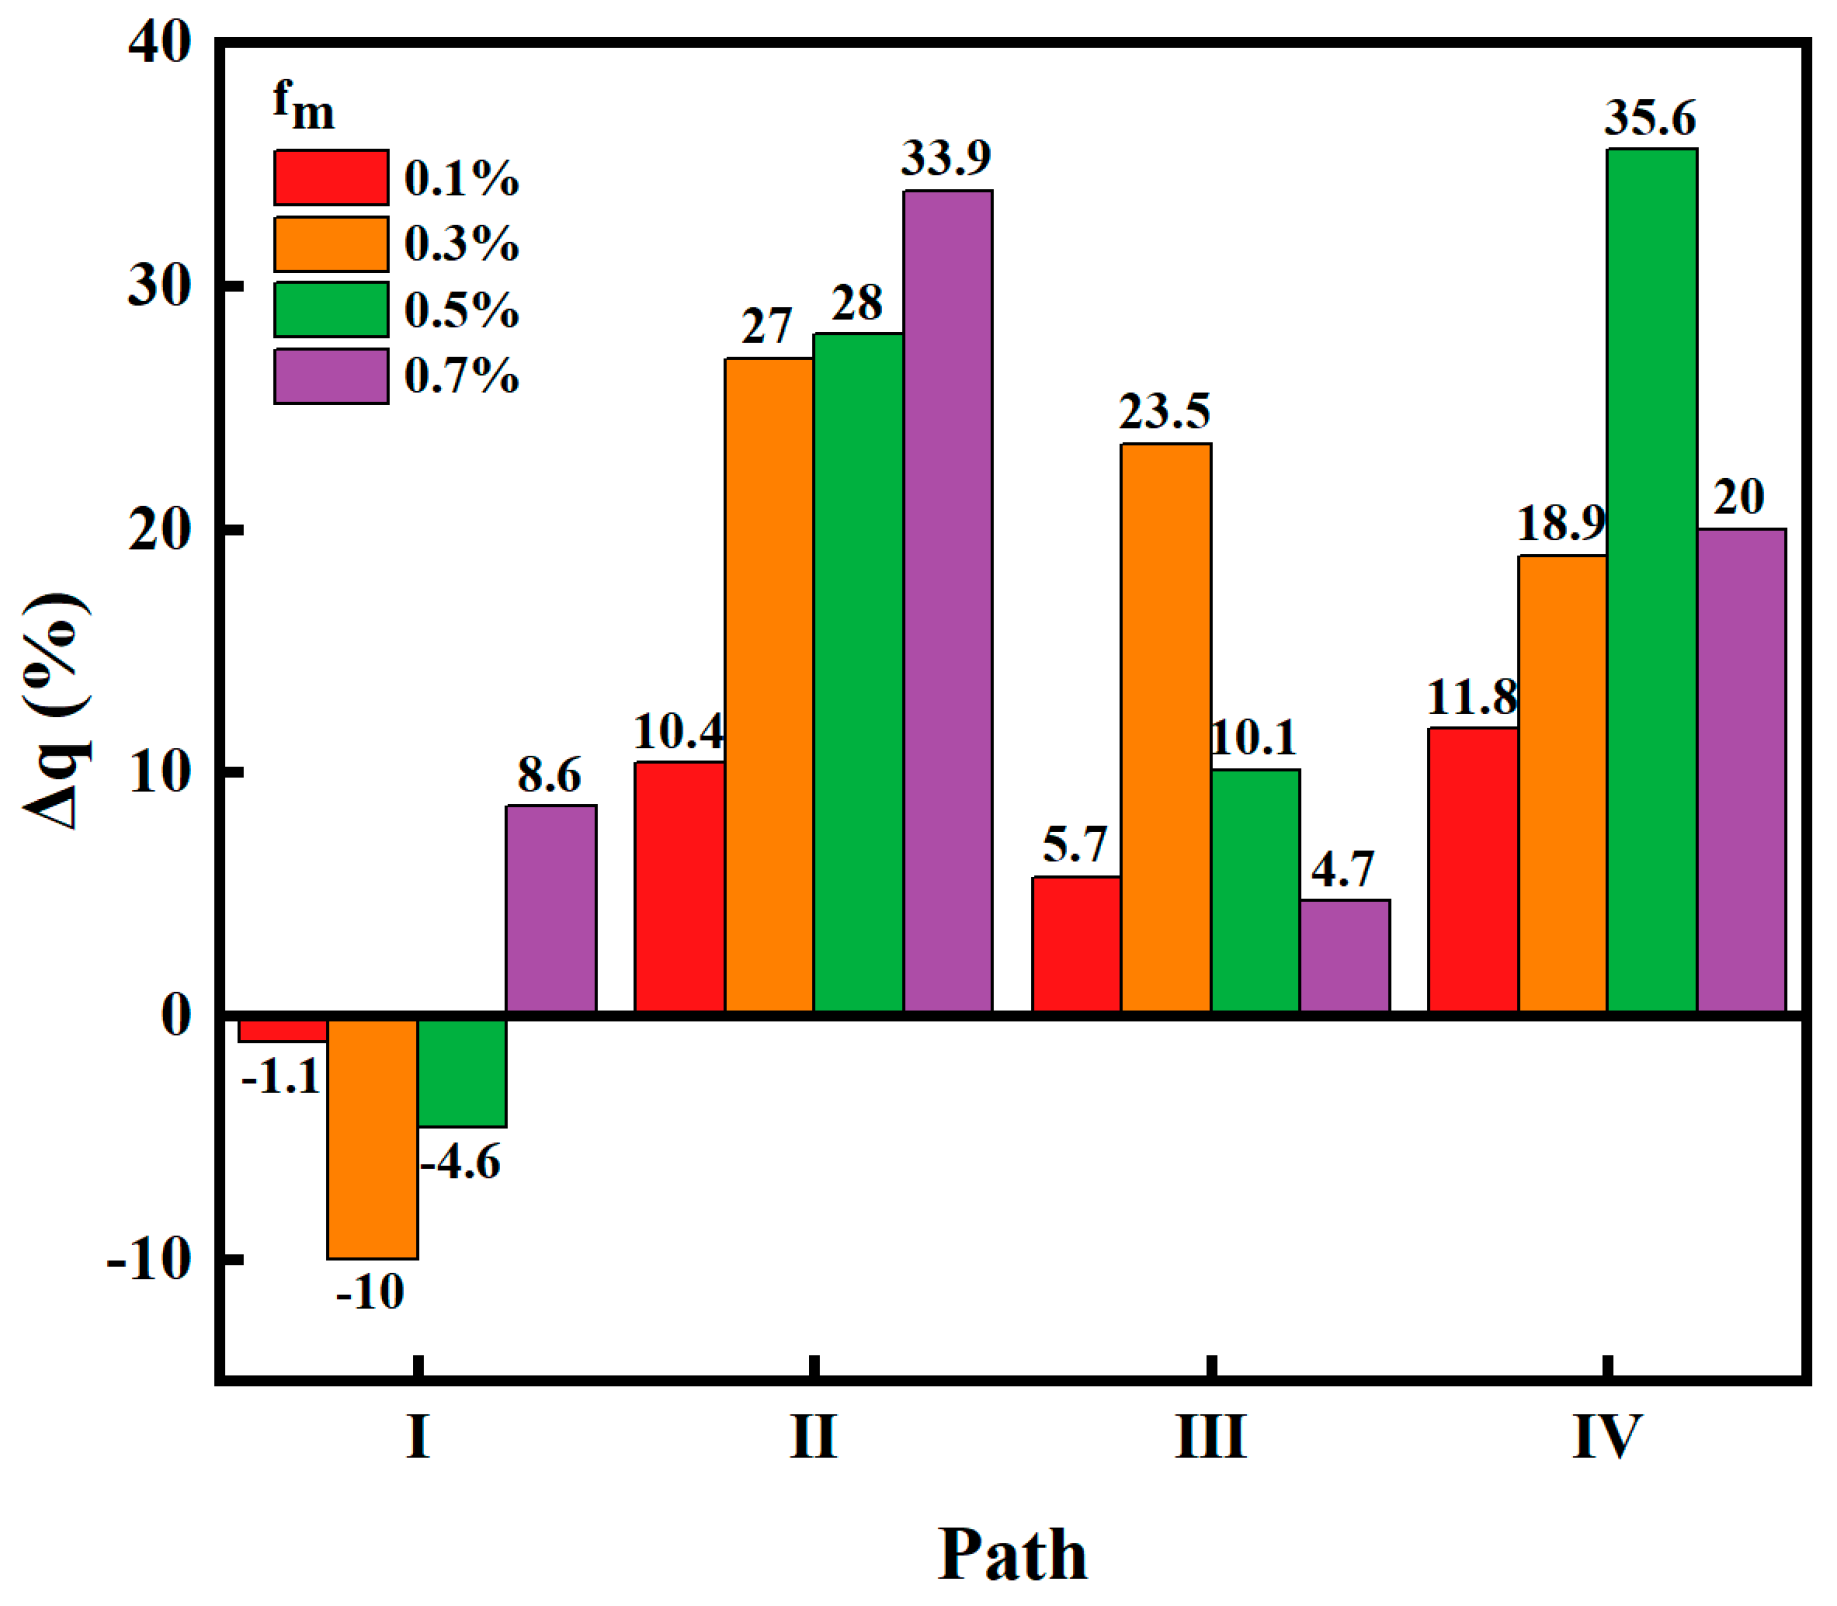
In addition, the percentage increase in failure strength (Δq) is introduced to more intuitively show the influence of MCs on the strength of the soil sample under different stress paths as defined by:
Δ q = q r f q u n r f q u n r f × 100 %
where qrf and qunrf are the failure strength of the reinforced and unreinforced samples, respectively.
Figure 12 shows the influence of fm on Δq under different stress paths. Under the uniaxial stress path, the failure strength of samples with an fm of 0.1%~0.5% decreases by 1.1%~10%, while the failure strength of sample with an fm of 0.7% increases by 8.6%. Under the biaxial stress path, the strength of the sample has a monotonic relationship with fm, which increases by 10.4%~33.9%. Under the conventional triaxial stress path, the strength of the sample increases by 5.7%~23.5% due to the addition of MCs, and the sample with an fm of 0.3% has the greatest increase in strength. Under the true triaxial stress path, the failure strength of the samples reinforced by MCs increases by 11.8%~35.6%, and the sample with an fm of 0.5% has the greatest increase in strength. In this study, the strength of the soil sample can be increased up to 35.6% by adding a proper content of MCs, indicating that MCs have great potential for improving the soil strength.

3.3. Elastic Modulus

Figure 13 summarizes the relationships between fm and initial moduli E0 (defined as the secant modulus at 0.1% of the axial strain corresponding to peak stress) and E50 (defined as the secant modulus at 50% of the axial strain corresponding to peak stress) of samples under different stress paths. Under the uniaxial stress path, the variation trend of E0 and E50 with fm is similar to that of failure strength with fm as shown in Figure 11. The addition of MCs reduces both E0 and E50, but when fm exceeds 0.3%, the increase of fm improves both E0 and E50. This indicates that the addition of MCs is not conducive to improving the initial stiffness of soil under the uniaxial stress path. Under the biaxial stress path, the addition of MCs increases the E0 of all samples but only increases the E50 of the sample with an fm of 0.3%, and the relationship between E0, E50, and fm is non–monotonic. Under both conventional and true triaxial stress paths, the E0 and E50 of samples increase first and then decrease with fm, indicating that the proper addition of MCs can effectively improve the soil stiffness, but the excessive addition of MCs may affect the integrity of the soil and cause the loss of soil stiffness. Xu et al. [17] obtained similar results from the conventional triaxial compressive test on mask–chip–reinforced soil. For different confining pressures, the E0 and E50 of samples can be increased by 20–35% when the volumetric content of mask chips was between 0.3% and 0.5%. Samples at 5% witnessed the lowest elastic modulus, showing a 15–35% drop compared to the control sample for both E0 and E50. Interestingly, the fm of sample with the largest decrease in E50 under the uniaxial stress path is 0.3%, while under the biaxial, conventional triaxial and true triaxial stress paths, the fm of the sample with the largest increase in E50 is also 0.3%, which is different from the differentiation characteristic of optimal content of MCs for the strength of samples under different stress paths.

3.4. Lateral Strain and Volumetric Strain

In this section, the lateral and volume strains of samples under conventional and true triaxial stress paths are analyzed. It is noted that the positive and negative strains denote the shrinkage and expansion, respectively.
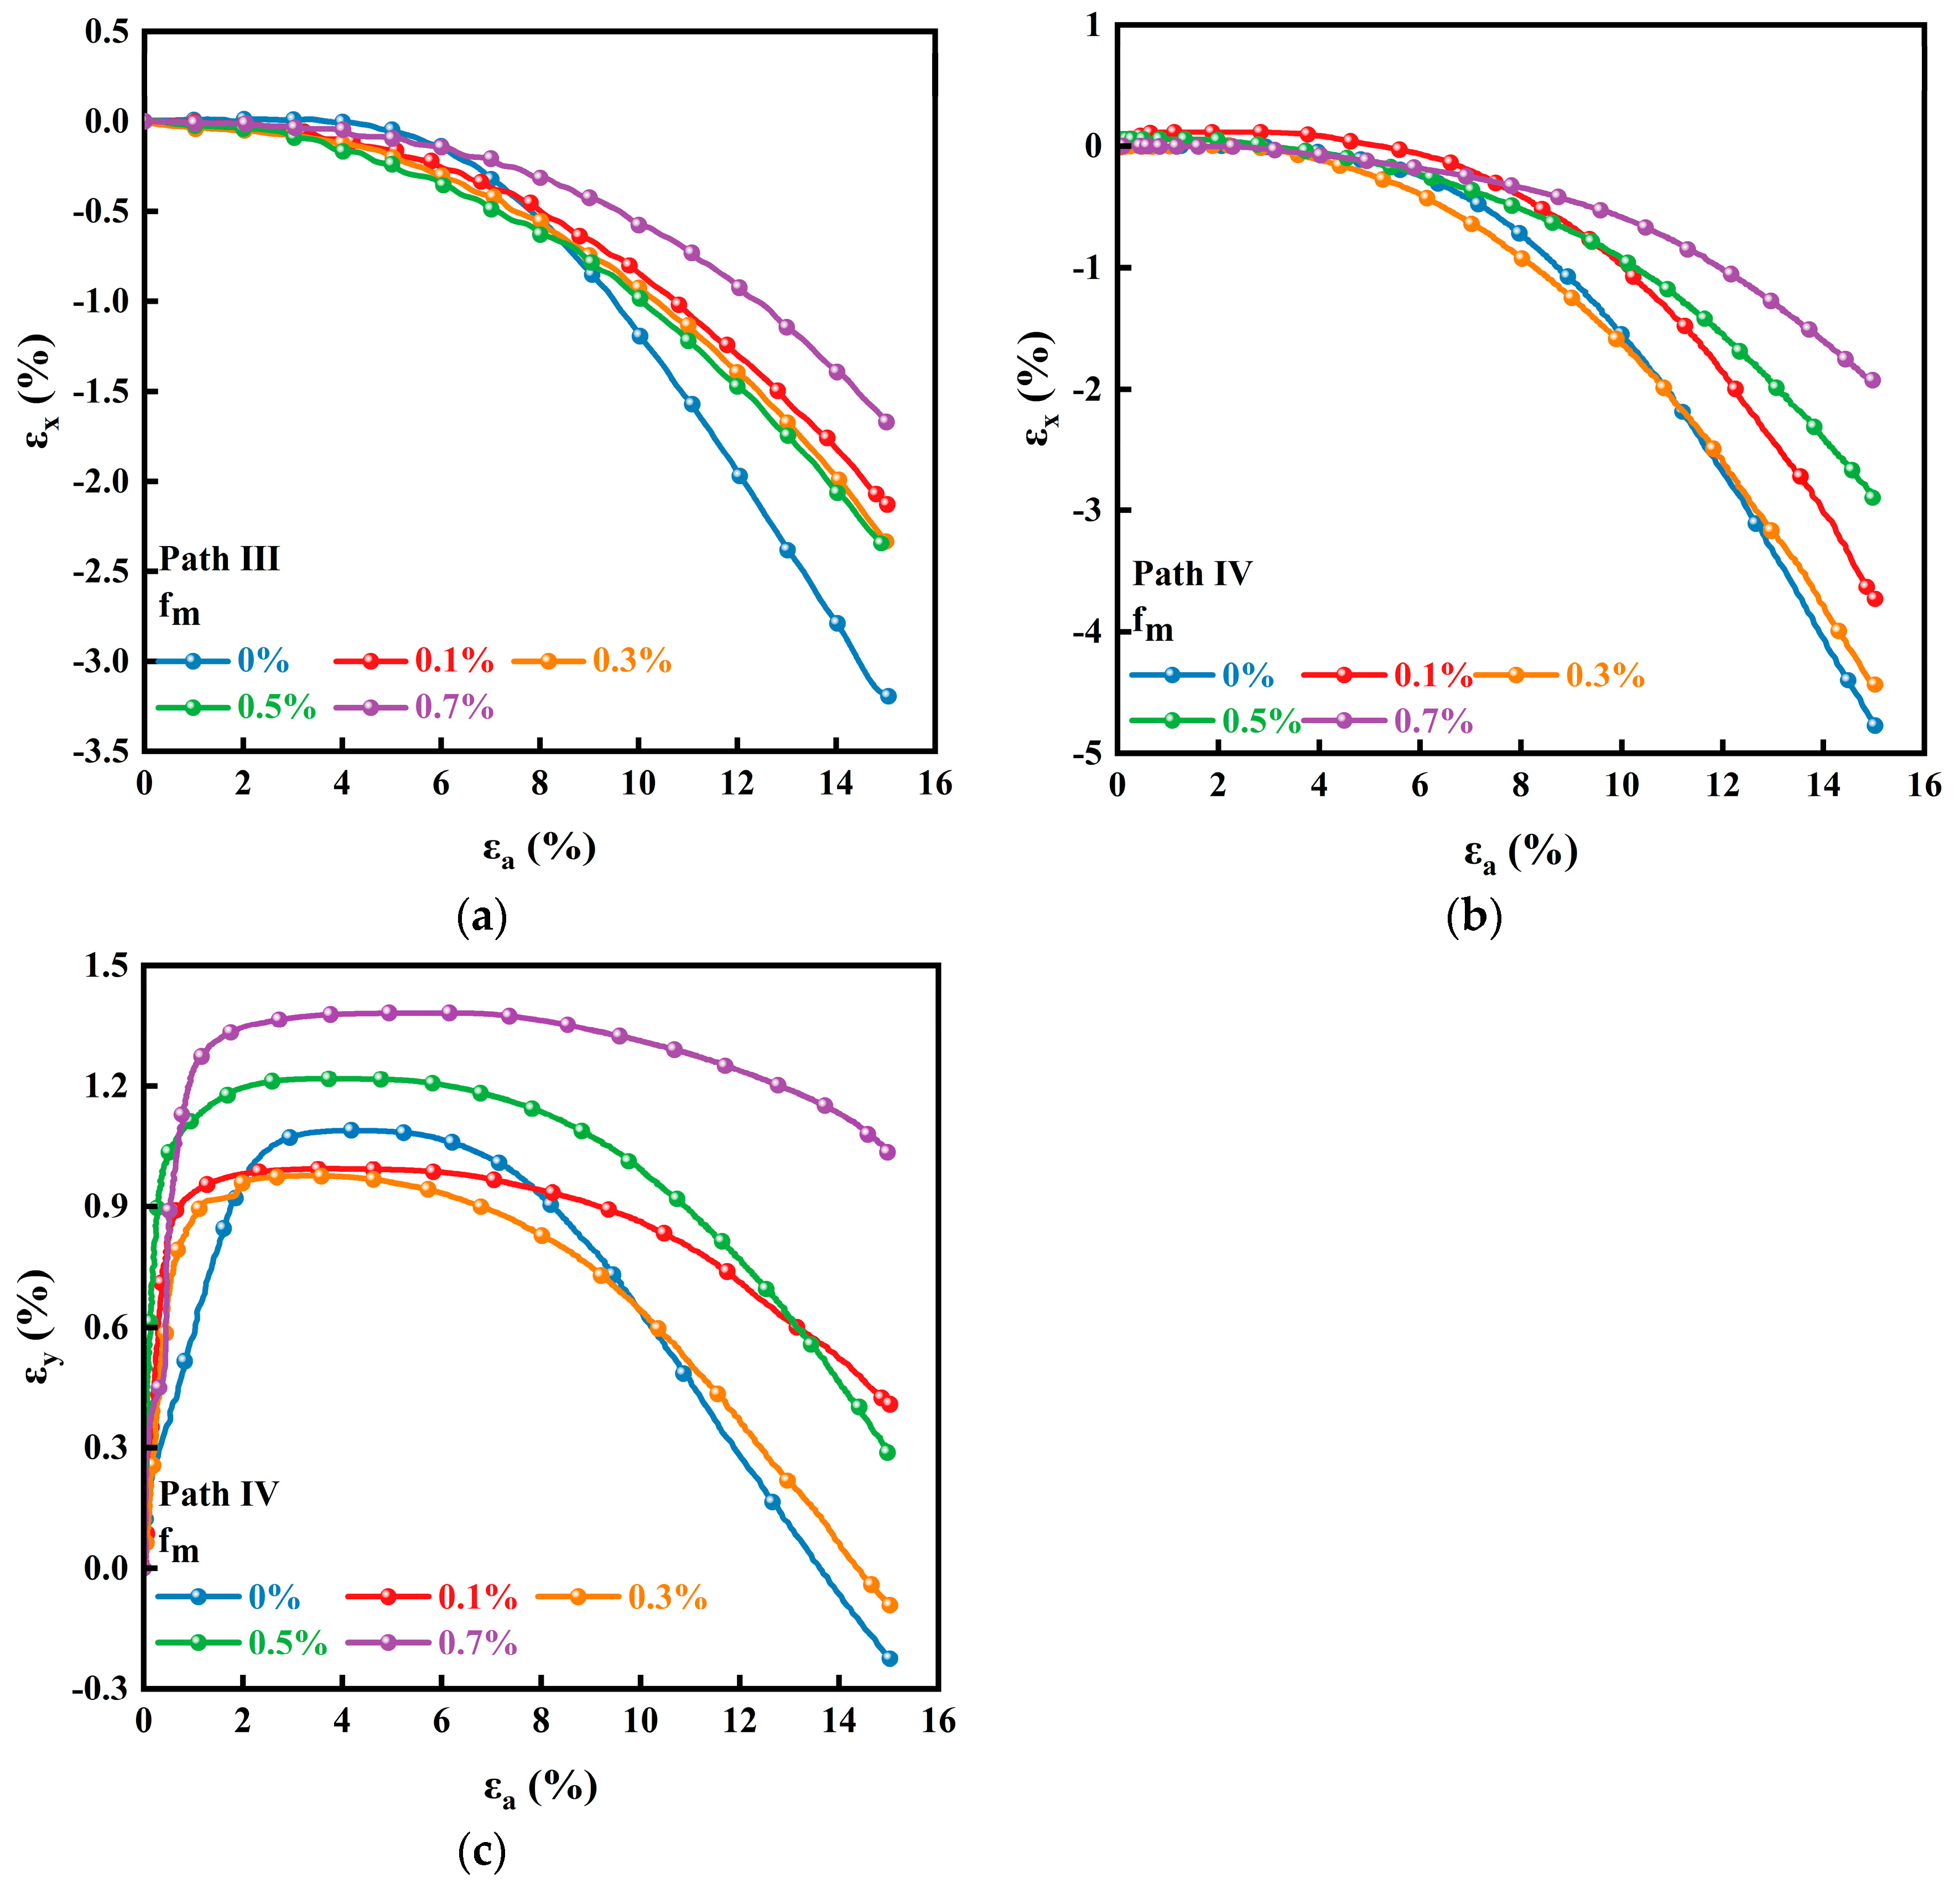
Under the conventional triaxial stress path, since the variation trends of strains in the X–direction and Y–direction with the axial strain are very similar, only the evolution law of the strain in the X–direction (εx) is analyzed. Figure 14a shows the variation trend of the strain εx with the axial strain (εa). With the increase of axial strain, the samples show a tendency of lateral expansion, and the expansion speed gradually grows. The addition of MCs reduces the lateral expansion degree of the specimen in the late loading period. Figure 14b shows the variation trend of εx with εa under the true triaxial stress path. Compared with that under the conventional triaxial stress path, the expansion degree of εx under the true triaxial stress path is greater, and MCs still have an obvious effect on inhibiting the expansion of samples in the X–direction. Figure 14c shows the variation trend of the strain in Y–direction (εy) with εa under the true triaxial stress path. At the initial loading stage, εy increases rapidly, and the sample in Y–direction is in a state of shrinkage. After σ2 is loaded to the set value, the εy of the sample enters a stable period with the increase of εa. At the end of loading, the εy decreases rapidly and the sample in the Y–direction changes from shrinkage to expansion. The stable phase of εy of the sample with the addition of MCs is prolonged obviously, and the expansion trend at the end of loading is suppressed. Additionally, the shrinkage degree of samples with high fm increases significantly.
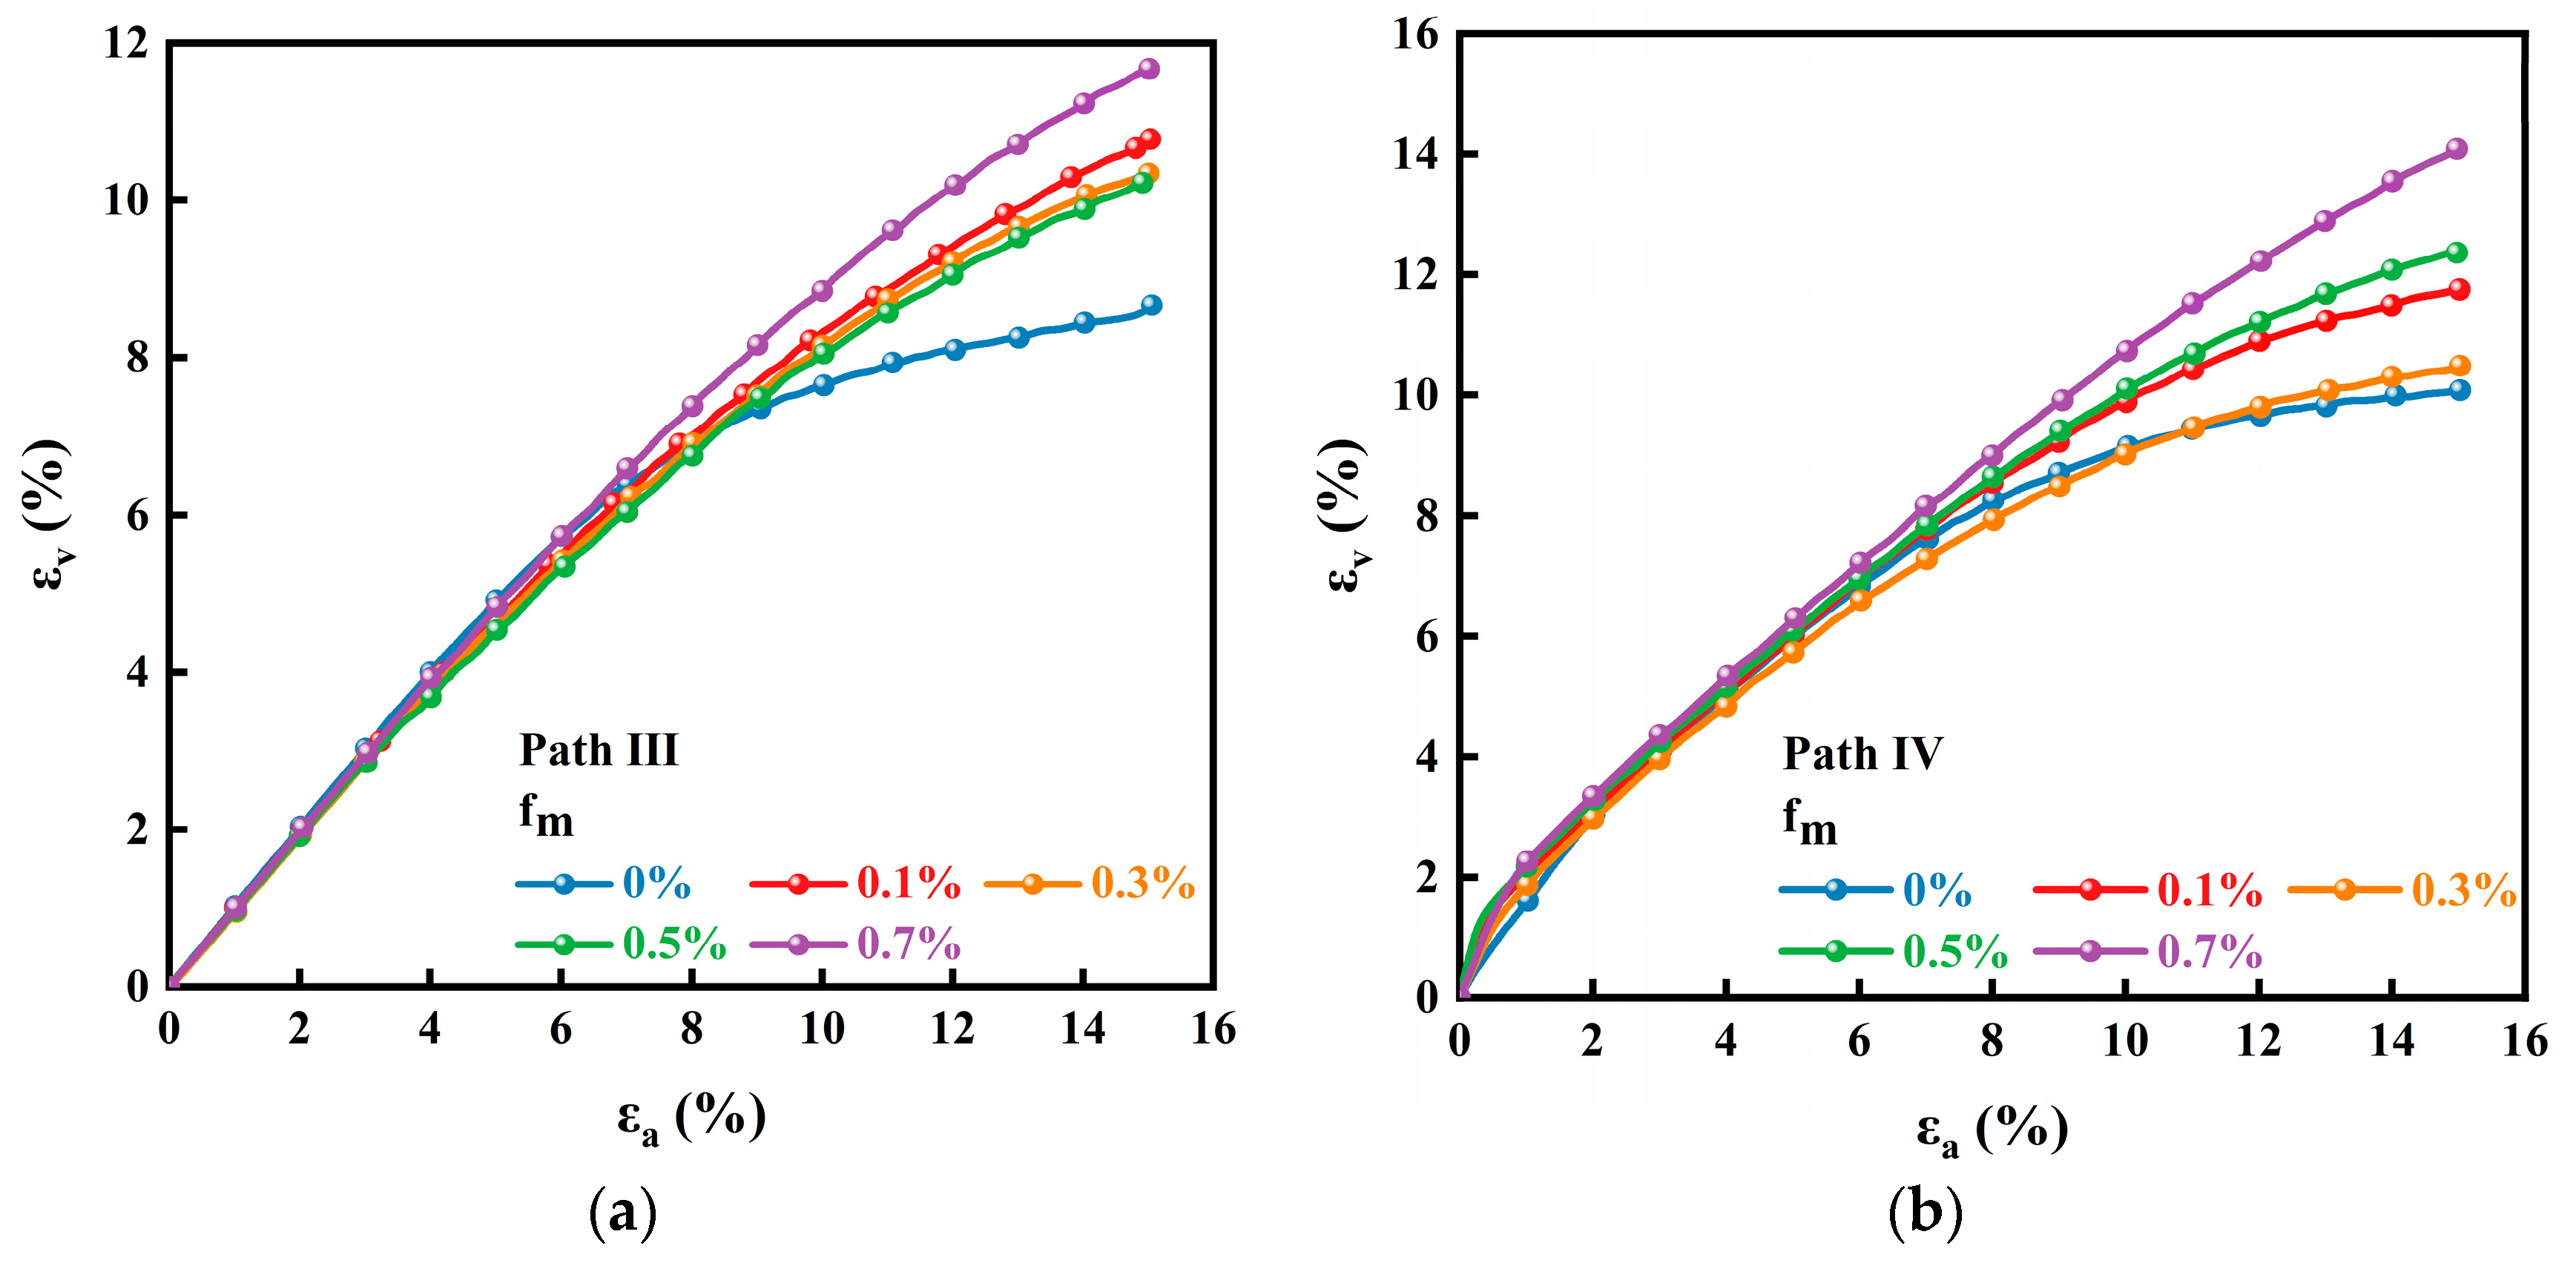
In the process of triaxial compression, the shear stress changes the relative position of soil particles, resulting in the variation in the total volume of sample. The volume strain (i.e., εv = εx + εy + εz) is used to quantify the volume change of samples during shearing. Figure 15 presents the relationship between volume strain and axial strain of samples with different fm under conventional and true triaxial stress paths. The volume strain of samples increases with axial strain, indicating that all the samples are in the shear shrinkage state. It is consistent with the experimental result observed by Xu et al. [17] that the volume of the sample is contracted first and then expanded with increasing axial strain when the confining pressures are 30 kPa and 60 kPa, and no dilation occurred in the samples when the confining pressure is 120 kPa. Under the conventional triaxial stress path, the addition of mask chips increases the volume shrinkage of the sample, consistent with the finding of Benziane et al. [39] that adding fiber would increase the shrinkage trend of soil and limit its expansion. However, different from their result, a monotonic relationship between fm and the degree of shrinkage has not been observed in this study. Under the true triaxial stress path, the differentiation in volumetric strain vs. axial strain curves of samples is significant, and the volume shrinkage of samples with a high fm (i.e., 0.5–0.7%) is enhanced. There are two main reasons for this phenomenon. On one hand, the intermediate principal stress σ2 under the true triaxial stress path plays a role in restraining the lateral deformation of samples, thereby reducing the proportion of the lateral strain in the volume strain. On the other hand, the deviation between the intermediate and minor principal stresses stimulates the reinforcement potential of the anisotropic distribution of MCs inside the sample. The friction effect of MCs on soil particles greatly weakens the lateral deformation of samples caused by external forces, further consolidating the dominant role of axial strain in volume strain. In this case, samples with high–mask–chip content have greater advantages due to more contacts between mask chips and soil particles.

3.5. Poisson’s Ratio

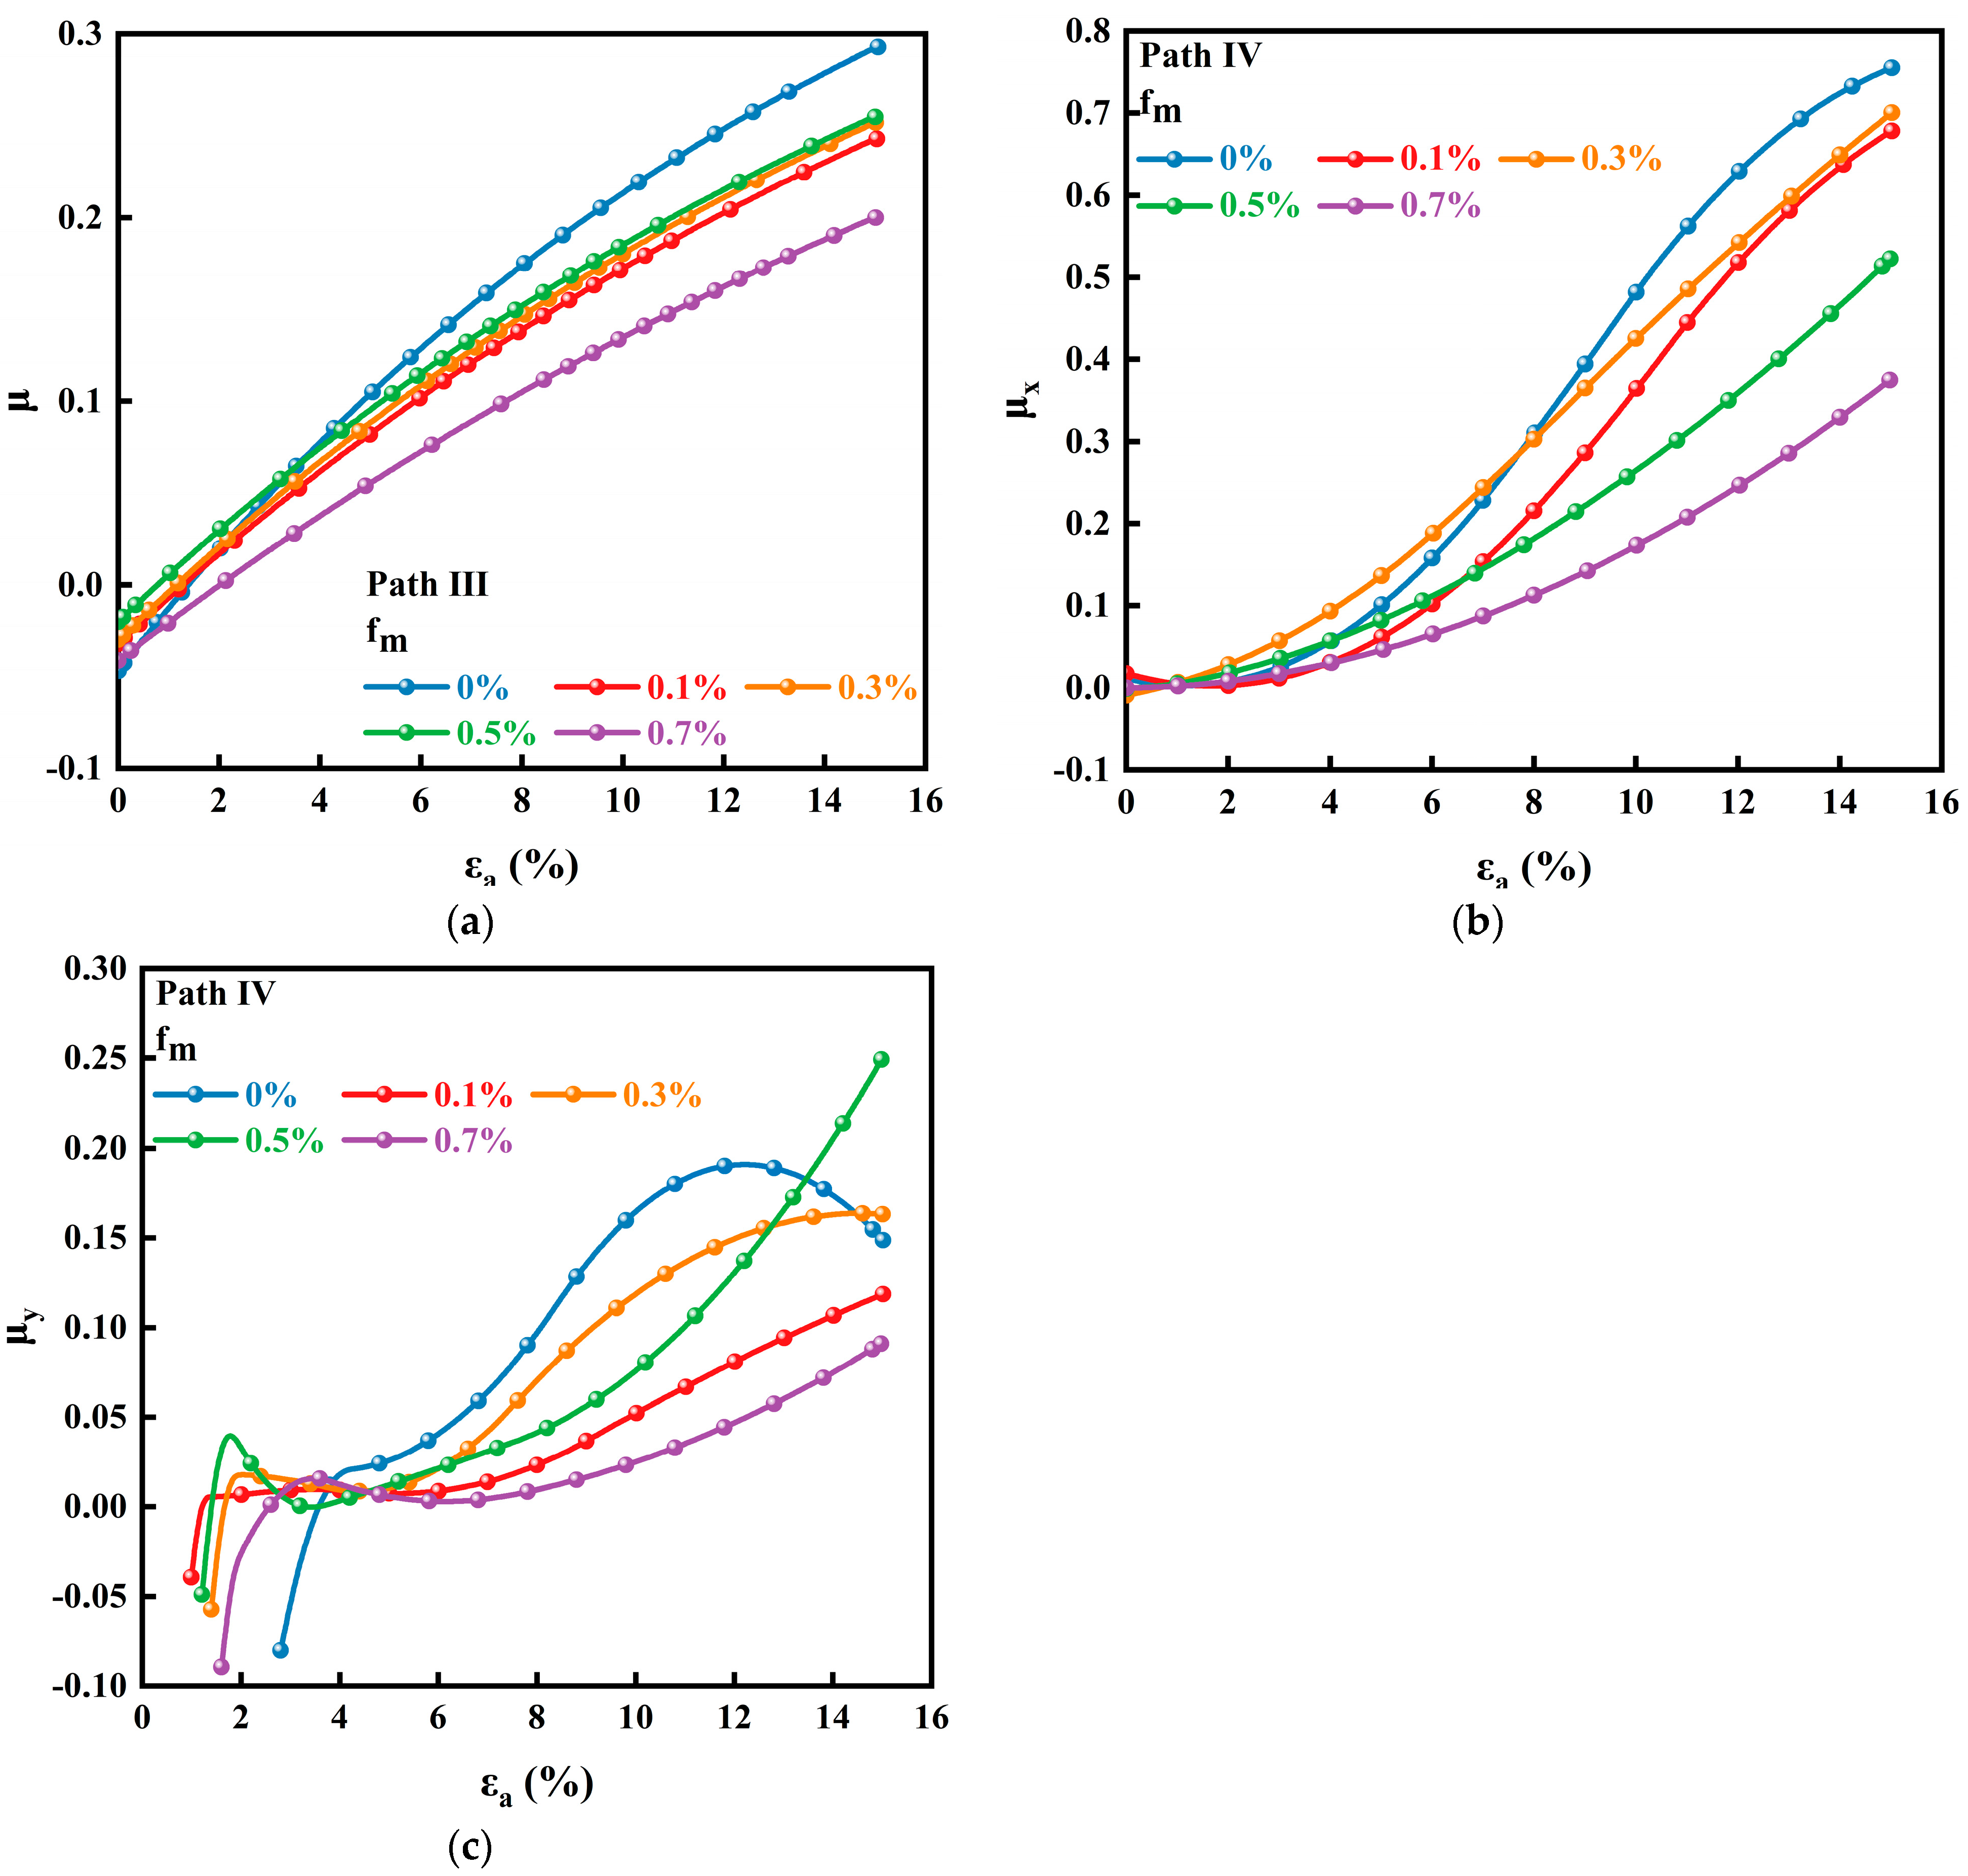
Under the conventional triaxial stress path, according to the research of Yin et al. [40], Poisson’s ratio (μ) depends on the volume strain and axial strain and has the following relationship:
μ = 1     K c 2
where Kc is the slope of the volume strain vs. the axial strain curve at the contraction stage. Figure 16a shows the relationship between Poisson’s ratio and the axial strain of samples with different fm under the conventional triaxial stress path. In the initial stage of loading, μ < 0, the samples experience a short lateral shrinkage stage. With the increase of axial strain, μ gradually increases with the lateral deformation of samples changing into expansion and the corresponding expansion rate increasing gradually. It can be concluded that the addition of MCs reduces the evolution range of μ and decreases the growth rate of μ of sample. Additionally, with the increase of the axial strain, the gap between the Poisson’s ratios of samples with and without MCs becomes larger and larger, which demonstrates the ability of MCs to stabilize soil.
Under the true triaxial stress path, Poisson’s ratios in the X and Y directions can be calculated by the formulas: μx = ε x ε a and μy = ε y ε a , respectively. Figure 16b shows the variation trend of μx with εa of samples under the true triaxial stress path, where εa varies in the range of the axial strain at the completion of consolidation to that at the failure of the sample. Compared with Figure 16a, μx increases more rapidly indicating that the direction of minor principal stress is the main direction of expansion of the sample under the true triaxial stress path. The variation trend of μy with εa of samples under the true triaxial stress path is presented in Figure 16c. It can be seen that the Poisson’s ratio for the sample with a high fm is generally lower than that without MCs, further confirming that a proper content of MCs can reduce the dilation of soil and thus improve the deformation behavior of soil.

3.6. Energy Absorption

The failure of soil materials is closely related to the energy conversion. The soil deformation, particles breakage, shear zone formation, etc., require energy absorption. Based on the view of energy conservation, the failure mechanism of soil reinforced by mask chips can be evaluated from a new perspective. The energy absorption capacity of soil is usually represented by the energy absorbed by soil per unit volume (w). Under the uniaxial stress path, w can be directly determined by the formula that w = σ 1 d ε 1 corresponding to the envelope area of the axial stress––strain curve and the X–axis. Under the biaxial stress path, no force is applied on the sample in the X–direction and no work is done on the sample in the Y–direction due to the fixed displacement; therefore, only the work applied on the sample in the Z–direction needs to be considered. The formula of w is the same as that under the uniaxial stress path. Moreover, due to the lateral confinement, the formula under the triaxial stress path should be modified as w = σ 1 d ε 1 + σ 2 d ε 2 + σ 3 d ε 3 . Figure 17 shows the variation trend of energy absorption per unit volume of the sample with an fm under different stress paths. It is noted that the influence of friction on the energy absorption is not considered in this study.
It can be seen that the under uniaxial stress path, the energy absorption per unit volume of the sample with an fm of 0.1% is lower than that of the sample without MCs, while that of the sample with other fm is improved. The energy absorption capacity increases monotonously with the content of MCs varying from 0.3% to 0.7%. Due to the strain hardening process of samples with a high fm, their energy absorption per unit volume increases significantly at failure. Under the biaxial stress path, the addition of MCs has a positive effect on the increase of energy absorption. Compared with that under the uniaxial and biaxial stress paths, the energy absorption per unit volume of the sample under the triaxial stress path is significantly enhanced due to the energy input provided by lateral stresses. Specifically, under conventional triaxial stress path, the energy absorption capacity of reinforced soil sample is increased by 5–35%. The energy absorption per unit volume of the samples at failure presents a relationship of increasing first and then decreasing with fm, and the fm of the sample with the largest increase in w is 0.3%. The variation trend of w under the true triaxial stress path is similar as that under the conventional triaxial stress path, but the increase extent of w under the true triaxial stress path is generally greater (i.e., up to 27–45%). Moreover, under the true triaxial stress path, the fm of the sample with the largest increase in w is 0.5%. As analyzed above, under true triaxial stress, the addition of MCs weakens the lateral deformation and aggravates the volume shrinkage trend of samples, limiting the external work and improving the energy absorption capacity of samples. The results observed in this study are consistent with the finding of Jiang et al. [41]. They also confirmed the potential of polypropylene fiber to improve the energy dissipation in media based on the direct shear test of polypropylene–fiber–reinforced iron tailings powder and the mathematical model of fiber interfacial energy dissipation.

4. Conclusions

This study aims to investigate the mechanical behavior of mask–chip–reinforced soil under different stress paths. First, different contents of disposable mask chips (i.e., 0%, 0.1%, 0.3%, 0.5%, and 0.7% by mass) were mixed with sandy soil to make mask–chip–reinforced soil samples. Then, compression tests with different stress paths were carried out by using a true triaxial testing machine to investigate the stress––strain, strength, deformation, energy absorption, and other mechanical behaviors of the samples. Finally, the potential of MCs as reinforcement material for improving soil properties was evaluated comprehensively. The main conclusions of this study are as follows:
(1) Under the uniaxial stress path, with the increase of fm, the failure mode of the sample changes from brittleness to ductility, and the late strength is strengthened, but the early strength and stiffness are reduced. The energy absorption capacity of the samples with an fm of 0.3% to 0.7% is improved.
(2) Under the biaxial stress path, the failure strength of the sample shows a monotonic increasing relationship with fm, and E0 is generally improved, but E50 is improved only when fm is 0.3%. The energy absorption capacity of the samples is generally improved.
(3) Under the conventional triaxial stress path, the addition of MCs improves the strength and energy absorption capacity of the samples, and both of them show a non–monotonic relationship with fm. With the increase of fm, the strength and energy absorption capacity rise to the peak value at an fm of 0.3% and then decrease. Except for the sample with an fm of 0.7%, both E0 and E50 are improved, and the excessive addition of MCs reduces the stiffness of samples. The addition of MCs also inhibits the lateral deformation, intensifies the volume shrinkage, and reduces the dilatancy.
(4) Under the true triaxial stress path, the mechanical properties of the samples are closely related to fm. The optimal mass content of MCs for each mechanical property is differentiated. The strength, E0, and energy absorption capacity of the sample with an fm of 0.5% are improved the most, while the E50 of the sample with an fm of 0.3% is enhanced the most, and the lateral deformation degree of the sample with an fm of 0.7% is weakened the most.
A moderate content of MCs plays a positive role in improving the mechanical behavior of soil, which confirms the potential of MCs as reinforcement materials. There are differences in the optimal content of MCs for different mechanical properties, such as strength and stiffness, and the strengthening effect of MCs is significantly affected by the stress path. This suggests that when the MCs are used as the reinforcing material in a project, the content of mask chips should be selected according to the specific needs of the project. In this study, the water content and dry density of soil were set as fixed values. The effects of water content and dry density on the mechanical behavior of mask–chip–reinforced soil need to be further clarified. Additionally, only one true triaxial stress path was adopted, which is not comprehensive enough to evaluate the mechanical properties of mask–chip–reinforced sandy soil under the true triaxial compression stress state. In the future, it is appropriate to include the influences of other stress paths, soil gradation, dry density, and water content on the mechanical properties of mask–chip–reinforced soil in the research scope. The numerical simulation based on discrete element method is ongoing to provide a reference for the application and promotion of mask–chip–reinforcement technology in practical engineering from a microscopic perspective.

Author Contributions

Conceptualization, X.H. and K.L.; Methodology, X.H.; Validation, B.H., G.D. and K.L.; Formal analysis, X.H.; Investigation, X.H., M.C. and B.H.; Resources, G.D. and K.L.; Data curation, M.C.; Writing—original draft, X.H.; Writing—review and editing, K.L.; Supervision, K.L.; Funding acquisition, K.L. All authors have read and agreed to the published version of the manuscript.

Funding

This research was funded by: (1) the National Natural Science Foundation of China, No. 52204119; and (2) the Support Project of Innovation and Entrepreneurship Training Plan for College Students of Central South University, No. XCX2022271.

Institutional Review Board Statement

Not applicable.

Informed Consent Statement

Not applicable.

Data Availability Statement

Not applicable.

Acknowledgments

This work was financially supported by the National Natural Science Foundation of China (No. 52204119) and the Support Project of Innovation and Entrepreneurship Training Plan for College Students of Central South University (No. XCX2022271). The authors would like to acknowledge the editors and reviewers for their constructive comments, which have greatly improved this paper.

Conflicts of Interest

The authors declare no conflict of interest.

References

  1. Prata, J.C.; Silva, A.L.P.; Walker, T.R.; Duarte, A.C.; Rocha–Santos, T. COVID–19 Pandemic Repercussions on the Use and Management of Plastics. Environ. Sci. Technol. 2020, 54, 7760–7765. [Google Scholar] [CrossRef]
  2. Fadare, O.O.; Okoffo, E.D. COVID–19 face masks: A potential source of microplastic fibers in the environment. Sci. Total Environ. 2020, 737, 4. [Google Scholar] [CrossRef] [PubMed]
  3. Erjavec, A.; Plohl, O.; Zemljic, L.F.; Valh, J.V. Significant Fragmentation of Disposable Surgical Masks–Enormous Source for Problematic Micro/Nanoplastics Pollution in the Environment. Sustainability 2022, 14, 18. [Google Scholar] [CrossRef]
  4. Yusoff, F.M.; Abdullah, A.F.; Aris, A.Z.; Umi, W.A.D. Impacts of COVID–19 on the Aquatic Environment and Implications on Aquatic Food Production. Sustainability 2021, 13, 27. [Google Scholar] [CrossRef]
  5. Singh, E.; Kumar, A.; Mishra, R.; Kumar, S. Solid waste management during COVID–19 pandemic: Recovery techniques and responses. Chemosphere 2022, 288, 15. [Google Scholar] [CrossRef] [PubMed]
  6. Peng, J.; Wu, X.L.; Wang, R.L.; Li, C.; Zhang, Q.; Wei, D.Q. Medical waste management practice during the 2019–2020 novel coronavirus pandemic: Experience in a general hospital. Am. J. Infect. Control. 2020, 48, 918–921. [Google Scholar] [CrossRef]
  7. Chen, H.M.; Dong, X.; Zhao, Y.; Wang, D.J. Recycling and Chemical Upcycling of Waste Disposable Medical Masks. Acta Polym. Sin. 2020, 51, 1295–1306. [Google Scholar]
  8. Gutierrez, A.S.; Eras, J.J.C.; Hens, L.; Vandecasteele, C. The energy potential of agriculture, agroindustrial, livestock, and slaughterhouse biomass wastes through direct combustion and anaerobic digestion. The case of Colombia. J. Clean Prod. 2020, 269, 17. [Google Scholar]
  9. Selvaranjan, K.; Navaratnam, S.; Rajeev, P.; Ravintherakumaran, N. Environmental challenges induced by extensive use of face masks during COVID–19: A review and potential solutions. Environ. Chall. 2021, 3, 100039. [Google Scholar] [CrossRef]
  10. Ali, M.; Opulencia, M.J.C.; Chandra, T.; Chandra, S.; Muda, I.; Dias, R.; Chetthamrongchai, P.; Jalil, A.T. An Environmentally Friendly Solution for Waste Facial Masks Recycled in Construction Materials. Sustainability 2022, 14, 14. [Google Scholar] [CrossRef]
  11. Deng, Y.S.; Wu, P.; Zhao, M.H.; Duan, B.Z. Strength of expansive soil reinforced by polypropylene fiber under optimal water content. Rock Soil Mech. 2017, 38, 349–353. [Google Scholar]
  12. Liu, J.L.; Jia, Y.M.; Wang, J. Experimental Study on Mechanical and Durability Properties of Glass and Polypropylene Fiber Reinforced Concrete. Fibers Polym. 2019, 20, 1900–1908. [Google Scholar] [CrossRef]
  13. Li, L.H.; Zang, T.B.; Xiao, H.L.; Feng, W.Q.; Liu, Y.L. Experimental study of polypropylene fibre–reinforced clay soil mixed with municipal solid waste incineration bottom ash. Eur. J. Environ. Civ. Eng. 2020. [Google Scholar] [CrossRef]
  14. Mo, Y.X.; Pang, J.Y.; Huang, J.K. Dynamic Mechanical Properties and Fractal Characteristics of Polypropylene Fiber–Reinforced Cement Soil under Impact Loading. Adv. Mater. Sci. Eng. 2019, 2019, 14. [Google Scholar] [CrossRef] [Green Version]
  15. Idrees, M.; Akbar, A.; Mohamed, A.M.; Fathi, D.; Saeed, F. Recycling of Waste Facial Masks as a Construction Material, a Step towards Sustainability. Materials 2022, 15, 13. [Google Scholar] [CrossRef] [PubMed]
  16. Zhang, J.Q.; Wang, X.; Yin, Z.Y.; Yang, N.Y. Static and dynamic behaviors of granular soil reinforced by disposable face–mask chips. J. Clean Prod. 2022, 331, 9. [Google Scholar] [CrossRef]
  17. Xu, W.Q.; Yin, Z.Y.; Wang, H.L.; Wang, X. Experimental study on the monotonic mechanical behavior of completely decomposed granite soil reinforced by disposable face–mask chips. J. Clean Prod. 2022, 352, 11. [Google Scholar] [CrossRef]
  18. Meng, M.Q.; Wang, L.; Jiang, X.; Wang, C.G.; Liu, H.L.; Xiao, Y. Single–particle crushing test and numerical simulation of coarse grained soil based on size effect. Rock Soil Mech. 2020, 41, 2953–2962. [Google Scholar]
  19. ASTM International. Standard Practice for Classification of Soils for Engineering Purposes (Unified Soil Classification System); ASTM International: West Conshohocken, PA, USA, 2017. [Google Scholar]
  20. Ghadr, S.; Chen, C.S.; Liu, C.H.; Hung, C. Mechanical behavior of sands reinforced with shredded face masks. Bull. Eng. Geol. Environ. 2022, 81, 21. [Google Scholar] [CrossRef]
  21. SFDA. Surgical Mask; Standards Press of China: Beijing, China, 2011. [Google Scholar]
  22. Bi, D.M.; Kong, G.Q.; Chen, G.; Liu, W.H.; Qin, H.Y.; Xu, X.L. Strength Characteristics and Failure Mode of Solidified Soil Reinforced by Waste Masks. J. Disaster Prev. Mitig. Eng. 2022, 42, 993–998. [Google Scholar]
  23. ASTM International. Standard Test Methods for Specific Gravity of Soil Solids by Water Pycnometer; ASTM International: West Conshohocken, PA, USA, 2014. [Google Scholar]
  24. ASTM International. Standard Test Methods for Liquid Limit, Plastic Limit, and Plasticity Index of Soils; ASTM International: West Conshohocken, PA, USA, 2017. [Google Scholar]
  25. ASTM International. Standard Test Methods for Determination of Maximum Dry Unit Weight of Granular Soils Using a Vibrating Hammer; ASTM International: West Conshohocken, PA, USA, 2020. [Google Scholar]
  26. ASTM International. Standard Test Method for Particle–Size Analysis of Soils; ASTM International: West Conshohocken, PA, USA, 2002. [Google Scholar]
  27. Garg, A.; Bordoloi, S.; Mondal, S.; Ni, J.J.; Sreedeep, S. Investigation of mechanical factor of soil reinforced with four types of fibers: An integrated experimental and extreme learning machine approach. J. Nat. Fibers 2020, 17, 650–664. [Google Scholar] [CrossRef]
  28. An, N.; Yan, C.G.; Wang, Y.C.; Lan, H.X.; Bao, H.; Xu, J.B.; Shi, Y.L.; Sun, W.F. Experimental study on anti–erosion performance of polypropylene fiber–reinforced loess. Rock Soil Mech. 2021, 42, 501–510. [Google Scholar]
  29. Chen, M.; Shen, S.L.; Arulrajah, A.; Wu, H.N.; Hou, D.W.; Xu, Y.S. Laboratory evaluation on the effectiveness of polypropylene fibers on the strength of fiber–reinforced and cement–stabilized Shanghai soft clay. Geotext. Geomembr. 2015, 43, 515–523. [Google Scholar] [CrossRef]
  30. Lei, J.; Cheng, J.J.; Ding, B.S.; Ma, B.T.; Gao, L.; Li, Y.P.; Cheng, Y.L. Triaxial test study on aeolian sand cement–based materials with different fiber content. J. Railw. Sci. Eng. 2022. [CrossRef]
  31. ASTM International. Standard Test Method for Unconsolidated–Undrained Triaxial Compression Test on Cohesive Soils; ASTM International: West Conshohocken, PA, USA, 2015. [Google Scholar]
  32. ASTM International. Standard Test Method for Unconfined Compressive Strength of Cohesive Soil; ASTM International: West Conshohocken, PA, USA, 2013. [Google Scholar]
  33. Szypcio, Z. Stress–Dilatancy for Soils. Part III: Experimental Validation for the Biaxial Condition. Stud. Geotech. Mech. 2017, 39, 73–80. [Google Scholar] [CrossRef] [Green Version]
  34. Zhang, Y.; Zhao, Y.; Liu, J.; Meng, T.Y.; Shao, S.J.; She, F.T. An Experimental Study on the Deformation and Strength Characteristics of Q3 Loess under a Plain Strain Anisotropic Consolidation Condition. Adv. Civ. Eng. 2021, 2021, 13. [Google Scholar] [CrossRef]
  35. Liu, J.L.; Hou, T.S.; Luo, Y.S. Unconfined compressive strength of synthetic cotton fibers reinforced soil. J. Hydroelectr. Eng. 2018, 37, 12–21. [Google Scholar]
  36. Gao, L.; Hu, G.H.; Xu, N.; Fu, J.Y.; Xiang, C.; Yang, C. Experimental Study on Unconfined Compressive Strength of Basalt Fiber Reinforced Clay Soil. Adv. Mater. Sci. Eng. 2015, 2015, 8. [Google Scholar] [CrossRef] [Green Version]
  37. Jiang, H.T.; Cai, Y.; Liu, J. Engineering Properties of Soils Reinforced by Short Discrete Polypropylene Fiber. J. Mater. Civ. Eng. 2010, 22, 1315–1322. [Google Scholar] [CrossRef]
  38. Chen, C.L.; Fang, J.; Luo, A.Z.; Shao, S.J. In Study of Artificial Structural Loess under the True Triaxial Tests. In Proceedings of the International Conference on Structures and Building Materials (ICSBM 2013), Guizhou, China, 9–10 March 2013; Trans Tech Publications Ltd.: Guizhou, China, 2013; pp. 343–348. [Google Scholar]
  39. Benziane, M.M.; Della, N.; Denine, S.; Sert, S.; Nouri, S. Effect of randomly distributed polypropylene fiber reinforcement on the shear behavior of sandy soil. Stud. Geotech. Mech. 2019, 41, 151–159. [Google Scholar] [CrossRef] [Green Version]
  40. Yin, Z.Y.; Hicher, P.Y.; Jin, Y.F. Practice of Constitutive Modelling for Saturated Soils; Springer: Singapore, 2020. [Google Scholar]
  41. Jiang, P.; Lv, S.W.; Wang, Y.; Li, N.; Wang, W. Investigation on Direct Shear and Energy Dissipation Characteristics of Iron Tailings Powder Reinforced by Polypropylene Fiber. Appl. Sci. 2019, 9, 16. [Google Scholar] [CrossRef] [Green Version]
Figure 1. Grain size distribution of the tested soil.
Sustainability 15 04059 g001
Figure 2. Flowchart of the sample preparation.
Sustainability 15 04059 g002
Figure 3. Loading device of true triaxial test system.
Sustainability 15 04059 g003
Figure 4. Stress path of sample under uniaxial compression tests.
Sustainability 15 04059 g004
Figure 5. Stress path of sample under biaxial compression test.
Sustainability 15 04059 g005
Figure 6. Stress path of sample under conventional triaxial compression test.
Sustainability 15 04059 g006
Figure 7. Stress path of sample under true triaxial compression test.
Sustainability 15 04059 g007
Figure 8. Stress–strain curves of samples under (a) uniaxial; (b) biaxial; (c) conventional triaxial; and (d) true triaxial compression tests.
Sustainability 15 04059 g008
Figure 9. Failure patterns of samples with different contents of mask chips under Path Ⅰ.
Sustainability 15 04059 g009
Figure 10. Failure patterns of samples with different contents of mask chips under Path IV.
Sustainability 15 04059 g010
Figure 11. Variations of the failure strength of the sample with mask–chip content and stress paths.
Sustainability 15 04059 g011
Figure 12. Effect of mask–chip content on the percentage increase in failure strength under various stress paths.
Sustainability 15 04059 g012
Figure 13. Variations of elastic modulus: (a) E0 and (b) E50 with fm and stress path.
Sustainability 15 04059 g013
Figure 14. Lateral strain vs. axial strain curves of samples under: (a) path Ⅲ; (b) path Ⅳ; and (c) path Ⅳ.
Sustainability 15 04059 g014
Figure 15. Volumetric strain vs. axial strain curves of samples at (a) path Ⅲ and (b) path Ⅳ.
Sustainability 15 04059 g015
Figure 16. Poisson’s ratio vs. axial strain curves of samples under: (a) path Ⅲ; (b) path Ⅳ; and (c) path Ⅳ.
Sustainability 15 04059 g016
Figure 17. Energy absorption vs. fm of samples under different stress paths.
Sustainability 15 04059 g017
Table 1. Physical properties of the tested soil.
Soil PropertiesStandard Test SpecificationsValue
Mean Specific Gravity,
Gs (.)
ASTM D854–14 [23]2.673
Plastic Limit,
PL (%)
ASTM D4318–17 [24]21.8
Liquid Limit,
LL (%)
ASTM D4318–17 [24]44.3
Maximum Dry Density,
ρdmax (g/cm3)
ASTM D7382–20 [25]1.93
Medium Grain Size,
D50 (mm)
ASTM D422–63 [26]0.64
Maximum Diameter,
Dmax (mm)
ASTM D422–63 [26]5.00
Coefficient of Uniformity,
Cu (.)
ASTM D422–63 [26]8.81
Coefficient of Curvature,
Cc (.)
ASTM D422–63 [26]1.26
Table 2. List and properties of the samples.
Namefm (%)w (%)ρd (g·cm3)Stress Path
C0PⅠ0151.74
C01PⅠ0.1
C03PⅠ0.3
C05PⅠ0.5
C07PⅠ0.7
C0PⅡ0151.74
C01PⅡ0.1
C03PⅡ0.3
C05PⅡ0.5
C07PⅡ0.7
C0PⅢ0151.74
C01PⅢ0.1
C03PⅢ0.3
C05PⅢ0.5
C07PⅢ0.7
C0PⅣ0151.74
C01PⅣ0.1
C03PⅣ0.3
C05PⅣ0.5
C07PⅣ0.7
Disclaimer/Publisher’s Note: The statements, opinions and data contained in all publications are solely those of the individual author(s) and contributor(s) and not of MDPI and/or the editor(s). MDPI and/or the editor(s) disclaim responsibility for any injury to people or property resulting from any ideas, methods, instructions or products referred to in the content.