Article

Fractal Characterization of Brass Corrosion in Cavitation Field in Seawater

by
Alina Bărbulescu
1,* and
Cristian Ștefan Dumitriu
2,*
1
Department of Civil Engineering, Transilvania University of Brașov, 5, Turnului Street, 900152 Brașov, Romania
2
Faculty of Mechanical Engineering and Robotics in Constructions, Technical University of Civil Engineering of Bucharest, 122, Lacul Tei Av., 020396 Bucharest, Romania
*
Authors to whom correspondence should be addressed.
Sustainability 2023, 15(4), 3816; https://doi.org/10.3390/su15043816
Submission received: 31 December 2022 / Revised: 6 February 2023 / Accepted: 16 February 2023 / Published: 20 February 2023
(This article belongs to the Special Issue Construction Materials for Safe and Sustainable Built Structures)

Abstract

:
Cavitation is a physical process that produces complex effects on the machines and components working in conditions where it acts. One effect is the materials-mass loss by corrosion–erosion when components are introduced into fluids under cavitation. The analysis of the damages produced by cavitation is generally performed by using different destructive and non-destructive experimental techniques. Most studies on materials’ behavior in cavitation refer to the erosion–corrosion mechanism, and very few investigate the fissure propagation by fractal methods. None have investigated the fractal characteristics of the sample surface after erosion–corrosion or the multifractal characteristics of materials’ mass variation in time in a cavitation field. Therefore, this research proposes a computational approach to determine the pattern of materials’ damages produced by ultrasound cavitation. The studied material is a brass, introduced in seawater. Fractal and multifractal techniques are applied to the series of the absolute mass loss per surface and the sample’s micrography after corrosion. Such an approach has not been utilized for such a material in similar experimental conditions. This study emphasizes that the box dimension of the series of the absolute mass loss per surface is close to one, and its behaviour is close to a non-/monofractal. It is demonstrated that the material’s surface corrosion is not uniform, and its multifractal character is highlighted by the f( α ) spectrum and the multifractal dimensions, which have the following values: the capacity dimension = 1.5969, the information dimension = 1.49836, and the correlation dimension = 1.4670.

1. Introduction

An ultrasound signal passing through a liquid produces the cyclic apparition, increase, and collapse of the vapor bubbles formed in the liquid. This phenomenon is called cavitation [1]. It is accompanied by discontinuities in the liquid’s state (as a result of the pressure decrease under critical limits) [2] and high temperatures at the time of the bubbles’ collapse. Other consequences of cavitation are vibrations, noise, sonoluminescence, emulsification, unpassivation, corrosion of the materials immersed in the liquid, and the apparition of an electrical signal at the boundary of the cavitation region [3,4,5,6].
Copper alloys are used in different industries, such as in naval engineering for building propellers, ballast installation, and bilge systems. Given their industrial applications, different scientists [7,8,9,10,11] have analyzed the behavior of such alloys under cavitation. Schüssler and Exner [7], Wharton and Stokes [9], and Wharton et al. [10] studied the corrosion of bronzes with Ni and Al in seawater, aiming to explain the corrosion mechanism and the unpassivation effect. The same kind of alloys attracted the interest of Basumatary and Wood [11], who presented their experimental results on Ni-Al bronze in a NaCl solution (3.5%). The behavior of some materials for ship propellers has been investigated by Basumatary et al. [10], who found a better resistance of the bronze sample to corrosion–erosion produced by cavitation compared with that of the stainless steel in their experiment.
Some mechanical properties’ variations of Cu alloys after the corrosion in different solutions of electrolytes with concentrations between 0 and 0.71 M were studied by Hamidah et al. [12]. Alfantazi et al. [13] investigated the influence of the pH variation (from 6.5 to 10) on the potentiodynamic polarization behavior (in 1 M NaCl solution) of Cu–30Ni, Cu-30Zn, and 90Cu–8Al–2Fe alloys.
The most used investigation methods in this type of research are open circuit potential (OCP) [14,15], electrochemical impedance spectroscopy (EIS) [14], electrochemical noise measurement [16], and synergy tests [10]. These methods show that the resistance of some copper alloys to cavitation in seawater increases when Sn is added to bronze [17]. Furthermore, adding Ni to their composition improves the mechanical characteristics of the bronzes with Al and Fe in a cavitation field.
Apart from the corrosion mechanism and the variation of the metallic materials’ mechanical properties, another research direction has been to model the variation of the Cu alloys in the cavitation field in various liquids [7,18,19,20].
Introduced by Mandelbrot [21], the fractal theory has been developed and applied to assess the time series characteristics in many scientific fields, such as hydrometeorology [22,23], geology [24], signal analysis [25], and remote sensing [26]. The fractal study of images is a valuable tool in the medical sciences for correct diagnostics, such as for pulmonary diseases [27,28], dental imaging [29,30], and trabecular bone investigations [31]. Moreover, fractal analysis has become a tool to determine materials’ structures’ behavior during the working and failure periods. The fractal applications to corrosion and cracking problems can be classified into (a) the experimental study of fractal characteristics of sections (in materials) and the determination of the fractal measures [32], (b) establishing the correlations between the materials’ mechanical properties and their fractal dimensions [33,34], and (c) detecting the physical mechanism of fractal fracture [35,36].
Zavdoveev et al. [37] studied the variation of the fractal dimension of different metals in the severe plastic deformation process. The variation of the fractal dimension of the crack propagation in Ni-Cr steel in two heat treatments was analyzed by Dlouhý and Strnadel [38]. The characterization of some concrete surfaces cracking and their correlation with the corrosion of the steel bars that reinforce the concrete was reported by Ji et al. [36], Li et al. [39], and Xu et al. [40].
The roughness of different steel surfaces was investigated by Davis and Hall [41] and Karolczak et al. [42]. Their studies can be successfully applied to surfaces’ corrosion evaluation. Kim and Hwang [43] proposed the evaluation of a fractal technique for corrosion studies. They used the Hust parameter to analyze the electrochemical noise collected during the corrosion of two types of steel in a NaCl solution.
Songbo et al. [44] investigated the critical pit’s fractal character in relation to corroded steel’s degradation. Zhang et al. [45] studied the surfaces of corroded thin steel plates. The corrosion inhibition of steel in a bromide solution was investigated using the rescaled range analysis (introduced by Hurst), which belongs to the fractal techniques [46].
Despite various studies using the fractal methodology for corrosion analysis, only a few scientists [47,48] have studied the corrosion of copper alloys by fractal methodology, none of which focused on the ultrasound cavitation field. In the presented context, this article proposes a computational approach to determine the pattern of the damages of a brass sample subject to the ultrasound cavitation produced in seawater using fractal and multifractal techniques. The fractal dimensions of the series of absolute mass loss variation per surface and of the image of the corroded sample’s surface are estimated. The results complete the findings from [18,19,49], which proposed different mathematical models for the mass loss and mass loss per surface of some copper alloys in the cavitation field in similar conditions. The main advantage of this methodology is that it provides a non-destructive evaluation of corrosion using the fractal dimensions of the corrosion surface [50].

2. Materials and Methods

2.1. Materials

The experimental plant built for studying the corrosion–erosion in ultrasound cavitation is presented in Figure 1.
The principal components are [5,6]:
-
The reservoir (1) for the liquid;
-
The generator (8) that produces the ultrasounds, working at 220 V, 18 kHz, and 80, 120, or 180 W;
-
The piezoceramic transducer (7) that enters into oscillation as a response to the high-frequency signal received from the generator, producing the cavitation;
-
The control panel (9) used to select the ultrasound generator’s working regimen;
-
The cooler (11) utilized for keeping constant the liquid’s temperature;
-
The measurement electrodes employed for capturing the signal induced by cavitation in the experiments designed for this aim;
-
The acquisition data unit (14), which collects the electrical signal produced by the ultrasound cavitation;
-
The pump (3), which is switched on for experiments in the circulating liquid medium.
The following conditions were met in the experiments whose results are presented here. The material samples were immersed in seawater (with pH = 7, the concentration of sodium chloride = 22.17 g/L, sulfate ion = 0.31 g/L, Fe (and Ni) 0.051 (and 0.0033) mg/L, and total hardness = 6.27 meq/L) in the cavitation field for 1320 min. Every 20 min, they were extracted, cleaned, and weighed. The water temperature was maintained at 20 °C. The studied material was brass with 2.75% Pb and 38.45% Zn besides Cu (57.95 %).
The time series of the absolute mass loss (computed as the difference between the initial sample mass and its mass at the measurement moment) per surface was built from the collected data. The corrosion effect on the material was observed using a scanning electron microscope (SEM, JSM-6360, JEOL, Tokyo, Japan).
Finally, the fractal and multifractal analyses of the absolute mass loss curve and the corroded surface were performed, as described in the next section.

2.2. Methodology

“Fractal” is a word derived from “fractus,” a Latin adjective meaning “fragmented” or “irregular.” A characteristic of the fractals is their length or area dependence on the measurement scale [26]. Fractal objects also have a self-similarity property (the scale invariance of the object shape), which does not hold exactly for objects found in nature. Therefore, the dimension of such a set, called fractal dimension, d, is empirically estimated by the Formula (1), as for the self-similar mathematical sets:
d = ln ( n ε ) ln ( 1 / ε ) ,
where n ε is the number of the set’s parts and ε is the scale ratio [21].
The most used method to evaluate fractal dimension is box counting. It relies on covering the figure with a quadratic grid whose cell edge length increases at each step of the algorithm. The counted cells are those containing at least one point. The dimension computed by this procedure is called the box dimension (   d b o x ).
Generally, the procedure of empirical evaluation of d b o x is the following:
  • Set different sizes of the sides and determine the “cells” necessary to cover the object,
  • Fit the least squares linear regression of the measured cells vs. the sizes of the sides in a log-log scale,
  • Determine dbox as the slope of the line from the previous step.
In this study, the box dimension was estimated by increasing the dimensions of the boxes that covered the curve from two pixels to the maximum possible size, using an arithmetic progression with a ratio equal to two and a grid rotation of 12°.
To obtain the correlation dimension ( d c o r r ), windows (circular or square) were built around the points of the analyzed figure, and the average number of points contained by the windows was counted. The procedure was repeated for different values of the sizes (from the smallest to the highest ones) [51].
The capacity dimension ( d c a p ) is defined by:
d c a p = lim ε 0 ε > 0 ln ( N ε ) ln ( ε ) ,
(when this limit is defined), ε > 0   and N ε being the element’s size and the number of elements (of a certain size) covering the set, respectively [52].
The information dimension ( d i n f ) is estimated by [53]:
d i n f = lim ε 0 ε > 0 i = 1 N ε P i ( ε ) ln ( P i ( ε ) ) ln ( ε ) ,
where ε is the element’s size and P i ( ε ) is the normalized probability that the ith cell is not empty.
From a practical viewpoint, the set whose dimension should be evaluated is covered with boxes for computing d i n f . If the size of the box edge is ε , P i ( ε ) is the ratio between the number of points in the ith box and the total number of points. The numerator, information entropy (I ( ε ) ) , is computed first. The slope of the regression line of I ( ε )   vs. ln( ε ) approximates d i n f .
It can be proved [53] that the following inequalities are true:
d c o r r d i n f d c a p .
The reader may see [54,55] for details on these dimensions.
There are different methods utilized to assess multifractality. One of them involves the computation of the singularity spectrum of a certain measure used to estimate the differences between the pixels of the analyzed images. In our study, it needed to distinguish the corroded parts from the non-altered ones. For this aim, giving a 2-dim field covered by a grid, a measure function is defined by:
P j k ( ε ) = n j k / n j k
where n j k and     P j k ( ε )   are the percentage of the grey value and the probability of its apparition, in the (j,k) box with an ε size, respectively. Therefore, the probability of the apparition of some pixels in a certain box depends on the box size to an exponent that is variable when covering the image. Thus, a partition function is constructed by:
Z q ( ε ) = P j k q ( ε ) = ε τ ( q ) ,
where q R is the moment’s order.
In the case of the multifractal character, τ ( q ) , called the mass exponent, can be estimated by fitting a least squares linear curve of lg ( Z q ( ε ) ) vs. lg( ε )   [56]. It can also be computed by:
τ q = lim ε 0 lg ( P j k q ( ε ) lg ( ε ) .
In the case of a monofractal field, the chart of τ q versus q is a straight line for all values of q.
Another way to characterize the multifractal sets is by using a Legendre transform to define the f(α)- spectrum function (or singularity spectrum), by
f ( α ( q ) ) = q α ( q ) τ ( q ) = q d τ ( q ) d q τ ( q ) ,
where α is the singularity (Hölder) exponent [55,57].
  • Plotting f(α) against α gets the multifractal spectrum.
  • The multifractality strength can be evaluated by the singularity spectrum amplitude Δ α = αmaxαmin. The multifractality’s strength increases with Δ α .
Renyi [58] introduced D q , Renyi’s dimension (or generalized dimension), as a multifractality measure, by:
D q = 1 q 1 lim ε 0 lg ( Z q ( ε ) ) lg ( ε )   ,
where ε is the box size. The relationship between D q and τ q is [58]:
τ q = ( q 1 ) D q .
In the multifractality case, the graph of the curve obtained by plotting D q vs. q had a reverse sigmoid shape, whereas, in the monofractal situation, the shape of the curve was linear (tending to be horizontal).
To perform this analysis, the software utilized was FracLac for ImageJ 4.5.2. (Charles Sturt University, Australia/Canada) [59].

3. Results and Discussion

3.1. Analysis of the Absolute Mass Loss Per Surface Curve

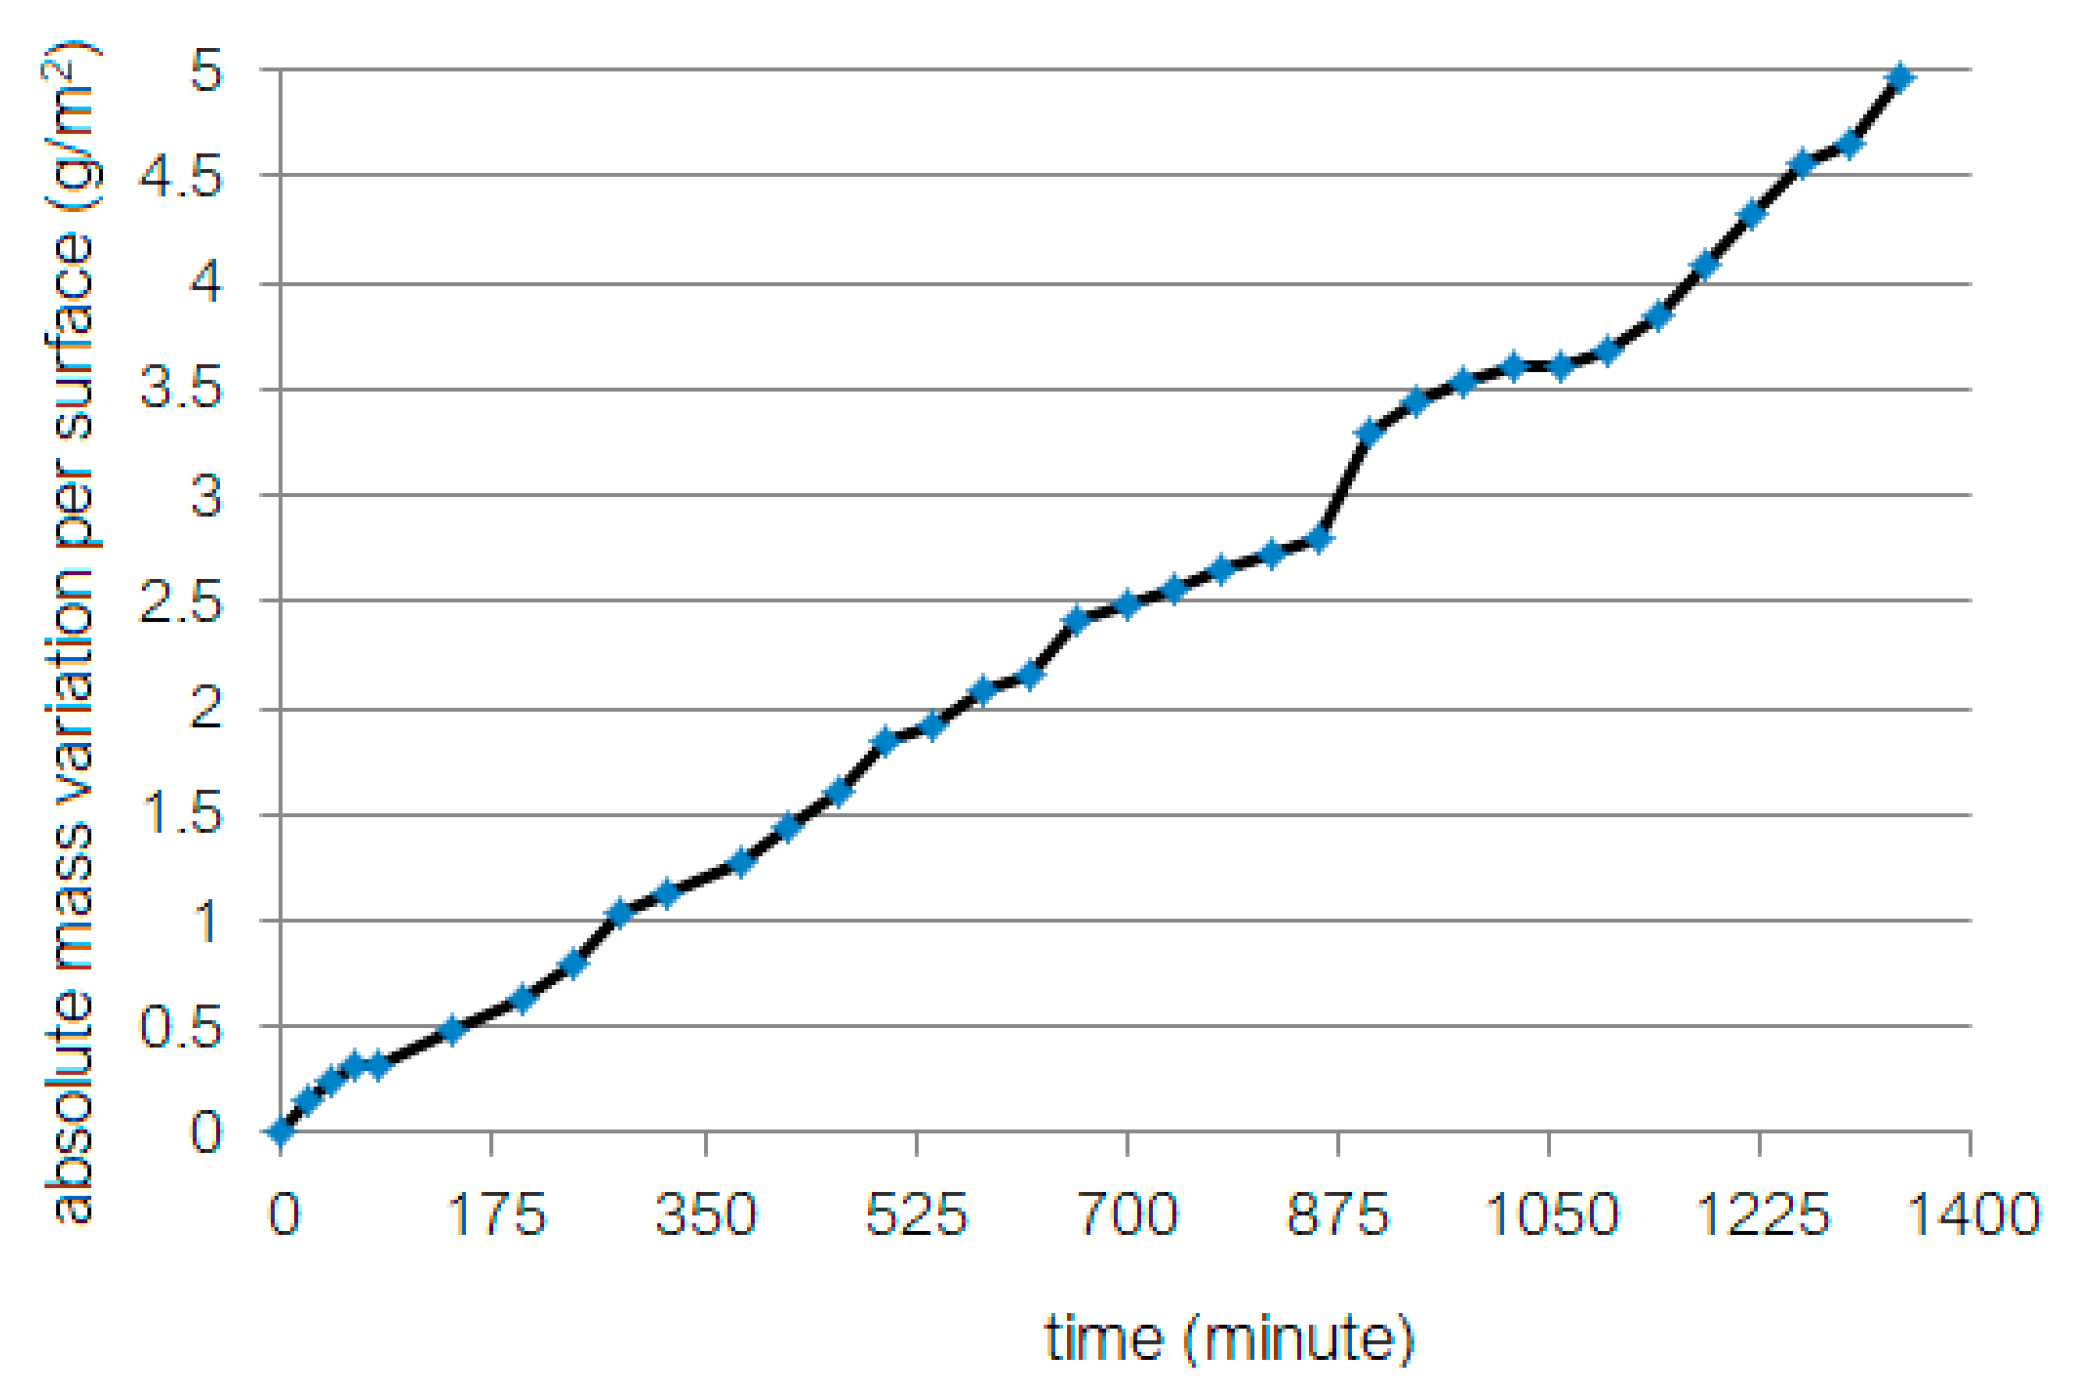
The absolute mass loss of the sample per surface is presented in Figure 2.
According to [49], the trend of mass loss ( Δ m t )   per surface (S) can be described by the equation:
Δ m t / S = 0.0732 + 0.1922 t + 0.0008 t 2 ,
where t is the time and the determination coefficient is   R 2 = 0.9957 . A good evaluation of the trend of the mass loss per surface is also given by the linear model, with R 2 = 0.9951 :
Δ m t / S = 0.0138 + 0.2105 t .
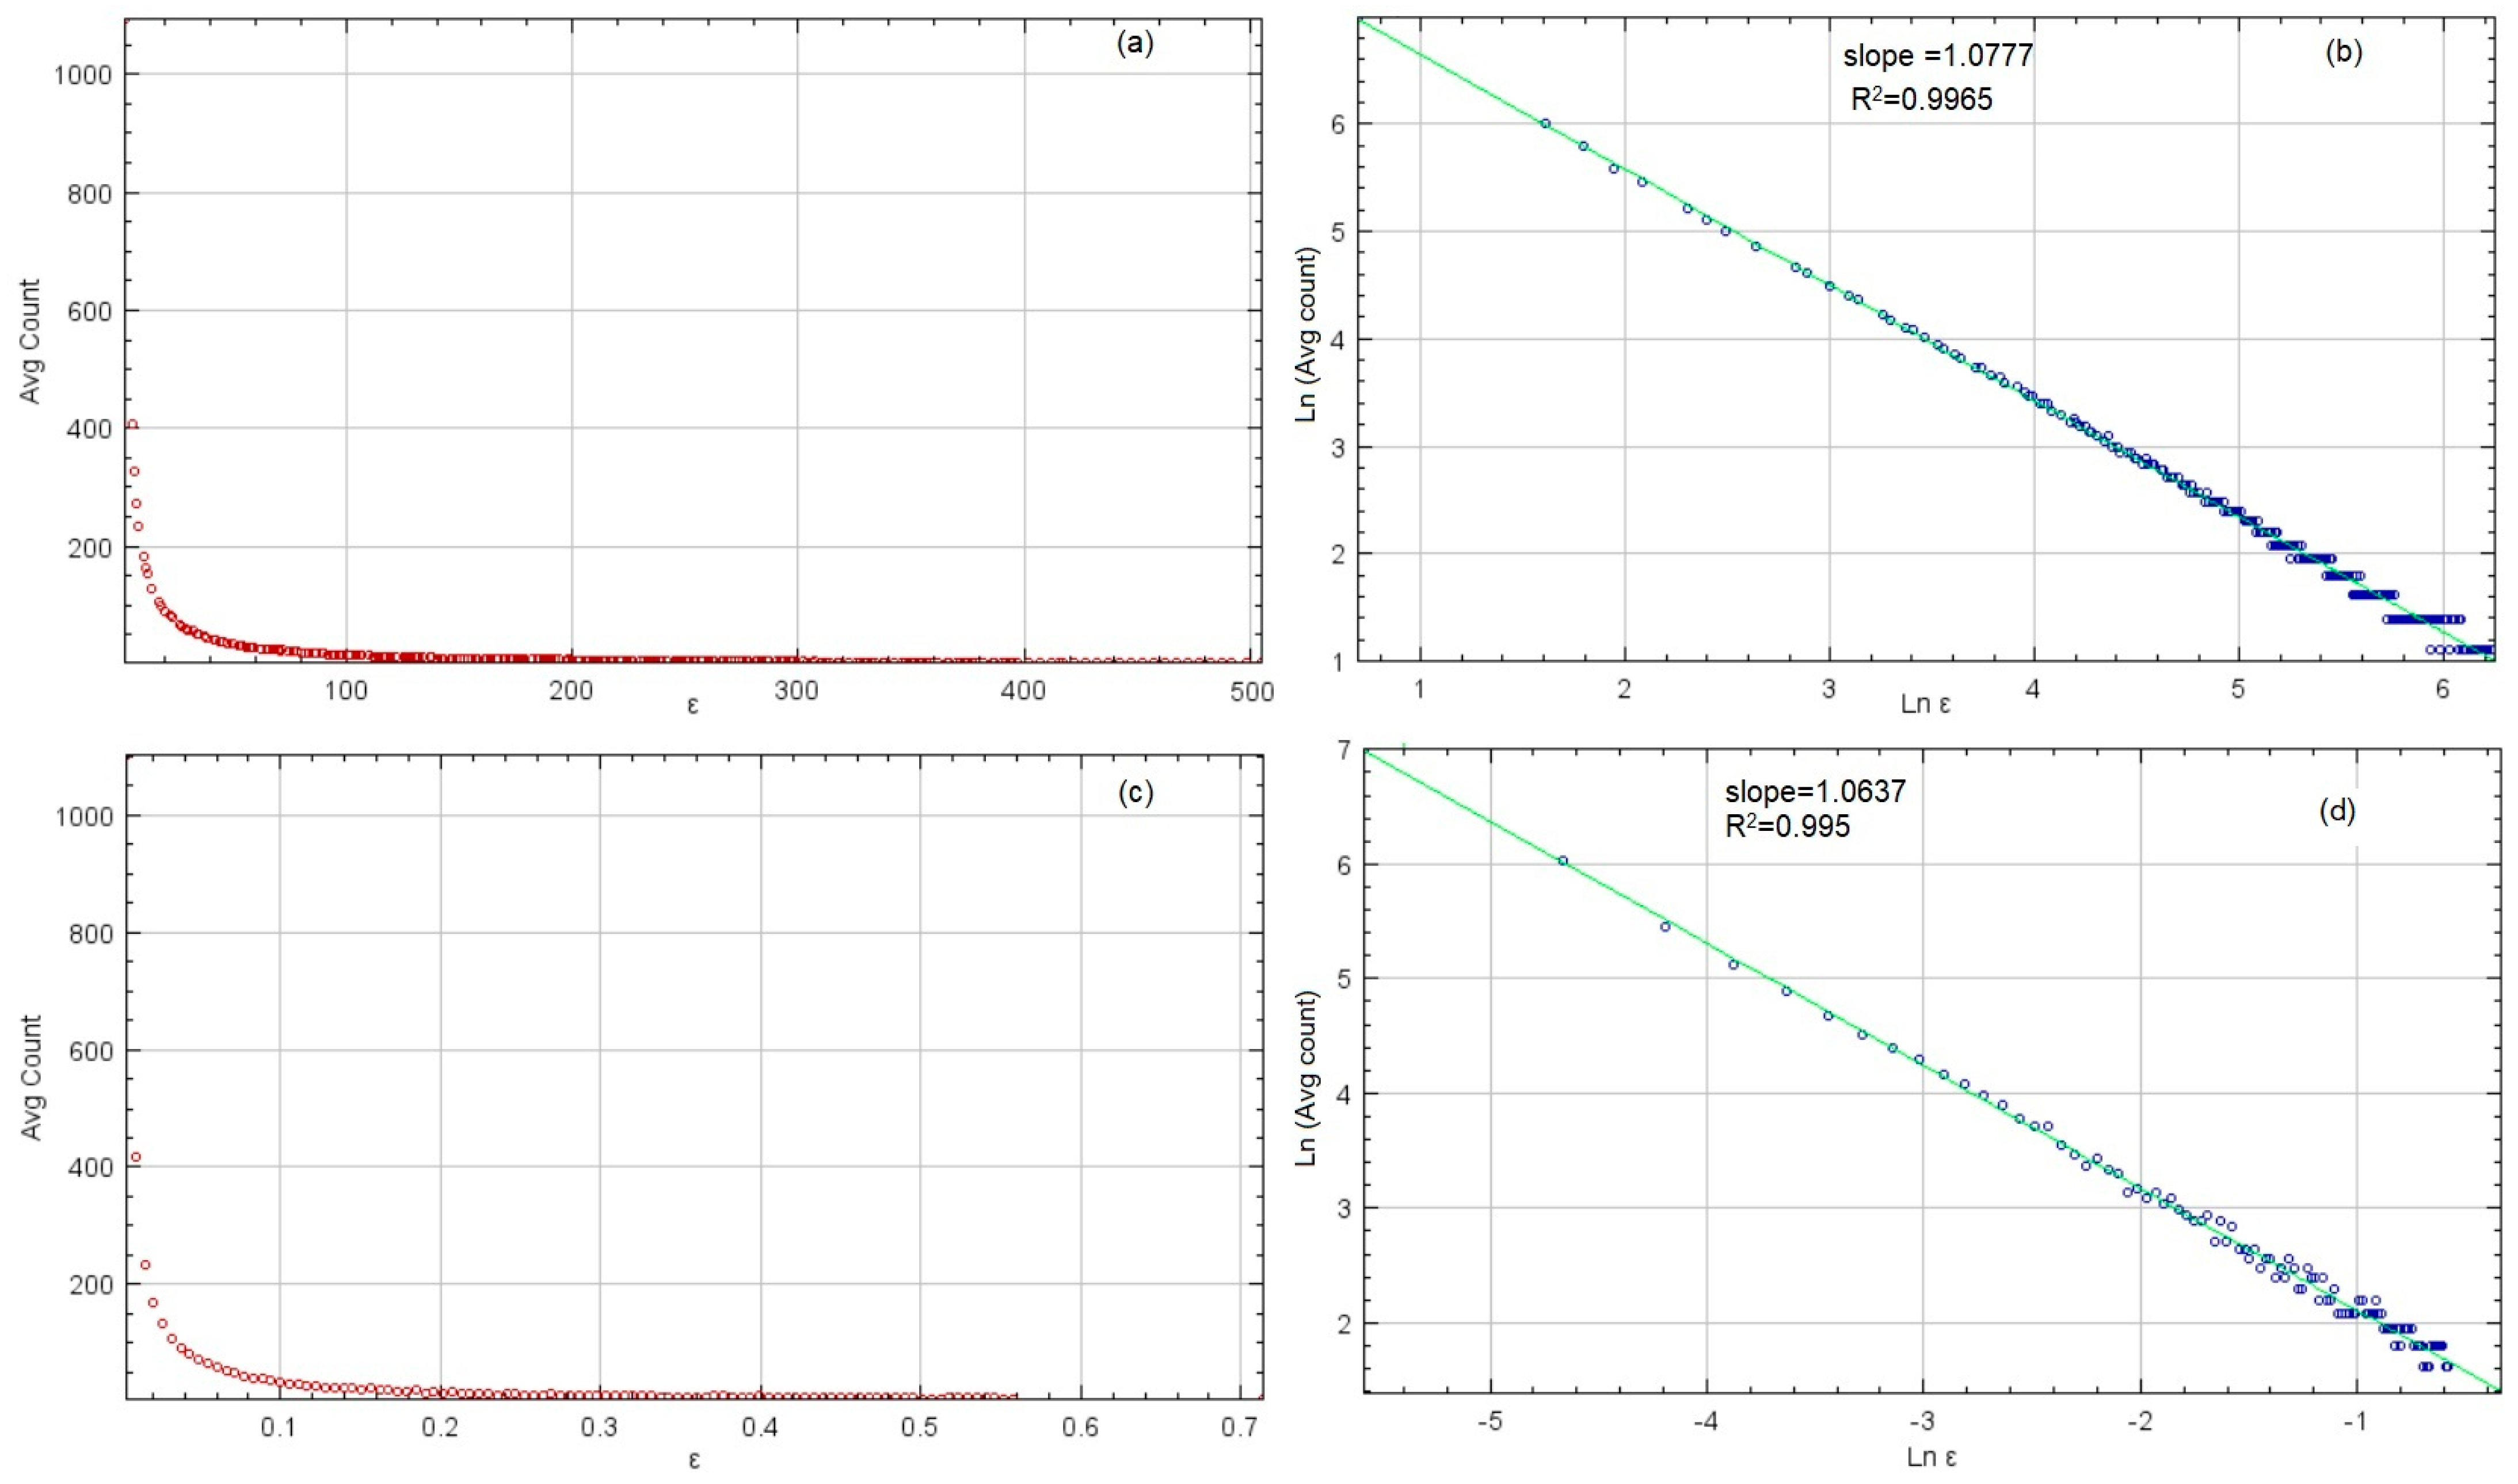
The fractal analysis was performed in the first stage. It included the box dimension estimation, as presented in Figure 3. In Figure 3a, the average number of boxes (Avg Count) used to cover the curve in the experiment is plotted against the box size (ε). The chart has an exponentially decreasing shape. The same dependence was represented in an ln-ln scale to determine the box dimension, resulting in the chart from Figure 3b. The slope of the least squares regression line through the points of coordinates (ε, lnε) is the box-counting dimension.
Since experiments were performed by rotating the boxes that cover the curve from Figure 2 by multiples of 15°, different values of the box dimensions were obtained. Figure 3c,d show the same results as in Figure 3a,b, but for the experiments with the lowest box dimensions among all the experiments.
In all experiments (30–given that the rotation angle was set to 15°) the d b o x   varied between 1.0637 and 1.0889, with R2 above 0.995, and the standard deviation (SD) under 0.0368. Taking into account the ln(average count) (denoted in Figure 3 by Ln(Avg Count)), d b o x = 1.0777 , with R2 = 0.9965, and SD = 0.0115. Therefore, 1.0777 can be considered a good estimation of the box dimension. Moreover, d b o x is close to one, which is in concordance with the remark that a linear equation describes the mass loss trend (so, the series exhibits a nonfractal/monofractal behavior).
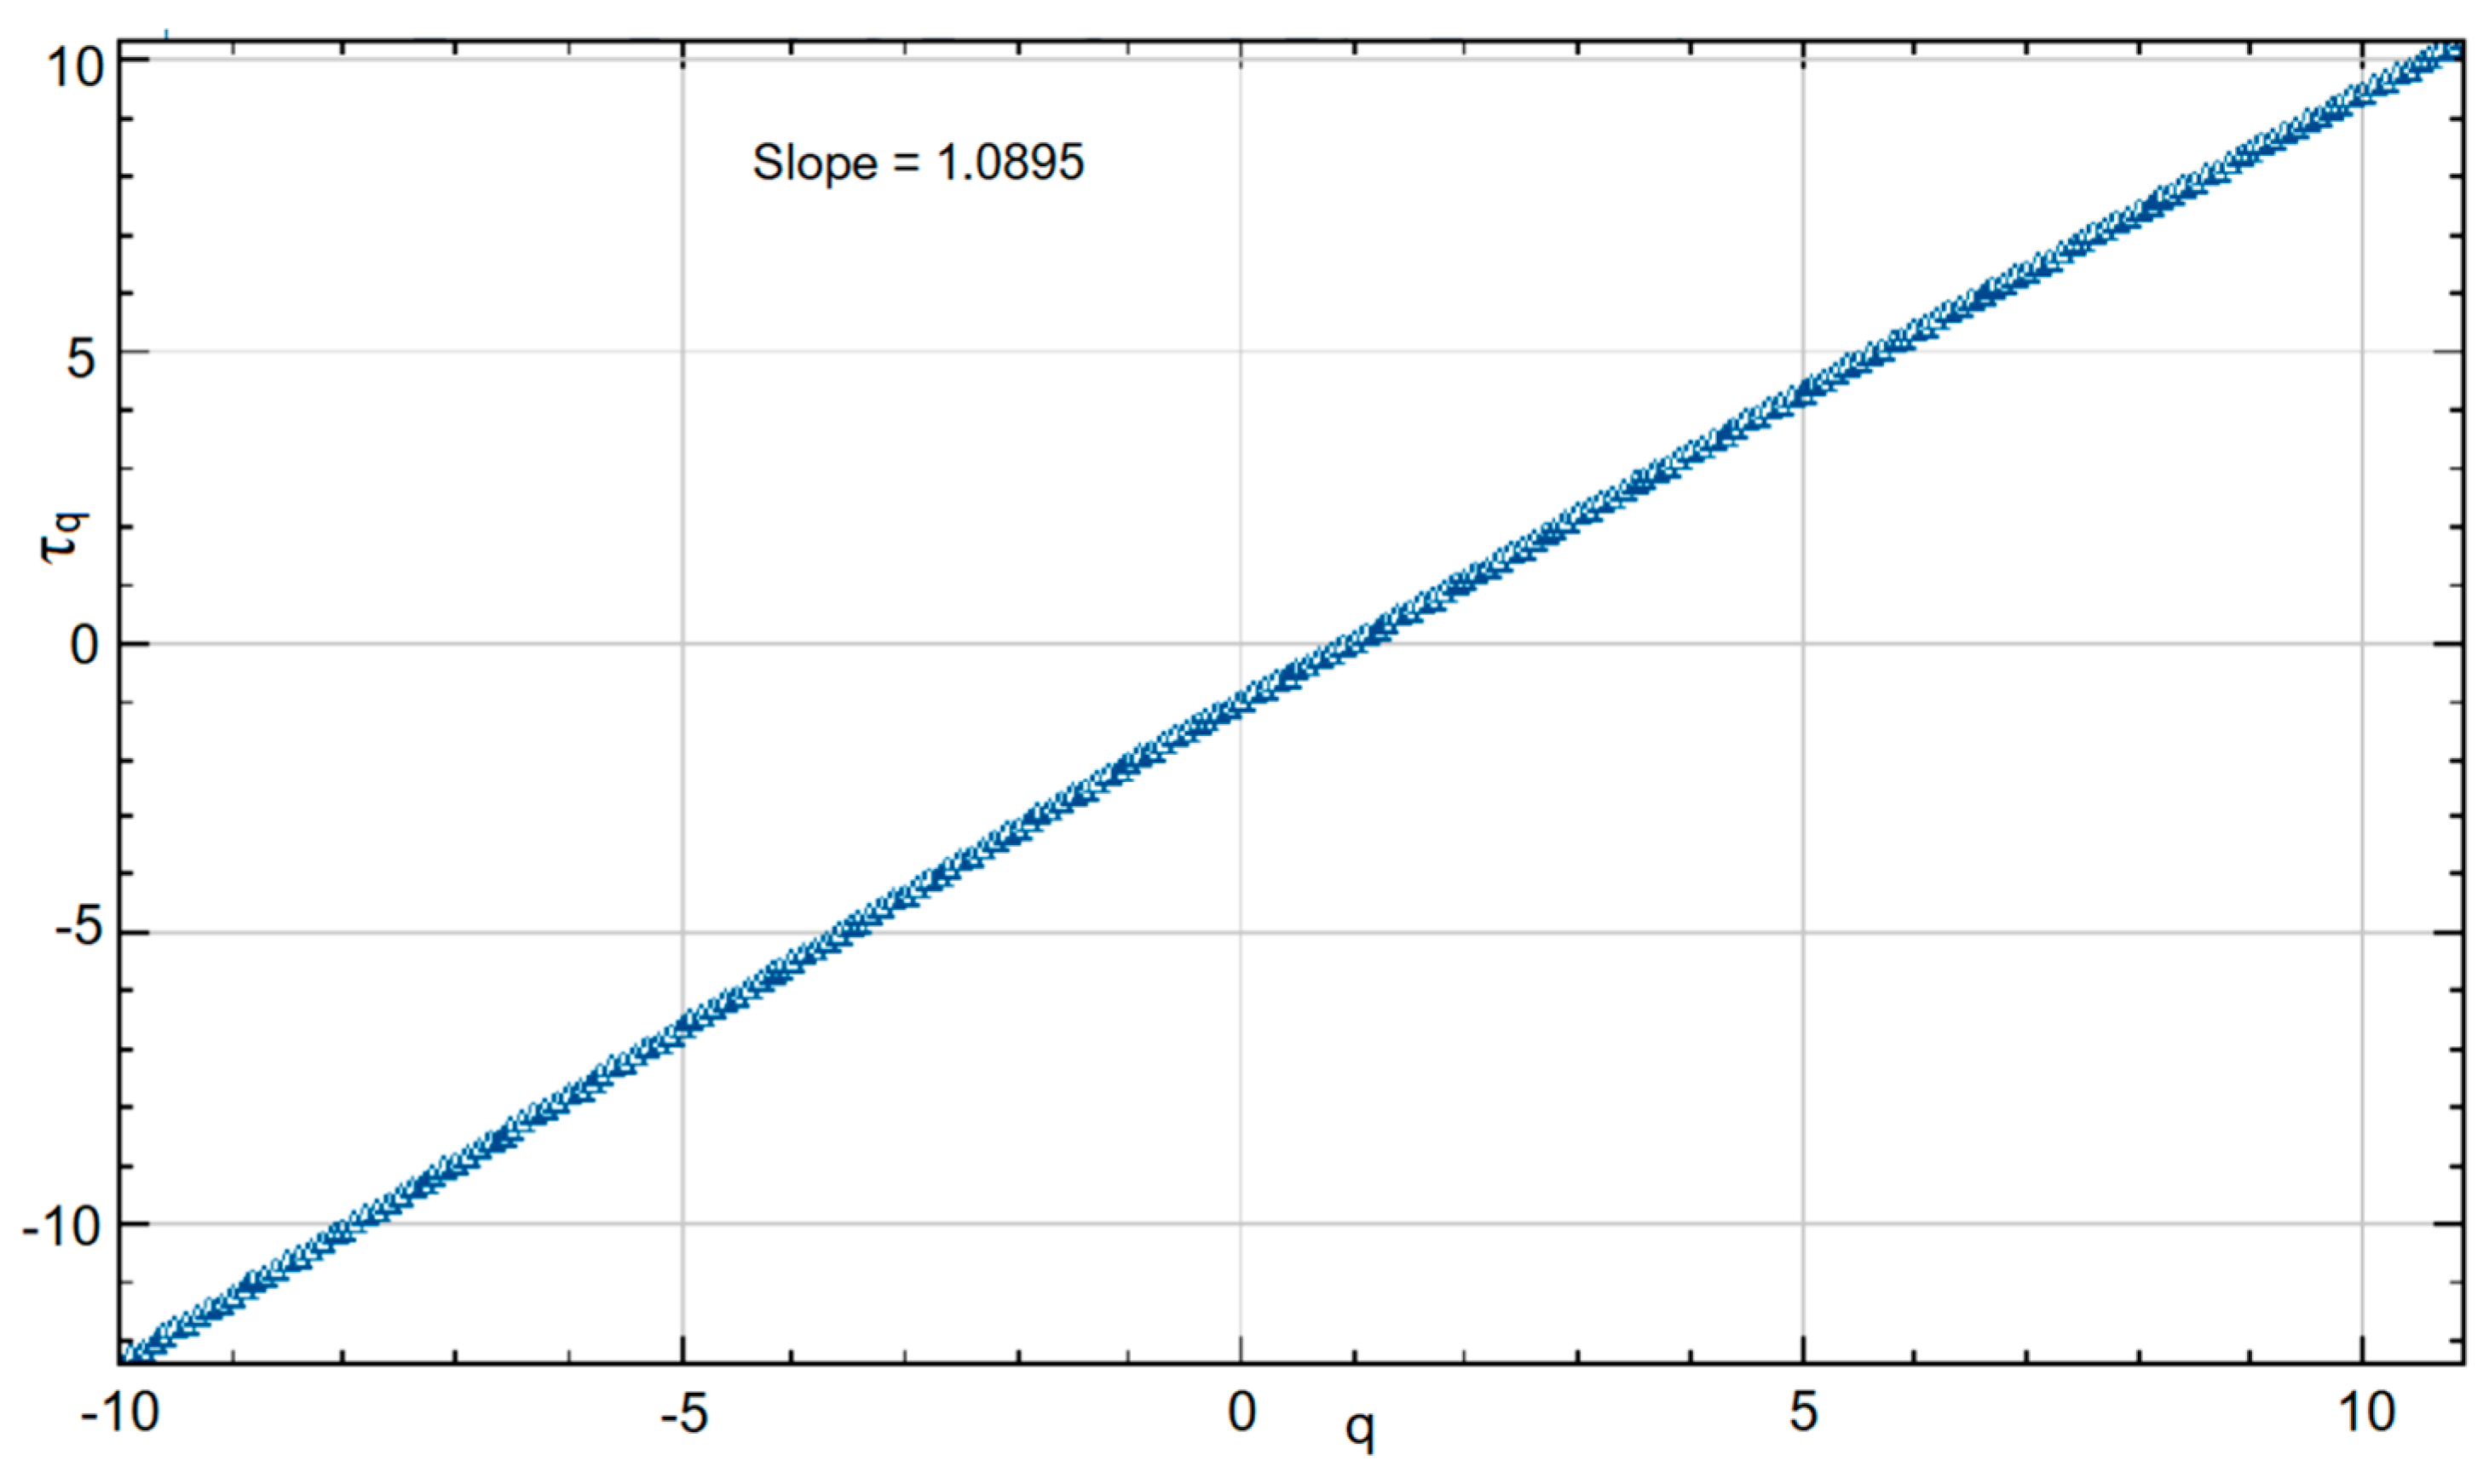
Figure 4 displays the chart of the mass exponent, τ q , computed for the curve in Figure 2. The chart shows a straight line, indicating a monofractal behavior of the series of mass loss per surface. The slope of the line is 1.0895, close to the value of the box dimension.
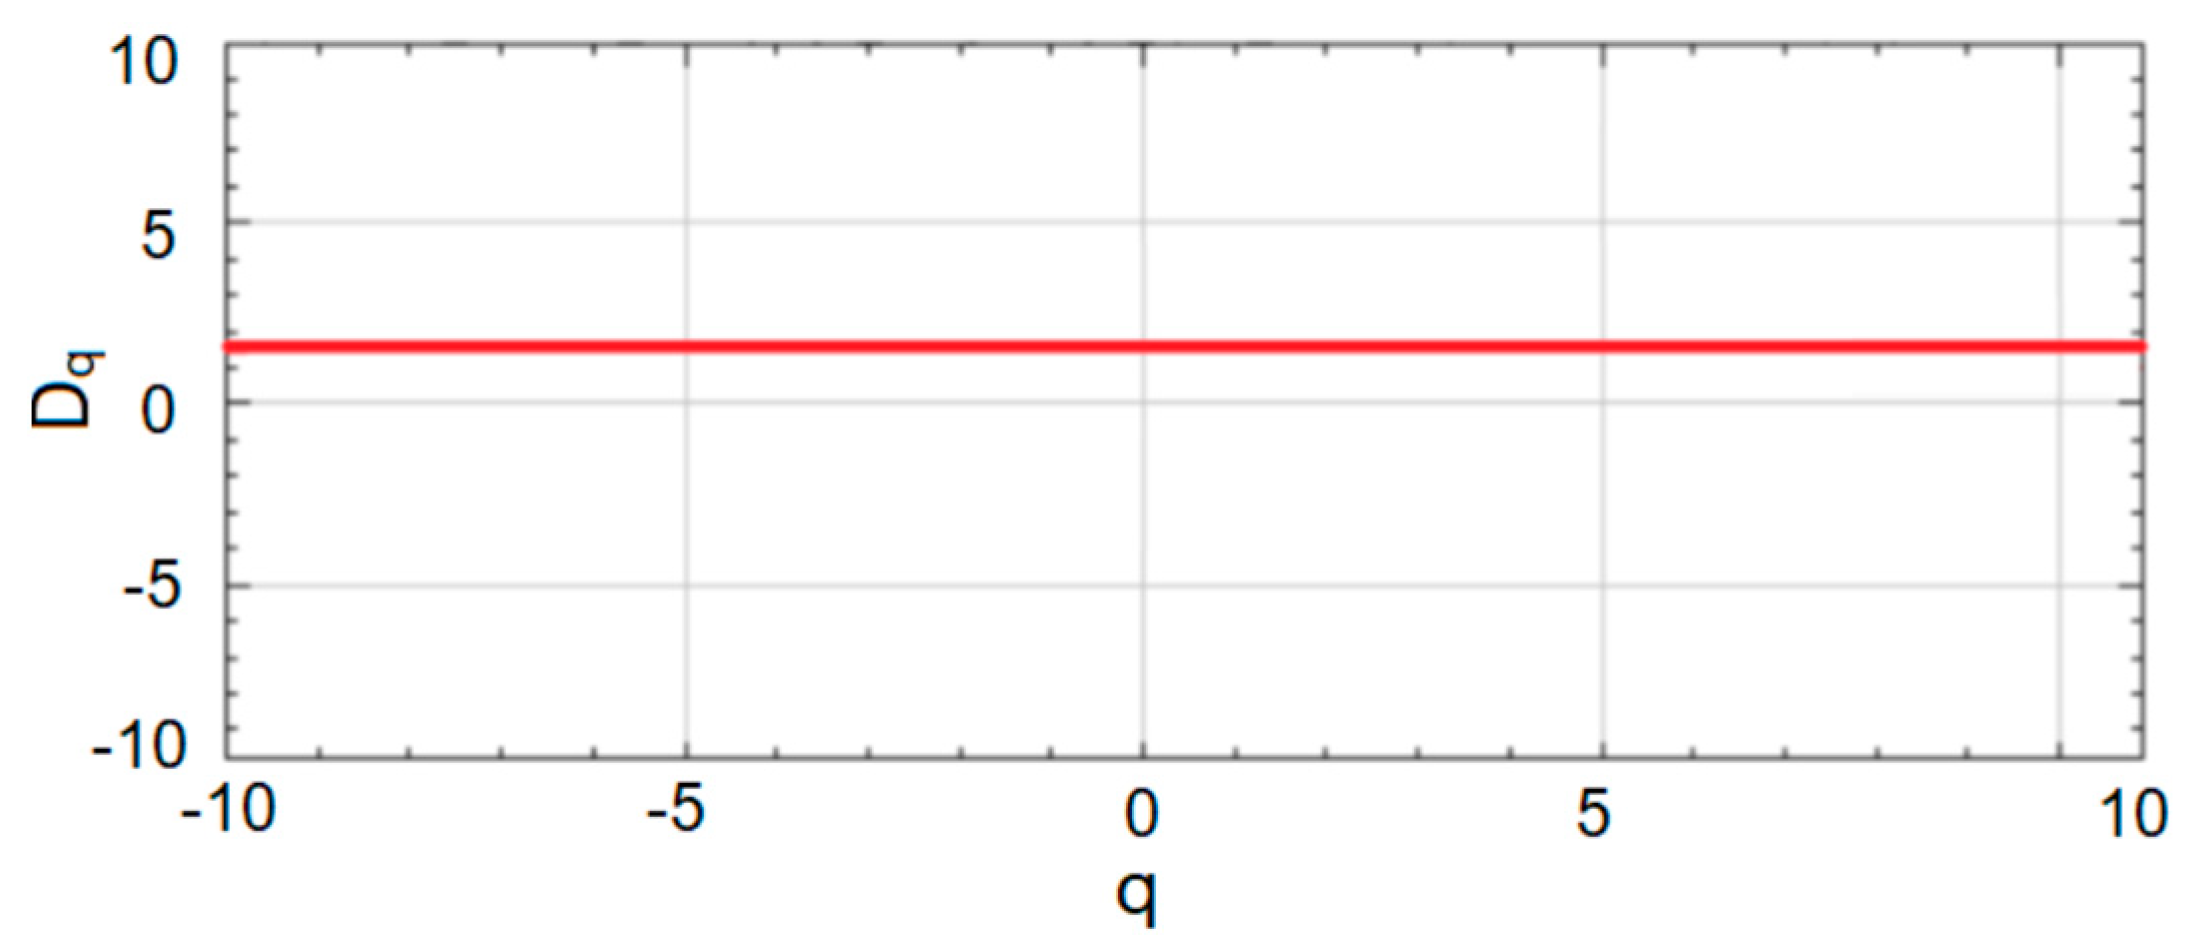
To determine the multifractal character of the series, Renyi’s dimension was computed, and the shape of the   D q   chart vs. q was observed. Conclusions were drawn based on the knowledge that a sigmoidal S-shape on the chart is to be expected in a multifractal case. Figure 5 presents the plot of D q   as a function of q, for q [ 10 ,   10 ] . The chart of   D q   vs. q shows a straight line, indicating that D q   is a constant, equal to D 0 = 1.22. Therefore, this remark led to the same conclusion of the multifractality absence, already drawn from the analysis of Figure 4.
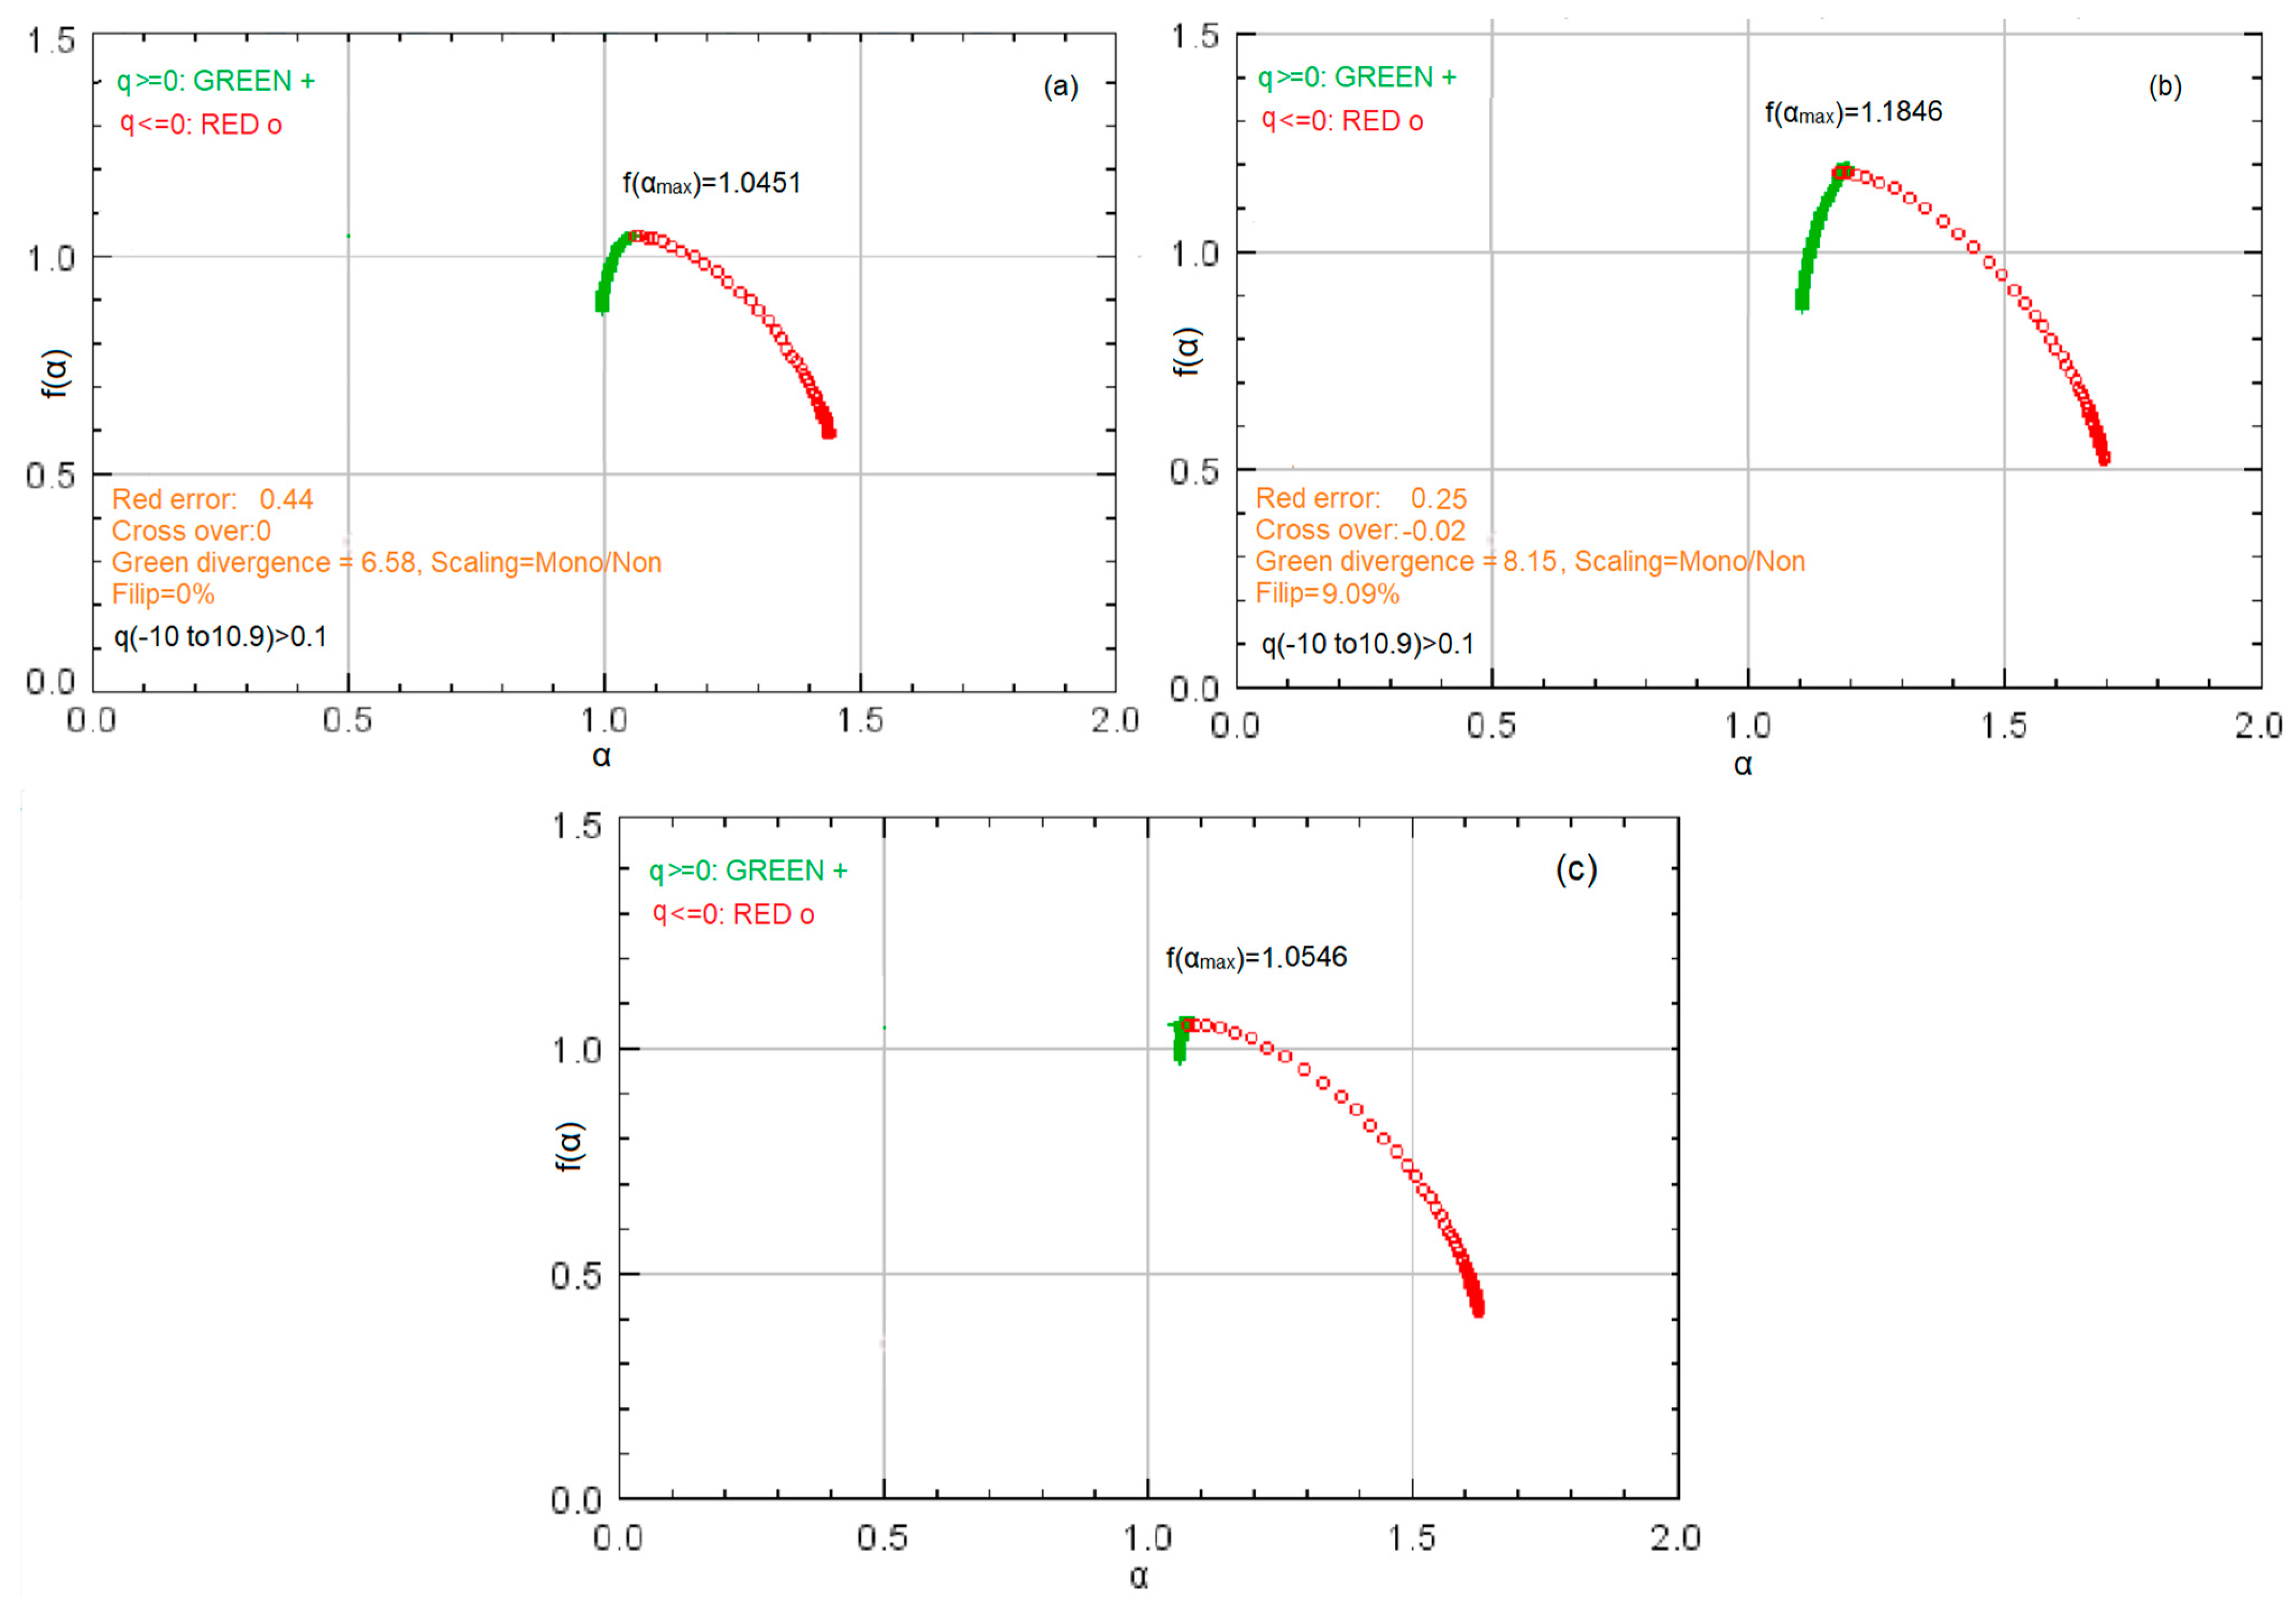
Figure 6a,b contain the chart of the f(α)–spectrum in two experiments. Figure 6c shows the f(α)–spectrum for the average values in all the experiments. The maximum f(α) value in Figure 6c is 1.0546, for α = 1.0751. In half of the performed experiments, the f(α)–spectrum indicated a non-/monofractal behavior (f(α) converges). In the other half, a multifractal behavior was indicated, but the Δ α values were very small, suggesting a low multifractality intensity. Therefore, in the absence of concordance in all the experimental results, the series multifractality must be rejected. By combining these findings with those drawn from the charts of τ q ,   and D q , one may conclude that the analyzed time series does not present the multifractality property.

3.2. Fractal Analysis of the Sample Surface after Corrosion

Figure 7 shows the corrosion morphology before (Figure 7a) and after (Figure 7b) the experiment, for comparison purposes. The black dots from Figure 7a, found in Figure 7b as well, indicate the material’s compounds. The black zones from Figure 7b represent the corroded regions, while the white ones are those not affected by corrosion–erosion.
Before running the experiments for detecting the fractal/multifractal property of the sample’s surface after the ultrasound action, the sample’s picture was binarized using ImageJ, with the default setting. Figure 7b indicates the presence of a certain pattern and some shapes’ irregularities and orientations. Only a few local corrosion points are isolated (characteristics of pitting), most of them being connected. The morphology becomes more complex when the corrosion processes advance, at the same time as the mass loss augmentation. This observation is in concordance with the findings of Xu et al. [40] for other metallic materials.
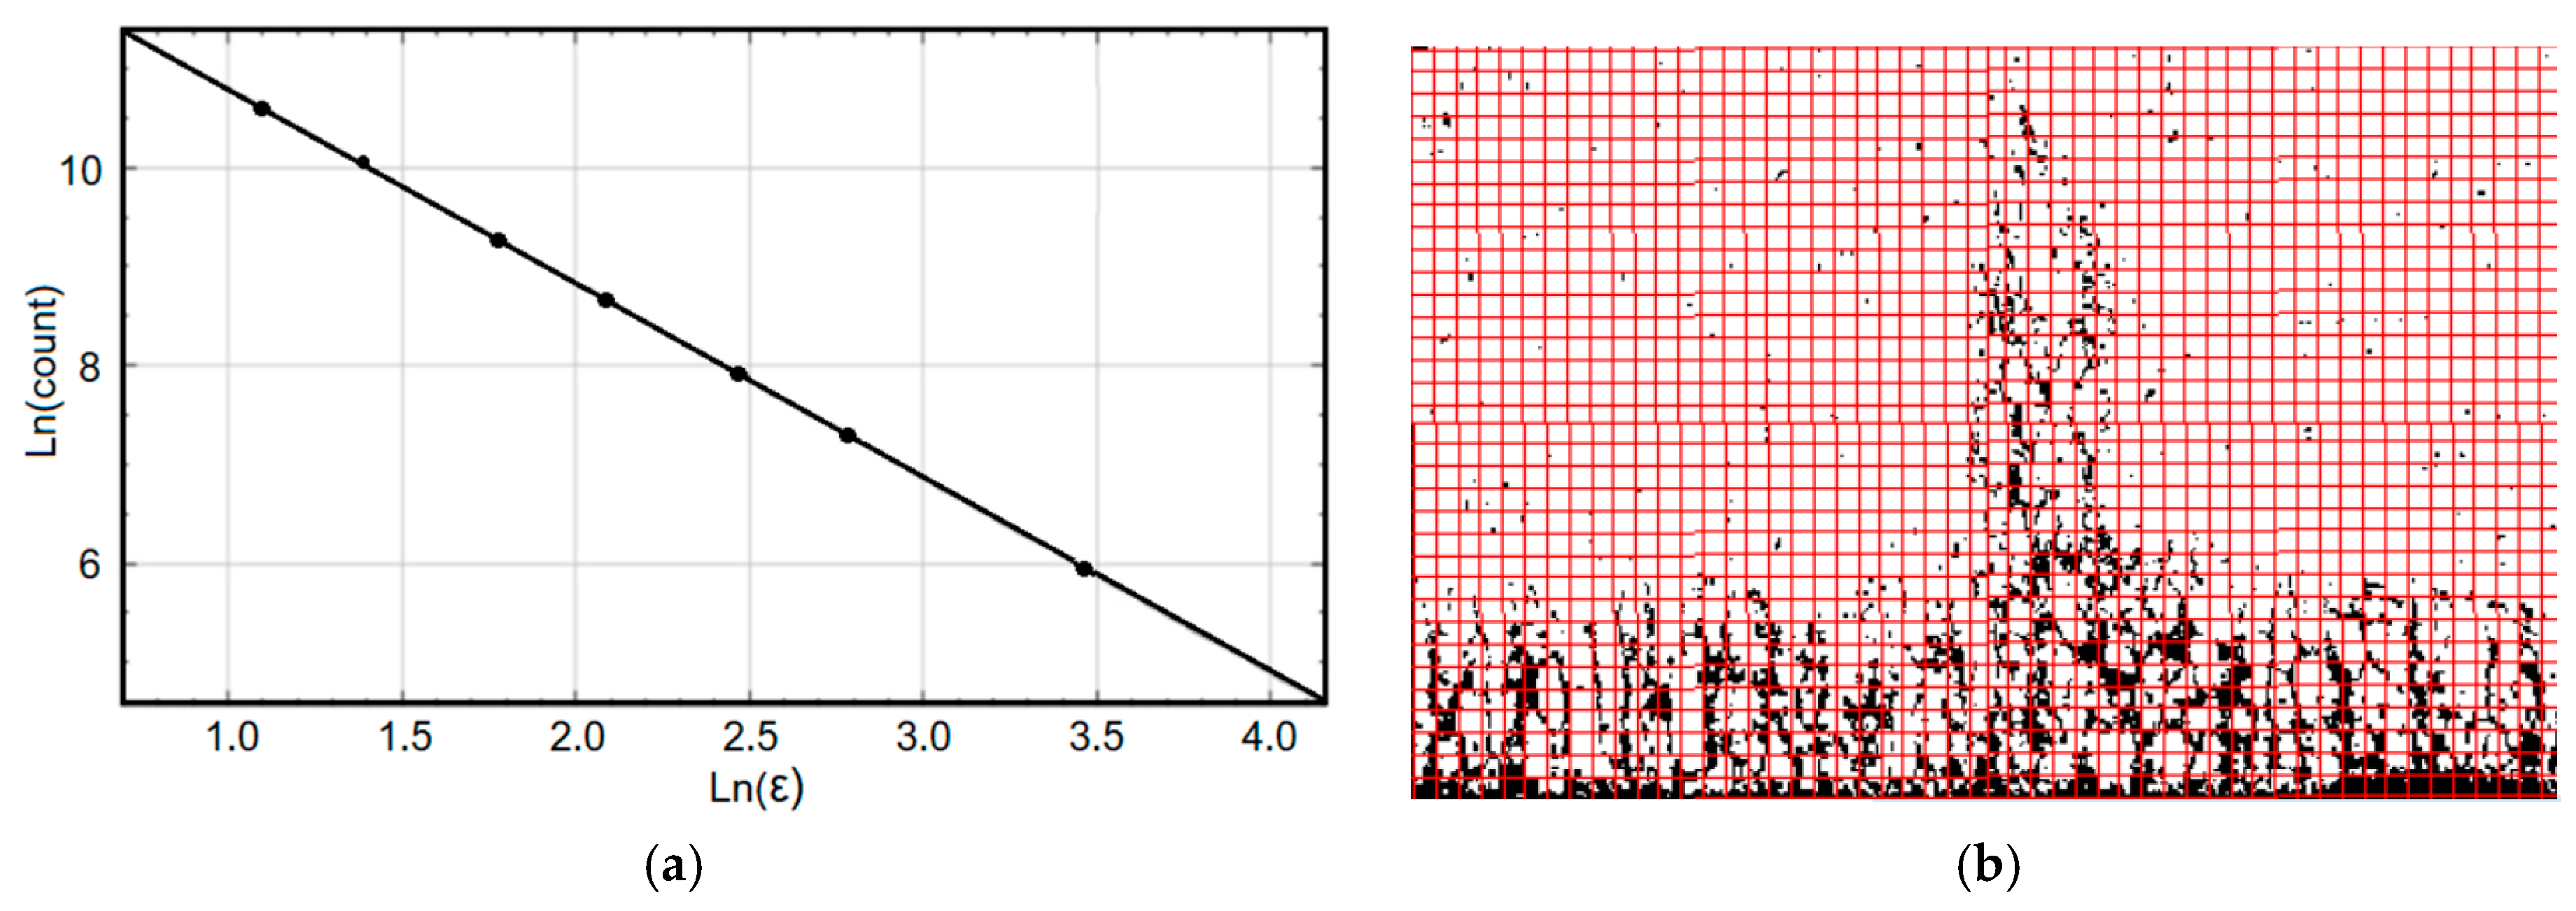
Figure 8a contains the plot of the logarithm of the number of occupied boxes used to cover the image (Ln(count)) vs. the logarithm of the box side length (Ln( ε )) and the regression line fitted to determine the box dimension of the corroded part of the sample from Figure 7b.
The dots in Figure 8a (the experimental values) are aligned along the regression line, indicating a very good fit of the least squares regression line whose slope is the box dimension. Figure 8b shows a cover of the binary image by a red grid, used during the computation procedure of the box dimension. The settings for running the algorithm were similar to those from the experiments related to the sample mass loss on the surface. With these settings, the box dimension varied in the interval [1.5257, 1.6689], with an average d b o x = 1.5692 , and a standard deviation of 0.0269. R2 was above 0.989 in all cases, indicating the estimation accuracy.
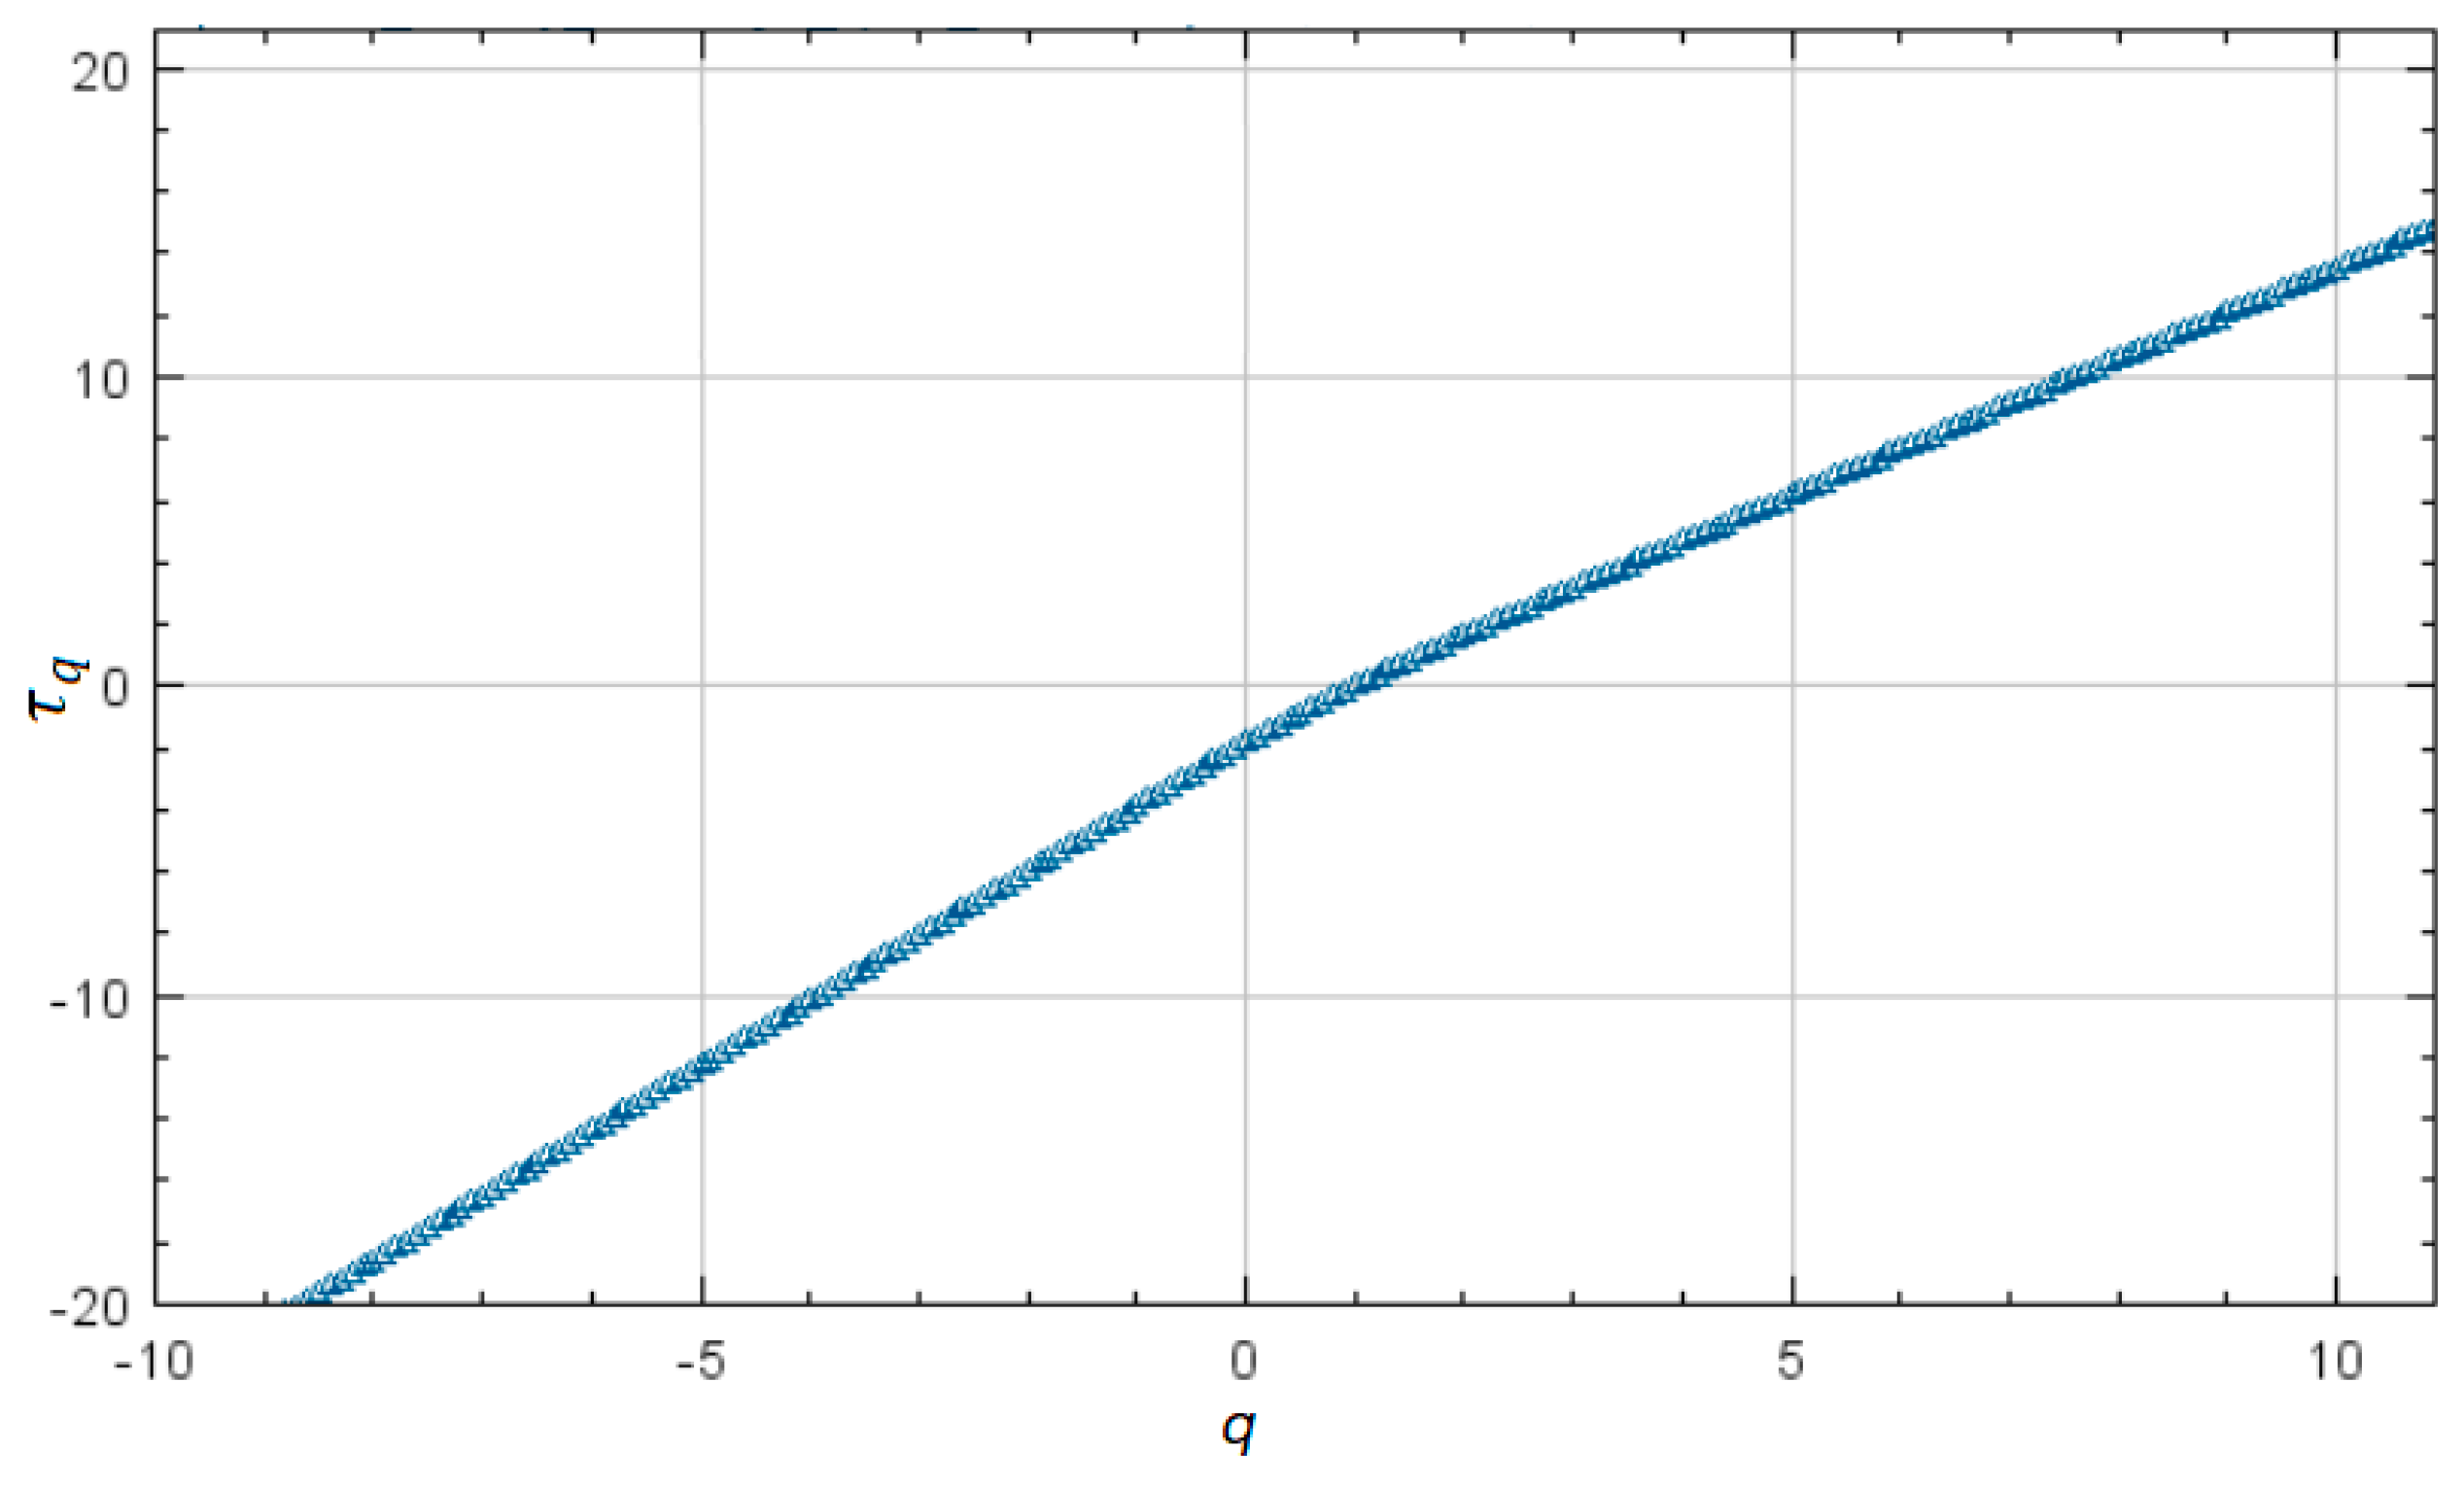
Figure 9 presents the chart of the τ q exponent against q, for q [ 10 , 10.9 ] .
The existence of at least two segments with different slopes is noticed in this chart. For q [ 10 , 0.6 ] , the slope of the least square regression line of τ q as a function of q is 2.1792 (with R2 = 1). For q [ 0.6 ,   2.0 ] , the slope of the regression line is 1.6714 (R2 = 0.9987), and for q [   2.1 ,   10.9 ] , it is 1.4064 (R2 = 0.9999). Such a chart emphasizes the multifractal character of the analyzed image. To confirm this finding, the dimension spectrum was determined in each experiment and as an average of all experiments.
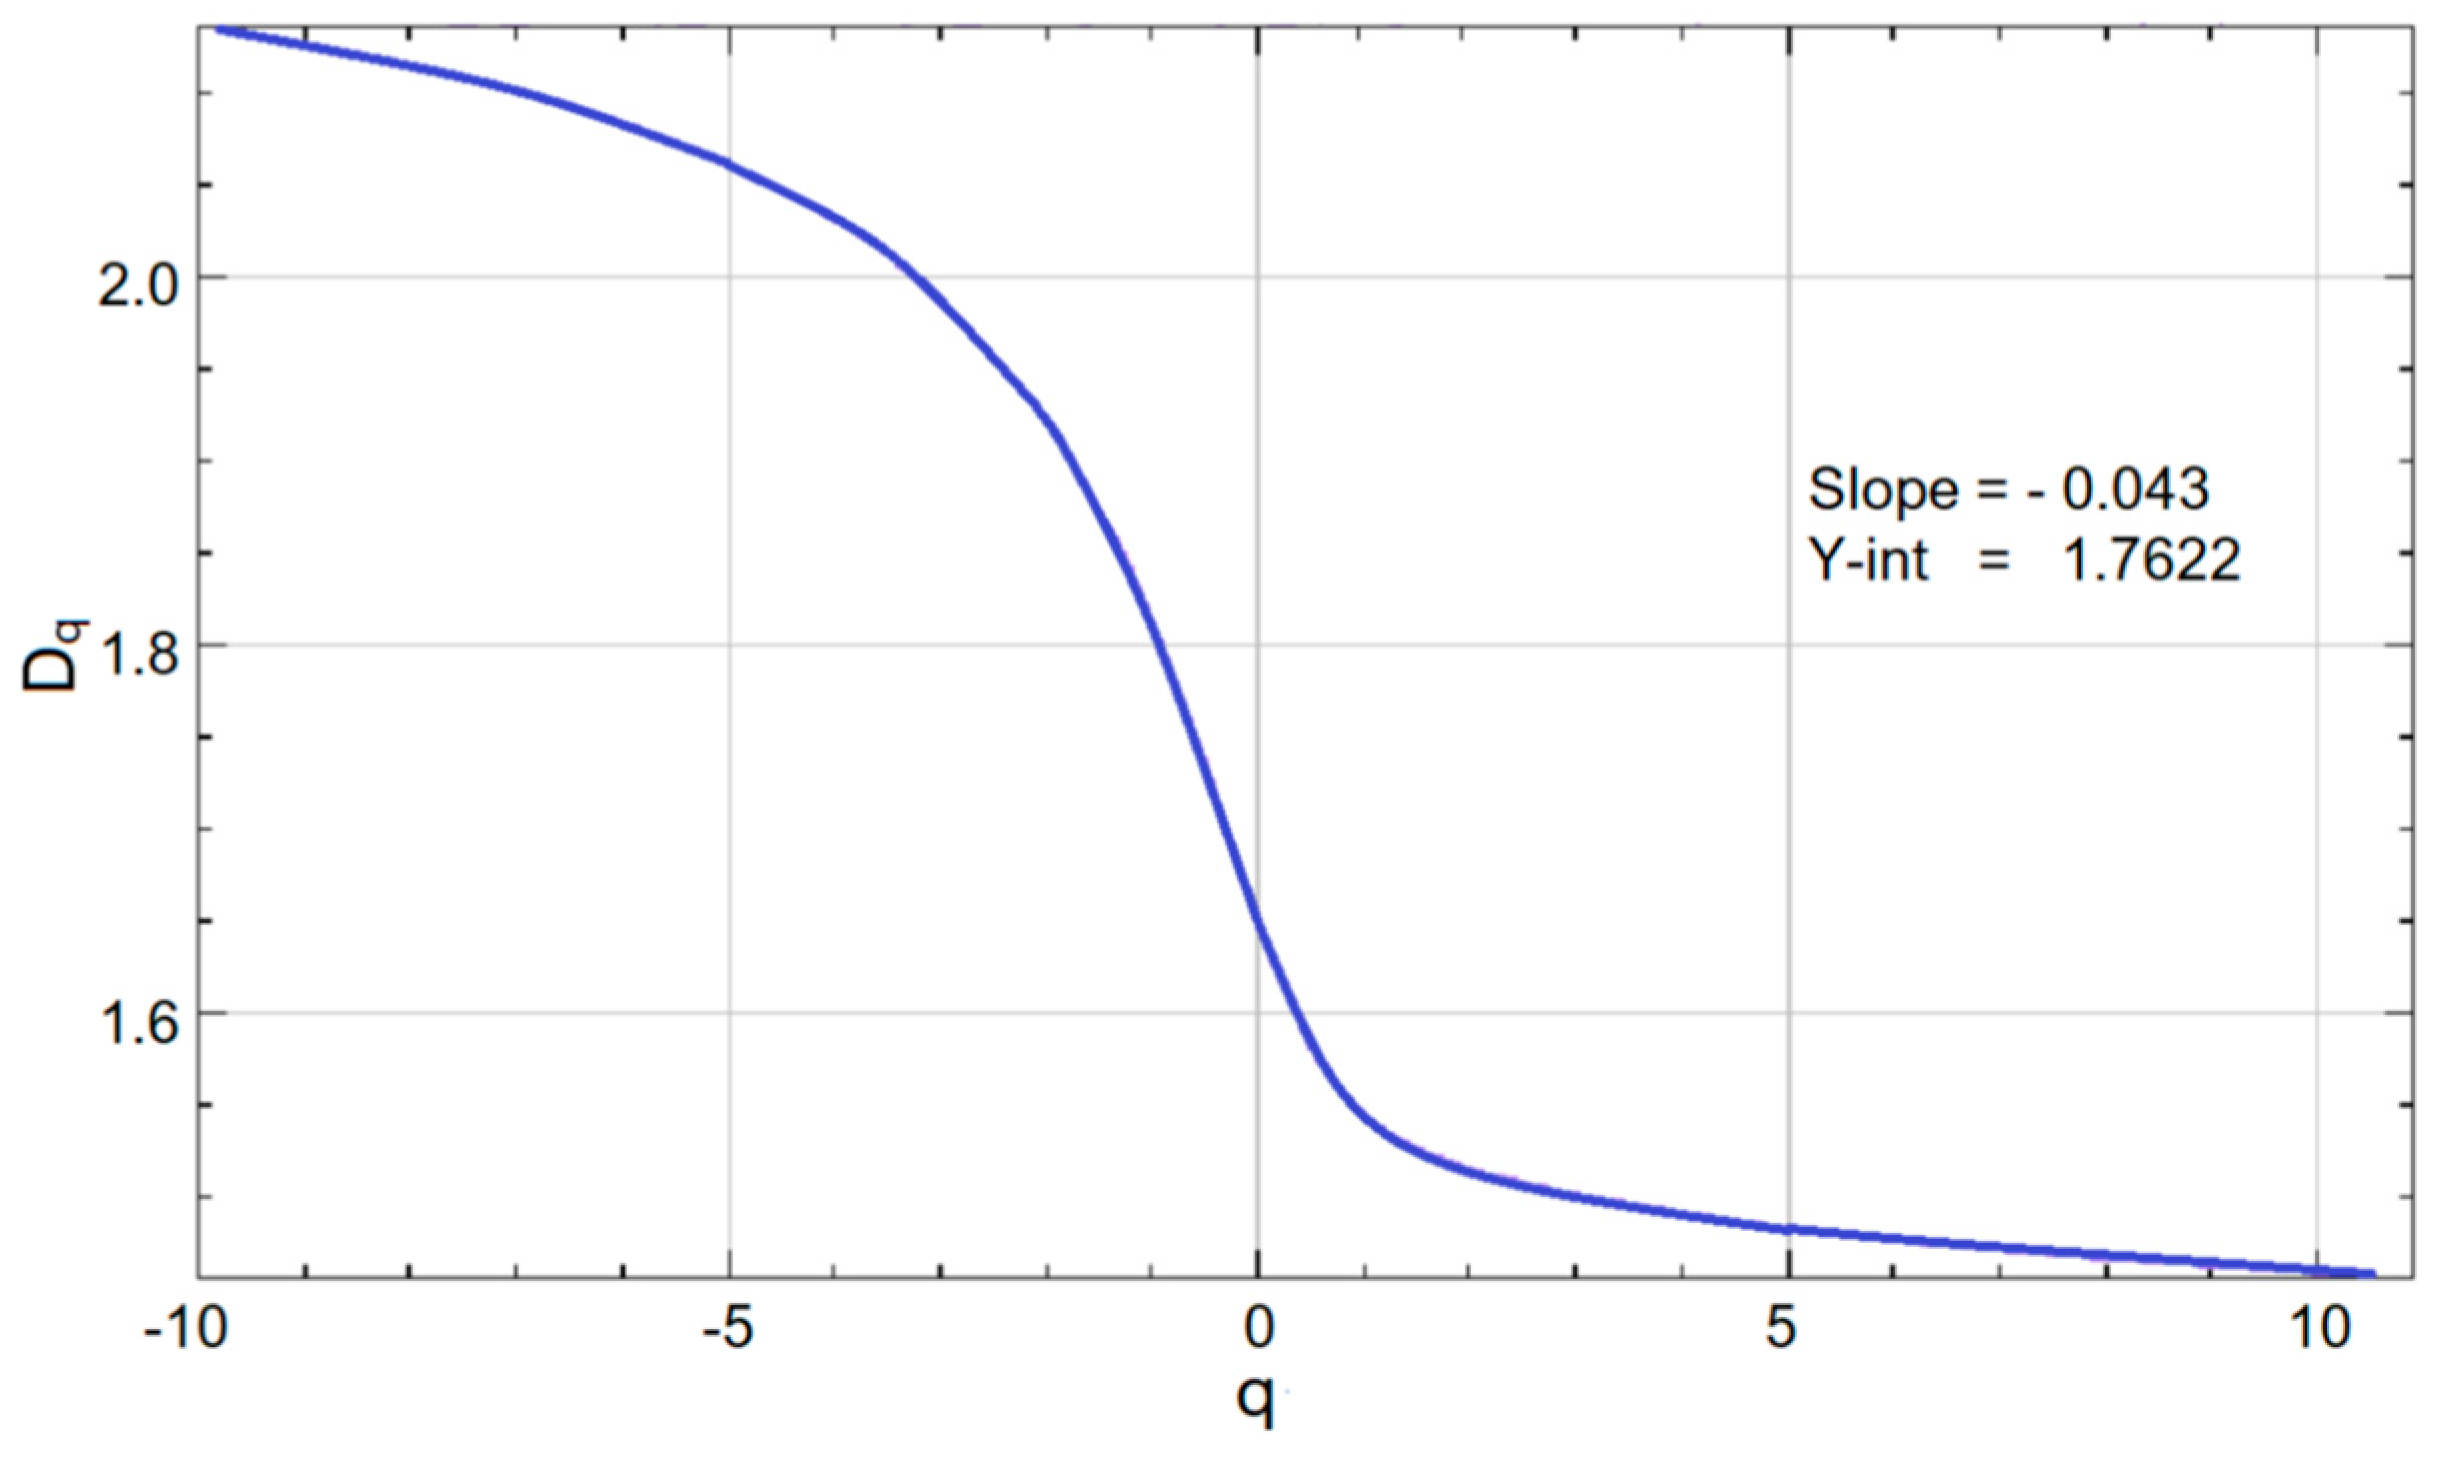
Figure 10 depicts the average D q   spectrum. The shape is inverse-sigmoidal, as expected in the multifractal case. Therefore, the capacity, information, and correlation dimensions were computed to characterize the multifractality degree. They correspond to particular values of q = 0, 1, and 2, respectively: d c a p = D 0 = 1.5969, d i n f = D 1 = 1.49836, and d c o r = D 2 = 1.4670.
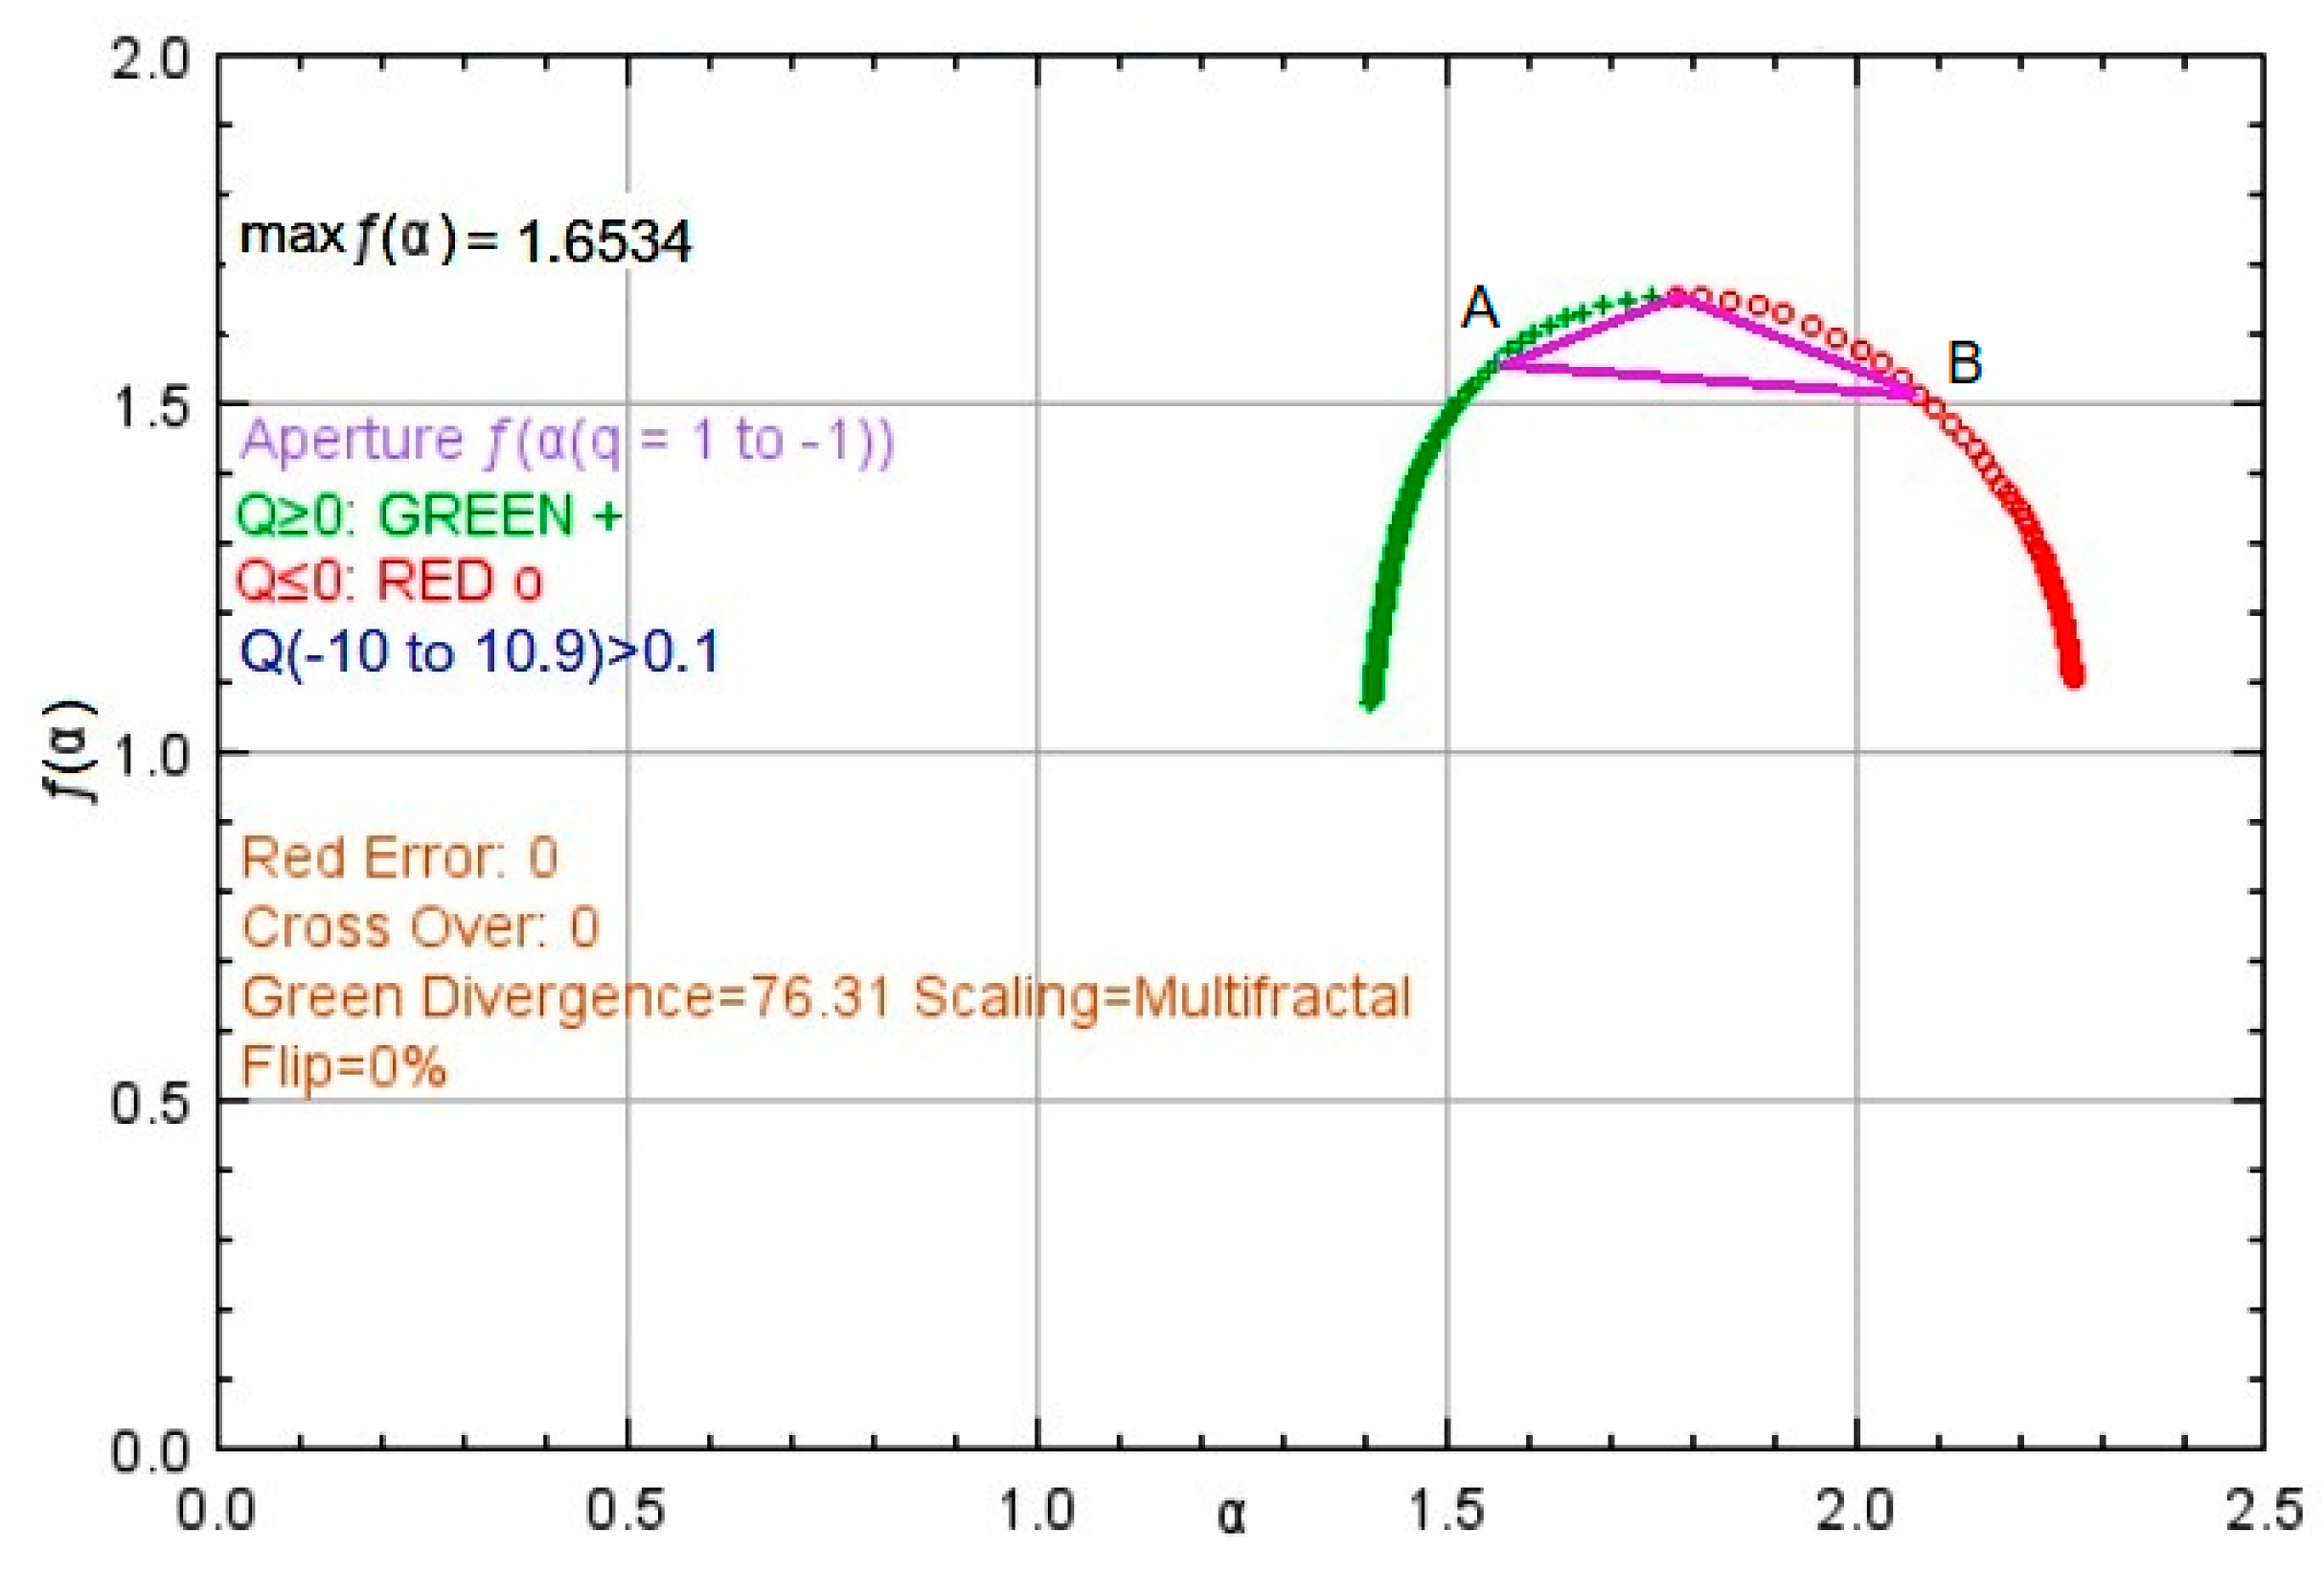
Figure 11 presents the f ( α )   –spectrum in one of the experiments for the corroded sample. The maximum value, max   f ( α ) = 1.6534, approximates the box dimension. The value in this experiment is in the range of the box dimension that was previously computed, [1.5257, 1.6689].
Another parameter used to characterize the multifractality in Fraclac software is the aperture, which is the slope of the segment joining the points A(q = 1, f(α(q = 1))) and B(q = −1, f(α(q = −1))). In these experiments, it varied between 0.2903 and 0.3567, with an average of 0.3213, corresponding to aperture lengths of 0.3692, 0.3943, and 0.3849, respectively.
Taking into account the values of the mass exponent, generalized dimensions, and f ( α ) –spectrum and the shapes of their charts, it results that the corrosion pattern is multifractal.
Dlouhy’ and Strnadel [38] showed that the rugosity of a corroded surface is determined by factors like the material structure and its mechanical characteristics. Additionally, microstructural heterogeneities are responsible for the material’s resistance to crack initiation or propagation [60,61]. Corrosion produces a texture corresponding to the rough structure of the surface. This surface is an indicator of corrosion intensity. Therefore, it is necessary to have an instrument for quantitatively estimating the surfaces of the objects after corrosion. The visual evaluation of the studied samples after the erosion–corrosion is important because the sample surface indicates the attack’s intensity and morphology [47].
The studies initiated by Mandelbrot [32] and continued by other scientists [60,61,62,63,64,65,66] confirmed the existence of a self-similarity pattern of the cracks propagation in different materials. Recent studies have indicated the same property of corroded materials [46,47,48].
Image characterization using fractal dimension based on micrographics is a very robust methodology, the texture of surface microstructural changes being independent of different variables like illumination. The advantage of the fractal approach to surface characterization is that it is insensitive to the structural details, and the structure is characterized by a single descriptor: the fractal dimension [38,67,68].
Different studies [32,62,63,64,65] have tried to determine the relationship between some steels’ fracture toughness and the fracture’s surface with no clear conclusions [38]. However, none analyzed the fractal behavior of the copper-based alloys in cavitation media. Therefore, the correlation between the surface’s roughness, its fractal dimension after the corrosion, the copper alloy composition, and the crack propagation remains to be studied.

4. Conclusions

This article presents the fractal/multifractal analysis of a brass sample after the corrosion–erosion produced by cavitation. It was proved that the series of the mass loss values on the sample’s surface has a box dimension near 1, in concordance with the equation of the deterministic linear model. Based on this result, a non-/monofractal behavior of the time series of the mass loss variation per sample’s surface was expected. The chart of the mass exponent τ q   v s .   q has a linear shape, whereas that of   D q   vs. q is horizontal. Both indicate that the series does not present the multifractality property.
The results point out that the distribution of the corrosion damage on the material’s surface is not uniform, being characterized by multifractality (highlighted by the multifractal spectrum). The computed box dimension of the SEM sample image was d b o x = 1.5692 , with a standard deviation of 0.0269. The S-shape of the generalized dimension and the existence of at least two regions with different shapes in the mass exponent chart of the same image show a clear multifractal behavior of the corroded sample. Moreover, the capacity, information, and correlation dimensions are, respectively, d c a p  = 1.5969, d i n f = 1.49836 and d c o r = 1.4670.
The advantage of this study is that it can be performed for any material and liquid media. Additionally, experiments related to the mechanical properties of materials at different erosion–corrosion stages should be performed to extract the correlation between the multifractal dimension of the corroded sample image and the sample’s mechanical behavior. This study is only a first step in assessing the multifractal behavior of copper alloys in cavitation. The following aspects will be investigated in the future: (1) the variation of the fractal/multifractal behavior as a function of the samples’ compositions, (2) the analysis of the fractal/multifractal behavior at different stages of the erosion –corrosion process before and after the first cracks apparition, and (3) the analysis of the fractal behavior of the cracks propagations in time. The study will be performed on different liquids and stationary or circulating media.

Author Contributions

Conceptualization, A.B.; methodology, A.B. and C.Ș.D.; software, A.B.; validation, A.B.; formal analysis, A.B. and C.Ș.D.; investigation, A.B. and C.Ș.D.; resources, A.B.; data curation, A.B. and C.Ș.D.; writing—original draft preparation, A.B.; writing—review and editing, C.Ș.D.; visualization, A.B.; supervision, A.B.; project administration, A.B.; funding acquisition, A.B. All authors have read and agreed to the published version of the manuscript.

Funding

This research received no external funding.

Institutional Review Board Statement

Not applicable.

Informed Consent Statement

Not applicable.

Data Availability Statement

Not applicable.

Conflicts of Interest

The authors declare no conflict of interest.

References

  1. Flynn, H.G. Physics of acoustic cavitation in liquids. In Physical Acoustics; Mason, W.P., Ed.; Academic Press: New York, NY, USA, 1964; Volume 1, Part B; pp. 57–172. [Google Scholar]
  2. Bai, L.; Yan, J.; Zeng, Z.; Ma, Y. Cavitation in thin liquid layer: A review. Ultrason. Sonochem. 2020, 66, 105092. [Google Scholar] [CrossRef] [PubMed]
  3. Young, F.E. Cavitation; Mac Graw-Hill: Maidenhead, UK, 1989. [Google Scholar]
  4. Rooney, J.A. Ultrasound: Its Chemical, Physical and Biological Effects, Suslick; VCH: New York, NY, USA, 1988. [Google Scholar]
  5. Bărbulescu, A.; Dumitriu, C.Ș. Modeling the Voltage Produced by Ultrasound in Seawater by Stochastic and Artificial Intelligence Methods. Sensors 2022, 22, 1089. [Google Scholar] [CrossRef] [PubMed]
  6. Dumitriu, C.S.; Dragomir, F.-L. Modeling the Signals Collected in Cavitation Field by Stochastic and Artificial Intelligence Methods. In Proceedings of the 2021 13th International Conference on Electronics, Computers and Artificial Intelligence (ECAI), Pitești, Romania, 1–3 July 2021; pp. 1–4. [Google Scholar] [CrossRef]
  7. Schüssler, A.; Exner, H.E. The corrosion of nickel-aluminium bronzes in seawater—I. Protective layer formation and the passivation mechanism. Corros. Sci. 1993, 3, 1793–1802. [Google Scholar] [CrossRef]
  8. Wharton, J.A.; Barik, R.C.; Kear, G.; Wood, R.J.K.; Stokes, K.R.; Walsh, F.C. The corrosion of nickel-aluminium bronze in seawater. Corros. Sci. 2005, 47, 3336–3367. [Google Scholar] [CrossRef]
  9. Wharton, J.A.; Stokes, K.R. The influence of nickel–aluminium bronze microstructure and crevice solution on the initiation of crevice corrosion. Electrochim. Acta 2008, 53, 2463–2473. [Google Scholar] [CrossRef]
  10. Basumatary, J.; Nie, M.; Wood, J.K. The synergistic effects of cavitation erosion-corrosion in ship propeller materials. J. Bio- Tribo-Corros. 2015, 1, 1–12. [Google Scholar] [CrossRef] [Green Version]
  11. Basumatary, J.; Wood, R.J.K. Synergistic effects of cavitation erosion and corrosion for nickel aluminium bronze with oxide film in 3.5% NaCl solution. Wear 2017, 376–377, 1286–1297. [Google Scholar] [CrossRef] [Green Version]
  12. Hamidah, I.; Solehudin, A.; Hamdani, A.; Hasanah, L.; Khairurrijal, K.; Kurniawan, T.; Mamat, R.; Maryanti, R.; Nandiyanto, A.B.D.; Belkheir, H. Corrosion of copper alloys in KOH, NaOH, NaCl, and HCl electrolyte solutions and its impact to the mechanical properties. Alex. Eng. J. 2021, 60, 2235–2243. [Google Scholar] [CrossRef]
  13. Alfantazi, A.M.; Ahmed, T.M.; Tromans, D. Corrosion behavior of copper alloys in chloride media. Mater. Des. 2009, 30, 2425–2430. [Google Scholar] [CrossRef]
  14. Bakhshandeh, H.R.; Allahkaram, S.R.; Zabihi, A.H. An investigation on cavitation-corrosion behavior of Ni/β-SiC nanocomposite coatings under ultrasonic field. Ultrason. Sonochem. 2019, 56, 229–239. [Google Scholar] [CrossRef]
  15. Dumitriu, C.S.; Bărbulescu, A. Studies on the Copper Based Alloys Used in Naval Constructions-Modeling the Mass Loss in Different Media; Sitech: Craiova, Romania, 2007. (In Romanian) [Google Scholar]
  16. Peng, S.; Xu, J.; Li, Z.; Jiang, S.; Xie, Z.-H.; Munroe, P. Electrochemical noise analysis of cavitation erosion corrosion resistance of NbC nanocrystalline coating in a 3.5 wt% NaCl solution. Surf. Coat. Tech. 2021, 415, 127133. [Google Scholar] [CrossRef]
  17. Ivanov, I.V. Corrosion Resistant Materials in Food Industry; Editura Agro-Silvica: Bucharest, Romania, 1959. (In Romanian) [Google Scholar]
  18. Dumitriu, C.S. On the corrosion of two types of bronzes under cavitation. Ann. Dunarea Jos Univ. Galati Fascicle IX Metall. Mater. Sci. 2021, 4, 12–16. [Google Scholar] [CrossRef]
  19. Dumitriu, C.S.; Bărbulescu, A. Copper corrosion in ultrasound cavitation field. Ann. Dunarea Jos Univ. Galati Fascicle IX Metall. Mater. Sci. 2021, 3, 31–35. [Google Scholar] [CrossRef]
  20. Fortes-Patella, R.; Choffat, T.; Reboud, J.L.; Archer, A. Mass loss simulation in cavitation erosion: Fatigue criterion approach. Wear 2013, 300, 205–215. [Google Scholar] [CrossRef]
  21. Mandelbrot, B.B. Fractals, Form, Chance and Dimension; W. H. Freeman & Co. Ltd.: San Francisco, CA, USA, 1977. [Google Scholar]
  22. Bărbulescu, A.; Șerban, C. Statistical and multifractal analysis of rainfall of Romania. Int. J. Ecol. Econ. Stat. 2012, 25, 1–11. [Google Scholar]
  23. Burlando, P.; Menduni, G.; Rosso, R. (Eds.) Fractals, scaling and nonlinear variability in hydrology. J. Hydrol. 1996, 187, 1–264. [Google Scholar]
  24. Chen, G.; Cheng, Q. Fractal density modeling of crustal heterogeneity from the KTB deep hole. J. Geophys. Res. Solid Earth 2017, 122, 1919–1933. [Google Scholar] [CrossRef]
  25. Bărbulescu, A.; Dumitriu, C.S. Assessing the Fractal Characteristics of Signals in Ultrasound Cavitation. In Proceedings of the 25th International Conference on System Theory, Control and Computing, Iasi, Romania, 20–23 October 2021; ICSTCC 2021. [Google Scholar] [CrossRef]
  26. Sun, W.; Xu, G.; Gong, P.; Liang, S. Fractal analysis of remotely sensed images: A review of methods and applications. Int. J. Remote Sens. 2006, 27, 4963–4990. [Google Scholar] [CrossRef]
  27. Nichita, M.-V.; Paun, M.-A.; Paun, V.-A.; Paun, V.-P. Pulmonary X-ray Images. A Fractal Analysis. AIP Conf. Proc. 2020, 2218, 050003. [Google Scholar] [CrossRef]
  28. Tanabe, N.; Sato, S.; Suki, B.; Hirai, T. Fractal Analysis of Lung Structure in Chronic Obstructive Pulmonary Disease. Front. Physiol. 2020, 11, 603197. [Google Scholar] [CrossRef]
  29. Updike, S.X.; Nowzari, H. Fractal analysis of dental radiographs to detect periodontitis-induced trabecular changes. J. Periodont. Res. 2008, 43, 658–664. [Google Scholar] [CrossRef]
  30. Kato, C.N.A.O.; Barra, S.G.; Tavares, N.P.K.; Amaral, T.M.P.; Brasileiro, C.B.; Mesquita, R.A.; Abreu, L.G. Use of fractal analysis in dental images: A systematic review. Dentomaxillofac. Radiol. 2020, 49, 20180457. [Google Scholar] [CrossRef]
  31. Parkinson, I.H.; Fazzalari, N.L. Methodological principles for fractal analysis of trabecular bone. J. Microsc. 2000, 198, 138–142. [Google Scholar] [CrossRef] [Green Version]
  32. Mandelbrot, B.B.; Passoja, D.E.; Paullay, A.J. Fractal character of fracture surfaces of metals. Nature 1984, 308, 721–722. [Google Scholar] [CrossRef]
  33. Shi, D.W.; Jiang, J.; Lung, C.W. Correlation between the scale-dependent fractal dimension of fracture surfaces and the fracture toughness. Phys. Rev. B Condens. Matter. 1996, 54, R17355–R17358. [Google Scholar] [CrossRef]
  34. Zhang, H.; Wei, D.-M. Estimation of fracture toughness, driving force, and fracture energy for fractal cracks using the method of imaginary smooth crack. Eng. Fract. Mech. 2010, 77, 621–630. [Google Scholar] [CrossRef] [Green Version]
  35. Borodich, F.M. Fractals and fractal scaling in fracture mechanics. Int. J. Fract. 1999, 95, 239–259. [Google Scholar] [CrossRef]
  36. Ji, H.; Jiang, H.; Zhao, R.; Tian, Y.; Jin, X.; Jin, N.; Tong, J. Fractal Characteristics of Corrosion-Induced Cracks in Reinforced Concrete. Materials 2020, 13, 3715. [Google Scholar] [CrossRef]
  37. Zavdoveev, A.; Beygelzimer, Y.; Varyukhin, V.; Efros, B. Influence of Deformation on Fractal Dimension of Deformed Metals Structure. Available online: https://www.researchgate.net/publication/224871709_Influence_Of_Deformation_On_Fractal_Dimension_Of_Deformed_MetalsStructure (accessed on 19 August 2022).
  38. Dlouhý, I.; Strnadel, B. The effect of crack propagation mechanism on the fractal dimension of fracture surfaces in steel. Eng. Fracture Mech. 2008, 75, 726–738. [Google Scholar] [CrossRef]
  39. Li, W.; Wu, M.; Shi, T.; Yang, P.; Pan, Z.; Liu, W.; Liu, J.; Yang, X. Experimental Investigation of the Relationship between Surface Crack of Concrete Cover and Corrosion Degree of Steel Bar Using Fractal Theory. Fractal Fract. 2022, 6, 325. [Google Scholar] [CrossRef]
  40. Xu, Y.; Qian, C.; Pan, L.; Wang, B.; Lou, C. Comparing Monofractal and Multifractal Analysis of Corrosion Damage Evolution in Reinforcing Bars. PLoS ONE 2012, 7, e29956. [Google Scholar] [CrossRef] [Green Version]
  41. Davies, S.; Hall, P.J.R. Fractal analysis of surface roughness by using spatial data. Statist. Soc. B 1999, 61, 3–37. [Google Scholar] [CrossRef]
  42. Karolczak, P.; Kowalski, M.; Raszka, K. The application of fractal analysis to the description of brushed steel surfaces. J. Mach. Eng. 2020, 20, 99–115. [Google Scholar] [CrossRef]
  43. Kim, J.J.; Hwang, W.S. Evaluation of a fractal analysis technique for corrosion studies. Met. Mater. Int. 2012, 18, 783–789. [Google Scholar] [CrossRef]
  44. Songbo, R.; Song, G.; Chao, K.; Shenghui, Z.; Ying, G.; Gang, L.; Tao, Y.; Liqiong, Y. Fractal characteristic of corroded steel surface and application to the fracture analyses. Constr. Build. Mater. 2022, 340, 127759. [Google Scholar] [CrossRef]
  45. Zhang, H.; Xu, S.; Zhang, Z.; Nie, B.; Wang, L. Fracture analysis of corroded cold-formed thin steel plates based on actual morphology using micromechanical models. Constr. Build. Mater. 2021, 267, 120899. [Google Scholar] [CrossRef]
  46. Sarmiento, E.; Gonzalez-Rodriquez, J.G.; Urichurtu, J. Fractal Analysis of the Corrosion Inhibition of Carbon Steel in a Bromide Solution by Molybdates. ECS Trans. 2008, 15, 221. [Google Scholar] [CrossRef]
  47. García-Ochoa, E.; Corvo, F. Copper patina corrosion evaluation by means of fractal geometry using electrochemical noise (EN) and image analysis. Electrochem. Commun. 2010, 12, 826–830. [Google Scholar] [CrossRef]
  48. López, J.L.; Veleva, L. 2D-DFA as a tool for non-destructive characterisation of copper surface exposed to substitute ocean water. Phys. A Stat. Mech. Appl. 2022, 586, 126490. [Google Scholar] [CrossRef]
  49. Dumitriu, C.S.; Bărbulescu, A. Artificial intelligence models for the mass loss of copper-based alloys under the cavitation. Materials 2022, 15, 6695. [Google Scholar] [CrossRef]
  50. Jin, F.; Chiang, F.P. Nondestructive Evaluation of Corrosion by Fractal Geometry. Res. Nondestruct. Eval. 1996, 7, 229–238. [Google Scholar] [CrossRef]
  51. Vuidel, G.; Tannier, C. Fractalyse 3.0. User Manual. Available online: https://sourcesup.renater.fr/www/fractalyse/download/manual-en.pdf (accessed on 23 August 2022).
  52. Weisstein, E.W. Capacity Dimension. Available online: https://mathworld.wolfram.com/CapacityDimension.html (accessed on 23 August 2022).
  53. Baker, G.L.; Gollub, J.B. Chaotic Dynamics: An Introduction, 2nd ed.; Cambridge University Press: Cambridge, UK, 1996. [Google Scholar]
  54. Falconer, K. Fractal Geometry: Mathematical Foundations and Applications, 3rd ed.; John Wiley & Sons, Ltd.: Chichester, UK, 2014. [Google Scholar]
  55. Halsey, T.; Jensen, M.; Kadanoff, L.; Procaccia, I.; Shraiman, B.I. Fractal measures and their singularities: The characterization of strange sets. Phys. Rev. A 1986, 33, 1141–1151. [Google Scholar] [CrossRef] [PubMed]
  56. Ferraris, L.; Gabellani, S.; Parodi, U.; Rebora, N. Revisiting Multifractality in Rainfall Fields. J. Hydrometeorol. 2003, 4, 544–551. [Google Scholar] [CrossRef]
  57. Stanley, H.E.; Meakin, P. Multifractal phenomena in physics and chemistry. Nature 1998, 335, 405–409. [Google Scholar] [CrossRef]
  58. Hentschel, H.G.E.; Procaccia, I. The infinite number of generalized dimensions of fractals and strange attractors. Phys. D Nonlinear Phenom. 1983, 8, 435–444. [Google Scholar] [CrossRef]
  59. Fraclac for ImageJ. Available online: https://imagej.nih.gov/ij/plugins/fraclac/FLHelp/Introduction.htm (accessed on 23 November 2022).
  60. Bouchaud, E. Scaling properties of cracks. J. Phys. Condens. Mater. 1997, 9, 4319–4344. [Google Scholar] [CrossRef]
  61. Bouchaud, E.; Bouchaud, J.P.; Fisher, D.S.; Ramanathan, S.; Rice, J.R. Can crack front waves explain the roughness of cracks? J. Mech. Phys. Solids 2002, 50, 1703–1725. [Google Scholar] [CrossRef] [Green Version]
  62. Dauskart, R.H.; Haubensak, F.; Ritchie, R.O. On the interpretation of the fractal character of fracture surfaces. Acta Metall. 1990, 38, 143–159. [Google Scholar] [CrossRef]
  63. Gokhale, A.M.; Underwood, E.E. A general method for estimation of fracture surface roughness: Part I. Theoretical aspects. Metall. Trans. A 1990, 21, 1193–1199. [Google Scholar] [CrossRef]
  64. Huang, Z.H.; Tian, J.F.; Wang, Z.G. A study of the slit island analysis as a method for measuring fractal dimension of fractured surface. Scripta Metall. Mater. 1990, 24, 967–972. [Google Scholar] [CrossRef]
  65. Imre, A.; Paykossy, T.; Nyikos, L. Electrochemical determination of the fractal dimension of fractured surfaces. Acta Metall. Mater. 1992, 40, 1819. [Google Scholar] [CrossRef]
  66. Jiang, X.G.; Chu, W.Y.; Hisao, C.M. Relationship between JIC and fractal value of fracture surface of ductile materials. Acta Metall. Mater. 1994, 42, 105–108. [Google Scholar] [CrossRef]
  67. Quevedo, R.; Lopez-G, C.; Aguilera, J.M.; Cadoche, L. Description of Food Surfaces and Microstructural Changes Using Fractal Image Texture Analysis. J. Food Eng. 2002, 53, 361–371. [Google Scholar] [CrossRef]
  68. Risovic, D.; Mahovic, S.; Poljacek, K.; Furic, M.; Gojo, M. Inferring fractal dimension of rough/porous surfaces—A comparison of SEM image analysis and electrochemical impedance spectroscopy methods. Appl. Surf. Sci. 2008, 255, 3063–3070. [Google Scholar] [CrossRef]
Figure 1. Setup for the cavitation study [5].
Sustainability 15 03816 g001
Figure 2. The absolute mass loss of the sample per surface.
Sustainability 15 03816 g002
Figure 3. (a) The average number of boxes (Avg Count) vs. the box size (ε). (b) Regression line showing the box dimension of the curve from Figure 2. (c) Plot of the average number of boxes for the cover with the highest R2. (d) Regression line showing the box dimension estimation using the cover with the lowest box dimension. The charts are processed from the output of FracLac.
Sustainability 15 03816 g003
Figure 4. The chart of the mass exponent, τ q .
Sustainability 15 03816 g004
Figure 5. The dimension spectrum Dq.
Sustainability 15 03816 g005
Figure 6. The f ( α ) spectrum in two experiments with (a) a flip of 0% and (b) a flip of 9.09%. (c) The f ( α ) spectrum computed by averaging the results of all the experiments.
Sustainability 15 03816 g006
Figure 7. (a) Image of the sample’s surface before the corrosion–erosion. (b) Image of the sample’s surface after the corrosion–erosion in the seawater of the β’ phase in the surface layer of the sample, with a magnification of 180.
Sustainability 15 03816 g007
Figure 8. The computation of the box dimension of the image from Figure 7b: (a) The least squares regression line drawn to determine the box dimension. (b) Grid covering the image of the corroded sample, used in the box dimension computation.
Sustainability 15 03816 g008
Figure 9. The chart of the mass exponent ,   τ q   .
Sustainability 15 03816 g009
Figure 10. The generalized dimension, Dq, of the image from Figure 7b.
Sustainability 15 03816 g010
Figure 11. The f ( α ) –spectrum of the image from Figure 7b.
Sustainability 15 03816 g011
Disclaimer/Publisher’s Note: The statements, opinions and data contained in all publications are solely those of the individual author(s) and contributor(s) and not of MDPI and/or the editor(s). MDPI and/or the editor(s) disclaim responsibility for any injury to people or property resulting from any ideas, methods, instructions or products referred to in the content.