
The Scale of Attitudes toward the Information Technologies and Software Course: A Scale Development Study †
 , , , , and
Abstract
:1. Introduction
1.1. Review of the Literature
1.2. Purpose of the Study
2. Materials and Methods
2.1. Study Group
2.2. Development of the Data Collection Tool
- Determination of the purpose of the measurement tool;
- Determination of the attitude to be measured, construction of the item pool, and item writing;
- Checking mechanics and comprehensibility;
- Seeking expert opinion and preparation of the draft form;
- Conducting the pilot study;
- Analysis of the data obtained from the pilot study (validity and reliability).
2.2.1. Determination of the Purpose of the Measurement Tool
2.2.2. Determination of the Attitude to Be Measured, Construction of the Item Pool, and Item Writing
- I think that I do not need to learn computers to succeed in classes.
- I get bored in the Information Technologies and Software classes.
- Learning to use a computer takes a lot of time.
- Solving problems encountered while using a computer does not appeal to me.
2.2.3. Checking Mechanics and Comprehensibility
2.2.4. Seeking for Expert Opinion (Content Validity) and Preparation of the Draft Form for the Pilot Study
2.2.5. Conducting the Pilot Study
2.2.6. Analysis of the Data Obtained at the End of the Pilot Study
- I.
- Item Analysis (Criterion Validity)
- II.
- Factor Analysis (Construct Validity)
- III.
- Reliability
3. Results
3.1. Item Analysis
3.2. Explanatory Factor Analysis
3.3. Reliability
4. Discussion and Conclusions
4.1. Discussion
4.2. Conclusions
5. Delimitations
Author Contributions
Funding
Institutional Review Board Statement
Informed Consent Statement
Data Availability Statement
Conflicts of Interest
References
- Ural, Ş. Bilim Tarihi; Çantay: İstanbul, Turkey, 2011.
- Pesen, A.; Epçaçan, C. The Analysis of High School Students’ Tendencies about Lifelong Learning. Univers. J. Educ. Res. 2017, 5, 26–31. [Google Scholar] [CrossRef]
- Uşun, S. Bilgisayar Destekli Öğretimin Temelleri; Nobe: Ankara, Turkey, 2013. [Google Scholar]
- Kalkınma Bakanlığı, T.C.; Dairesi, B.T. 2015–2018 Bilgi Toplumu Stratejisi ve Eylem Planı (Yayın No. 2939). 2015. Available online: http://www.bilgitoplumu.gov.tr/2015/2015-2018-bilgi-toplumu-stratejisi-ve-eylem-plani-yayimlandi-2/ (accessed on 22 July 2022).
- Hepp, P.; Hinostroza, J.E.; Laval, E.; Rehbein, L. Technology in Schools: Education, ICT and the Knowledge Society; World Bank, Distance & Open Learning and ICT in Education Thematic Group, Human Development Network, Education: Washington, DC, USA, 2004; pp. 30–47. [Google Scholar]
- Luhmann, N. Social Systems; Stanford University Press: Redwood City, CA, USA, 1995; Available online: https://books.google.com.tr/books?hl=tr&lr=&id=zVZQW4gxXk4C&oi=fnd&pg=PR9&dq=luhmann+1995&ots=7GFRla3NST&sig=GEBIWS5BQvw7QNFDeWQCpmpf6yE&redir_esc=y#v=onepage&q=luhmann%201995&f=false (accessed on 10 July 2022).
- Kozma, R.B. National policies that connect ICT-based education reform to economic and social development. Hum. Technol. Interdiscip. J. Hum. ICT Environ. 2005, 1, 117–156. [Google Scholar] [CrossRef]
- Kozma, R.B. Comparative analysis of policies for ICT in education. In International Handbook of Information Technology in Primary and Secondary Education; Springer: Boston, MA, USA, 2008; pp. 1083–1096. [Google Scholar]
- Stager, G. Seymour Papert (1928–2016). Nature 2016, 537, 308. [Google Scholar] [CrossRef] [Green Version]
- Twining, P. ICT in Schools: Estimating the Level of Investment, meD8. 2002. Available online: https://www.researchgate.net/publication/251511811_ICT_in_Schools_Estimating_the_level_of_investment (accessed on 22 July 2022).
- MEB. MEB 2010–2014 Stratejik Planı. 2010. Available online: https://sgb.meb.gov.tr/meb_iys_dosyalar/2013_05/08030019_2010_14_sp_genelbilgi.pdf (accessed on 13 June 2022).
- MEB. Bilişim Teknolojileri ve Yazılım Dersi Öğretim Programı (Ortaokul 5 ve 6. Sınıflar). 2018. Available online: http://mufredat.meb.gov.tr/Dosyalar/2018124103559587-Bili%C5%9Fim%20Teknolojileri%20ve%20Yaz%C4%B1l%C4%B1m%205-6.%20S%C4%B1n%C4%B1flar.pdf (accessed on 13 June 2022).
- Işık, A.D.; Rıza, E.T. Bilişim teknolojileri dersine yönelik tutum ölçeğinin geçerlik ve güvenirlik çalışması. Educ. Sci. 2011, 6, 46–53. [Google Scholar]
- Tezbaşaran, A.A. Likert tipi ölçek hazırlama kılavuzu (3. Sürüm). E-Kitap 2008, 12, 2013. [Google Scholar]
- Pickens, J. Attitudes and perceptions. Organ. Behav. Health Care 2005, 4, 43–76. [Google Scholar]
- Smith, B.; Caputi, P.; Rawstorne, P. Differentiating computer experience and attitudes toward computers: An empirical investigation. Comput. Hum. Behav. 2000, 16, 59–81. [Google Scholar] [CrossRef]
- Tavşancıl, E. Tutumların Ölçülmesi ve SPSS ile Veri Analizi; Nobel: Ankara, Turkey, 2018. [Google Scholar]
- Anderson, L.W.; Çıkrıkçı, N. Tutumların ölçülmesi. Ank. Univ. J. Fac. Educ. Sci. (JFES) 1991, 24, 241–250. [Google Scholar] [CrossRef]
- Çelik, B.; Gündoğdu, K. Animasyon destekli bilişim değerleri eğitiminin akademik başarıya ve tutuma etkisi. Anadolu J. Educ. Sci. Int. 2000, 10, 1066–1091. [Google Scholar]
- Özgenel, M.; Baydar, F.; Çalışkan, Y.F. Ortaokul öğrencilerinin bilişim teknolojileri ve yazılım dersine yönelik tutumları ile akademik başarıları arasındaki ilişkinin incelenmesi. Electron. Turk. Stud. 2018, 13, 111–128. [Google Scholar] [CrossRef]
- Sturm, N.; Bohndick, C. The Influence of Attitudes and Beliefs on the Problem-Solving Performance. In Frontiers in Education; Frontiers Media SA: Lausanne, Switzerland, 2021; p. 6. [Google Scholar] [CrossRef]
- Aydoğan, D. İlköğretim 8. Sınıf öğrencilerinin bilişim teknolojilerine yönelik tutumları ile bilişim teknolojileri okuryazarlıkları arasındaki ilişki. Kafkas Üniversitesi Sos. Bilim. Enstitüsü Derg. 2013, 1, 61–76. [Google Scholar]
- Abdullah, Z.D.; Ziden, A.B.A.; Aman, R.B.C.; Mustafa, K.I. Students’ attitudes towards information technology and the relationship with their academic achievement. Contemp. Educ. Technol. 2015, 6, 338–354. [Google Scholar] [CrossRef] [Green Version]
- Palaigeorgiou, G.E.; Siozos, P.D.; Konstantakis, N.I.; Tsoukalas, I.A. A computer attitude scale for computer science freshmen and its educational implications. J. Comput. Assist. Learn. 2005, 21, 330–342. [Google Scholar] [CrossRef]
- Loyd, B.H.; Gressard, C. Reliability and factorial validity of computer attitute scales. Educ. Psychol. Meas. 1984, 44, 501–505. [Google Scholar] [CrossRef]
- Berberoğlu, G.; Çalıkoğlu, G. Türkçe bilgisayar tutum ölçeğinin yapı geçerliliği. Ank. Univ. J. Fac. Educ. Sci. (JFES) 1991, 24, 841–845. [Google Scholar] [CrossRef] [Green Version]
- Şerefhanoğlu, H.; Nakipoğlu, C.; Gür, H. İlköğretim ikinci kademe öğrencilerinin bilgisayara yönelik tutumlarının çeşitli değişkenler açısından incelenmesi: Balıkesir örneği. İlköğretim Online 2008, 7, 785–799. [Google Scholar]
- García-Peñalvo, F.J.; Mendes, A.J. Exploring the computational thinking effects in pre-university education. Comput. Hum. Behav. 2018, 80, 407–411. [Google Scholar] [CrossRef]
- Çokluk, Ö.; Şekercioğlu, G.; Büyüköztürk, Ş. Sosyal Bilimler İçin Çok Değişkenli İstatistik: SPSS ve LISREL Uygulamaları (5. Baskı); Pegem Akademi: Ankara, Turkey, 2018. [Google Scholar]
- DeVellis, R.F. Scale Development: Theory and Applications (26. Baskı). 2016. Available online: https://books.google.com.tr/books?id=48ACCwAAQBAJ&printsec=frontcover&dq=deVellis&hl=tr&sa=X&redir_esc=y#v=onepage&q=deVellis&f=false (accessed on 13 August 2022).
- Büyüköztürk, Ş.; Kılıç-Çakmak, E.; Akgün, Ö.; Karadeniz, Ş.; Demirel, F. Bilimsel Araştırma Yöntemleri (5. Baskı); Pegem Akademi: Ankara, Turkey, 2010. [Google Scholar]
- Demir, K.; Akpınar, E. Mobil öğrenmeye yönelik tutum ölçeği geliştirme çalışması. Eğitim Teknol. Kuram Uygul. 2016, 6, 59–79. [Google Scholar] [CrossRef] [Green Version]
- Türker, N.K.; Turanlı, N. Matematik eğitimi derslerine yönelik tutum ölçeği geliştirilmesi. Gazi Üniversitesi Gazi Eğitim Fakültesi Derg. 2008, 28, 17–29. [Google Scholar]
- Duatepe, A.; Çilesiz, Ş. Matematik tutum ölçeği geliştirilmesi. Hacet. Üniversitesi Eğitim Fakültesi Derg. 1999, 16, 45–52. [Google Scholar]
- Büyüköztürk, Ş. Sosyal Bilimler İçin Veri Analizi el Kitabı: İstatistik, Araştırma Deseni, SPSS Uygulamaları ve Yorum (26. Baskı); Pegem Akademi: Ankara, Turkey, 2019. [Google Scholar]
- Eşmekaya, E. Faktör analizi (factor analysis). YBS Ansiklopedi 2019, 7, 24–35. [Google Scholar]
- Karaman, H.; Atar, B.; Aktan, D.Ç. Açımlayıcı faktör analizinde kullanılan faktör çıkartma yöntemlerinin karşılaştırılması. Gazi Üniversitesi Gazi Eğitim Fakültesi Derg. 2017, 37, 1173–1193. [Google Scholar] [CrossRef] [Green Version]
- Harrington, D. Confirmatory Factor Analysis; Oxford University Press: Oxford, NY, USA, 2009. [Google Scholar]
- Sümer, N. Yapısal Eşitlik Modelleri: Temel Kavramlar ve Örnek Uygulamalar. Türk Psikol. Yazıları 2000. [Google Scholar]
- Jöreskog, K.G.; Sörbom, D. LISREL 8: Structural equation modeling with the SIMPLIS command language. Sci. Softw. Int. 1993. Available online: https://books.google.com.tr/books?hl=tr&lr=&id=f61i3quHcv4C&oi=fnd&pg=PR15&dq=.+LISREL+8:+Structural+equation+modeling+with+the+SIMPLIS+command+language.+Sci.+Softw.+Int&ots=ujEquj0B3u&sig=_GaEZOf9ngAVLC5WJgLpYDn409g&redir_esc=y#v=onepage&q=.%20LISREL%208%3A%20Structural%20equation%20modeling%20with%20the%20SIMPLIS%20command%20language.%20Sci.%20Softw.%20Int&f=false (accessed on 20 August 2022).
- Brown, T.A. Confirmatory Factor Analysis for Applied Research; Guilford Publications: New York, NY, USA, 2006. [Google Scholar]
- Majid, A.N.; Rohaeti, E. The effect of Context-Based Chemistry learning on student achievement and attitude. Am. J. Educ. Res. 2018, 6, 836–839. [Google Scholar] [CrossRef]
- Ramdhony, D.; Mooneeapen, O.; Dooshila, M.; Kokil, K. A study of university students’ attitude towards integration of information technology in higher education in Mauritius. High. Educ. Q. 2021, 75, 348–363. [Google Scholar] [CrossRef]
- Ardies, J.; De Maeyer, S.; Gijbels, D.; Van Keulen, H. Students attitudes towards technology. Int. J. Technol. Des. Educ. 2015, 25, 43–65. [Google Scholar] [CrossRef]
- Davis, F.D. A Technology Acceptance Model for Empirically Testing New End-User Information Systems: Theory and Results. Doctoral Dissertation, Massachusetts Institute of Technology, Cambridge, MA, USA, 1985. [Google Scholar]
- Davis, F.D.; Bagozzi, R.P.; Warshaw, P.R. Extrinsic and intrinsic motivation to use computers in the workplace. J. Appl. Soc. Psychol. 1992, 22, 111–132. [Google Scholar] [CrossRef]
- Chang, A. UTAUT and UTAUT 2: A review and agenda for future research. Winners 2012, 13, 10–114. [Google Scholar] [CrossRef]
- Mishra, P.; Koehler, M.J. Technological pedagogical content knowledge: A framework for teacher knowledge. Teach. Coll. Rec. 2006, 108, 1017–1054. [Google Scholar] [CrossRef]
- Davis, F.D. Perceived usefulness, perceived ease of use, and user acceptance of information technology. MIS Q. 1989, 13, 319–340. [Google Scholar] [CrossRef] [Green Version]
- Bandura, A. Social Foundations of Thought and Action: A Social Cognitive Theory; Prentice Hall: Englewood Cliffs, NJ, USA, 1986. [Google Scholar]
- Garland, K.J.; Noyes, J.M. Computer attitude scales: How relevant today? Comput. Hum. Behav. 2008, 24, 563–575. [Google Scholar] [CrossRef]
- Woodrow, J.E.J. A Comparison of Four Computer Attitude Scales. J. Educ. Comput. Res. 1991, 7, 165–187. [Google Scholar] [CrossRef]


| Item | Item–Total Correlation | New Cronbach’s Alpha Value When the Item Is Deleted |
|---|---|---|
| I31 | 0.545 | 0.961 |
| I32 | 0.617 | 0.960 |
| I33 | 0.589 | 0.961 |
| I34 | 0.632 | 0.960 |
| I35 | 0.773 | 0.959 |
| I36 | 0.753 | 0.959 |
| I37 | 0.699 | 0.960 |
| I38 | 0.741 | 0.960 |
| I39 | 0.670 | 0.960 |
| I40 | 0.685 | 0.960 |
| I41 | 0.657 | 0.960 |
| I42 | 0.696 | 0.960 |
| I43 | 0.481 | 0.961 |
| I44 | 0.640 | 0.960 |
| I45 | 0.665 | 0.960 |
| I46 | 0.768 | 0.959 |
| I47 | 0.586 | 0.961 |
| I48 | 0.682 | 0.960 |
| I49 | 0.769 | 0.959 |
| I50 | 0.752 | 0.960 |
| I51 | 0.578 | 0.961 |
| I52 | 0.731 | 0.960 |
| I53 | 0.645 | 0.960 |
| I54 | 0.604 | 0.960 |
| I55 | 0.490 | 0.961 |
| I56 | 0.635 | 0.960 |
| I57 | 0.666 | 0.960 |
| I58 | 0.495 | 0.961 |
| I59 | 0.611 | 0.960 |
| I60 | 0.703 | 0.960 |
| I61 | 0.613 | 0.960 |
| I62 | 0.566 | 0.961 |
| I63 | 0.593 | 0.961 |
| Kaiser–Meyer–Olkin Sampling Adequacy | 0.967 | |
|---|---|---|
| Bartlett’s Test of Sphericity | χ2 | 11,472.721 |
| df | 528 | |
| p | 0.000 | |
| Factor | Initial Eigenvalues | Extraction Sums of Squared Loadings | ||||
|---|---|---|---|---|---|---|
| Total | Variance (%) | Cumulative (%) | Total | Variance (%) | Cumulative (%) | |
| 1 | 15.116 | 45.805 | 45.805 | 14.666 | 44.442 | 44.442 |
| 2 | 1.604 | 4.860 | 50.665 | 1.143 | 3.464 | 47.905 |
| 3 | 1.492 | 4.520 | 55.185 | 1.007 | 3.051 | 50.956 |
| 4 | 1.125 | 3.410 | 58.595 | .655 | 1.985 | 52.942 |
| Items | Factors | |||
|---|---|---|---|---|
| 1st Factor | 2nd Factor | 3rd Factor | 4th Factor | |
| I56 | 0.777 | |||
| I57 | 0.730 | |||
| I54 | 0.705 | |||
| I55 | 0.675 | |||
| I52 | 0.663 | |||
| I53 | 0.624 | |||
| I50 | 0.610 | |||
| I49 | 0.593 | |||
| I51 | 0.576 | |||
| I58 | 0.416 | |||
| I32 | 0.918 | |||
| I31 | 0.910 | |||
| I33 | 0.739 | |||
| I37 | 0.476 | |||
| I39 | 0.406 | |||
| I38 | 0.405 | |||
| I62 | 0.780 | |||
| I63 | 0.739 | |||
| I60 | 0.682 | |||
| I48 | 0.679 | |||
| I59 | 0.629 | |||
| I47 | 0.623 | |||
| I41 | 0.439 | |||
| I42 | 0.605 | |||
| I43 | 0.563 | |||
| I44 | 0.552 | |||
| I45 | 0.428 | |||
| Factors | Variance Percent (%) | Total Variance (%) |
|---|---|---|
| 1st Factor: Lack of Interest in the course | 44.322 | 44.322 |
| 2nd Factor: Lack of Willingness toward the course | 5.706 | 50.028 |
| 3rd Factor: Lack of Self-Confidence | 5.140 | 55.168 |
| 4th Factor: Lack of Technological Willingness | 4.062 | 59.231 |
| Items | Rotated Factor-Loading Values | Adjusted Item Total Correlation | |
|---|---|---|---|
| 1st Factor: Lack of Interest in the Course | |||
| M56 | I think I do not need to learn computers for my success in classes. | 0.777 | 0.635 |
| M57 | I do not think I need to follow the developments in information technologies. | 0.730 | 0.661 |
| M54 | I think there will still be jobs that do not require computer skills in the future. | 0.705 | 0.608 |
| M55 | I believe that I can improve myself without learning computers. | 0.675 | 0.493 |
| M52 | I am studying for the Information Technologies and Software course just to pass the course. | 0.663 | 0.724 |
| M53 | I am not interested in publications on information technologies. | 0.624 | 0.644 |
| M50 | I think it is unnecessary to know the subjects of the Information Technologies and Software course other than in understanding certain basic knowledge. | 0.610 | 0.746 |
| M49 | I think that what I have learned in the Information Technologies and Software course is unnecessary for me. | 0.593 | 0.763 |
| M51 | I would like to choose a profession that has the least to do with information technologies. | 0.576 | 0.583 |
| M58 | I do not believe that equipping the classrooms with computers increases success in the course. | 0.416 | 0.492 |
| 2nd Factor: Lack of Willingness toward the Course | |||
| M32 | I get bored in the Information Technologies and Software classes. | 0.918 | 0.612 |
| M31 | I feel restless when entering the Information Technologies and Software classes. | 0.910 | 0.541 |
| M33 | I do not want to do the homework given in the Information Technologies and Software classes. | 0.739 | 0.592 |
| M37 | I would be happy with a reduction in the content taught within the Information Technologies and Software course. | 0.476 | 0.676 |
| M39 | I am interested in other things in the Information Technologies and Software classes. | 0.406 | 0.656 |
| M38 | I do not want to go to school on the days when the Information Technologies and Software classes are taught. | 0.405 | 0.724 |
| 3rd Factor: Lack of Self-Confidence | |||
| M62 | When others talk about computers, I feel inadequate about it. | 0.780 | 0.466 |
| M63 | I hesitate to express my thoughts in the Information Technologies and Software classes. | 0.739 | 0.463 |
| M60 | I think it is difficult to learn the subjects that are taught in the Information Technologies and Software course. | 0.682 | 0.701 |
| M48 | I am afraid of the Information Technologies and Software course exams. | 0.679 | 0.682 |
| M59 | Learning to use a computer requires a lot of time. | 0.629 | 0.608 |
| M47 | I am afraid of not being able to do the activities in the Information Technologies and Software classes. | 0.623 | 0.585 |
| M41 | I do not feel confident in the Information Technologies and Software classes. | 0.439 | 0.645 |
| 4th Factor: Lack of Technological Willingness | |||
| M42 | I do not think I will ever willingly use computers in my life. | 0.605 | 0.682 |
| M43 | I use computers very little in my daily life. | 0.563 | 0.474 |
| M44 | Working with a computer makes me feel uneasy. | 0.552 | 0.630 |
| M45 | Solving problems encountered while using a computer does not appeal to me. | 0.428 | 0.657 |
| Items | Estimates of Factor Loadings | Standard Error |
|---|---|---|
| 1st Factor | ||
| M2 | 0.69 | 0.097 |
| M1 | 0.69 | 0.072 |
| M4 | 0.50 | 0.13 |
| M3 | 0.58 | 0.11 |
| M4 | 0.72 | 0.053 |
| M5 | 0.72 | 0.081 |
| M6 | 0.74 | 0.041 |
| M7 | 0.71 | 0.028 |
| M8 | 0.48 | 0.069 |
| M9 | 0.64 | 0.13 |
| M10 | 0.69 | 0.097 |
| 2nd Factor | ||
| M11 | 0.84 | 0.035 |
| M12 | 0.70 | 0.027 |
| M13 | 0.82 | 0.053 |
| M14 | 0.84 | 0.063 |
| M15 | 0.55 | 0.035 |
| M16 | 0.48 | 0.024 |
| 3rd Factor | ||
| M21 | 0.71 | 0.061 |
| M18 | 0.61 | 0.064 |
| M19 | 0.81 | 0.052 |
| M20 | 0.78 | 0.045 |
| M17 | 0.65 | 0.089 |
| M22 | 0.78 | 0.050 |
| M23 | 0.79 | 0.063 |
| 4th Factor | ||
| M24 | 0.67 | 0.039 |
| M25 | 0.60 | 0.13 |
| M26 | 0.74 | 0.047 |
| M27 | 0.74 | 0.079 |
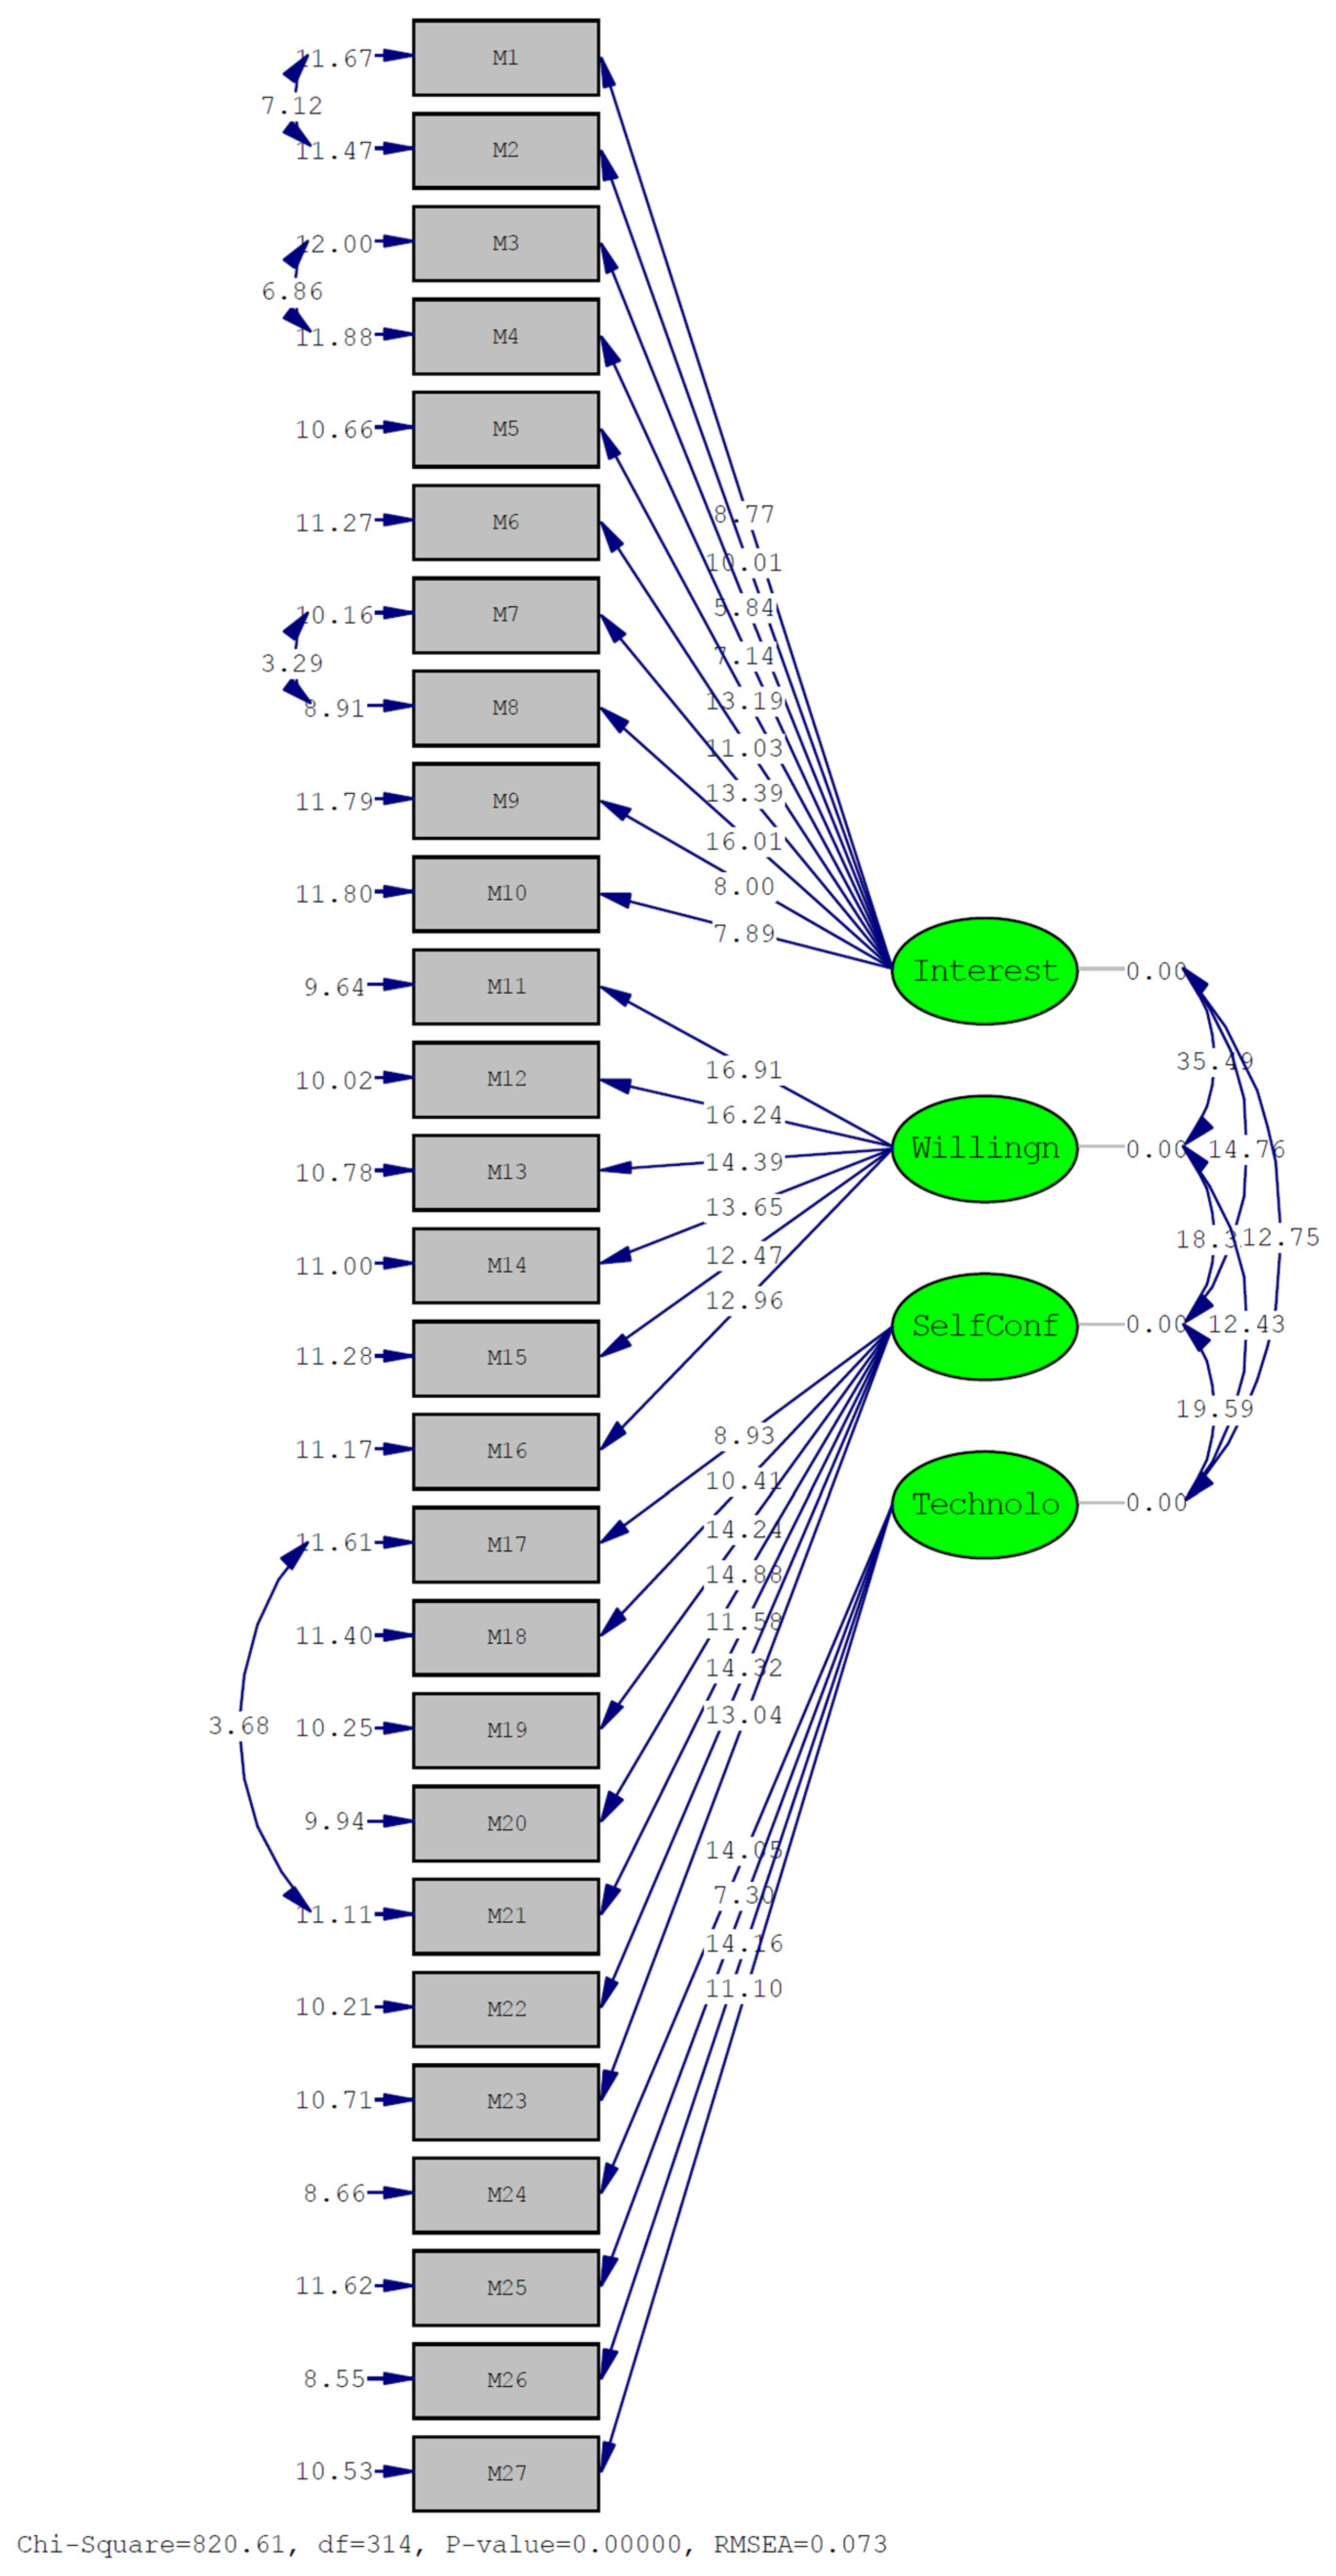
| Fit Indices | Values | Fit |
|---|---|---|
| X2/sd | 2.61 | Perfect Fit |
| RMSEA | 0.073 | Good Fit |
| GFI/AGFI | 0.83/0.80 | Acceptable |
| RMR/SRMR | 0.082/0.063 | Good Fit |
| CFI | 0.96 | Perfect Fit |
| NFI/NNFI | 0.94/0.96 | Good Fit/Perfect Fit |
Disclaimer/Publisher’s Note: The statements, opinions and data contained in all publications are solely those of the individual author(s) and contributor(s) and not of MDPI and/or the editor(s). MDPI and/or the editor(s) disclaim responsibility for any injury to people or property resulting from any ideas, methods, instructions or products referred to in the content. |
© 2023 by the authors. Licensee MDPI, Basel, Switzerland. This article is an open access article distributed under the terms and conditions of the Creative Commons Attribution (CC BY) license (https://creativecommons.org/licenses/by/4.0/).
Share and Cite
Şahin, H.; Yeşiltepe, G.M.; Ellez, A.M.; Eraslan, M.; Karataş, S.; Özçetin, S. The Scale of Attitudes toward the Information Technologies and Software Course: A Scale Development Study. Sustainability 2023, 15, 4074. https://doi.org/10.3390/su15054074
Şahin H, Yeşiltepe GM, Ellez AM, Eraslan M, Karataş S, Özçetin S. The Scale of Attitudes toward the Information Technologies and Software Course: A Scale Development Study. Sustainability. 2023; 15(5):4074. https://doi.org/10.3390/su15054074
Chicago/Turabian StyleŞahin, Harun, Gülden Mediha Yeşiltepe, Ahmet Murat Ellez, Meriç Eraslan, Süleyman Karataş, and Serdar Özçetin. 2023. "The Scale of Attitudes toward the Information Technologies and Software Course: A Scale Development Study" Sustainability 15, no. 5: 4074. https://doi.org/10.3390/su15054074